
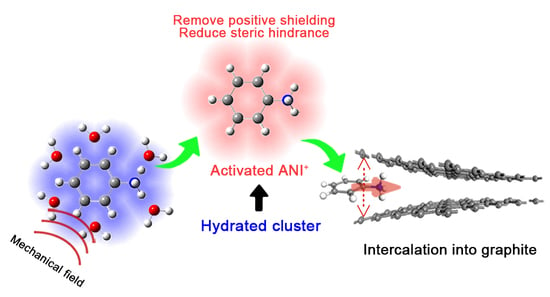
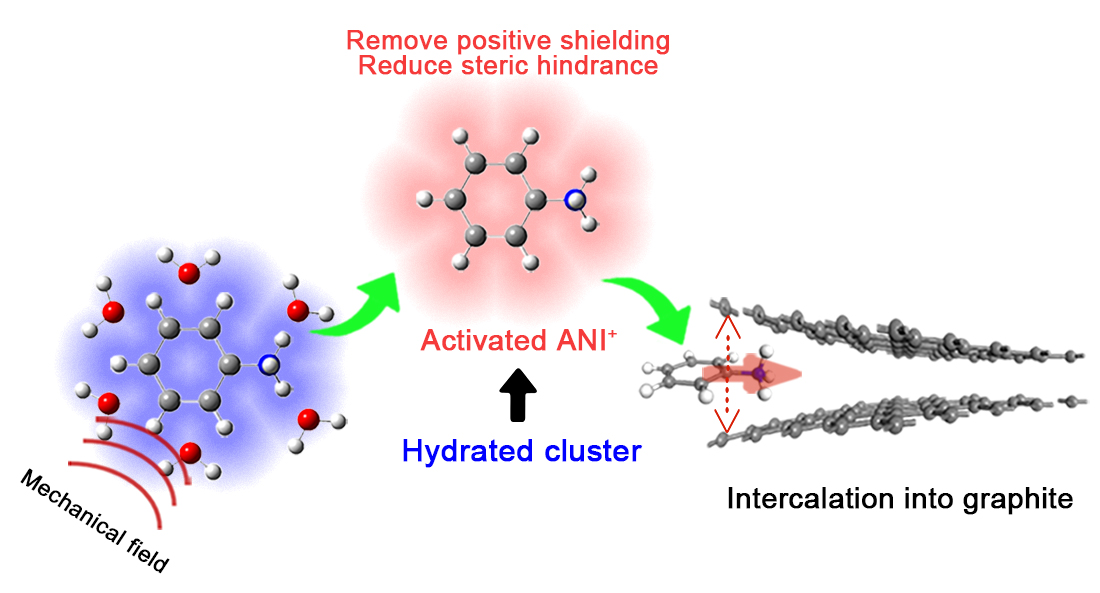
Mechanism for the Intercalation of Aniline Cations into the Interlayers of Graphite


Abstract
:
1. Introduction
2. Materials and Methods
3. Results and Discussion
4. Conclusions
Supplementary Materials
Author Contributions
Funding
Institutional Review Board Statement
Informed Consent Statement
Data Availability Statement
Acknowledgments
Conflicts of Interest
References
- Jishi, R.A.; Dresselhaus, M.S. Superconductivity in Graphite Intercalation Compounds. Phys. Rev. B 1992, 45, 12465–12469. [Google Scholar] [CrossRef] [PubMed]
- Zhao, J.; Dumont, J.H.; Martinez, U.; Macossay, J.; Artyushkova, K.; Atanassov, P.; Gupta, G. Graphite Intercalation Compounds Derived by Green Chemistry as Oxygen Reduction Reaction Catalysts. ACS Appl. Mater. Interfaces 2020, 12, 42678–42685. [Google Scholar] [CrossRef] [PubMed]
- Cheng, H.; Sha, X.; Chen, L.; Cooper, A.C.; Foo, M.-L.; Lau, G.C.; Bailey, W.H., III; Pez, G.P. An Enhanced Hydrogen Adsorption Enthalpy for Fluoride Intercalated Graphite Compounds. J. Am. Chem. Soc. 2009, 131, 17732–17733. [Google Scholar] [CrossRef]
- Xu, J.; Dou, Y.; Wei, Z.; Ma, J.; Deng, Y.; Li, Y.; Liu, H.; Dou, S. Recent Progress in Graphite Intercalation Compounds for Rechargeable Metal (Li, Na, K, Al)-Ion Batteries. Adv. Sci. 2017, 4, 1700146. [Google Scholar] [CrossRef] [PubMed] [Green Version]
- Dresselhaus, M.S.; Dresselhaus, G. Intercalation Compounds of Graphite. Adv. Phys. 2002, 51, 1–186. [Google Scholar] [CrossRef]
- Enoki, T.; Suzuki, M.; Endo, M. Graphite Intercalation Compounds and Applications; Oxford University Press: Oxford, UK, 2003. [Google Scholar]
- Luo, Q.; Wu, Y.-Y.; Qiu, W.; Huang, H.; Pei, S.; Lambert, P.; Hui, D. Improving Flexural Strength of Uhpc with Sustainably Synthesized Graphene Oxide. Nanotechnol. Rev. 2021, 10, 754–767. [Google Scholar] [CrossRef]
- Park, K.H.; Kim, B.G.; Song, S.H. Synergistic Effect of a Defect-Free Graphene Nanostructure as an Anode Material for Lithium Ion Batteries. Nanomaterials 2020, 10, 9. [Google Scholar] [CrossRef] [PubMed] [Green Version]
- do Nascimento, G.M.; Constantino, V.R.L.; Landers, R.; Temperini, M.L.A. Aniline Polymerization into Montmorillonite Clay: A Spectroscopic Investigation of the Intercalated Conducting Polymer. Macromolecules 2004, 37, 9373–9385. [Google Scholar] [CrossRef]
- Sun, Y.; Mei, J.; Hu, H.; Ying, J.; Zhou, W.; Zhao, X.; Peng, S. In-Situ Polymerization of Exfoliated Structure PA6/Organo-Clay Nanocomposites. Rev. Adv. Mater. Sci. 2020, 59, 434–440. [Google Scholar] [CrossRef]
- Anasori, B.; Lukatskaya, M.R.; Gogotsi, Y. 2D Metal Carbides and Nitrides (MXenes) for Energy Storage. Nat. Rev. Mater. 2017, 2, 16098. [Google Scholar] [CrossRef]
- Dai, Y.; Liu, C.; Bai, Y.; Kong, Q.; Pang, H. Framework Materials for Supercapacitors. Nanotechnol. Rev. 2022, 11, 1005–1046. [Google Scholar] [CrossRef]
- Xia, Z.G.; Christodoulou, C.; Nardi, M.V.; Koch, N.; Treossi, E.; Bellani, V.; Pezzini, S.; Corticelli, F.; Morandi, V.; Zanelli, A.; et al. Synergic Exfoliation of Graphene with Organic Molecules and Inorganic Ions for the Electrochemical Production of Flexible Electrodes. ChemPlusChem 2014, 79, 439–446. [Google Scholar] [CrossRef]
- Read, J.A. In-Situ Studies on the Electrochemical Intercalation of Hexafluorophosphate Anion in Graphite with Selective Cointercalation of Solvent. J. Phys. Chem. C 2015, 119, 8438–8446. [Google Scholar] [CrossRef]
- Rothermel, S.; Meister, P.; Schmuelling, G.; Fromm, O.; Meyer, H.-W.; Nowak, S.; Winter, M.; Placke, T. Dual-Graphite Cells Based on the Reversible Intercalation of Bis(Trifluoromethanesulfonyl)Imide Anions from an Ionic Liquid Electrolyte. Energy Environ. Sci. 2014, 7, 3412–3423. [Google Scholar] [CrossRef] [Green Version]
- Maluangnont, T.; Gotoh, K.; Fujiwara, K.; Lerner, M.M. Cation-Directed Orientation of Amines in Ternary Graphite Intercalation Compounds. Carbon 2011, 49, 1040–1042. [Google Scholar] [CrossRef]
- Tasaki, K. Density Functional Theory Study on Structural and Energetic Characteristics of Graphite Intercalation Compounds. J. Phys. Chem. C 2014, 118, 1443–1450. [Google Scholar] [CrossRef]
- Sirisaksoontorn, W.; Adenuga, A.A.; Remcho, V.T.; Lerner, M.M. Preparation and Characterization of a Tetrabutylammonium Graphite Intercalation Compound. J. Am. Chem. Soc. 2011, 133, 12436–12438. [Google Scholar] [CrossRef]
- Li, B.; Xu, M.; Li, T.; Li, W.; Hu, S. Prop-1-Ene-1,3-Sultone as Sei Formation Additive in Propylene Carbonate-Based Electrolyte for Lithium Ion Batteries. Electrochem. Commun. 2012, 17, 92–95. [Google Scholar] [CrossRef]
- Gouda, K.; Bhowmik, S.; Das, B. A Review on Allotropes of Carbon and Natural Filler-Reinforced Thermomechanical Properties of Upgraded Epoxy Hybrid Composite. Rev. Adv. Mater. Sci. 2021, 60, 237–275. [Google Scholar] [CrossRef]
- Chen, X.; Meng, F.; Zhou, Z.; Tian, X.; Shan, L.; Zhu, S.; Xu, X.; Jiang, M.; Wang, L.; Hui, D.; et al. One-Step Synthesis of Graphene/Polyaniline Hybrids by in Situ Intercalation Polymerization and Their Electromagnetic Properties. Nanoscale 2014, 6, 8140–8148. [Google Scholar] [CrossRef]
- Shan, L.; Chen, X.; Tian, X.; Chen, J.; Zhou, Z.; Jiang, M.; Xu, X.; Hui, D. Fabrication of Polypyrrole/Nano-Exfoliated Graphite Composites by in Situ Intercalation Polymerization and Their Microwave Absorption Properties. Compos. Part B-Eng. 2015, 73, 181–187. [Google Scholar] [CrossRef]
- Meng, F.; Huang, F.; Guo, Y.; Chen, J.; Chen, X.; Hui, D.; He, P.; Zhou, X.; Zhou, Z. In Situ Intercalation Polymerization Approach to Polyamide-6/Graphite Nanoflakes for Enhanced Thermal Conductivity. Compos. Part B-Eng. 2017, 117, 165–173. [Google Scholar] [CrossRef]
- Guo, Y.; Li, J.; Meng, F.; Wei, W.; Yang, Q.; Li, Y.; Wang, H.; Peng, F.; Zhou, Z. Hybridization-Induced Polarization of Graphene Sheets by Intercalation-Polymerized Polyaniline toward High Performance of Microwave Absorption. ACS Appl. Mater. Interfaces 2019, 11, 17100–17107. [Google Scholar] [CrossRef]
- Guo, Y.; Peng, F.; Wang, H.; Huang, F.; Meng, F.; Hui, D.; Zhou, Z. Intercalation Polymerization Approach for Preparing Graphene/Polymer Composites. Polymers 2018, 10, 61. [Google Scholar] [CrossRef] [Green Version]
- Zhang, J.; Wang, M.; Li, W.; Wei, W.; Li, J.; Jiang, M.; Wang, Y.; Zhou, Z. Tbah/Urea/H2O Solvent for Room Temperature Wet-Spinning of Cellulose and Optimization of Drawing Process. Cellulose 2019, 26, 6959–6977. [Google Scholar] [CrossRef]
- Frisch, M.J.; Trucks, G.W.; Schlegel, H.B.; Scuseria, G.E.; Robb, M.A.; Cheeseman, J.R.; Scalmani, G.; Barone, V.; Mennucci, B.; Petersson, G.A.; et al. Gaussian; Version 16; Gaussian Inc.: Wallingford, CT, USA, 2010. [Google Scholar]
- Lu, T.; Chen, F. Multiwfn: A Multifunctional Wavefunction Analyzer. J. Comput. Chem. 2012, 33, 580–592. [Google Scholar] [CrossRef]
- Humphrey, W.; Dalke, A.; Schulten, K. VMD: Visual Molecular Dynamics. J. Mol. Graph. 1996, 14, 33–38. [Google Scholar] [CrossRef]
- Abraham, M.J.; Murtola, T.; Schulz, R.; Páll, S.; Smith, J.C.; Hess, B.; Lindahl, E. Gromacs: High Performance Molecular Simulations through Multi-Level Parallelism from Laptops to Supercomputers. SoftwareX 2015, 1–2, 19–25. [Google Scholar] [CrossRef] [Green Version]
- Schmid, N.; Eichenberger, A.P.; Choutko, A.; Riniker, S.; Winger, M.; Mark, A.E.; van Gunsteren, W.F. Definition and Testing of the Gromos Force-Field Versions 54A7 and 54B7. Eur. Biophys. J. 2011, 40, 843. [Google Scholar] [CrossRef]
- Berendsen, H.J.C.; Grigera, J.R.; Straatsma, T.P. The Missing Term in Effective Pair Potentials. J. Phys. Chem. 1987, 91, 6269–6271. [Google Scholar] [CrossRef]
- Stewart, J.C.; Matthew, D.S.; Chris, J.P.; Phil, J.H.; Matt, I.J.P.; Keith, R.; Mike, C.P. First Principles Methods Using Castep. Z. Krist. 2005, 220, 567–570. [Google Scholar]
- Perdew, J.P.; Burke, K.; Ernzerhof, M. Generalized Gradient Approximation Made Simple. Phys. Rev. Lett. 1996, 77, 3865–3868. [Google Scholar] [CrossRef] [PubMed] [Green Version]
- Grimme, S.; Antony, J.; Ehrlich, S.; Krieg, H. A Consistent and Accurate Ab Initio Parametrization of Density Functional Dispersion Correction (DFT-D) for the 94 Elements H-Pu. J. Chem. Phys. 2010, 132, 154104. [Google Scholar] [CrossRef] [Green Version]
- Dimiev, A.M.; Ceriotti, G.; Behabtu, N.; Zakhidov, D.; Pasquali, M.; Saito, R.; Tour, J.M. Direct Real-Time Monitoring of Stage Transitions in Graphite Intercalation Compounds. ACS Nano 2013, 7, 2773–2780. [Google Scholar] [CrossRef]
- Dimiev, A.M.; Bachilo, S.M.; Saito, R.; Tour, J.M. Reversible Formation of Ammonium Persulfate/Sulfuric Acid Graphite Intercalation Compounds and Their Peculiar Raman Spectra. ACS Nano 2012, 6, 7842–7849. [Google Scholar] [CrossRef]
- Ogurtsov, N.A.; Noskov, Y.V.; Bliznyuk, V.N.; Ilyin, V.G.; Wojkiewicz, J.-L.; Fedorenko, E.A.; Pud, A.A. Evolution and Interdependence of Structure and Properties of Nanocomposites of Multiwall Carbon Nanotubes with Polyaniline. J. Phys. Chem. C 2016, 120, 230–242. [Google Scholar] [CrossRef]
- Chen, X.; Chen, J.; Meng, F.; Shan, L.; Jiang, M.; Xu, X.; Lu, J.; Wang, Y.; Zhou, Z. Hierarchical Composites of Polypyrrole/Graphene Oxide Synthesized by in Situ Intercalation Polymerization for High Efficiency and Broadband Responses of Electromagnetic Absorption. Compos. Sci. Technol. 2016, 127, 71–78. [Google Scholar] [CrossRef]


| Description | Components |
|---|---|
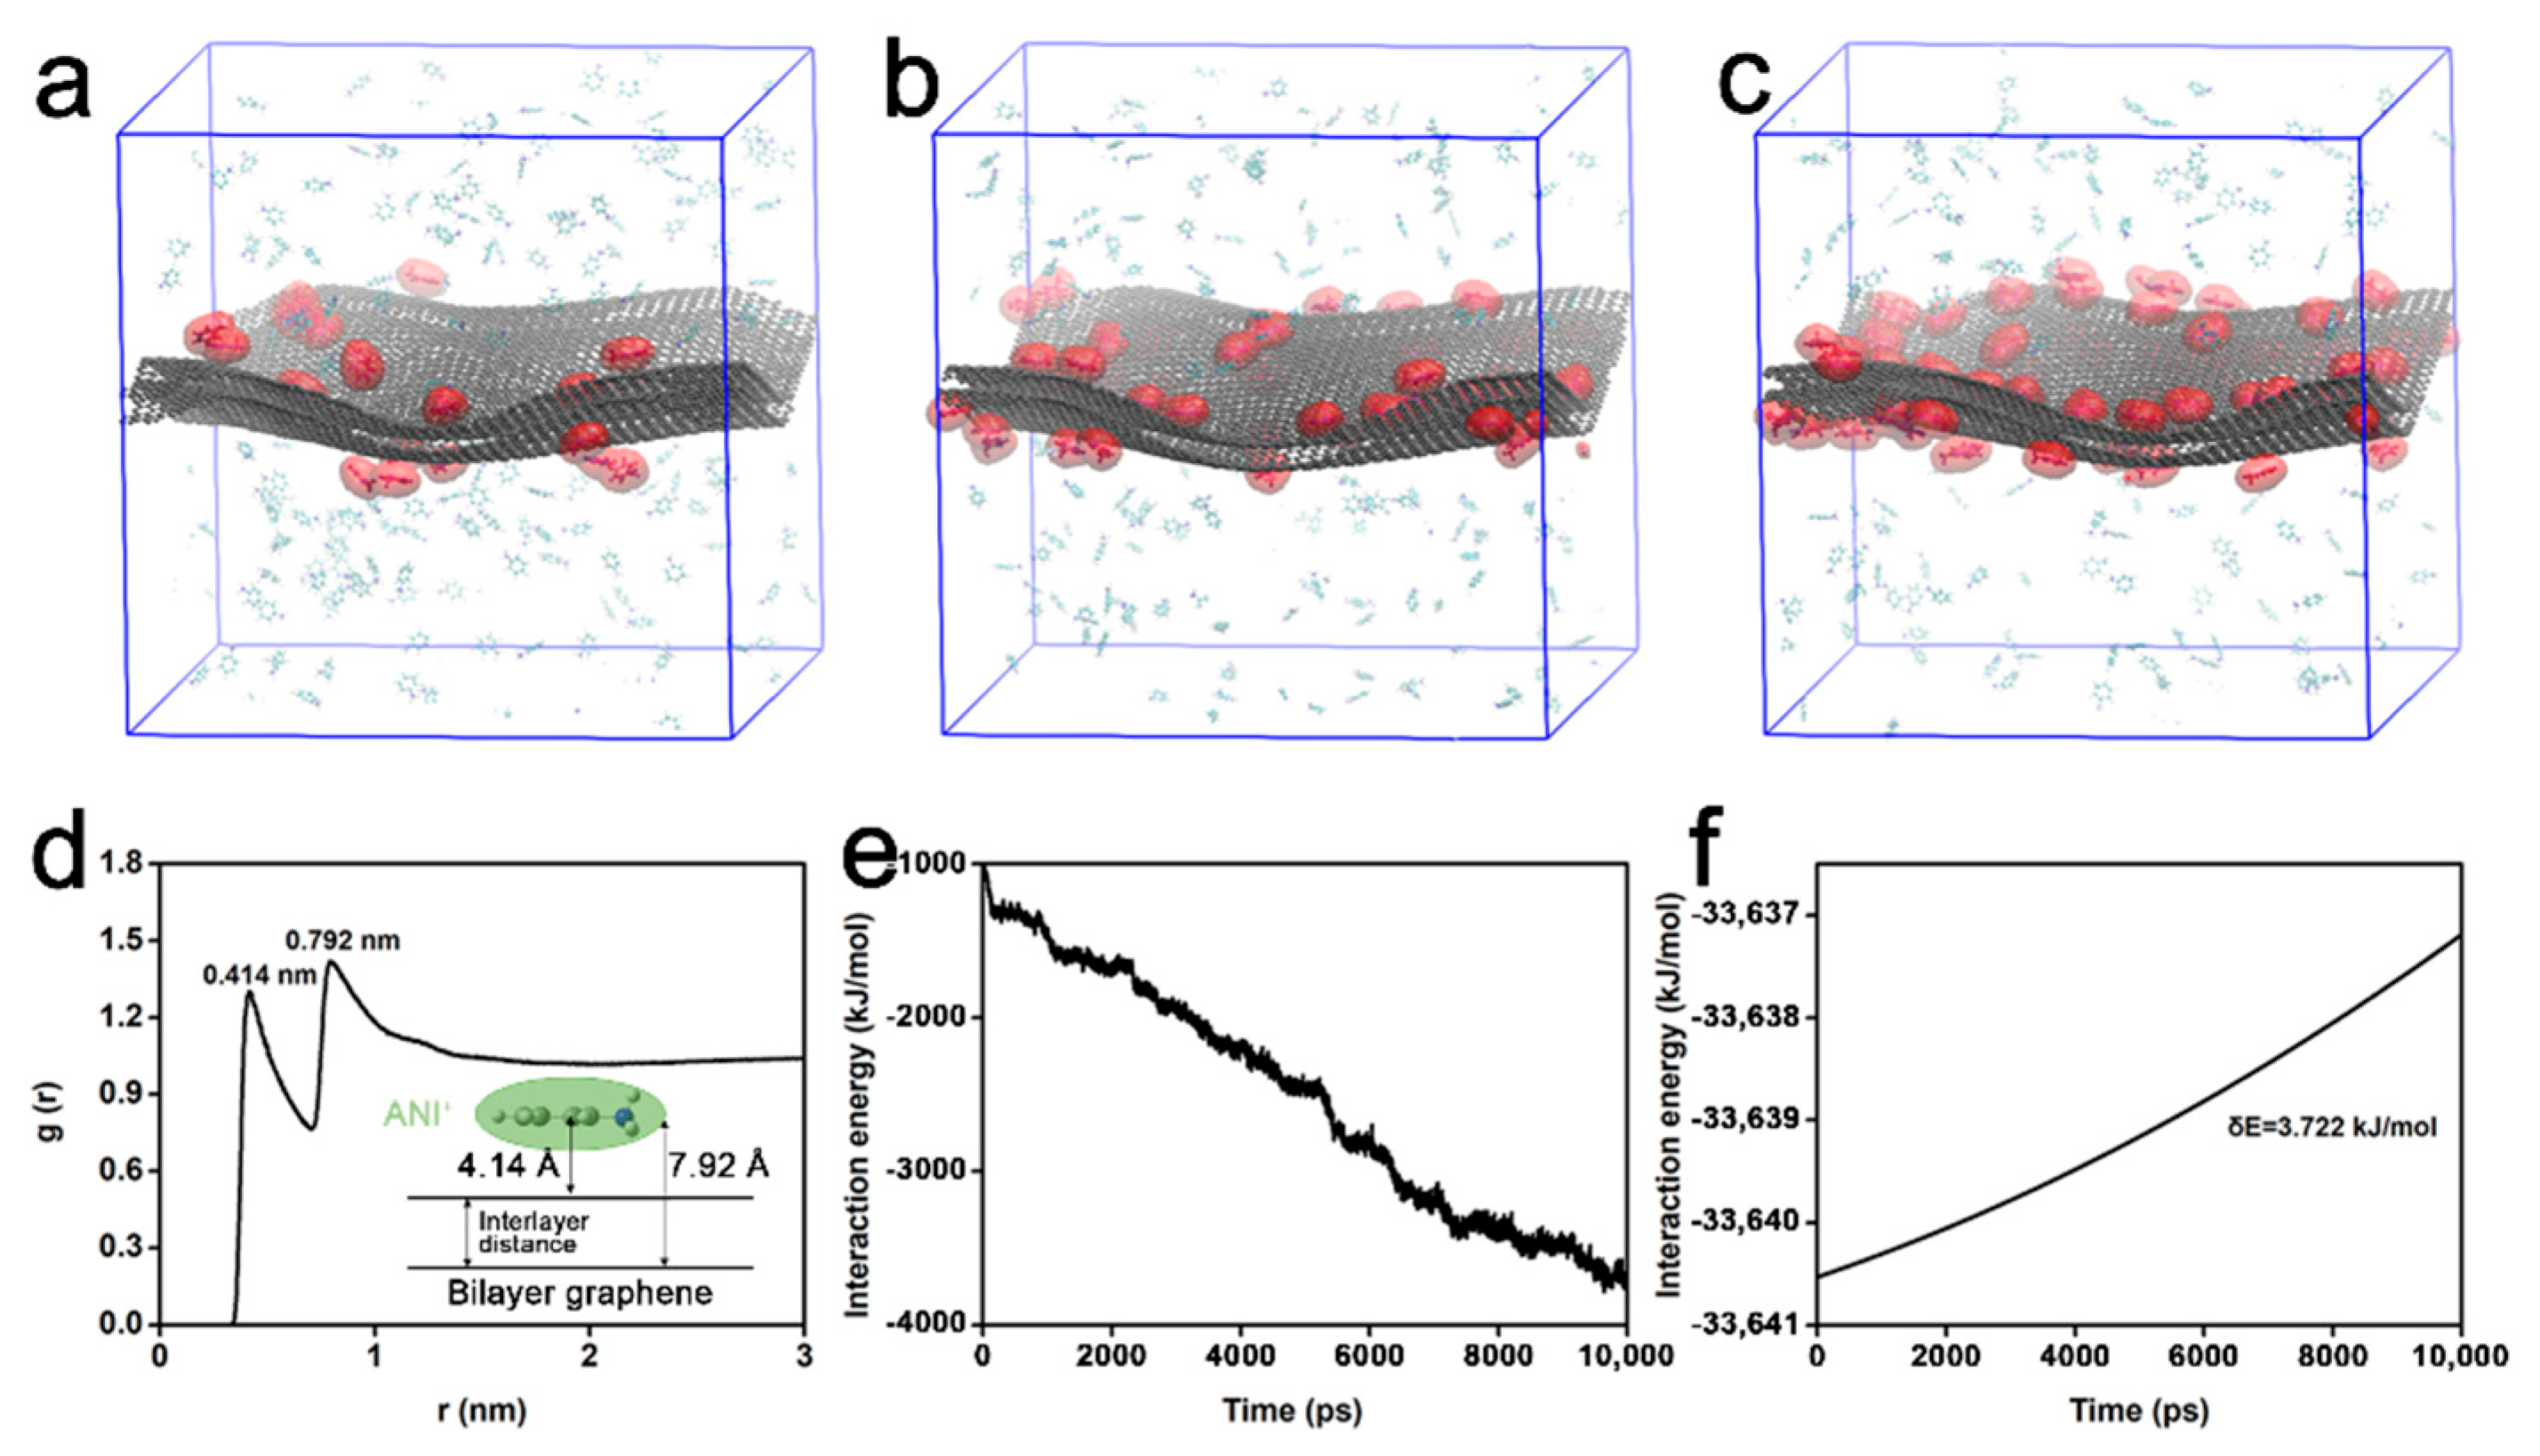
| Adsorption model | Cube box of 1.07 × 10.21 × 10.00 nm comprising a piece of periodic bilayer graphene, 200 ANI+, 200 Cl−, and 29,609 H2O. |
| Intercalation model | Cube box of 6.00 × 6.00 × 3.00 nm comprising a piece of nonperiodic bilayer graphene (4.91 × 3.26 × 0.34 nm), 40 ANI+, 40Cl−, and 2697 H2O. |
| ANI+ solution | Cube box of 5.00 × 5.00 × 5.00 nm comprising 100 ANI+, 100 Cl−, and 3369 H2O. |
Publisher’s Note: MDPI stays neutral with regard to jurisdictional claims in published maps and institutional affiliations. |
© 2022 by the authors. Licensee MDPI, Basel, Switzerland. This article is an open access article distributed under the terms and conditions of the Creative Commons Attribution (CC BY) license (https://creativecommons.org/licenses/by/4.0/).
Share and Cite
Guo, Y.; Li, Y.; Wei, W.; Su, J.; Li, J.; Shang, Y.; Wang, Y.; Xu, X.; Hui, D.; Zhou, Z. Mechanism for the Intercalation of Aniline Cations into the Interlayers of Graphite. Nanomaterials 2022, 12, 2486. https://0-doi-org.brum.beds.ac.uk/10.3390/nano12142486
Guo Y, Li Y, Wei W, Su J, Li J, Shang Y, Wang Y, Xu X, Hui D, Zhou Z. Mechanism for the Intercalation of Aniline Cations into the Interlayers of Graphite. Nanomaterials. 2022; 12(14):2486. https://0-doi-org.brum.beds.ac.uk/10.3390/nano12142486
Chicago/Turabian StyleGuo, Yifan, Ying Li, Wei Wei, Junhua Su, Jinyang Li, Yanlei Shang, Yong Wang, Xiaoling Xu, David Hui, and Zuowan Zhou. 2022. "Mechanism for the Intercalation of Aniline Cations into the Interlayers of Graphite" Nanomaterials 12, no. 14: 2486. https://0-doi-org.brum.beds.ac.uk/10.3390/nano12142486