Article

Promotional Effects on the Catalytic Activity of Co-Fe Alloy Supported on Graphitic Carbon for CO2 Hydrogenation

1
Department of Organic Chemistry and Biochemistry and Catalysis, Faculty of Chemistry, University of Bucharest, Bdul Regina Elisabeta 4-12, 030016 Bucharest, Romania
2
Instituto Universitario de Tecnología Química, Universitat Politècnica de València-Consejo Superior de Investigaciones Científicas, Av. De los Naranjos s/n, 46022 Valencia, Spain
3
BASF SE, 67056 Ludwigshafen am Rhein, Germany
4
Departamento de Química, Universitat Politècnica de València, Av. De los Naranjos s/n, 46022 Valencia, Spain
5
School of Chemistry, Madurai Kamaraj University, Madurai 625021, Tamil Nadu, India
*
Authors to whom correspondence should be addressed.
These authors contributed equally to this work.
Nanomaterials 2022, 12(18), 3220; https://0-doi-org.brum.beds.ac.uk/10.3390/nano12183220
Submission received: 25 July 2022 / Revised: 8 September 2022 / Accepted: 13 September 2022 / Published: 16 September 2022

Abstract

:
Starting from the reported activity of Co-Fe nanoparticles wrapped onto graphitic carbon (Co-Fe@C) as CO2 hydrogenation catalysts, the present article studies the influence of a series of metallic (Pd, Ce, Ca, Ca, and Ce) and non-metallic (S in various percentages and S and alkali metals) elements as Co-Fe@C promoters. Pd at 0.5 wt % somewhat enhances CO2 conversion and CH4 selectivity, probably due to H2 activation and spillover on Co-Fe. At similar concentrations, Ce does not influence CO2 conversion but does diminish CO selectivity. A 25 wt % Fe excess increases the Fe-Co particle size and has a detrimental effect due to this large particle size. The presence of 25 wt % of Ca increases the CO2 conversion and CH4 selectivity remarkably, the effect being attributable to the CO2 adsorption capacity and basicity of Ca. Sulfur at a concentration of 2.1% or higher acts as a strong poison, decreasing CO2 conversion and shifting selectivity to CO. The combination of S and alkali metals as promoters maintain the CO selectivity of S but notably increase the CO2 conversion. Overall, this study shows how promoters and poisons can alter the catalytic activity of Co/Fe@C catalysts, changing from CH4 to CO. It is expected that further modulation of the activity of Co/Fe@C catalysts can serve to drive the activity and selectivity of these materials to any CO2 hydrogenation products that are wanted.

1. Introduction

Within the context of decreasing CO2 emissions into the atmosphere and the valorization of this gas as feedstock, there is an increasing interest in developing efficient catalysts for CO2 hydrogenation to hydrocarbons [1,2,3,4,5,6,7,8,9,10,11]. In a series of papers, we have been reporting that Co-Fe alloy nanoparticles (NPs) wrapped onto defective N-doped graphene [Co-Fe@(N)C] are suitable catalysts that, by fine-tuning, can exhibit selectivity toward the formation of methane [12], the reverse water gas shift [13], or the formation of a significant percentage of C2+ products [14]. It seems that, in these types of catalysts, particle size is one key parameter that determines product selectivity.
Continuing with this line of research, it is well known that the presence of certain elements, generally known as promoters, can determine the performance of catalysts in CO2 and CO hydrogenation [15,16,17,18,19,20,21,22,23,24,25,26,27]. Specifically, alkali metals, such as K and Cs, can alter the activity of hydrogenation catalysts by altering the adsorption properties and surface basicity, among other effects [20,25,28,29,30]. In this context, it would be of interest to establish what effects the different promoters have on the catalytic activity of Co-Fe alloy NPs wrapped onto graphitic carbon, with the long-term goal of finding even more active, selective, and stable catalysts.
In recent years, the use of graphene-based solids as catalysts for CO2 hydrogenation has attracted much attention [31]. For example, a Pd-embedded g-C3N4/reduced graphene oxide (rGO) aerogel (Pd-g-C3N4/RGOA) photocatalyst was reported for the reduction of CO2 to CH4 [32]. In another precedent, the influence of nickel over rGO was studied in the hydrogenation of CO2 to CH4 [33]. Furthermore, a three-dimensional cobalt nanocrystal supported over rGO was also tested for the CO2 hydrogenation reaction [34]. Iron-based catalysts with honeycomb-structured graphene as the support and potassium as the promoter were also employed as catalysts for the direct hydrogenation of CO2 to light olefins [35].
With this objective in mind, the present study focuses on the influence that metallic (Na, K, Ca, Pd and Ce) and non-metallic (S) promoters exert on the performance of Co-Fe alloy NPs wrapped around graphitic carbon, either with N-doping [Co-Fe@(N)C] or without N-doping (Co-Fe@C) as CO2 hydrogenation catalysts. The promoters and their concentrations were selected based on precedents reporting the influence of alkali [36], alkali-earth [37,38], and noble metals [39,40,41] on hydrogenation catalysts, as well as the poisoning effect of S on the Fischer-Tropsch catalysts [42,43,44]. Evidence will be presented showing a significant influence of the promoters on the performance of Co-Fe@(N)C and Co-Fe@C catalysts, driving the selectivity toward CH4 or the reverse water gas shift.

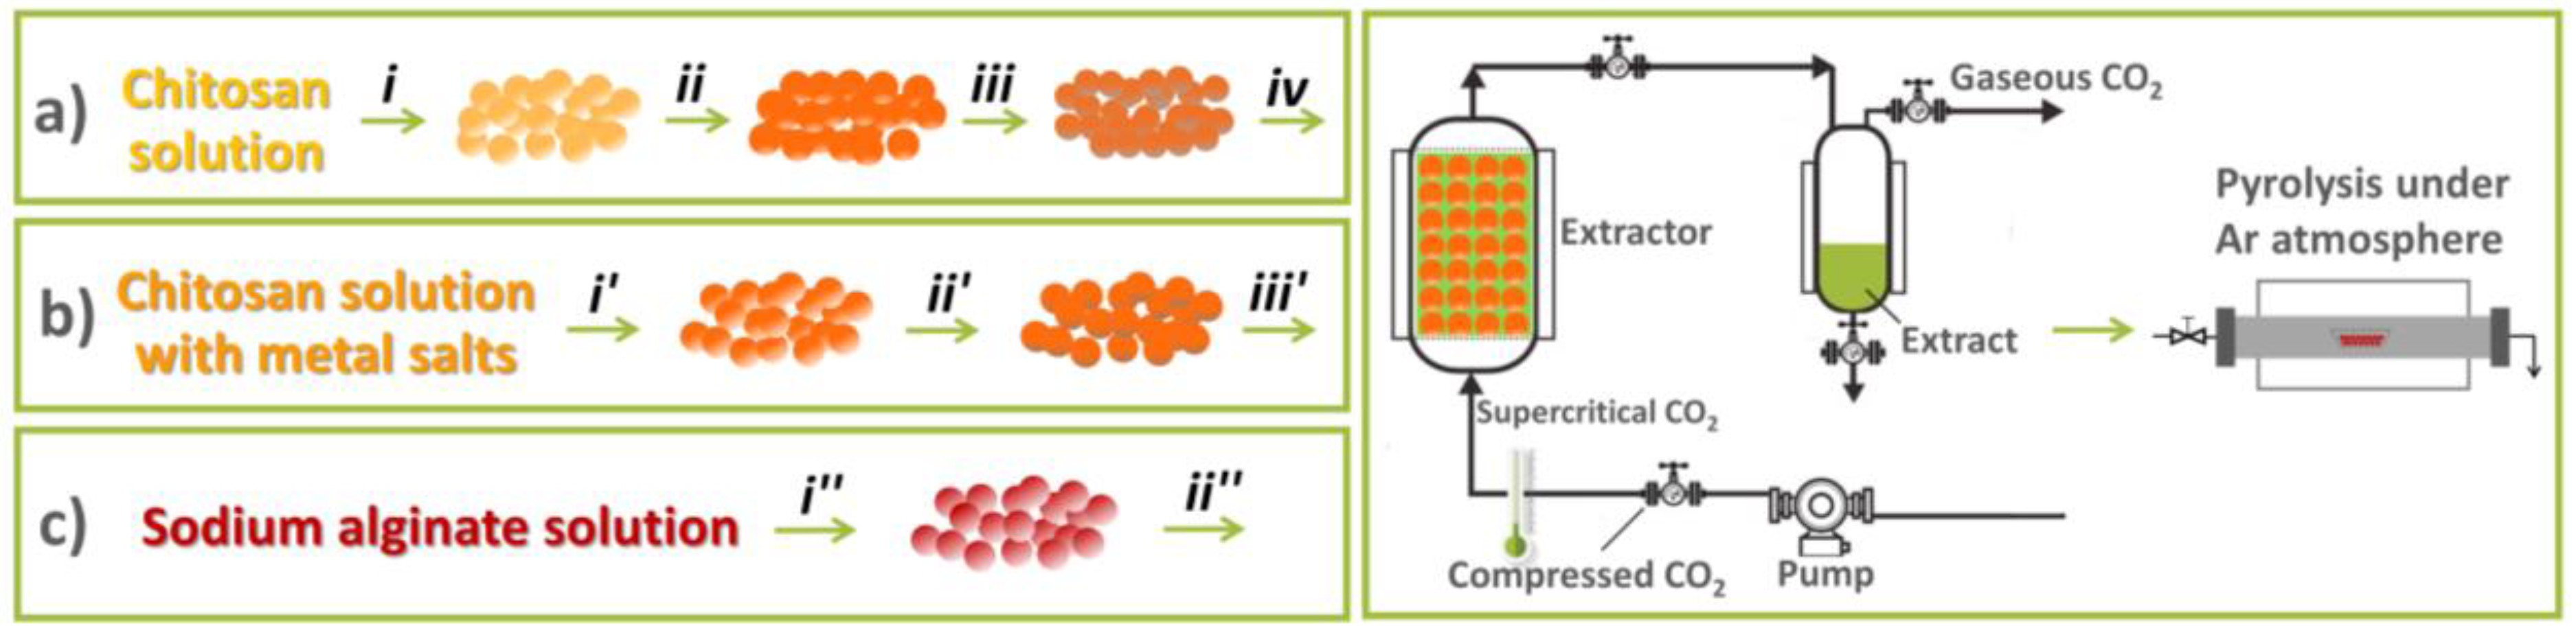
2. Materials and Methods

Synthesis of Co-Fe@(N)C and Co-Fe@C

Commercially available reagents were purchased from Sigma Aldrich (Merck KGaA, Darmstadt, Germany) and used without further purification.
Route (a): Samples 1 and 2 were prepared following route (a). Briefly, 1000 mg chitosan and 625 μL acetic acid were added into 50 mL milli-Q water. After the chitosan dissolved completely, the solution was introduced dropwise with a syringe (0.8 mm diameter needle) into an aqueous solution of sodium hydroxide (500 mL; 2M). The gel microspheres were formed and immersed in NaOH solution for 2 h, then profusely washed with distilled water until the pH = 7. Then the resulting hydrogel microspheres were washed in a series of ethanol/water baths with an increasing concentration of ethanol (10, 30, 50, 70, 90, and 100 volume percent, respectively) for 15 min in each bath and then immersed in 100 mL Co-Fe-ethanol or Co-Fe-Pd-ethanol solution with different concentrations for 2d with slow stirring. After that, the microspheres were reduced with 375 mL 0.05 M NaBH4-ethanol solution for 5 h, after which it was exchanged for supercritical CO2. The resulting microspheres were pyrolyzed under an Ar flow (200 mL/min), increasing the temperature at a rate of 2 °C/min up to 200 °C for 2 h, then increasing the temperature to 900 °C for 2 h. The preparation of samples 8–11 was performed following route (a) with an additional thiourea impregnation (375 mL) step in EtOH after the NaBH4 reduction and before supercritical CO2 drying and pyrolysis.
Route (b): Samples 3 and 4 were prepared following route (b). Briefly, 1000 mg chitosan, 625 μL acetic acid, and a certain amount of Co(OAc)2 and Fe(OAc)2 or Ce(OAc)3·xH2O were added to 50 mL milli-Q water. After the chitosan dissolved completely, the solution was introduced dropwise with a syringe (0.8 mm diameter needle) into an aqueous solution of sodium hydroxide (500 mL; 0.1M). The gel microspheres were formed and then immersed in NaOH solution for 1 h, then profusely washed with distilled water to attain a pH = 7. Then the resulting hydrogel microspheres were washed in a series of ethanol/water baths with an increasing concentration of ethanol (10, 30, 50, 70, 90, and 100 volume percent, respectively) for 15 min in each bath. After that, the microspheres were reduced with 500 mL NaBH4-ethanol solution (0.05M) overnight and exchanged for supercritical CO2. The resulting microspheres were pyrolyzed under an Ar flow (200 mL/min), increasing the temperature at a rate of 2 °C/min, then increasing to 200 °C for 2 h, and finally increasing to 900 °C for 2 h.
Route (c): Samples 5–7 were prepared following route (c). Following the method for samples 5 and 7, 1000 mg sodium alginate was added to 50 mL milli-Q water. After the sodium alginate dissolved completely, the solution was introduced dropwise, with a syringe (0.8 mm diameter needle), into 100 mL of an aqueous solution of CoCl2·6H2O and FeCl2 or Ce(OAc)3·xH2O. The gel microspheres were formed and immersed in the solution overnight. Then, the resulting hydrogel microspheres were washed in a series of ethanol/water baths with an increasing concentration of ethanol (10, 30, 50, 70, 90, and 100 volume percent, respectively) for 15 min in each bath and then exchanged for supercritical CO2. Unlike samples 5 and 7, sample 6 was prepared by precipitating alginate acid aqueous solution (30 mL; 2 g alginic acid; 2.5 ml ammonia) into the CaCl2 aqueous solution (4 g; 100 mL), then profusely washed with distilled water. Then, the resulting hydrogel microspheres were washed in a series of ethanol/water baths with an increasing concentration of ethanol (10, 30, 50, 70, 90 and 100 volume percent, respectively) for 15 min in each bath. Afterward, the alcogel microspheres were immersed in Fe-Co-ethanol solution for 1 day, then washed with anhydrous ethanol and exchanged for supercritical CO2. The resulting microspheres were pyrolyzed under Ar flow (200 mL/min), increasing the temperature at a rate of 2 °C/min up to 200 °C for 2 h and then to 900 °C for 2 h.
The detailed procedures of catalyst characterization and catalytic testing are reported in the Supplementary Materials.

3. Results

The series of Co-Fe@(N)C and Co-Fe@C catalysts modified with the promoters under study are listed in Table 1, which also includes the relevant analytical data for these samples. Samples 1, 3, and 5 have been previously reported by us in previous studies [12,14]. The other samples appearing in Table 1 serve to determine the influence of promoters (Pd, Ce, Ca) or poison (S) on their activity and selectivity. The reader is referred to the published literature for a more extensive characterization of samples 1, 3, and 5 [12,13,14]. These materials were prepared following three different routes. The need for different routes in the preparation of the series of materials was derived from the use of two different graphitic carbon precursors, chitosan/alginate, and the need to have better control of particle size distribution. In two of the routes, the carbon precursor was chitosan, rendering N-doped graphitic carbon [Co-Fe@(N)C], while alginate was the precursor in the third route for the preparation of Co-Fe alloy NPs on defective graphitic carbons that do not contain the N element (Co-Fe@C). Chitosan, being a polymer of glucosamine and with a 6.25 wt % of Nm acts in the pyrolysis as a simultaneous source of C and N, while alginate is a copolymer of D-manuronic and L-guluronic acids, condensed through a glycosidic β-(1,4) bond, and does not contain N in its composition. Scheme 1 illustrates the three preparation procedures.
In route (a), chitosan microspheres of millimetric size were first obtained as hydrogel by the precipitation of chitosan dissolved in acid water into a strong basic NaOH aqueous solution. The resulting chitosan hydrogel was converted into alcogel by a gradual exchange of H2O with EtOH. Then, Co2+ and Fe2+ salts were adsorbed onto chitosan beads in EtOH, before chemical reduction with NaBH4 and subsequent supercritical CO2 drying, followed by pyrolysis. It has been previously observed that NaBH4 reduction of Co2+ and Fe2+ adsorbed on chitosan renders after the pyrolysis of Co-Fe alloy NPs of narrow particle distribution, in which the average particle dimension can be controlled to a certain extent in the range from 8 to 17 nm [14].
Route (b) adsorbs Co2+ and Fe2+ salts in an acid aqueous chitosan solution, before the formation of the millimetric beads and the exchange of H2O by EtOH, supercritical CO2 drying, and pyrolysis. While this route does not use a chemical reducing agent, the particle size distribution of the Co-Fe alloy NPs tends to be broader than in route (a) [12]. It should be mentioned that according to prior results, a broader particle size distribution of the Co-Fe alloy NPs tends to favor the formation of CH4 as the prevalent product [12].
The precursor of the carbon residue in route i was sodium alginate, which adsorbs Co2+ and Fe2+ in an aqueous solution and is then precipitated with a concentrated solution of divalent metals, either Fe2+ in excess (sample 5) or Ca2+ (samples 6 and 7) in H2O. Alginate is soluble in aqueous solutions at pH values higher than 5, but it is not soluble in the presence of an excess of di- and tri-positive cations, due to the crosslinking of the linear alginate fibrils [45]. The process is completed by the conversion of alginate hydrogel into alcogel by the gradual exchange of H2O with EtOH, followed by supercritical CO2 drying and pyrolysis at 900 °C. The main difference between routes (i) and (a) and (b) is seen in the different solubilities of chitosan and alginate in acid and neutral-basic aqueous solutions, respectively [46].
As can be deduced from Table 1, the set of samples was prepared with the objective of determining the possible influence as promoters of Pd (samples 1 and 2), Ce3+/4+ (samples 3 and 4), an excess of Fe2+ (sample 5), Ca2+ (sample 6), the combination of Ca2+ and Ce3+/4+ (sample 7) or Na+ and K+, in combination with S (sample 11), on catalytic activity. The percentage of Co, Fe, and metallic promoters was determined by ICP-OES of the liquors after the digestion of the samples in aqua regia. In all the cases, except Fe2+ and Ca2+, the percentage of the promoter was purposely low, under 0.5 wt %. The special cases were Fe2+ and Ca2+ as promoters. Since the alginate beads were precipitated by Fe2+ or Ca2+, the content of this alkali-earth metal was much higher, about 25 wt %, compared to the other promoters under study.
Based on the precedents regarding the influence of S in hydrogenation catalysts, increasing the product selectivity by decreasing the catalytic activity, an additional set of four Co-Fe@(N)C samples was prepared containing this element. The S content, as well as the percentage of C and N, were quantified by elemental combustion analyses. The relevant analytical details of samples 8–11 are also included in Table 1. The preparation of samples 8–11 was performed following route (a), with an additional thiourea impregnation step in EtOH after the NaBH4 reduction of Co2+ and Fe2+ salts and before supercritical CO2 drying and pyrolysis.
Promoter-containing Co-Fe@(N)C and Co-Fe@C samples were characterized by powder XRD, Raman spectroscopy and electron microscopy. As expected, in view of the related precedents in the literature, the XRD patterns indicate that during the pyrolysis, Co and Fe became reduced into the metallic state, with the metal NPs having a variable proportion of fcc and bcc phases. Figure 1 presents a selected XRD pattern for sample 1, while the full set of XRD patterns is gathered in Figure S1 of the Supplementary Materials. Importantly, the comparison of the XRD pattern of sample 1, lacking the promoter, with those of the rest of the samples in which promoters in low amounts were present did not reveal any difference in the XRD pattern, except in the case of sample 6, which was characterized by a high Ca content. This lack of influence of promoters on the XRD spectra of the Co-Fe@(N)C and Co-Fe@C samples can be attributed in general to the low percentage of promoters and their high dispersion. For sample 5, containing a large percentage of Fe in its composition, bcc was the prevalent phase. Additionally, in the case of sample 3, the Co/Fe bcc phase prevailed, probably due to its preparation method. Similarly, for S-doped samples, no additional diffraction peaks due to the S species could be identified in the XRD of samples 8–11. Only in the case of sample 6 was the presence of CaCO3 recorded, as characterized by their diffraction peaks at 39.4°, 47.5°, and 56.5°. The formation of CaCO3 can be understood by considering the ambient exposure of the samples after preparation and the prompt carbonation of CaO. As in the reported precedents [12,14], the distinction by XRD between independent Co and Fe phases with Co-Fe alloy is uncertain, due to the similarity of the unit cell parameters of Co and Fe.
The graphitic nature of the carbon residue was determined by Raman spectroscopy, in which the characteristic D + D’, 2D, G, and D peaks were recorded, appearing at 2960, 2700, 1590, and 1350 cm−1, respectively. As an example, Figure 1 also includes the Raman spectrum of sample 1, while Figure S2 in the Supplementary Materials collects the Raman spectra of all the samples under study. The intensity of the G vs. the D band (IG/ID) is generally taken as a quantitative indicator of the density of the defects [47]. In the present case, the IG/ID ratio was between 1.15 and 1.25, which is common for the type of graphitic carbon obtained by the pyrolysis of chitosan or alginate [48]. The intensity of the overtones is also taken as a sign that the carbon residue is constituted by the stacking of only a few graphene layers, these overtones in the region between 2950 and 2700 cm−1 being apparent in most of the samples. These Raman spectra essentially coincide with those previously reported for the Co-Fe@(N)C samples lacking promoters [12,13,14]. This observation suggests that the promoters do not change the graphitic nature of the carbon residue formed in the pyrolysis process.
The morphology of the Co-Fe@(N)C and Co-Fe@C samples containing promoters was imaged by field emission scanning electron microscopy (FESEM). Figure 2 presents some representative images, while a complete set of images of the Co-Fe@(N)C and Co-Fe@C materials is included in Figure S3 of the Supplementary Materials. It was observed that samples 1–11 are characterized by a highly spongy, fluffy structure that derives from the carbonization of the polysaccharide fibrils of the chitosan or alginate after supercritical drying [49]. It has been reported in the literature that in contrast to the behavior of hydrogels that give compact beads, the conversion of chitosan or alginate microspheres into alcogels and subsequent supercritical drying results in a highly porous, spongy, large surface area with beads of chitosan and alginate [49]. This different behavior is due to the occurrence in dry hydrogels of fibril close packing, derived from the formation of hydrogen bridges, while supercritical CO2 drying diminishes this fibril interaction considerably. Interestingly, with the resolution of the FESEM images, the presence of Co-Fe NPs was undetectable and no evidence of the presence of promoters on particle morphology could be obtained, even for CaCO3, which is present at a large percentage.
Transmission electron microscopy (TEM) images revealed the presence of Co-Fe NPs. Dark-field images allowed us to estimate the particle size distribution for samples, based on the measurement of the dimensions of a statistically relevant number of these particles. Figure 3 shows some representative images of the samples under study with the corresponding particle-size histograms, while a collection of additional images and size distribution measurements are provided in Figure S4 of the Supplementary Materials. Table 1 summarizes the average particle size for some samples. As can be seen, most of the samples exhibit a similar average particle size of about 10 nm, except sample 5, in which the particle size was significantly larger, at about 18 nm. This larger particle size of sample 5 can be easily explained, considering the much higher Fe content of this sample.
High-resolution TEM images allowed us to determine the interplanar distance of the 110 plane in Co-Fe NPs as 0.21 nm, which corresponds to the alloy between the two metals [13]. These images also reveal that the Co-Fe NPs are partially covered by one to three layers of defective graphene. The same characterization has been reported in the literature for similar Co-Fe@(N)C samples [12,13,14]. While the presence of promoters in some cases was not apparent from the TEM images, due to their low percentages, EDX analysis revealed the presence of the expected elements in the images. In the case of Ca as a promoter, it was observed that this element was coating the Co-Fe NPs as determined by analysis of the variation of the elemental composition along Co-Fe NPs in high-resolution TEM. Therefore, TEM characterization shows that promoters are well dispersed in the Co-Fe@(N)C and Co-Fe@C samples, with interaction with the Co-Fe alloy NPs supported on defective few-layer graphene layers.

Catalytic Activity

The catalytic activity of the samples was evaluated under the continuous flow of a CO2-H2 mixture diluted in Ar in a pressurized tubular, stainless steel reactor, with the catalyst as a fixed bed. No binders were used, and the samples were used as fine powders. Each catalyst was tested in the range of temperatures from 300 to 500 °C, rising by 50 °C increments without removing the sample from the reactor. After setting a new temperature, the reactor was allowed to equilibrate, then the temperature was maintained for 1 h dwell time. The composition of the reaction mixture was determined by gas chromatography analysis at 30, 45, and 55 min after the temperature of the reaction was equilibrated. No differences larger than 10% among the three analyses were measured in most of the cases, and conversion and selectivity values for the temperature were taken as the average of the three independent analyses. For the few cases in which larger differences among the values were found, the measurement was not considered.
Preliminary controls at the highest reaction temperature of the study in the absence of any catalysts, or when using 40 mg of (N)G or G without metals as catalysts, showed low CO2 conversions of 6, 13, and 8%, respectively, CH4 being the only detectable product. It has been previously reported that defective graphenes exhibit some activity as CO2 hydrogenation catalysts [50]. However, as previously found [12,13,14], these CO2 conversion values of (N)G and G are much lower under the conditions of the present study than those found when Co-Fe NPs were present in the catalyst.
All the Co-Fe@(N)C and Co-Fe@C samples containing promoters were active as catalysts for CO2 hydrogenation. The products observed were CH4, CO, and variable proportions of C2–C4 hydrocarbons (C2-C40), including a certain proportion of alkenes (C2-C4=). While any product derived from CO2 hydrogenation is desirable, the key point is to develop a selective catalyst that can afford very high selectivity for a given product at very high CO2 conversion. As expected, CO2 conversion increased with the temperature, and selectivity varied in each case with the conversion. Differences in the catalytic activity of the Co-Fe@(N)C and Co-Fe@C samples that were attributable to the effect of promoters were observed.
The comparison of the catalytic activity of samples 1 and 2 shows that the presence of Pd in 0.5 wt % increases CO2 conversion in the lower temperature range from 300 to 400 °C, with some changes in selectivity. The difference in the catalytic performance of samples 1 and 2 is presented in Figure 4 and Table S2 and S3 in the Supplementary Materials. This change was particularly notable at 400 °C, the presence of Pd increasing CH4 selectivity. This effect can be explained by considering that Pd is a better hydrogenating metal than the Co-Fe alloy and it can activate H2 at lower temperatures. Subsequently, the H atoms on Pd would undergo spillover from the Fe-Co NPs. Since CH4 is the most stable hydrogenation product, the higher catalytic activity caused by Pd as a promoter would be reflected in higher CH4 selectivity.
Less evident is the case of Ce as a promoter (see Figure S5 and Table S4 and S5 in the Supplementary Materials). While a comparison of the catalytic activity of Co-Fe@(N)C samples 3 and 4 shows that Ce does not alter CO2 conversion significantly, CO selectivity was considerably reduced at every temperature, favoring the formation of CH4. In this sense, the effect on product selectivity by the promotion of Ce is analogous to that observed for Pd. In contrast, in the case of Co-Fe@C samples derived from calcium alginate, the presence of Ce in a small percentage has a detrimental effect, decreasing CO2 conversion substantially and resulting in mixtures with a large percentage of CO. This contrasting behavior could indicate that the role of Ce is not H2 activation, as is the case with Pd, but rather an interaction with Co-Fe with the tuning of their acidity. Therefore, since CaCO3 should essentially have the role of the base, the promotional effect of Ce would be different in samples 4 and 7.
As commented earlier, an excess of Fe2+ or Ca2+ was employed in procedure C to form insoluble alginate beads, and these two metals are present in much higher weight percentages in samples 5–7. The high Fe content of sample 5 is responsible for its higher activity at 300 °C, compared to sample 6. However, this advantage disappears at temperatures of 350 °C or higher, for which temperature sample 6 is significantly more active than sample 5, in spite of the higher Fe content of the latter. Figure 5 summarizes the catalytic results for these samples, while the data are collected in Tables S6–S8 of the Supplementary Materials. In the case of sample 6, the TEM images show intimate contact between Ca2+ and metallic Co-Fe NPs. Ca2+ exerts a strong influence on the catalytic performance of Co-Fe@C, increasing CO2 conversion, and CH4 selectivity. It is proposed that Ca2+ increases CO2 adsorption on Co-Fe@C by forming CaCO3, which is the prevalent phase in the material, resulting in an enhanced conversion.
Besides the promotion by metallic elements, the effect of S on the catalytic activity of Co-Fe@(N)C was also studied. Samples 8–10 are analogous to sample 1 and were prepared similarly, except that thiourea, as the source of elemental S in three different amounts, was added to the alcogel beads. As shown in Figure 6 and Table S9–S12 in the Supplementary Materials, the presence of S produces two clear effects on the catalytic activity of Co-Fe@(N)C. Firstly, CO2 conversion decreases substantially for the three samples 8–10, regardless of the S content, in the range from 2.9 to 7.1 wt % under study. Secondly, the selectivity to CO increases dramatically, being over 97% at the highest temperature tested for these samples. This indicates that S acts as a poison in Co-Fe NPs, diminishing the hydrogenation activity of these NPs. Since CH4 formation requires the consumption of four consecutive hydrogen molecules, while CO is formed by the hydrogenation of a single hydrogen molecule, the shift in selectivity from CH4 to CO can be easily understood, considering that the less favorable hydrogenation has the higher CO selectivity. Therefore, the poisoning effect of S on Co/Fe catalyst is reflected in the lesser CO2 conversion and lesser hydrogen uptake.
An attempt to increase the catalytic activity of the S-containing Co-Fe@(N)C samples was made in sample 11 by adding alkali metal promoters, together with S. It was expected that the basicity introduced by alkali metals could increase the CO2 conversion in these S-containing samples, by favoring CO2 adsorption. Although the CO2 conversion of sample 11 was still lower than that of sample 1, a clear increase in activity attributable to the promotion of Na and K was observed, sample 11 reaching a CO2 conversion of 59% at 500 °C, closer to the 88% measured for sample 1, but much higher than the 13% CO2 conversion value of sample 10. Notably, the increase in CO2 conversion observed for sample 11 did not influence the CO selectivity caused by S poisoning, which, in the case of sample 11, was still over 98%.

4. Conclusions

The present study provides catalytic data regarding how the activity and selectivity of Co-Fe@(N)C and Co-Fe@C catalysts can be modulated by promoters. Two classes of effects were observed. Pd in a small percentage and Ca in larger concentrations both increased CO2 conversion and CH4 selectivity. It is proposed that Pd promotion is due to H2 activation and spillover, while Ca enhances CO2 adsorption near the sites. On the other hand, S at a few percent decreases activity dramatically, but it does drive selectivity toward CO. It is proposed that S is acting as a poison of the hydrogenating sites, disfavoring not only the attack on CO2 but also the successive hydrogen uptake toward CH4. The effect of S as a poison is mitigated partially by the basicity of alkali metals. Overall, the present study shows how a range of catalysts, based on Co-Fe and supported on carbon, exhibiting contrasting product selectivity to CH4 or to CO, can be prepared by the selection of adequate promoters. Considering the availability of the starting materials and the importance of developing selective CO2 hydrogenation processes on a large scale, the present study has shown the way forward for the use of catalysts derived from chitosan/alginate in CO2 hydrogenation.

Supplementary Materials

The following supporting information can be downloaded at: https://0-www-mdpi-com.brum.beds.ac.uk/article/10.3390/nano12183220/s1, Supporting information file includes list of different samples employed in this work, detailed characterization gas chromatography analysis procedure for the catalytic activity, powder XRD patterns of all samples, Raman spectra of samples 2–11, FESEM images of samples 2–11, DF-TEM images for samples 1, 3, 7 and CO2 conversion/selectivity data for samples 1-11.

Author Contributions

Conceptualization, L.P.; methodology, B.J.; validation, A.P., V.I.P.; formal analysis, L.P.; investigation, B.J.; data curation, A.G., L.P.; writing—original draft preparation, L.P., H.G., A.D.; writing—review and editing, A.P.; supervision, H.G.; project administration, A.P. All authors have read and agreed to the published version of the manuscript.

Funding

This research was funded by the Spanish Ministry of Science and Innovation and the University (Severo Ochoa SEV2021 and RTI2018.98237-B-CO1) and Generalitat Valenciana (Prometeo 2017/083). A.P. is the recipient of a Ramón y Cajal research associate contract awarded by the Spanish Ministry of Science and Innovation. L.P. thanks the Generalitat Valenciana for a Santiago Grisolía scholarship. BASF is thanked for financial support.

Data Availability Statement

The data presented in this study are available on request from the corresponding author.

Conflicts of Interest

The authors declare no conflict of interest.

References

  1. Al-Mamoori, A.; Krishnamurthy, A.; Rownaghi, A.A.; Rezaei, F. Carbon Capture and Utilization Update. Energy Technol. 2017, 5, 834–849. [Google Scholar] [CrossRef]
  2. Frontera, P.; Macario, A.; Ferraro, M.; Antonucci, P. Supported Catalysts for CO2 Methanation: A Review. Catalysts 2017, 7, 59. [Google Scholar] [CrossRef]
  3. Li, W.; Wang, H.; Jiang, X.; Zhu, J.; Liu, Z.; Guo, X.; Song, C. A short review of recent advances in CO2 hydrogenation to hydrocarbons over heterogeneous catalysts. RSC Adv. 2018, 8, 7651–7669. [Google Scholar] [CrossRef] [PubMed]
  4. Matthews, H.D.; Caldeira, K. Stabilizing climate requires near-zero emissions. Geophys. Res. Lett. 2008, 35, L04705. [Google Scholar] [CrossRef]
  5. Molina, M.; Zaelke, D.; Sarma, K.M.; Andersen, S.O.; Ramanathan, V.; Kaniaru, D. Reducing abrupt climate change risk using the Montreal Protocol and other regulatory actions to complement cuts in CO2 emissions. Proc. Nat. Acad. Sci. USA 2009, 106, 20616–20621. [Google Scholar] [CrossRef]
  6. Navarro, J.C.; Centeno, M.A.; Laguna, O.H.; Odriozola, J.A. Policies and Motivations for the CO2 Valorization through the Sabatier Reaction Using Structured Catalysts. A Review of the Most Recent Advances. Catalysts 2018, 8, 578. [Google Scholar] [CrossRef]
  7. Pachauri, R.K.; Allen, M.R.; Barros, V.R.; Broome, J.; Cramer, W.; Christ, R.; Church, J.A.; Clarke, L.; Dahe, Q.; Dasgupta, P. Climate Change 2014: Synthesis Report; Contribution of Working Groups I, II and III to the fifth assessment report of the Intergovernmental Panel on Climate Change; IPCC: Geneva, Switzerland, 2014. [Google Scholar]
  8. Stangeland, K.; Kalai, D.; Li, H.; Yu, Z. CO2 Methanation: The Effect of Catalysts and Reaction Conditions. Energy Proc. 2017, 105, 2022–2027. [Google Scholar] [CrossRef]
  9. Stuardi, F.M.; MacPherson, F.; Leclaire, J. Integrated CO2 capture and utilization: A priority research direction. Curr. Opin. Green Sustain. Chem. 2019, 16, 71–76. [Google Scholar] [CrossRef]
  10. Wang, W.; Wang, S.; Ma, X.; Gong, J. Recent advances in catalytichydrogenation of carbon dioxide. Chem. Soc. Rev. 2011, 40, 3703–3727. [Google Scholar] [CrossRef]
  11. Yu, K.M.K.; Curcic, I.; Gabriel, J.; Tsang, S.C.E. Recent Advances in CO2 Capture and Utilization. ChemSusChem 2008, 1, 893–899. [Google Scholar] [CrossRef]
  12. Jurca, B.; Peng, L.; Gordillo, A.; Primo, A.; Parvulescu, V.I.; Garcia, H. Co–Fe Nanoparticles Wrapped on N-Doped Graphitic Carbons as Highly Selective CO2 Methanation Catalysts. ACS Appl. Mater. Interfaces 2021, 13, 36976–36981. [Google Scholar] [CrossRef] [PubMed]
  13. Peng, L.; Jurca, B.; Gordillo, A.; Primo, A.; Parvulescu, V.I.; García, H. Co–Fe Clusters Supported on N-Doped Graphitic Carbon as Highly Selective Catalysts for Reverse Water Gas Shift Reaction. ACS Sustain. Chem. Eng. 2021, 9, 9264–9272. [Google Scholar] [CrossRef]
  14. Peng, L.; Jurca, B.; Gordillo, A.; Primo, A.; Parvulescu, V.I.; García, H. High C2-C4 selectivity in CO2 hydrogenation by particle size control of Co-Fe alloy nanoparticles wrapped on N-doped graphitic carbon. iScience 2022, 25, 104252. [Google Scholar] [CrossRef] [PubMed]
  15. Zhang, L.; Zhang, Y.; Chen, S. Effect of promoter SiO2, TiO2 or SiO2-TiO2 on the performance of CuO-ZnO-Al2O3 catalyst for methanol synthesis from CO2 hydrogenation. Appl. Catal. A Gen. 2012, 415, 118–123. [Google Scholar] [CrossRef]
  16. Ye, R.-P.; Ding, J.; Gong, W.; Argyle, M.D.; Zhong, Q.; Wang, Y.; Russell, C.K.; Xu, Z.; Russell, A.G.; Li, Q.; et al. CO2 hydrogenation to high-value products via heterogeneous catalysis. Nat. Commun. 2019, 10, 5698. [Google Scholar] [CrossRef] [PubMed]
  17. Hu, F.; Chen, X.; Tu, Z.; Lu, Z.-H.; Feng, G.; Zhang, R. Graphene Aerogel Supported Ni for CO2 Hydrogenation to Methane. Ind. Eng. Chem. Res. 2021, 60, 12235–12243. [Google Scholar] [CrossRef]
  18. García-Bordejé, E.; Dongil, A.B.; Conesa, J.M.; Guerrero-Ruiz, A.; Rodríguez-Ramos, I. Promotion of Ru or Ni on Alumina Catalysts with a Basic Metal for CO2 Hydrogenation: Effect of the Type of Metal (Na, K, Ba). Nanomaterials 2022, 12, 1052. [Google Scholar] [CrossRef]
  19. Yang, Z.; Lei, Z.; Ge, B.; Xiong, X.; Jin, Y.; Jiao, K.; Chen, F.; Peng, S. Development of catalytic combustion and CO2 capture and conversion technology. Int. J. Coal Sci. Technol. 2021, 8, 377–382. [Google Scholar] [CrossRef]
  20. Li, D.; Ichikuni, N.; Shimazu, S.; Uematsu, T. Catalytic properties of sprayed Ru/Al2O3 and promoter effects of alkali metals in CO2 hydrogenation. Appl. Catal. A Gen. 1998, 172, 351–358. [Google Scholar] [CrossRef]
  21. Liang, B.; Duan, H.; Sun, T.; Ma, J.; Liu, X.; Xu, J.; Su, X.; Huang, Y.; Zhang, T. Effect of Na Promoter on Fe-Based Catalyst for CO2 Hydrogenation to Alkenes. ACS Sustain. Chem. Eng. 2018, 7, 925–932. [Google Scholar] [CrossRef]
  22. Koizumi, N.; Jiang, X.; Kugai, J.; Song, C. Effects of mesoporous silica supports and alkaline promoters on activity of Pd catalysts in CO2 hydrogenation for methanol synthesis. Catal. Today 2012, 194, 16–24. [Google Scholar] [CrossRef]
  23. Xu, L.; Wang, Q.; Liang, D.; Wang, X.; Lin, L.; Cui, W.; Xu, Y. The promotions of MnO and K2O to Fe/silicalite-2 catalyst for the production of light alkenes from CO2 hydrogenation. Appl. Catal. A Gen. 1998, 173, 19–25. [Google Scholar] [CrossRef]
  24. Liu, B.; Geng, S.; Zheng, J.; Jia, X.; Jiang, F.; Liu, X. Unravelling the New Roles of Na and Mn Promoter in CO2 Hydrogenation over Fe3O4-Based Catalysts for Enhanced Selectivity to Light α-Olefins. ChemCatChem 2018, 10, 4718–4732. [Google Scholar] [CrossRef]
  25. Chen, C.S.; Cheng, W.H.; Lin, S.S. Study of reverse water gas shift reaction by TPD, TPR and CO2 hydrogenation over potassium-promoted Cu/SiO2 catalyst. Appl. Catal. A Gen. 2003, 238, 55–67. [Google Scholar] [CrossRef]
  26. Jacobs, G.; Das, T.K.; Zhang, Y.; Li, J.; Racoillet, G.; Davis, B.H. Fischer–Tropsch synthesis: Support, loading, and promoter effects on the reducibility of cobalt catalysts. Appl. Catal. A Gen. 2002, 233, 263–281. [Google Scholar] [CrossRef]
  27. Bukur, D.B.; Mukesh, D.; Patel, S.A. Promoter effects on precipitated iron catalysts for Fischer-Tropsch synthesis. Ind. Eng. Chem. Res. 1990, 29, 194–204. [Google Scholar] [CrossRef]
  28. Li, W.; Zhang, G.; Jiang, X.; Liu, Y.; Zhu, J.; Ding, F.; Liu, Z.; Guo, X.; Song, C. CO2 Hydrogenation on Unpromoted and M-Promoted Co/TiO2 Catalysts (M = Zr, K, Cs): Effects of Crystal Phase of Supports and Metal–Support Interaction on Tuning Product Distribution. ACS Catal. 2019, 9, 2739–2751. [Google Scholar] [CrossRef]
  29. Riedel, T.; Schaub, G.; Jun, K.W.; Lee, K.W. Kinetics of CO2 Hydrogenation on a K-Promoted Fe Catalyst. Ind. Eng. Chem. Res. 2001, 40, 1355–1363. [Google Scholar] [CrossRef]
  30. Gnanamani, M.K.; Hamdeh, H.H.; Shafer, W.D.; Hopps, S.D.; Davis, B.H. Hydrogenation of carbon dioxide over iron carbide prepared from alkali metal promoted iron oxalate. Appl. Catal. A Gen. 2018, 564, 243–249. [Google Scholar] [CrossRef]
  31. Mihet, M.; Dan, M.; Lazar, M.D. CO2 Hydrogenation Catalyzed by Graphene-Based Materials. Molecules 2022, 27, 3367. [Google Scholar] [CrossRef]
  32. Zhang, R.; Huang, Z.; Li, C.; Zuo, Y.; Zhou, Y. Monolithic g-C3N4/reduced graphene oxide aerogel with in situ embedding of Pd nanoparticles for hydrogenation of CO2 to CH4. Appl. Surf. Sci. 2019, 475, 953–960. [Google Scholar] [CrossRef]
  33. Ridzuan, N.D.M.; Shaharun, M.S.; Lee, K.M.; Din, I.U.; Puspitasari, P. Influence of Nickel Loading on Reduced Graphene Oxide-Based Nickel Catalysts for the Hydrogenation of Carbon Dioxide to Methane. Catalysts 2020, 10, 471. [Google Scholar] [CrossRef]
  34. He, F.; Niu, N.; Qu, F.; Wei, S.; Chen, Y.; Gai, S.; Gao, P.; Wang, Y.; Yang, P. Synthesis of three-dimensional reduced graphene oxide layer supported cobalt nanocrystals and their high catalytic activity in F–T CO2 hydrogenation. Nanoscale 2013, 5, 8507–8516. [Google Scholar] [CrossRef] [PubMed]
  35. Wu, T.; Lin, J.; Cheng, Y.; Tian, J.; Wang, S.; Xie, S.; Pei, Y.; Yan, S.; Qiao, M.; Xu, H.; et al. Porous Graphene-Confined Fe–K as Highly Efficient Catalyst for CO2 Direct Hydrogenation to Light Olefins. ACS Appl. Mater. Interfaces 2018, 10, 23439–23443. [Google Scholar] [CrossRef]
  36. Dry, M.; Shingles, T.; Botha, C.V.H. Factors influencing the formation of carbon on iron Fischer-Tropsch catalysts: I. The influence of promoters. J. Catal. 1970, 17, 341–346. [Google Scholar] [CrossRef]
  37. Tao, Z.; Yang, Y.; Zhang, C.; Li, T.; Wang, J.; Wan, H.; Xiang, H.; Li, Y. Effect of calcium promoter on a precipitated iron–manganese catalyst for Fischer–Tropsch synthesis. Catal. Commun. 2006, 7, 1061–1066. [Google Scholar] [CrossRef]
  38. de la Osa, A.; de Lucas, A.; Romero, A.; Valverde, J.; Sánchez, P. Fischer–Tropsch diesel production over calcium-promoted Co/alumina catalyst: Effect of reaction conditions. Fuel 2011, 90, 1935–1945. [Google Scholar] [CrossRef]
  39. Panagiotopoulou, P. Hydrogenation of CO2 over supported noble metal catalysts. Appl. Catal. A Gen. 2017, 542, 63–70. [Google Scholar] [CrossRef]
  40. Minnermann, M.; Pokhrel, S.; Thiel, K.; Henkel, R.; Birkenstock, J.; Laurus, T.; Zargham, A.; Flege, J.I.; Zielasek, V.; Piskorska-Hommel, E. Role of Palladium in Iron Based Fischer−Tropsch Catalysts Prepared by Flame Spray Pyrolysis. J. Phys. Chem. C 2011, 115, 1302–1310. [Google Scholar] [CrossRef]
  41. Ning, W.; Yang, X.; Yamada, M. Influence of Palladium on the Hydrocarbon Distribution of Fischer- Tropsch Reaction Over Precipitated Iron Catalyst. Curr. Catal. 2012, 1, 88–92. [Google Scholar] [CrossRef]
  42. Galvis, H.M.T.; Koeken, A.C.; Bitter, J.H.; Davidian, T.; Ruitenbeek, M.; Dugulan, A.I.; de Jong, K.P. Effects of sodium and sulfur on catalytic performance of supported iron catalysts for the Fischer–Tropsch synthesis of lower olefins. J. Catal. 2013, 303, 22–30. [Google Scholar] [CrossRef]
  43. Anderson, R.; Karn, F.; Shultz, J. Factors in sulfur poisoning of iron catalysts in Fischer-Tropsch synthesis. J. Catal. 1965, 4, 56–63. [Google Scholar] [CrossRef]
  44. Oschatz, M.; Krans, N.; Xie, J.; de Jong, K.P. Systematic variation of the sodium/sulfur promoter content on carbon-supported iron catalysts for the Fischer–Tropsch to olefins reaction. J. Energy Chem. 2016, 25, 985–993. [Google Scholar] [CrossRef]
  45. Dong, Y.; Dong, W.; Cao, Y.; Han, Z.; Ding, Z. Preparation and catalytic activity of Fe alginate gel beads for oxidative degradation of azo dyes under visible light irradiation. Catal. Today 2011, 175, 346–355. [Google Scholar] [CrossRef]
  46. Skaugrud, Ø.; Hagen, A.; Borgersen, B.; Dornish, M. Biomedical and Pharmaceutical Applications of Alginate and Chitosan. Biotechnol. Gen. Eng. Rev. 1999, 16, 23–40. [Google Scholar] [CrossRef]
  47. Cançado, L.G.; Jorio, A.; Ferreira, E.M.; Stavale, F.; Achete, C.A.; Capaz, R.B.; Moutinho, M.V.d.O.; Lombardo, A.; Kulmala, T.; Ferrari, A.C. Quantifying Defects in Graphene via Raman Spectroscopy at Different Excitation Energies. Nano Lett. 2011, 11, 3190–3196. [Google Scholar] [CrossRef]
  48. He, J.; Anouar, A.; Primo, A.; García, H. Quality Improvement of Few-Layers Defective Graphene from Biomass and Application for H2 Generation. Nanomaterials 2019, 9, 895. [Google Scholar] [CrossRef]
  49. Valentin, R.; Molvinger, K.; Quignard, F.; Brunel, D. Supercritical CO2 dried chitosan: An efficient intrinsic heterogeneous catalyst in fine chemistry. New J. Chem. 2003, 27, 1690–1692. [Google Scholar] [CrossRef]
  50. Jurca, B.; Bucur, C.; Primo, A.; Concepción, P.; Parvulescu, V.I.; García, H. N-Doped Defective Graphene from Biomass as Catalyst for CO2 Hydrogenation to Methane. ChemCatChem 2019, 11, 985–990. [Google Scholar] [CrossRef]
Scheme 1. Procedure used to prepare the Co-Fe@(N)C (routes (a,b)) and Co-Fe@C (route (c)) under study. Preparation of samples 1, 2, and 8–11, (i) precipitation in NaOH solution; (ii) water/ethanol exchange and metal salt impregnation; (iii) NaBH4 reduction in ethanol solution; (iv) supercritical CO2 drying. (Samples 8–11 were created following route (a) with an additional thiourea impregnation in ethanol in step (iii). Samples 3 and 4 (i’) were created by precipitation in NaOH solution; (ii’) water/ethanol exchange and NaBH4 reduction in ethanol solution; (iii’) supercritical CO2 drying. Sample 5–7, (i’’) precipitation in metal aqueous solution and water/ethanol exchange; (ii’’) supercritical CO2 drying.
Nanomaterials 12 03220 sch001
Figure 1. XRD pattern (a) and Raman spectrum (b) of sample 1.
Nanomaterials 12 03220 g001
Figure 2. FESEM images of samples 1 and 6 (a,b): sample 1 and (c,d): sample 6.
Nanomaterials 12 03220 g002
Figure 3. DF-TEM images (a-l) of samples 2, 4, 5, 6, 8, 11. (a,b): sample 2; (c,d): sample 4; (e,f): sample 5; (g,h): sample 6; (i,j): sample 8; (k,l): sample 11. Inset: the statistical particle size distributions of samples 2, 4, 5, 6, 8, and 11, respectively.
Nanomaterials 12 03220 g003
Figure 4. CO2 conversion and selectivity for samples 1 and 2 at different temperatures. (a): Sample 1 and (b): sample 2. Reaction condition: H2/CO2 ratio of 7, total flow 4 mL/min, 10 bar, 40 mg catalyst. The error of the measurements is lower than 10%.
Nanomaterials 12 03220 g004
Figure 5. CO2 conversion and selectivity for samples 5–7 at different temperatures. (a): sample 5; (b): sample 6 and (c): sample 7. Reaction condition: H2/CO2 ratio of 7, total flow 4 mL/min, 10 bar, 40 mg catalyst.). The error of the measurements is lower than 10%.
Nanomaterials 12 03220 g005
Figure 6. CO2 conversion and selectivity for samples 1 and 8–11, with different contents of S (a) at 500 °C and (be) at different temperatures. (b): Sample 8; (c): sample 9; (d): sample 10 and (e): sample 11. Reaction condition: H2/CO2 ratio of 7, total flow 4 mL/min, 10 bar, 40 mg catalyst. The error of the measurements is lower than 10%.
Nanomaterials 12 03220 g006
Table 1. List of samples under study and their main analytical and physicochemical parameters.
Sample No.Co (wt %) aFe (wt %) aPromoter
(wt %) a,b
C
(wt %) b
N
(wt %) b
Average Particle Size (nm) c
114.13.5-63.61.410.5 ± 2
218.64.4Pd0.562.91.310.6 ± 3
312.43.2-70.51.69.7 ± 5
411.32.8Ce0.467.61.412.2 ± 6
(CeOx): 2.4 ± 1
59.038.4-47.5-21.6 ± 5
611.33.9Ca25.837.1-7.3 ± 3
716.05.4Ce1.543.4-- d
811.72.8S7.149.12.210.5 ± 2
911.32.2S5.253.42.5- d
1015.63.6S2.955.62.7- d
114.31.5K1.060.13.99.1 ± 6
Na1.4
S3.1
a Determined by ICP-AES analysis after dissolving the metals in aqua regia; b It is assumed that the rest of the volume up to 100% is the residual oxygen; c Determined via DF-TEM. d It was difficult to determine the average particle size from DF-TEM.
Publisher’s Note: MDPI stays neutral with regard to jurisdictional claims in published maps and institutional affiliations.

