Article

Performance of TiO2/UV-LED-Based Processes for Degradation of Pharmaceuticals: Effect of Matrix Composition and Process Variables

by
Danilo Bertagna Silva
1,
Gianluigi Buttiglieri
2,3,
Bruna Babić
1,
Danijela Ašperger
1 and
Sandra Babić
1,*
1
Faculty of Chemical Engineering and Technology, University of Zagreb, Trg Marka Marulića 19, 10000 Zagreb, Croatia
2
Catalan Institute for Water Research (ICRA-CERCA), C. Emili Grahit, 101, 17003 Girona, Spain
3
Universitat de Girona, Girona, Spain
*
Author to whom correspondence should be addressed.
Submission received: 20 December 2021 / Revised: 11 January 2022 / Accepted: 13 January 2022 / Published: 17 January 2022

Abstract

:
Ultra-violet light-emitting diode (UV-LED)-based processes for water treatment have shown the potential to surpass the hurdles that prevent the adoption of photocatalysis at a large scale due to UV-LEDs’ unique features and design flexibility. In this work, the degradation of five EU Watch List 2020/1161 pharmaceutical compounds was comprehensively investigated. Initially, the UV-A and UV-C photolytic and photocatalytic degradation of individual compounds and their mixtures were explored. A design of experiments (DoE) approach was used to quantify the effects of numerous variables on the compounds’ degradation rate constant, total organic carbon abatement, and toxicity. The reaction mechanisms of UV-A photocatalysis were investigated by adding different radical scavengers to the mix. The influence of the initial pH was tested and a second DoE helped evaluate the impact of matrix constituents on degradation rates during UV-A photocatalysis. The results showed that each compound had widely different responses to each treatment/scenario, meaning that the optimized design will depend on matrix composition, target pollutant reactivity, and required effluent standards. Each situation should be analyzed individually with care. The levels of the electrical energy per order are still unfeasible for practical applications, but LEDs of lower wavelengths (UV-C) are now approaching UV-A performance levels.

1. Introduction

Water scarcity across the globe demands an effort to find efficient and sustainable treatments that will allow its safe reuse [1,2]. Furthermore, pharmaceutical active compounds (PhACs) are commonly found in wastewater treatment plant outlets, since some of them are resistant to conventional physical and/or biological treatments [3,4,5,6]. PhACs may then end up in waterbodies, persist in the environment and bio-accumulate, causing diverse sorts of endocrine disruptions in aquatic life, even at very small concentrations (ng/L, µg/L) [7,8]. Studies have shown that their effects on human health are highly unpredictable given their chemical diversity and the numerous interactions they can have with other substances present in water [9].
Among possible water treatment solutions, advanced oxidation processes (AOPs) have shown a high degradation potential due to the formation of reactive oxygen species (ROS), especially the hydroxyl radical (OH), which are able to oxidize persistent pollutants [10,11,12]. However, these processes are highly energy-demanding [13]. Photocatalysis using TiO2 has been investigated in depth in previous decades due to its capacity for generating radicals in water using only light—be it solar or artificial—but real-life applications have rarely been adopted due to the process’ low photonic efficiency, the concerns regarding additional separation steps (for TiO2 as a powder), mass transportation issues, and lower degradation rates (for immobilized TiO2) [14,15,16]. Other reasons for the large number of works dealing with TiO2 photocatalysis are its various enhancement possibilities. Radical formation can be increased by adding H2O2 to matrices [17], altering TiO2’s surface by doping or heterojuction coupling techniques which increase the catalyst’s photoactivity in the solar range [18,19]. The photocatalytic potential of other materials besides TiO2 has also been investigated [20]. The advantages of photocatalysis over other AOPs are the possibility of generating not only the hydroxyl radical but other reactive species, such as the superoxide radical (O2) and positive holes (h+), allowing different reaction routes [15].
To reach an in-depth understanding of the variables which influence photolysis and photocatalysis, a critical analysis of performed experiments should take place. Works focusing on the degradation of single spiked target PhACs in ultra-pure water are ubiquitous [20,21,22,23,24], as are investigations of radical scavengers, which are responsible for degradation hindering [16,25,26,27], though mixtures of compounds are seldom considered. More recently, the concern about optimizing energy expenses has established the electrical energy per order (EEO) as a key parameter to compare different AOPs [28,29,30,31]. EEO is defined as the amount of energy necessary to remove 90% of a target pollutant in a fixed volume of water (generally expressed as kWh m−3).
The development of ultra-violet light-emitting diodes (UV-LEDs) and recent advances in their wall-plug efficiency and affordability has opened up new possibilities for photocatalysis, since many features of UV-LEDs give them an upper hand in comparison to traditional low- or middle-pressure Hg UV lamps [32]. LEDs are built from durable ceramic materials, are mercury-free, have longer lifetimes, and have no required warm-up periods (which allows the use of photonic efficiency techniques, such as controlled periodic illumination (CPI)) [33]. Their dimensions can be approximated as point sources, allowing very flexible design and small-scale point of use applications [32,34,35]. Previous studies highlighted the fact that the development of UV-LEDs is still very recent, so the technology is at an early stage [35,36]. Lower external quantum and wall-plug efficiencies, especially for lower wavelengths, were always considered the main hurdle for further adoption of UV-LEDs in the last decade [33]. Nevertheless, a recent review shows that EEO values of UV-LEDs and Hg UV mercury lamps are on the same order of magnitude [32] and comparisons between them are now feasible.
A few studies have engaged in designing and evaluating innovative UV-LED photoreactor designs [37,38,39], and some of them have applied design of experiments (DoE), a powerful tool to optimize highly complex systems and find optimal conditions [40,41,42]. Studies evaluating the performance of UV-LED photocatalytic processes in real matrices, such as tap water, river water, or wastewater at real pollutant concentrations, are scarce [8,23,40,43,44]. The LED-exclusive feature of CPI has only been investigated for photocatalysis in simple scenarios; in MilliQ (MQ) water and rudimental reactor designs. The simultaneous use of light sources of different wavelengths, which is possible due to the point-source character of LEDs, is another field that has not been explored by scientists and engineers. Additionally, simultaneous photocatalytic degradation studies of multiple PhACs in water (more than three) often demand powerful analytical techniques and complex chromatographic methods; therefore, more studies on the topic are necessary to further the development of this technology.
Additionally, it is paramount that awareness about the issue of PhACs and other contaminants of emerging concern keeps growing among the general population, which would press for more strict water regulations across the world and subsequently generate more interest in the further development and adoption of AOPs by water technology specialists.
The goal of this work was to investigate the simultaneous degradation of five different PhACs by UV-LED-based processes in a lab-scale reactor under a wide range of different scenarios. The chosen PhACs were ciprofloxacin (CIP), sulfamethoxazole (SMX), trimethoprim (TMP), venlafaxine (VX), and desmethylvenlafaxine (DV)—all currently on the 2020/1161 EU Watch List of substances to be monitored [45]. The degradation mechanisms of each of them individually and in a mixture were compared. Two different DoEs were applied. The first DoE investigated the influence of different water matrices (MQ and tap water), LED wavelengths (UV-C and UV-A), the presence or absence of TiO2 nanofilm, and controlled periodic illumination (CPI) on PhAC degradation. The second DoE studied the impact of matrix components (bicarbonates, nitrates, and humic acids) on each of the PhACs’ apparent first-order degradation rate constant (kapp) during UV-A photocatalysis. The impact of initial pHs was also evaluated. Furthermore, the estimation of EEO values related to different photoreactor designs and simultaneous wavelengths, while targeting PhAC removal, enriched the discussion.
The main contribution of this work is a complex analysis which simultaneously encompasses matrix composition, photoreactor parameters, and recently developed LED-exclusive features in relation to the photocatalytic degradation of contaminants of emerging concern, as well as the impact on degradation kinetics, energy consumption, and effluent toxicity.

2. Materials and Methods

2.1. Chemicals and Reagents

High purity (>98%) analytical standards of CIP (CAS no. 85721-33-1), SMX (CAS no. 723-46-6), TMP (CAS no. 738-70-5), and humic acids (CAS no. 1415-95-6) were supplied from Sigma-Aldrich (St. Louis, MO, USA). VX (CAS 99300-78-4) and DV (CAS no. 93413-62-8) were supplied by Tokyo Chemical Industry Co. LTD (Tokyo, Japan). Triethanolamine (CAS no. 102-71-6) was supplied from Carlo Erba Reagents (Milan, Italy). Ammonium oxalate (CAS no. 6009-70-7), sodium nitrate (CAS no. 7631-99-4), and sodium bicarbonate (CAS no. 144-55-8) were supplied by Kemika (Zagreb, Croatia). Acetonitrile was HPLC grade (J. T. Baker, Deventer, Netherlands).

2.2. Water Matrices

The photolytic and photocatalytic degradation of selected PhACs were investigated in two water matrices: ultrapure water and tap water. MQ water (pH = 5.8) was prepared by the Millipore Simplicity UV system (Millipore Corporation, Billerica, MA, USA). Tap water was sampled at the laboratory faucet at the Faculty of Chemical Engineering and Technology, University of Zagreb. Prior to the sampling, the faucet was turned on and left to run at a uniform rate to flush standing water from the service pipes (2–3 min). Tap water was analyzed for pH, total organic carbon (TOC), and inorganic ion content. Table S1 in the supplementary information shows the composition of tap water.

2.3. Experimental Set-Up

Two identical cylindrical quartz reaction vessels with an inner diameter of 37 mm, length = 150 mm and wall thickness = 1.5 mm were adopted. In one of them, nanostructured TiO2 film was immobilized on its inner sidewall by the sol–gel method and dip-coating technique. For the preparation of colloidal TiO2 solution (sol), the following components were used: titanium(IV) isopropoxide (Ti(C3H5O12)4)—TIP as a precursor; i-propanol (C3H7OH)—PrOH as a solvent; acetylacetone (CH3(CO)CH2(CO)CH3)—AcAc as a chelating agent; nitric acid (HNO3)—HN-0.5 M as a catalyst. The molar ratio of these reactants was: TIP:PrOH:AcAc:HN = 1:35:0.63:0.015. The sol was poured into the cylindrical reactor, kept there for 10 min, and slowly poured out. After that, the film was dried at 100 °C for 1 h prior to the deposition of the next layer. Following the deposition of the three layers, the film was annealed at 550 °C for 4 h. The preparation of the nanofilm, its characterization (the crystalline structure, crystalline phases composition, the surface topography, the roughness of the TiO2 film, and the grain size distribution of the TiO2 film), and immobilization are described in detail in [46,47].
A schematic drawing of the experimental set-up is shown in Figures S1 and S2. Six UV-LED strips were attached to the support as external vertical columns of diameter = 60 mm. The light sources were all facing towards the cylinder’s central axis and their distribution was radially symmetric, with intervals of 60°. Using the control board, it was possible to turn on all six LED columns simultaneously or half of them (just UV-A or just UV-C). Each LED column had 125 mm of height. The UV-A strip contained 15 LED sources, spaced vertically by 8.3 mm, while the UV-C strip contained eight LED sources, spaced vertically by 16.6 mm. A UV-A strip was always positioned between two UV-C strips. Each column could be easily (dis)attached to the system, so at any moment it was possible to decide how many UV-C and UV-A strips were illuminating the reaction. A detailed description of the experimental set-up can be found in the previous work by [38].
UV-LED strips in the UV-A range (365 nm) and UV-C range (272 nm) were provided by Waveform Lighting (Vancouver, WA, USA). Photometric specifications, emission spectrum, dimensions, and other data are available in the product’s specification datasheet [48,49] (summarized in Table S2). The LED strips were connected to an Arduino Pro Mini microcontroller coupled with IRFZ44 N MOS-FETs. It was possible to control the duty cycle of the LEDs using the pulse-width modulation script on the Arduino that was 490 Hz [50]. The output power of the system was measured by the +UT230B power meter by UNI-Trend Technology (Dongguan, China).
All experiments were performed in a dark room. The temperature of the reaction solution remained at (21.0 ± 2.0) °C throughout the experiments.
The list of acronyms used for the experimental set-ups can be found in Table S3.

2.4. Analytical Determination

To determine the degradation rates of CIP, TMP, SMX, VX, and DV, the samples were directly analyzed by HPLC-PDA (Waters 2795 Alliance HPLC System with 2996 PDA-Detector) and Masslynx software provided by Waters (Milforn, MA, USA. The separation was carried out with a Kinetex C18 column (150 mm × 4.6 mm, 5 mm, 100 Å, Phenomenex). The mobile phase was composed of 0.1% formic acid in ultrapure water (A) and 0.1% formic acid in acetonitrile (B). The initial volume proportion of eluents was A:B = 89:11 (v/v) until t = 13.5 min. From that point until t = 15.0, linear gradient elution was applied and the proportion of A:B = 83:17 (v/v) was achieved, which was kept constant until t = 25 min. At this point, the mobile phase composition had a step change back to the initial one (11% B) until the end of elution, at t = 28 min. The flow rate was 1.0 mL min−1. The column temperature was 20 °C. The volume analyzed for each sample was 20 μL. CIP, TMP, SMX, VX, and DV were detected at the wavelength of 278.8 nm, 273.8 nm, 269.8 nm, 274.8 nm, and 274.8 nm, respectively. The retention time of each compound (in minutes) was 11.3 (CIP), 6.3 (TMP), 19.4 (SMX), 23.0 (VX), and 9.6 (DV). The calibration curve was linear between 0.2 mg L−1 and 2 mg L−1, with R2 > 0.995.
Toxicity tests were performed according to the standard bioluminescent method described in ISO 11348-3:2007 standard with fresh Vibrio fischeri bacteria. Lyophilized bacteria were obtained from Hach Lange (luminescent bacteria test LCK 484, Dusseldorf, Germany). Bacterial luminescence measurements were performed on a LUMIStox 300 Hach Lange instrument (Dusseldorf, Germany) with a thermostated LUMIStherm block for incubation of bacteria. Luminescence was monitored initially and after 30 min as a parameter indicating toxicity or inhibition. All measurements were performed at an instrument operating at a temperature of (15 ± 1) °C.
Total organic carbon (TOC) was measured by the TOC analyzer, type TOC-VCPH, Shimadzu Co. (Kyoto, Japan). [51].

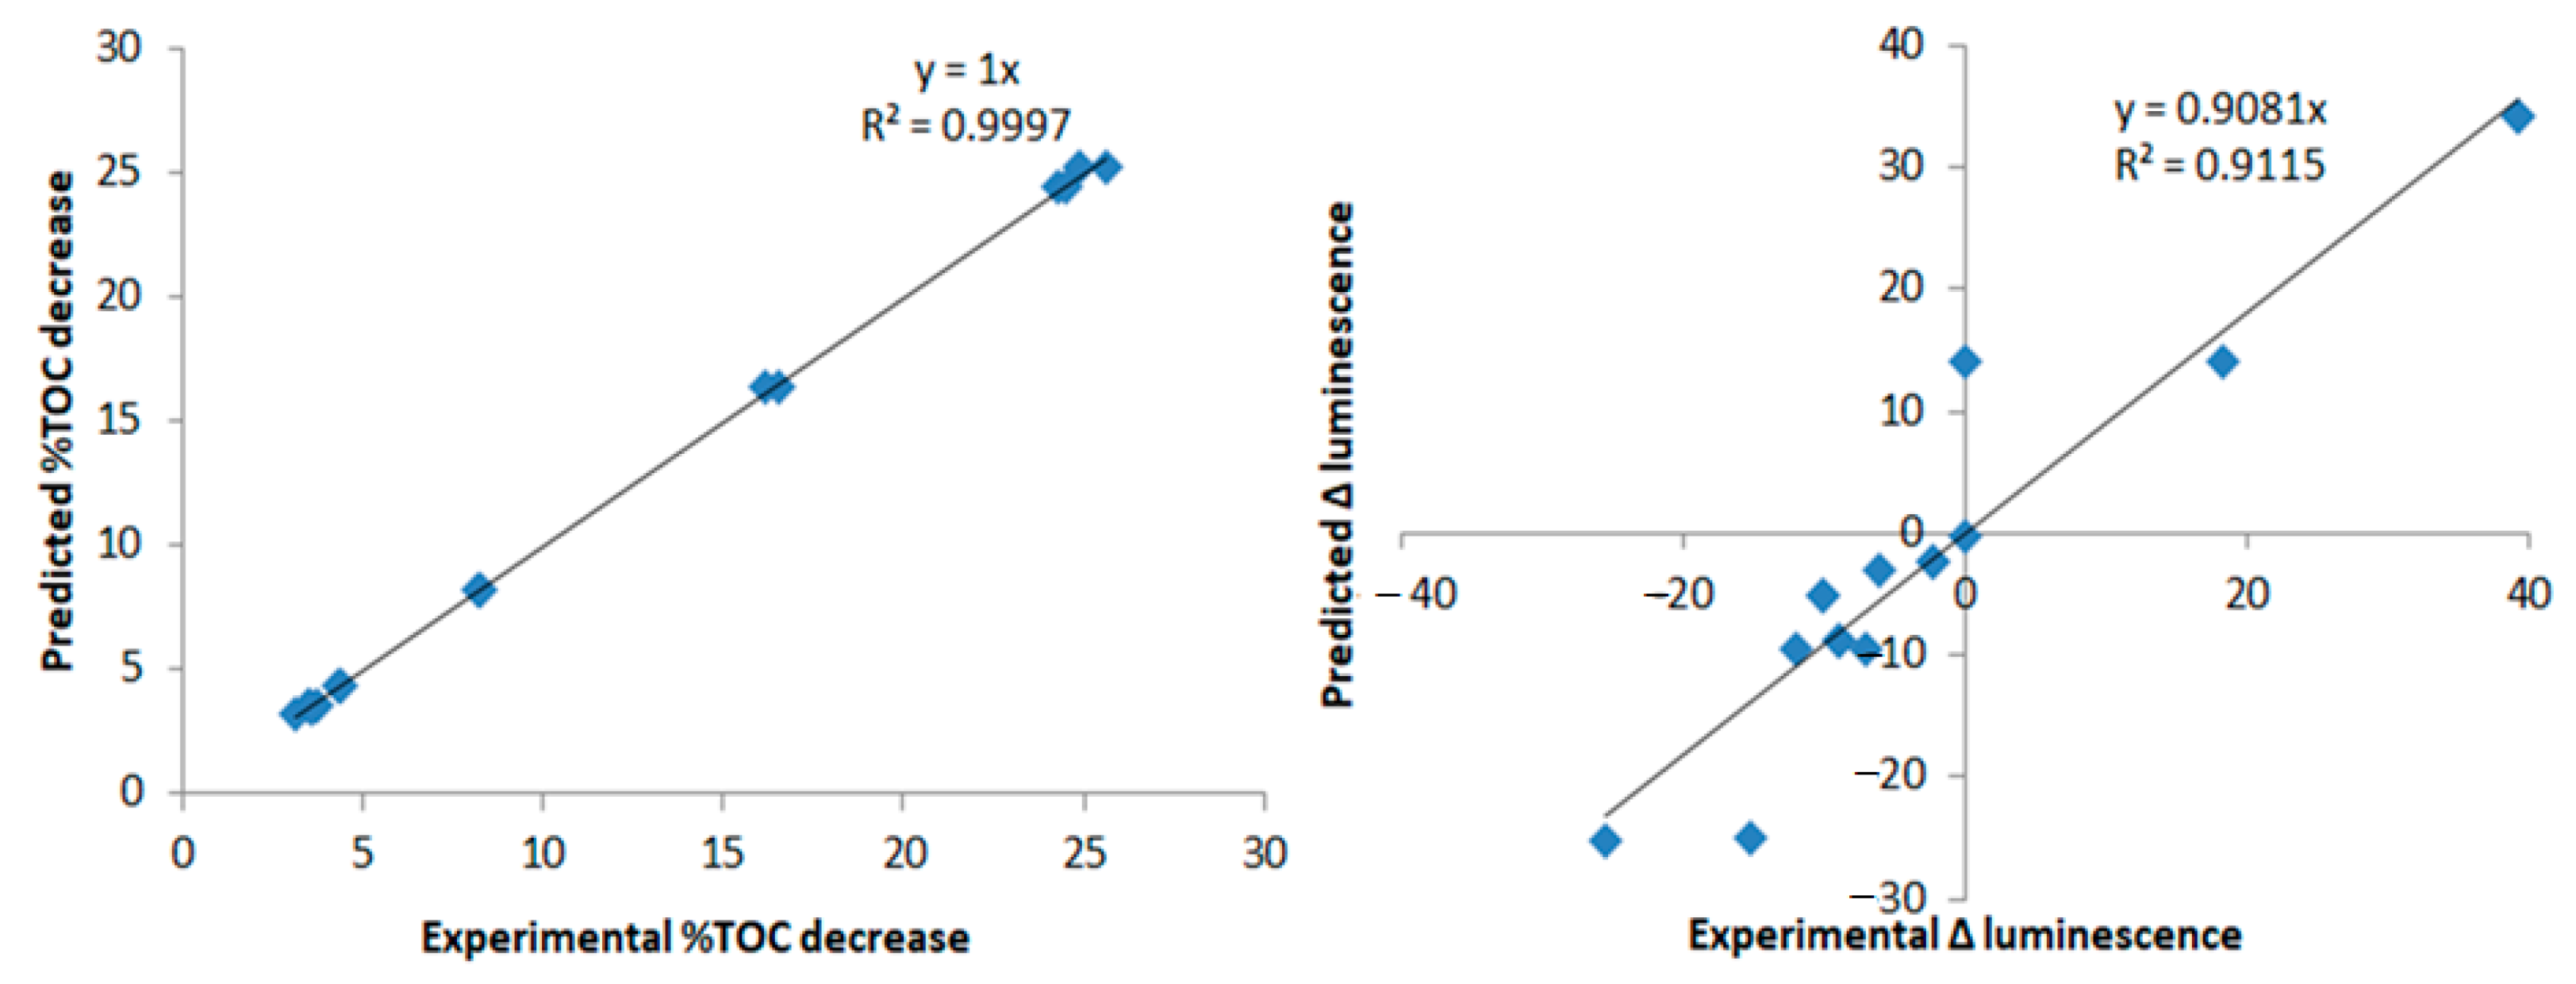
2.5. Design of Experiments

Two DoEs were prepared using Design Expert software (version 12), Stat-Ease, Minneapolis, MN, USA). In the first DoE, the full factorial design (24 = 16 experiments) with categorical variables was used to investigate the effect of process variables and matrices on PhAC degradation efficiency. Table 1 shows its independent variables. The dependent variables were the kapp for each of the five PhACs, TOC removal (after 60 min of illumination time), and the Δ luminescence (difference between final and initial Vibrio fischeri luminescence). Pareto charts representing the significance of each effect were obtained. The initial concentration of each PhAC in the mixture was 2 mg/L. Although this value is higher than the range typically found in waterbodies [7], it was adopted for easier monitoring and easier evaluation of the influence of the investigated parameters.
The purpose of DoE is to obtain an empirical mathematical model to predict the outcome of a dependent variable in reference to a group of independent variables and to quantify the significance of each of these independent variables (or their combination) to the outcome. The relationship between response Y and the independent coded parameters Xi could be estimated by the first order polynomial model, as shown in Equation (3). It must be stated that, when working with categorical variables (e.g., presence or absence of catalyst, matrix as MQ water or tap water), Equation (1) is not valid for any coded values except −1 and +1.
Y = β 0 + β 1 X 1 + β 2 X 2 + β 3 X 3 + β 4 X 4 + β 5 X 1 X 2 + β 6 X 1 X 3 + β 7 X 1 X 4 + β 8 X 2 X 3 + β 9 X 2 X 4 + β 10 X 3 X 4   + β 11 X 1 X 2 X 3 + β 12 X 1 X 2 X 4 + β 13 X 1 X 3 X 4 + β 14 X 2 X 3 X 4 + β 15 X 1 X 2 X 3 X 4    
In this study, the dependent variables are the first order apparent degradation constant rate (kapp) for each PhAC, the abatement percentage of total organic carbon (%TOC decrease), and the difference between final and initial Vibrio fischeri luminescence of the effluent (Δ luminescence,) representing toxicity. The independent variables and their range of study are arbitrarily chosen based on what the authors want to investigate (see Table 1 for the independent variables and their tested range). A full factorial design with two levels requires experimental data of all possible combinations of independent variables in their minimum and maximum range (coded values −1 and +1). For four variables, this demands 42 = 16 experiments. Each one of the βi coefficients obtained represents the intensity of the effect of each independent variable (or their combination), as well as if the latter will increase (positive effect) or decrease (negative effect) the dependent output. A positive effect for combined variables means that either the simultaneous increase or decrease of both variables will increase the outcome of the dependent variable (because the result of multiplying two positive or two negative numbers is positive), while increasing one of the independent variable’s coded values and reducing the other will result in a decrease of the outcome of the dependent variable (because the product of a positive and a negative number is negative). The Design Expert software provides all βi coefficients side by side in a Pareto chart. The effects beyond the t-value limit are considered significant by an analysis of variance (ANOVA) with 95% confidence and are included in the final model. Effects beyond the Bonferroni limit are strongly statistically significant corrected for multiple testing.
A second DoE was performed to investigate the effect of matrix components on the degradation rate constants of investigated PhACs. A randomized response surface Box–Behnken design with 16 runs was made with three independent variables on three levels (Table 2). The obtained F-values, representing the significance of each effect, were analyzed. The software also provided surface graphs of the system and the ANOVA analysis of coefficients.
The concentration ranges of bicarbonates and nitrates were loosely based on their common concentration in tap water, as well as their regulation limits (50 mg/L for nitrates) [52]. As to humic acid, the range of values was arbitrarily set to simulate the effect of the presence of organic matter in the matrix. The kapp of each of the five PhACs was set as the dependent variable. UV-A photocatalysis experiments were performed with the original mixture of five PhACs in MQ water. Choices of square root transformations and different fits (linear or quadratic) were made to increase the adjusted and predicted R2 values. The initial concentration of each PhAC in the mixture was 2 mg/L.

2.6. Electrical Energy per Order (EEO) Analysis

EEO is a figure of merit defined by [53] as the amount of energy (kWh m−3) required to degrade 90% of a target pollutant in 1 m3 of water [54]. It can be obtained via Equation (2) [53], in which t is the amount of time (min) required to reach 90% degradation, P is the power output of the system (W), and V is the reaction volume (L) of the system [22,29,55].
E E O = P   · t V · 60
Following the same deduction from a previous work [38], the EEO can be calculated for each PhAC using Equation (3):
E E O ( kWhm 3 ) P h A C = l n 0.1 k a p p   ( min 1 ) P h A C · P   ( W ) 0.14   ( L ) · 60
P is obtained from the power meter read. The average reactor volume during the experiments is V = 0.140 L, considering the volume variation caused by sample collection. When the kinetic constant kapp (min−1) is obtained, it is possible to calculate t for 90% of degradation (C/C0 = 0.1) by solving the first order kinetic equation (ln(C/C0) = kapp·t). When no reaction takes place (kapp = 0) for a given PhAC, EEO is theoretically infinite.

3. Results and Discussion

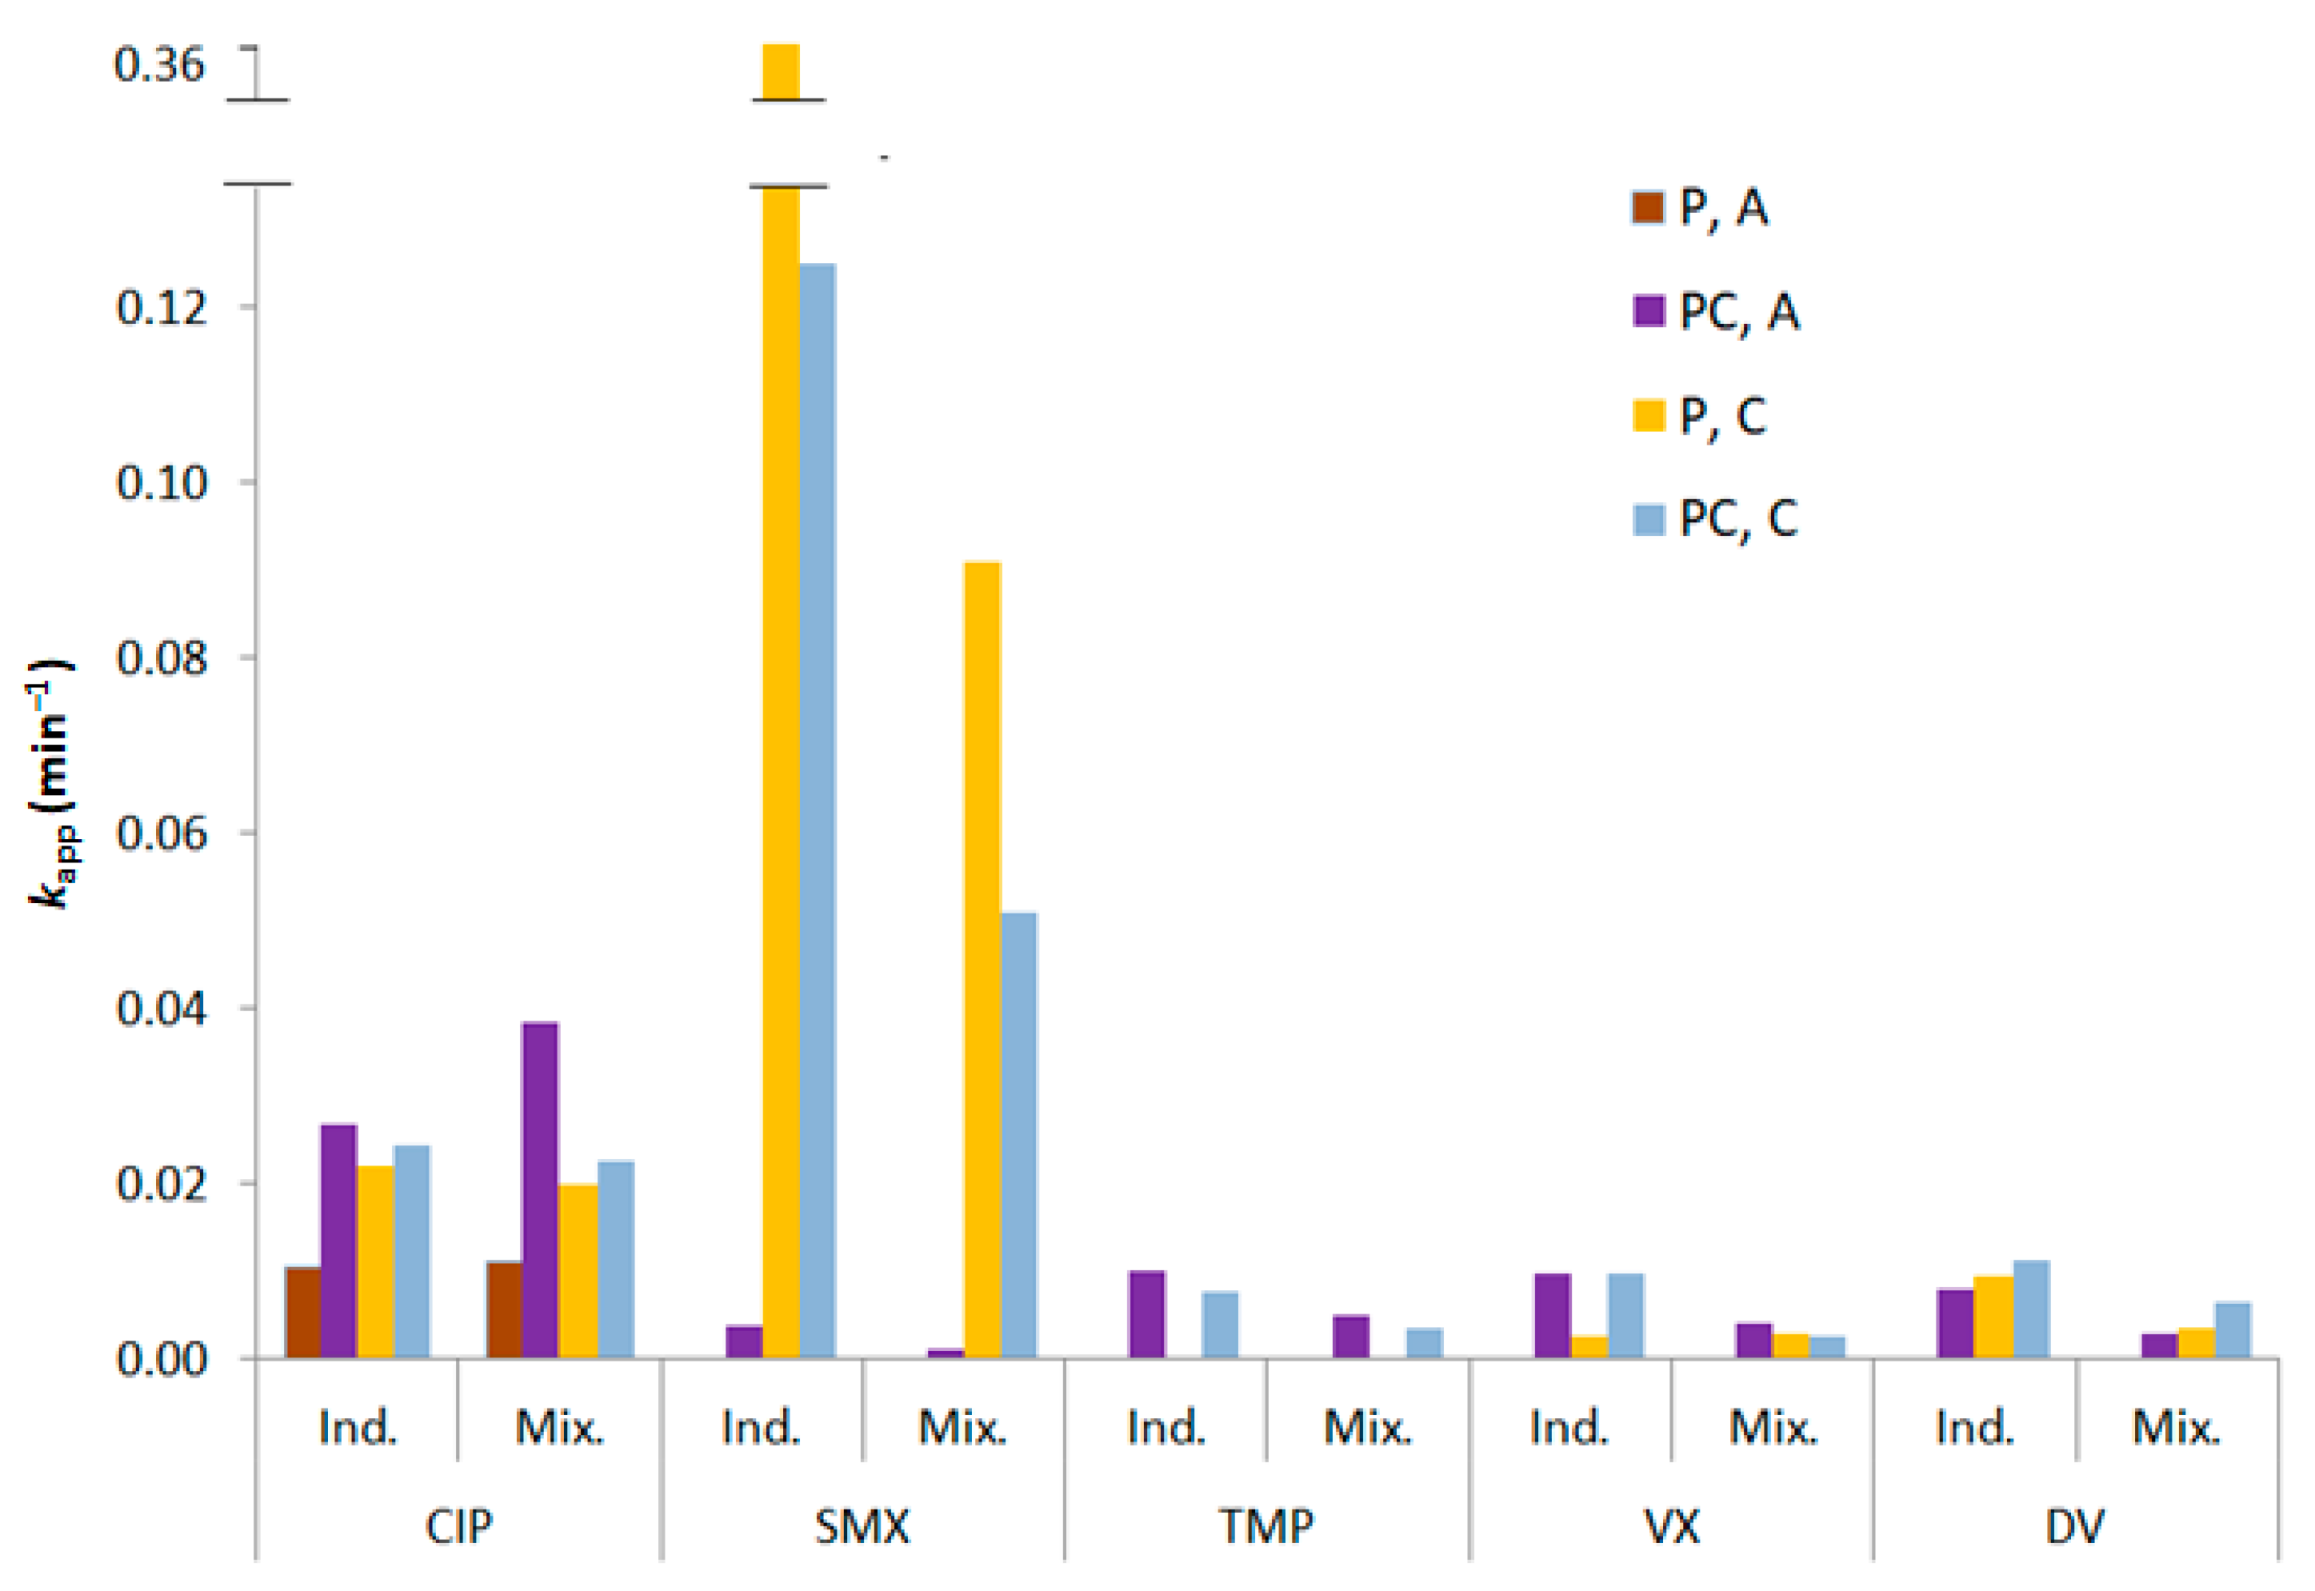
3.1. PhAC Degradation: Individually and in a Mixture

Figure 1 shows the kapp values for the degradation of the five PhACs tested individually and in a mixture, in MQ water. Figure S3 shows degradation profiles for the individual degradation experiments. It can be observed how the pollutants were degraded differently in the treatments. The degradation depends on: (1) the types and amount of available oxidative species; (2) the PhACs’ respective reactivity with each of the generated oxidative species [5]; (3) the interaction between the PhACs and the catalyst surface (adsorption) [56]; (4) the ionic state of each PhAC in solution (there might be distinct reactivity for the same parent compound for both photolytic and photocatalytic routes); (5) PhAC absorption spectrum and quantum yield for a given wavelength (specific for photolysis) [57,58]. Most of these points depend, directly or indirectly, on the matrix composition and pH [59].
The only compound degraded by UV-A photolysis was CIP. The fastest degradation was for SMX during UV-C photolysis, attaining better kapp results without the catalyst. A possible explanation is that TiO2 nanofilm may cause a screening effect, given that UV-C light has lower penetration capacities than UV-A [60]. Since UV-C photolytic degradation for SMX was already very fast (complete degradation in less than 45 min in the individual test), the presence of the TiO2 nanofilm hinders the direct contact between SMX and photons, and the increase in degradation provided by ROS production does not compensate for the losses in available photons for the direct photolysis faster degradation route [61,62]. TMP, VX, and DV had lower degradation rates overall, with kapp values below 0.01 min−1. TMP was completely impervious to both UV-A and UV-C photolysis.
When considering PhAC mixtures, the kapp of four compounds (SMX, TMP, VX, DV) decreased by an average of 50%. This is expected considering that a higher amount of pollutants lowers the availability of degradation agents, such as radicals and photons [33,63]. Conversely, a 40% increase in UV-A degradation of CIP was observed in the presence of the catalyst when CIP was mixed with the other compounds. This behavior can be related to the solution pH of 6.0 in the case of CIP-only experiments and of 6.7 in the mixture (Table S4, experiments 1–20 for individual PhACs and 24–27 for PhACs mixture). In fact, the ionization state under a given pH should be considered. CIP has a pKa of 6.08 [63], predominantly being cationic at pH below that value and neutral above it until pH = 8.4 [44,63]. The ionization state interferes with the reactivity of the molecules with photons and radicals, as well as the adsorption rates at catalysts’ surfaces and, hence, it can be related to photolytic and photocatalytic degradation rates [64]. The cationic state of CIP is reported to have lower degradation rates for both photolysis and photocatalysis [63], and since the ionic state shifts from cationic to neutral around the tested pH range (Table S3), this can explain the kapp increase. The pKa values of TMP, SMX, VX, and DV are 7.1 [64], 5.6 [65], 9.0 [66], and 9.0 [67], respectively. Among these, the only compound with a shift of ionic states in the tested range was SMX. The fact that this compound is depleted faster in its neutral state (pH < 5.6) [65] further explains why its kapp was so high in the individual experiments.
TiO2′s point of zero charge is 6.3 [68], and the strength of its interaction with each molecule will depend on the ionic state of both the molecule and the surface of TiO2. Although the affinity between the PhACs and TiO2 surfaces is a relevant parameter for photocatalytic routes, the catalyst surface area was much smaller than in the case of porous catalysts given that immobilized TiO2 was used in this research [14]. Thus, the adsorption mechanisms were not as prominent as the ones taking place in the bulk of the solution because even if the surfaces attract each other strongly, the available area of the catalytic site was still small. This being so, when immobilized catalysts are used, the ionization state can play a bigger role in the photolytic rates [22,69,70]. Since photolysis takes place in the bulk of the reactor, it does not rely on adsorption phenomena and it is not limited by mass transport [71]. For photocatalytic routes with immobilized catalysts, the prominence of other factors, such as the amount and type of generated ROS, can be of more relevance.

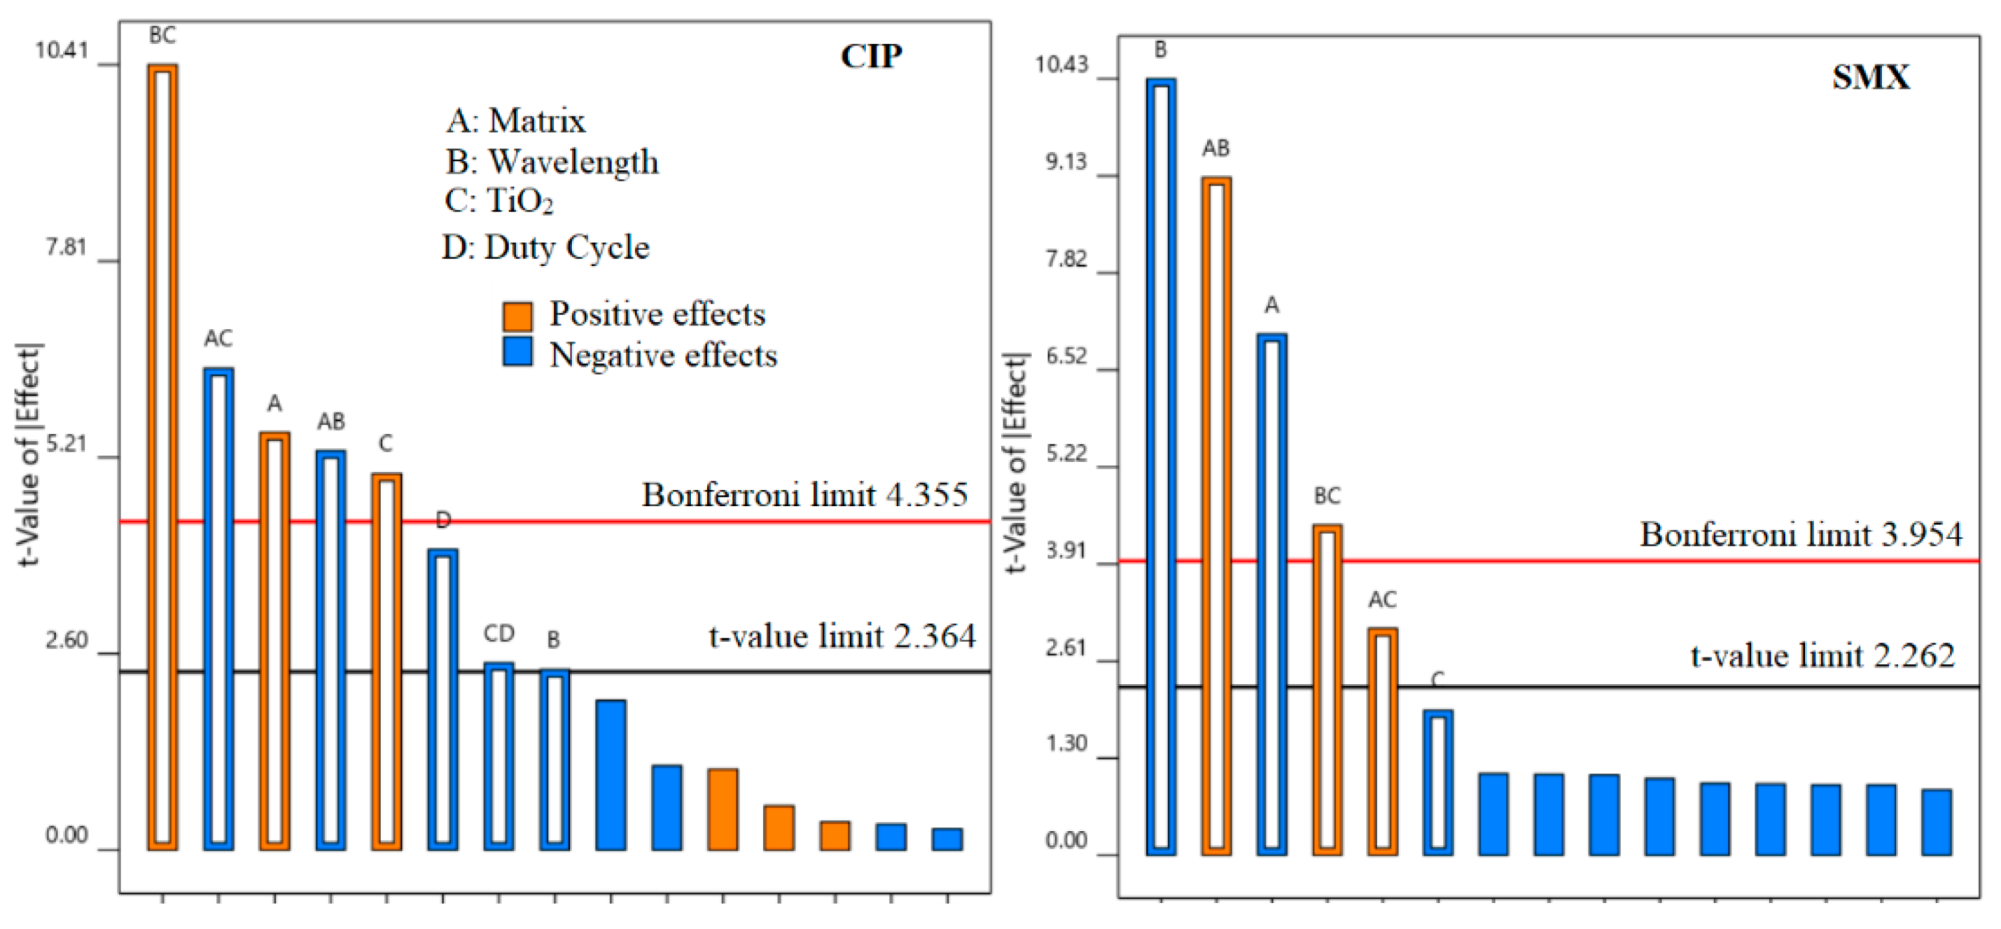
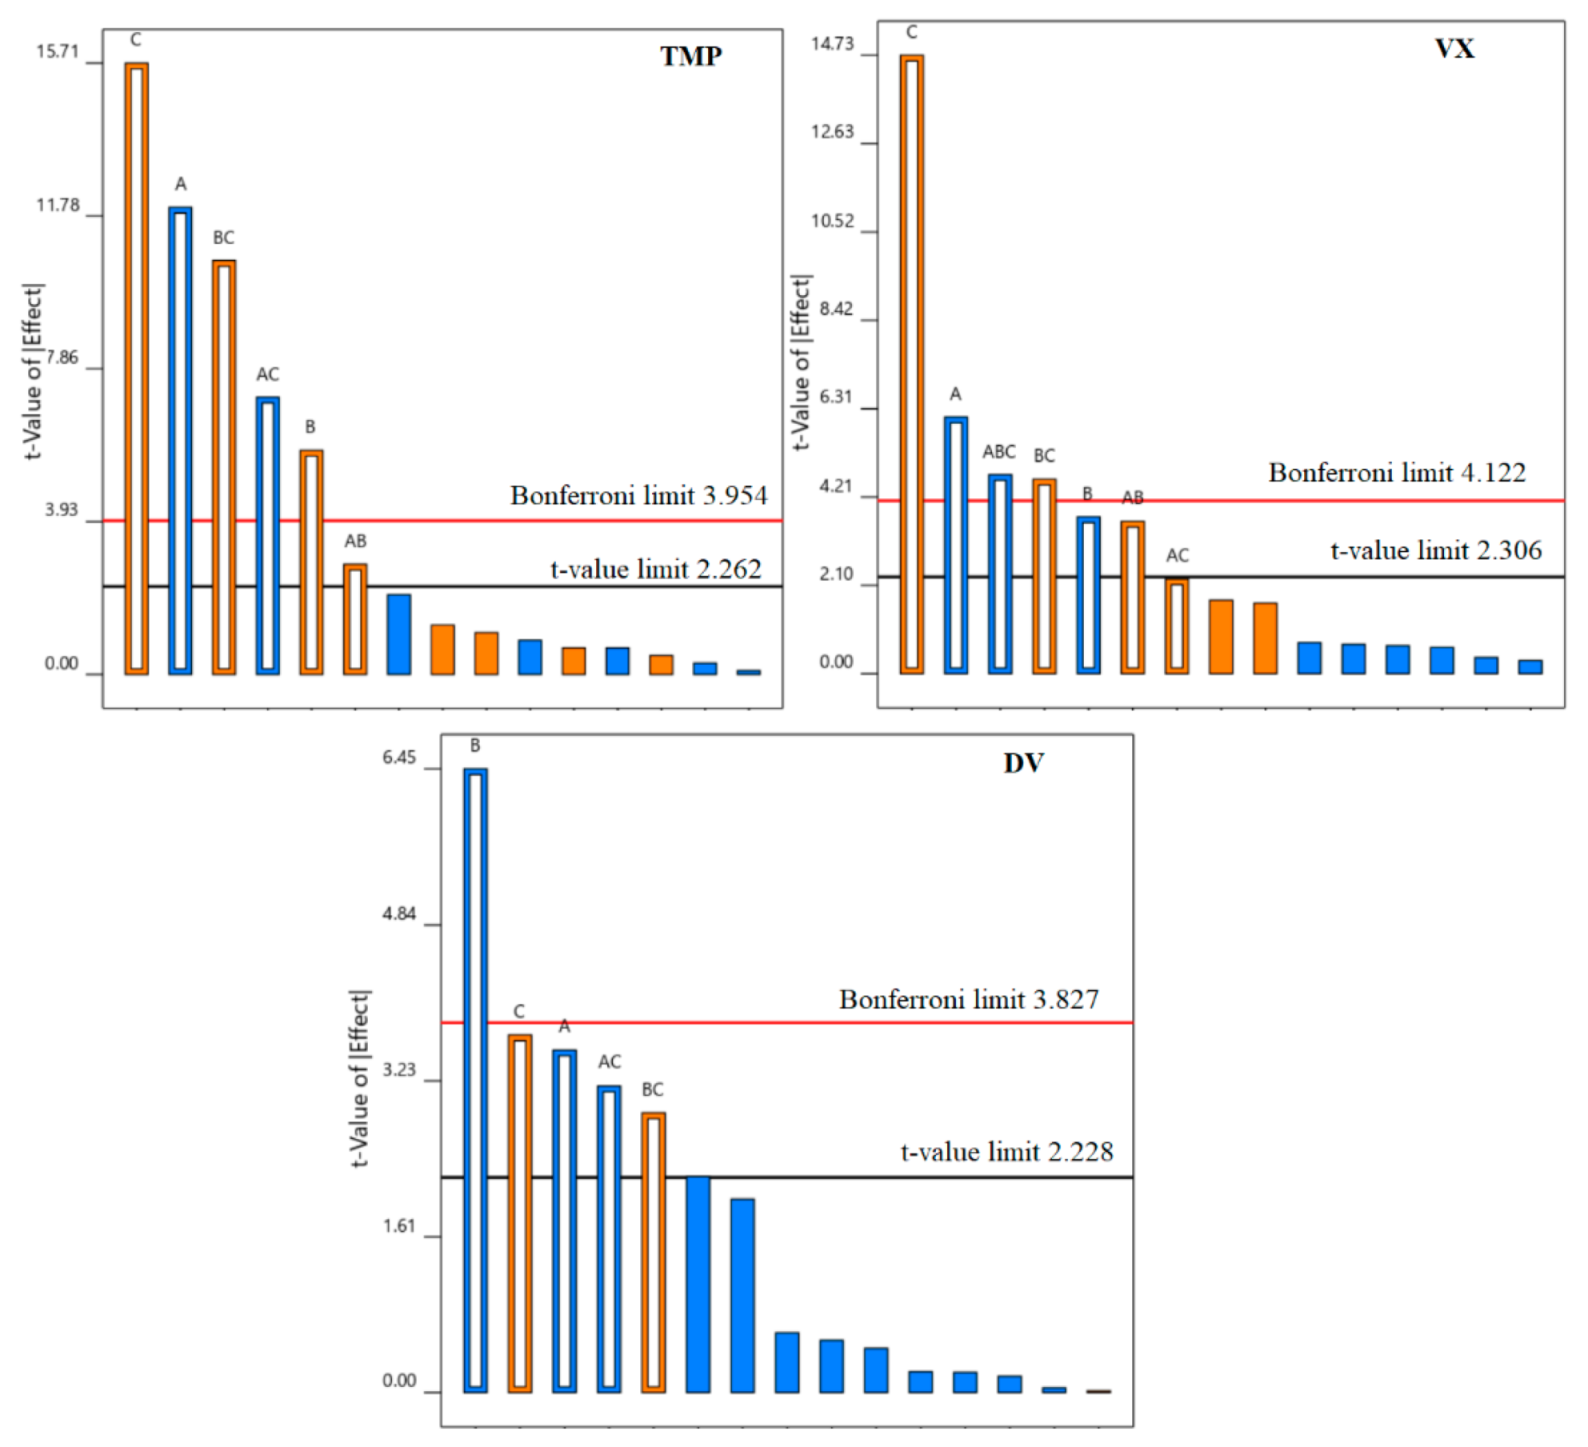
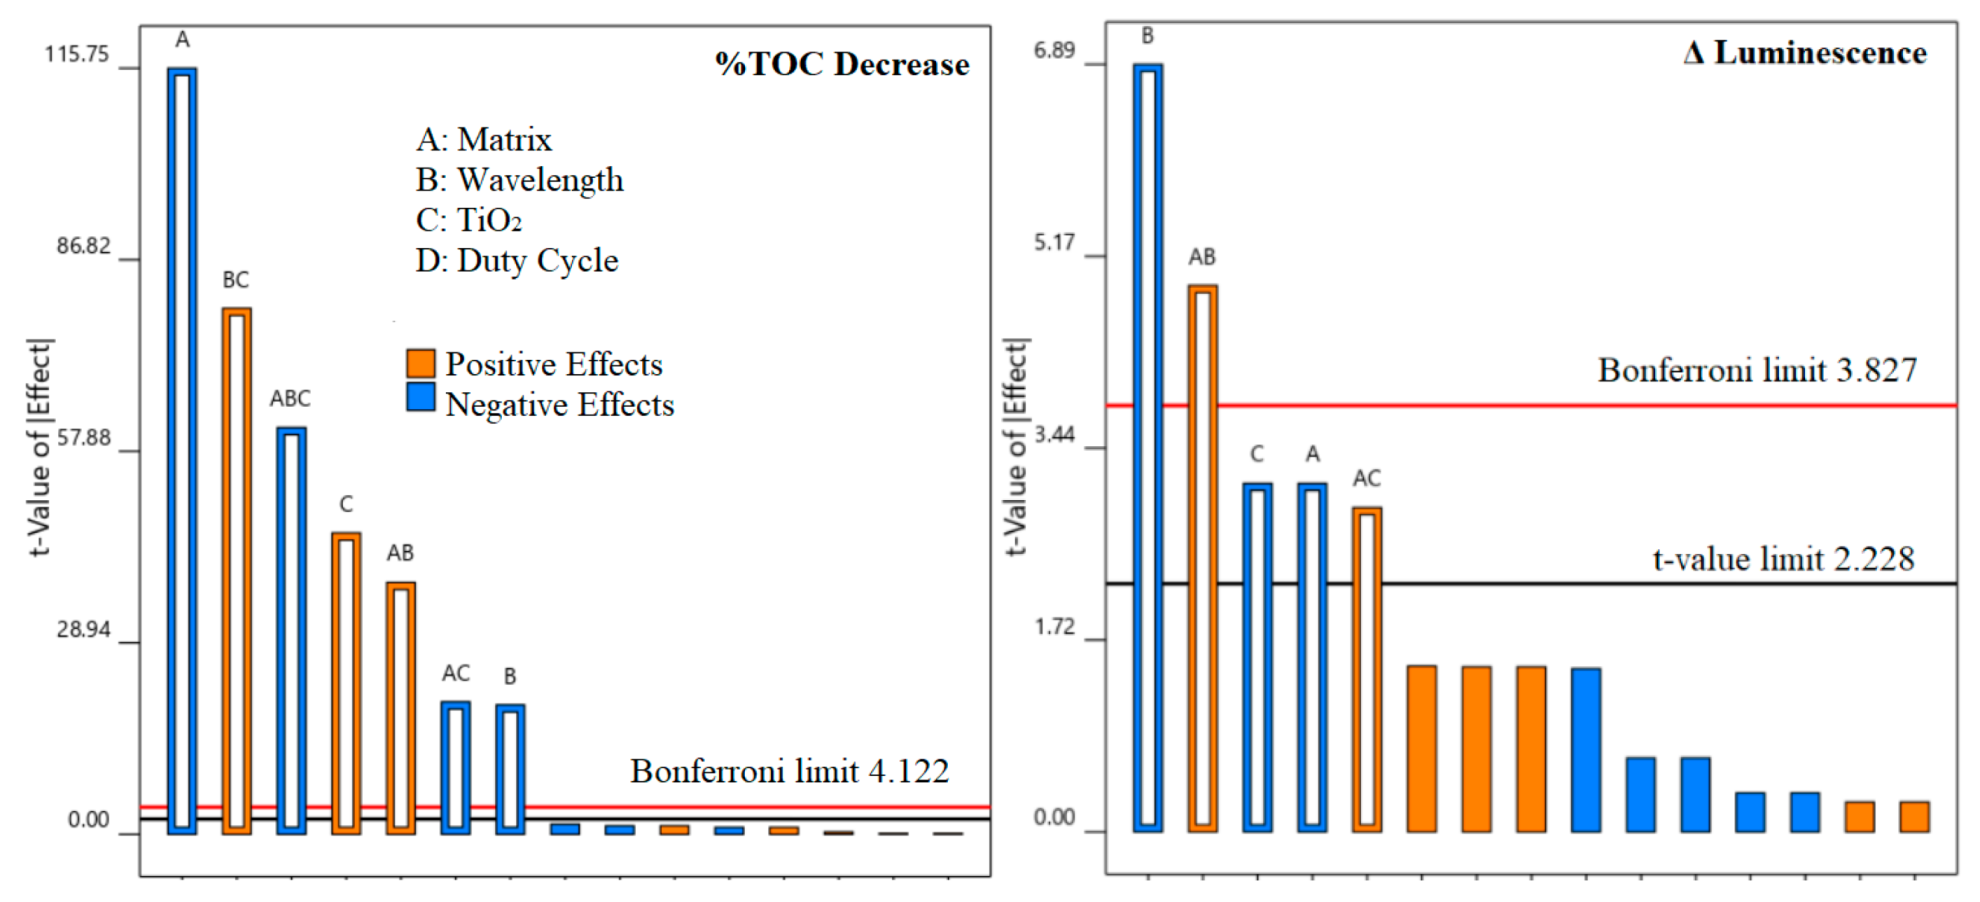
3.2. The Effect of the Catalyst, Light Wavelength, Controlled Periodic Illumination, and Matrix

A full factorial design investigated the effect of process variables on the efficiency of PhAC photolytic and photocatalytic degradation and the degradation rate constant; the %TOC decrease and the Δ luminescence were evaluated.

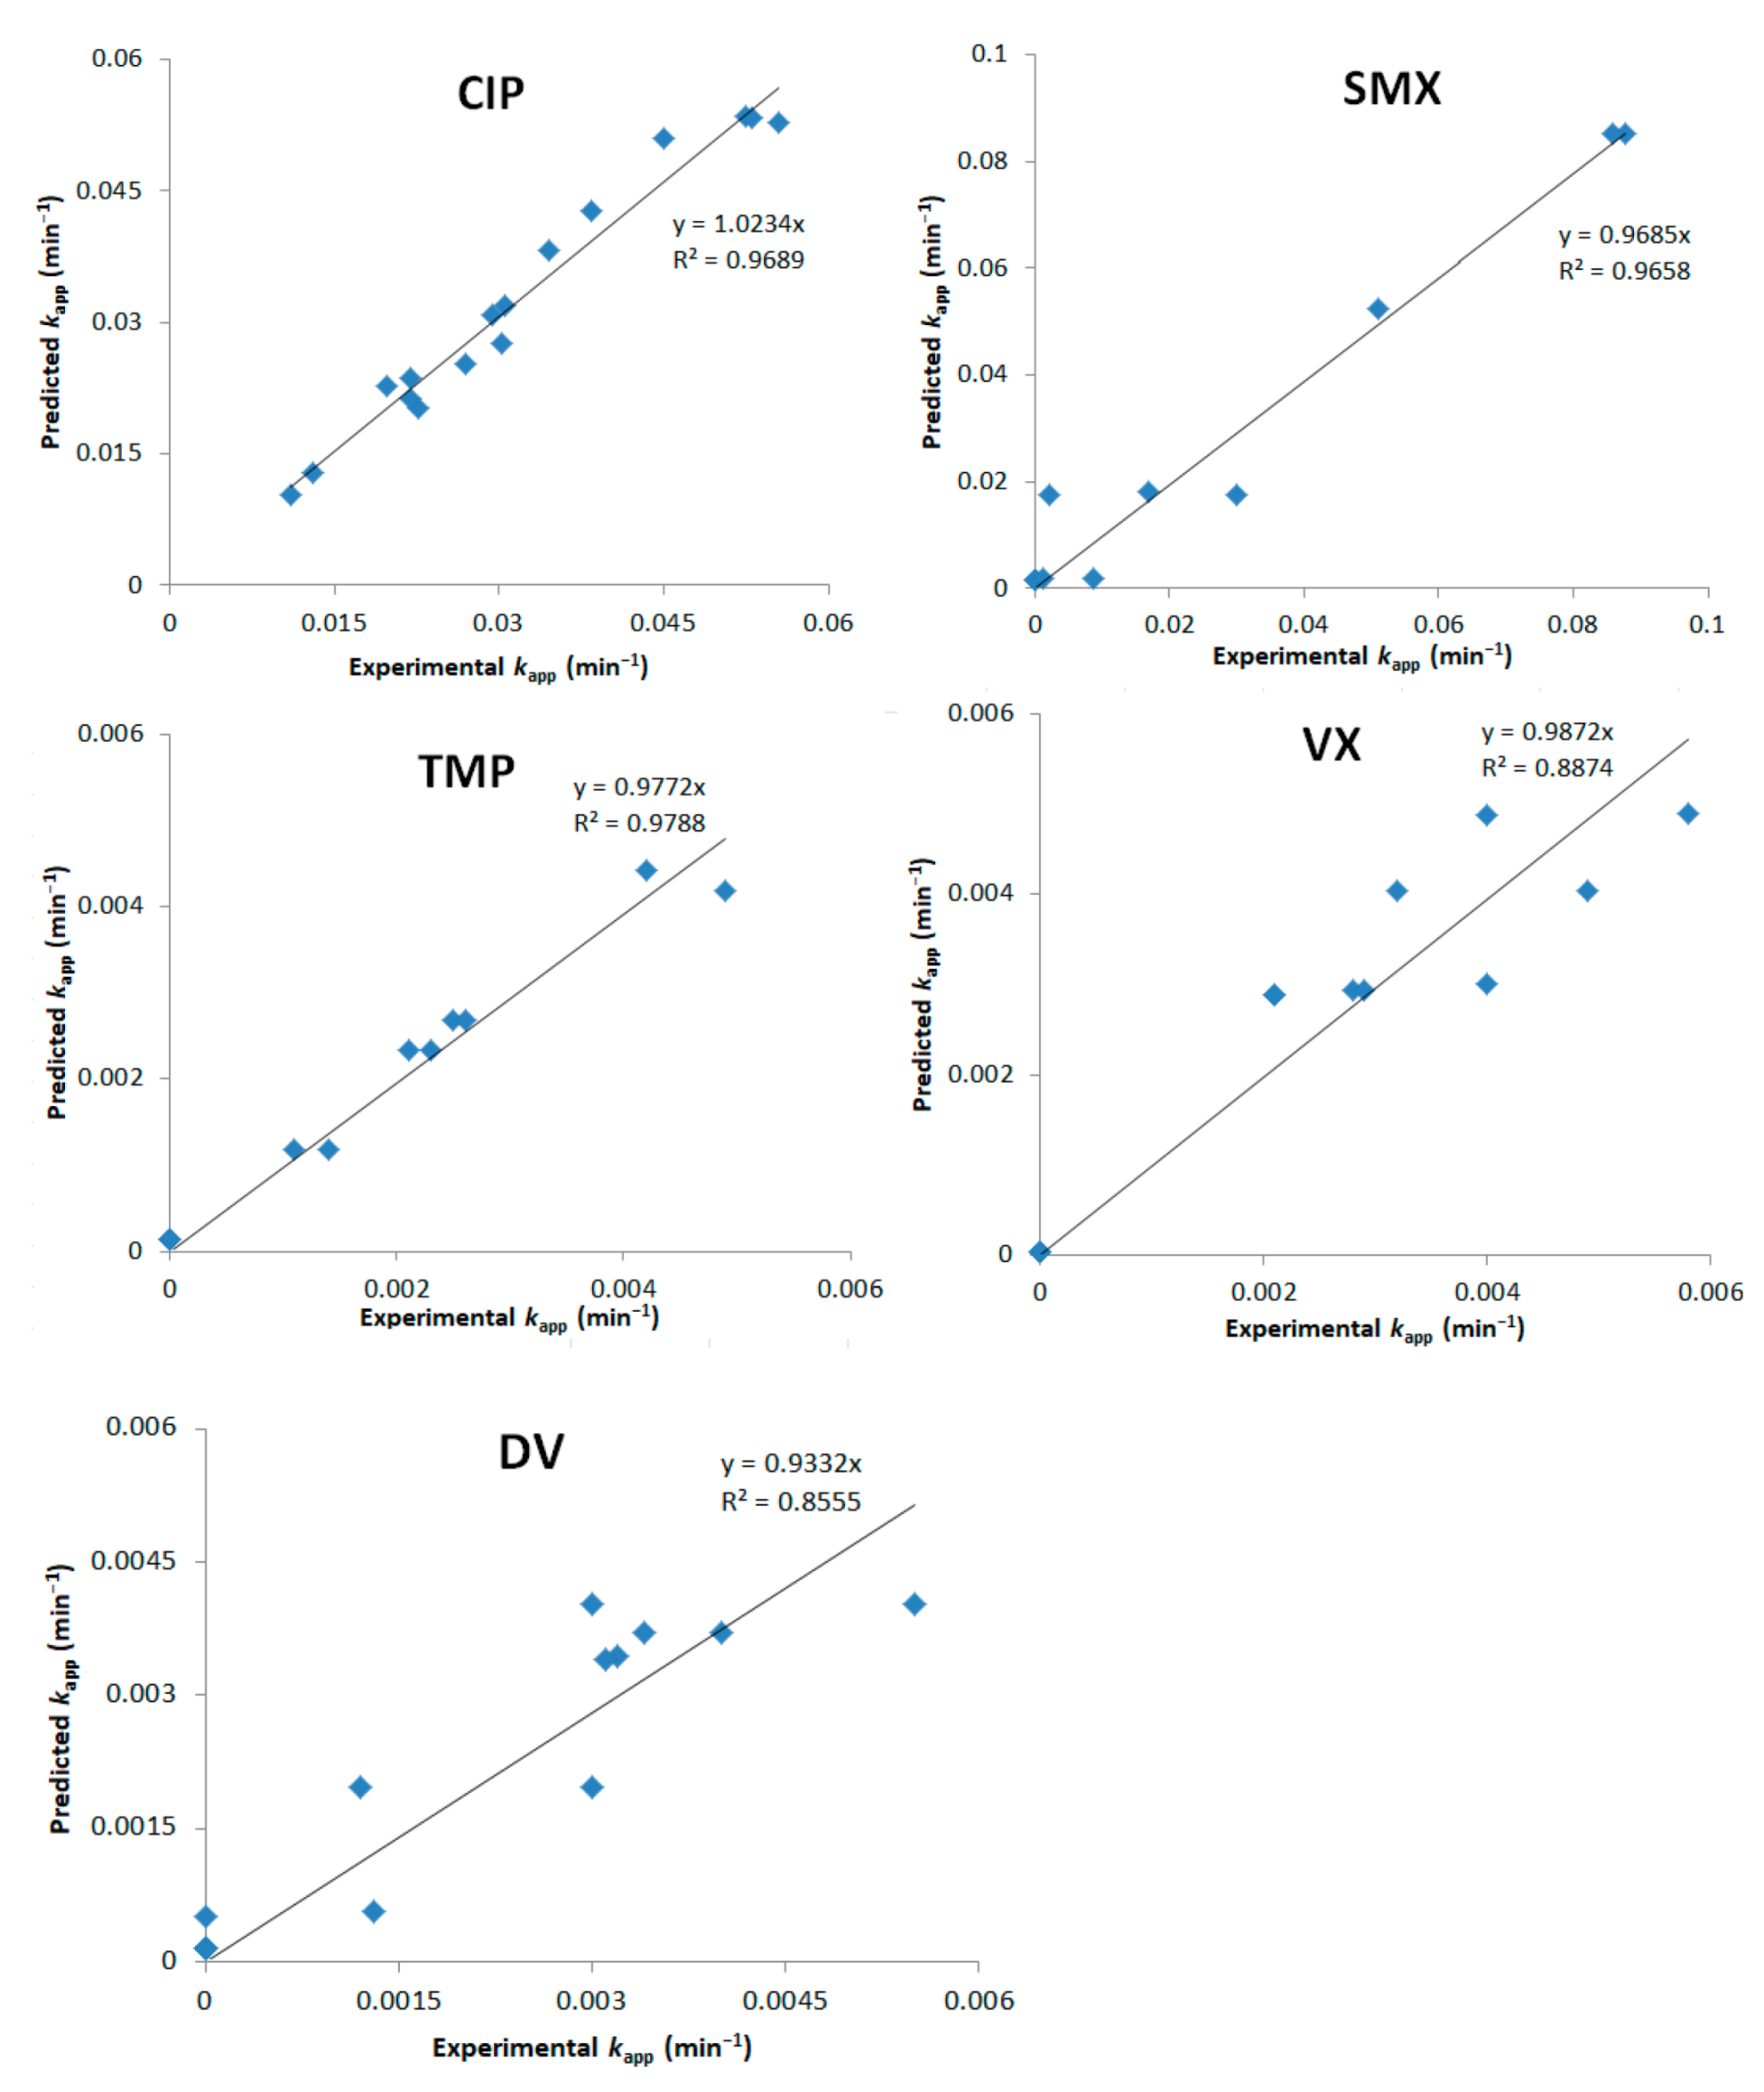
3.2.1. kapp Analysis

The list of experiments and the obtained results (kapp) for the full factorial design are presented in Table S4 (experiments 24–39). Based on these data, the coded Equations (models) (4)–(8) were obtained for each of the five PhACs by selecting the effects with p-value > 0.05 and those necessary by the hierarchy, as calculated by the software (Design Expert 12).
k a p p ( C I P ) = 0.0317 + 0.0046 A 0.0020 B + 0.0041 C 0.0033 D 0.0044 A B 0.0053 A C + 0.0086 B C 0.0020 C D  
k a p p ( S M X ) = 0.0225 0.0122 A 0.0182 B 0.0034 C + 0.0159 A B + 0.0053 A C + 0.0077 B C
k a p p ( T M P ) = 0.0013 0.0008 A + 0.0004 B + 0.0010 C + 0.0002 A B 0.0005 A C + 0.0007 B C
k a p p ( V X ) = 0.0368 0.0097 A 0.0060 B + 0.0235 C + 0.0059 A B + 0.00359809 A C + 0.0074 B C + 0.0076 B C
k a p p ( D V )   = 0.0408 0.0111 A 0.0202 B + 0.01157 C 0.0100 A C + 0.0091 B C
Figure S4 shows the ANOVA results provided by the software, confirming that all obtained models are all significant. The Pareto charts for all the compounds are shown in Figure 2.
BC, significant for all PhACs, represents the combined impact of wavelength (B) and catalyst presence (C). The best results were obtained with the catalyst combined with UV-A or when no catalyst was used in the presence of UV-C. This is explained by the fact that, on the one hand, UV-A rays were not able to degrade the tested PhACs by means of photolysis alone (except CIP). On the other hand, UV-C rays are highly capable of photolytic degradation but suffer from a strong screening effect in the presence of the catalyst. The overall results indicate that the enhancement obtained by the presence of the catalyst, when UV-C was used, did not compensate for the photo absorption losses by the system.
The influence of the matrix (A) was significant in all the cases. Tap water contains many ions (Table S1) which can influence the degradation positively or negatively [16]. The difference in the pH between tap and MQ water can also impact the degradation rates [63]. All compounds degraded slower in tap water due to the presence of scavengers. The only exception was CIP, due to the already mentioned more reactive neutral ionic state of this molecule at pH > 6.08 (see Section 3.1 and Section 3.4). Tap water could simulate better than MQ a post-treatment for specific water treatment and reuse goals [34,37].
The duty cycle (D) had a significant impact only on the kapp of CIP. This result is in accordance with Figure 1, since CIP was the compound with the fastest reactivity towards ROS in the mixture, and the radical enhancement, caused by the lower duty cycle, should favor CIP degradation. The combined effect CD (catalyst presence and duty cycle) was also significant, given that any improvement related to lower duty cycles can only take place when the catalyst was used [38]. Controlled periodic illumination reduces charge careers recombination at the catalyst’s surface and can increase photocatalytic rates. The formation of ROS in the presence of light, in fact, takes place in femtoseconds (10–15 s), while their subsequential reactions with pollutants are much slower (6–10 s). Light does not have to be present in this slower stage for the reaction to be effective, so flicking the lights at high frequencies (500 Hz) improves the overall photonic efficiency of photocatalysis. A deeper explanation of the mechanisms of controlled periodic illumination can be found elsewhere [71,72]. The significance of the catalyst presence (C) was lower for CIP than for other PhACs, since CIP was the only compound degraded by UV-A photolysis alone.
The wavelength was the most significant effect for SMX, which is quickly degraded by UV-C photolysis alone. The matrix effects played a more significant role for SMX than for CIP, since the performance of UV-C is more sensitive to the changes in the matrix components and lower wavelengths are more easily absorbed [33]. SMX experiments confirm that different results can be obtained as a function of both the pollutant and the applied treatment.
TMP, VX, and DV reacted slowly at both photolytic and photocatalytic routes. The change in the matrix from MQ to tap water made the few agents capable of their degradation quickly unavailable and hindered the process considerably. Since TMP and VX did not degrade with photolysis alone, the presence of the catalyst was the most significant factor in increasing their degradation rates. For DV, the fastest degradation happened under lower wavelengths (UV-C).
Plots comparing experimental kapp values with the ones predicted by Equations (4)–(8) are shown in Figure 3. It can be observed that VX and DV did not have a correlation model as good as the other tested PhACs. Possible explanations are the influence of other significant factors in the degradation of these compounds, such as the presence of degradation products and pH, which were not evaluated in the DoE.

3.2.2. Total Organic Carbon and Toxicity Analysis

Since each compound may react differently, %TOC decrease can give a more comprehensive perspective of the degradation capability of the evaluated treatments. Equation (9) shows the obtained model from DoE. Figure 4 shows its correspondent Pareto chart.
% T O C   d e c r e a s e = 11.1187 6.1812 A 1.0437 B + 2.4312 C + 2.0313 A B 1.0688 A C + 4.2438 B C 3.2813 A B C
DoE analysis showed that the matrix (A) was the most significant effect in the Pareto chart for the overall degradation, expressed as %TOC decrease (Figure 4). Photocatalysis, like most AOPs, is highly dependent on matrix characteristics, and faster degradation is usually observed in MQ than in real matrices, which highlights the importance of pre-treatments for better performance [13]. Just like for individual PhACs, the BC (wavelength and catalyst presence) factor was highly significant and the highest mineralization rates were obtained with UV-A and a catalyst or UV-C without a catalyst. All effects involving duty cycle were not significant.
As regards toxicity, Equation (10) shows the obtained mathematical model, and its Pareto chart is also shown in Figure 4.
Δ   Luminescence = 0.6938 5.2188 A 11.4938 B 5.2188 C + 8.18125 A B + 4.8562 A C
UV-C light was the main factor reducing toxicity. Conversely, the toxicity increase observed with UV-A can be credited, among other things, to transformation products of CIP that are more toxic than the parent compound [20]. The presence of the catalyst had a negative effect, contributing to the increase in the toxicity of the final effluent. A cleaner matrix (MQ water) was able to attain lower final toxicity levels because it allowed a faster degradation not only of the target compounds but also of degradation by-products, as demonstrated by the highest mineralization (TOC decrease) rates in MQ water.
Figure 5 shows the model prediction for %TOC decrease and Δ luminescence, based on Equations (9) and (10) obtained from the design of experiments. %TOC decrease had an excellent fit. The prediction for luminescence had a lower accuracy but was still good, particularly considering how often prediction of toxicity involves much more complex and robust techniques, such as quantitative structure-activity relationship QSAR models [73].

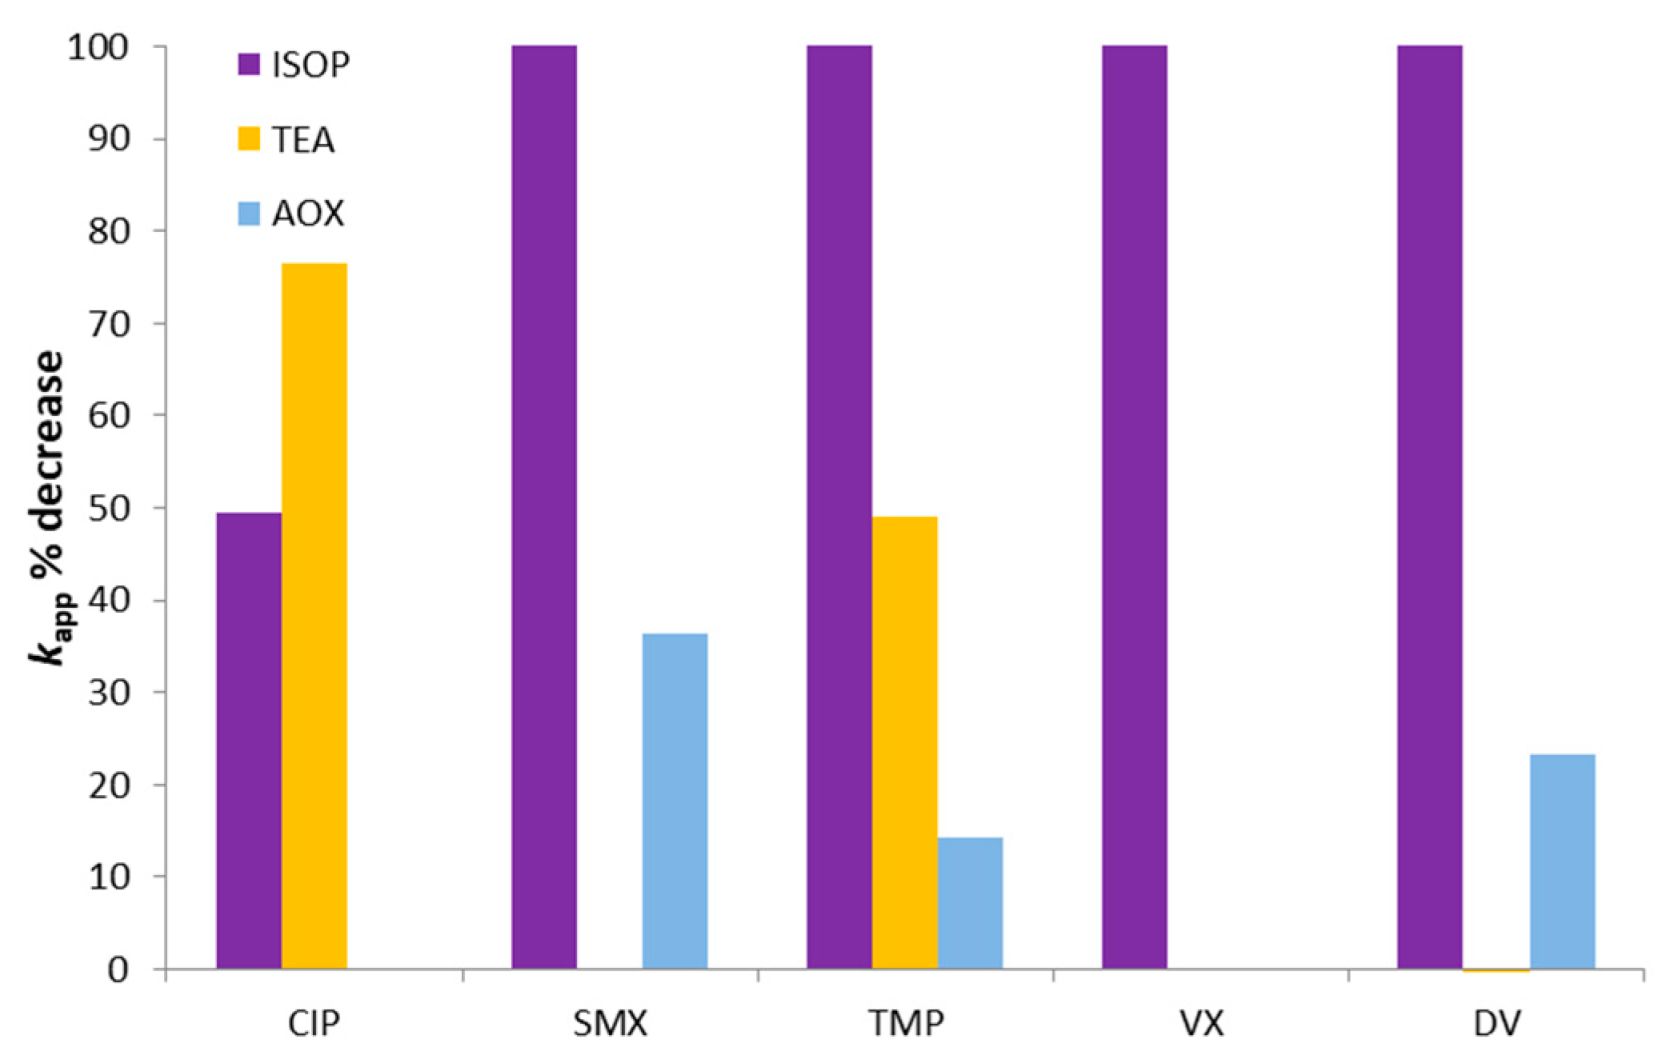
3.3. Mechanism of Degradation

To investigate the UV-A photocatalytic degradation mechanisms, experiments with several radical scavengers were performed. Isopropanol (ISOP), triethanolamine (TEA), and ammonium oxalate (AOX) were adopted as scavengers of hydroxyl radicals (OH), superoxide radicals (O2), and positive holes (h+), respectively [59,74,75]. Figure 6 shows the (C/C0) vs. time degradation plots of the PhACs (initial solution at a 100:1 scavenger/pollutant mass ratio) in MQ water after 60 min of degradation and Figure 7 shows the relative % decrease on kapp values due to each scavenger.
The hydroxyl radical was the most substantial contributor to the degradation of the pollutants, since the addition of ISOP completely hampered the degradation of four PhACs and reduced the CIP degradation rate by 50%. However, CIP was even further inhibited by TEA, indicating a high reactivity of this pollutant with super oxide radicals as well. The contribution of holes to the degradation was smaller, being relevant only for SMX, DV, and TMP, but always below 40%. Attention should be paid to the fact that a severe inhibition of the degradation does not mean that the compound is directly highly reactive towards the respective scavenger. This becomes evident by evaluating VX, TMP, and DV degradation, which was completely halted by the presence of isopropanol; however, in the latter’s absence, the reaction rates were also very low (Figure 1). The pH range in which the reactions took place (pH0 = 6.7, pHfinal = 5.7) can be a decisive parameter given that the amount of available radicals and holes depends on it [76].

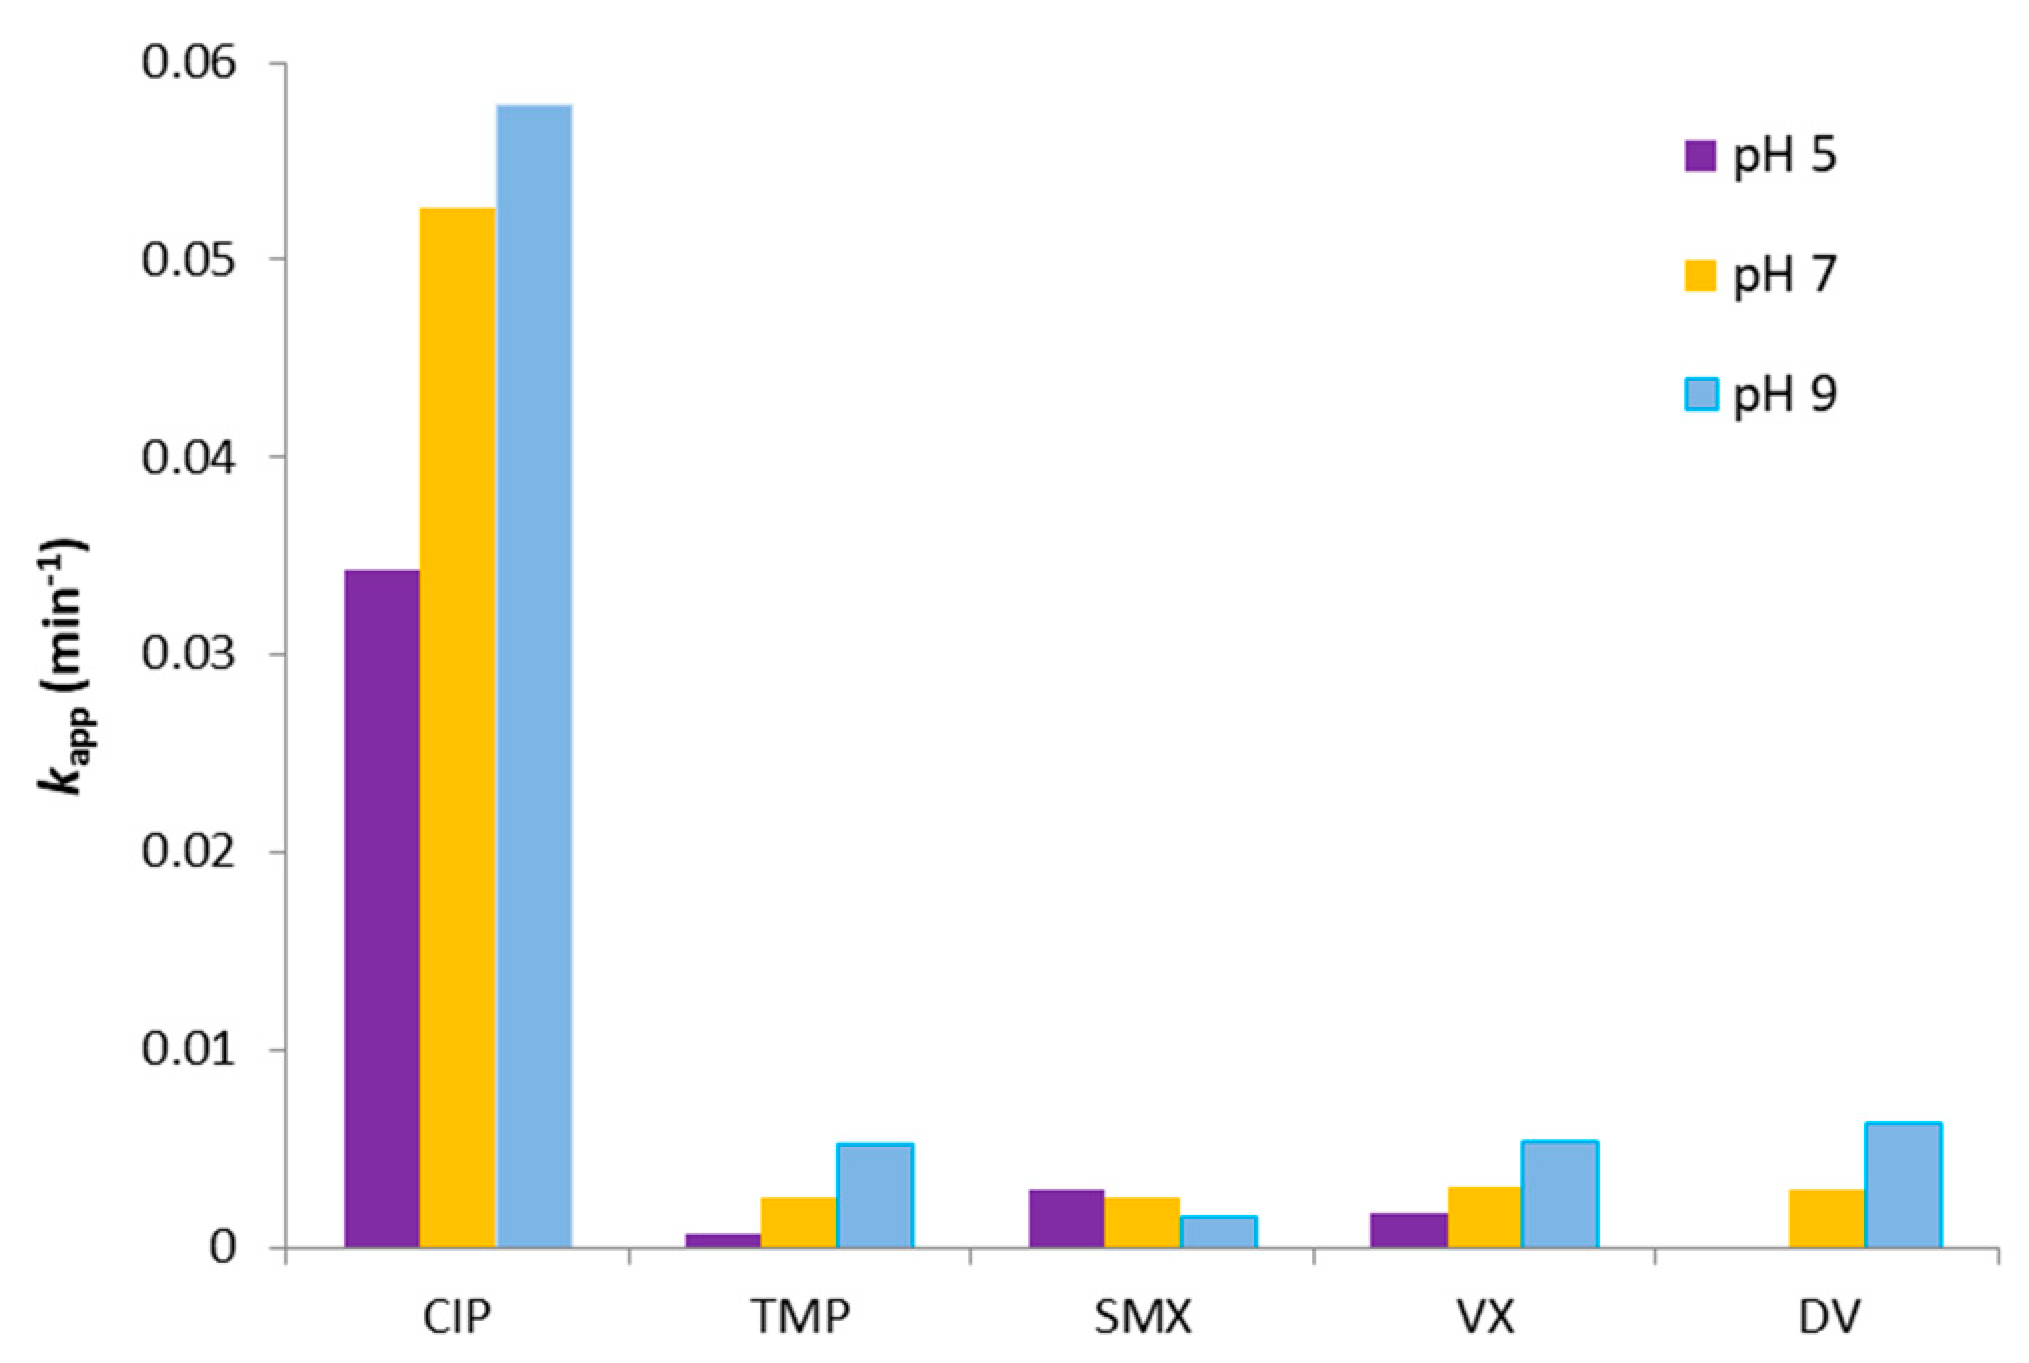
3.4. Effect of the Initial pH

Since matrix composition and pH are related, the effect of the latter in the degradation was also evaluated. The results in Figure 8 indicate that UV-A photocatalysis kapp values were influenced by the initial pH, with most of the PhACs being depleted faster at higher pHs, which increased the production of reactive ROS species, such as OH [76].
The exception was SMX, which degraded faster at lower pHs. This was probably related to the more prominent role of the neutral (and more reactive) form of SMX at pH < 5.6 (SMX pKa value) [65,69]. As was explained in Section 3.1, a CIP-predominant neutral ionic state tends to degrade faster at pH > 6.1. The same phenomenon can be observed for TMP at pH > 7.1. Since the pKa values of VX and DV are above the range of the experiments, their different reaction rates can be explained mainly by the increase of ROS species production in more basic environments.

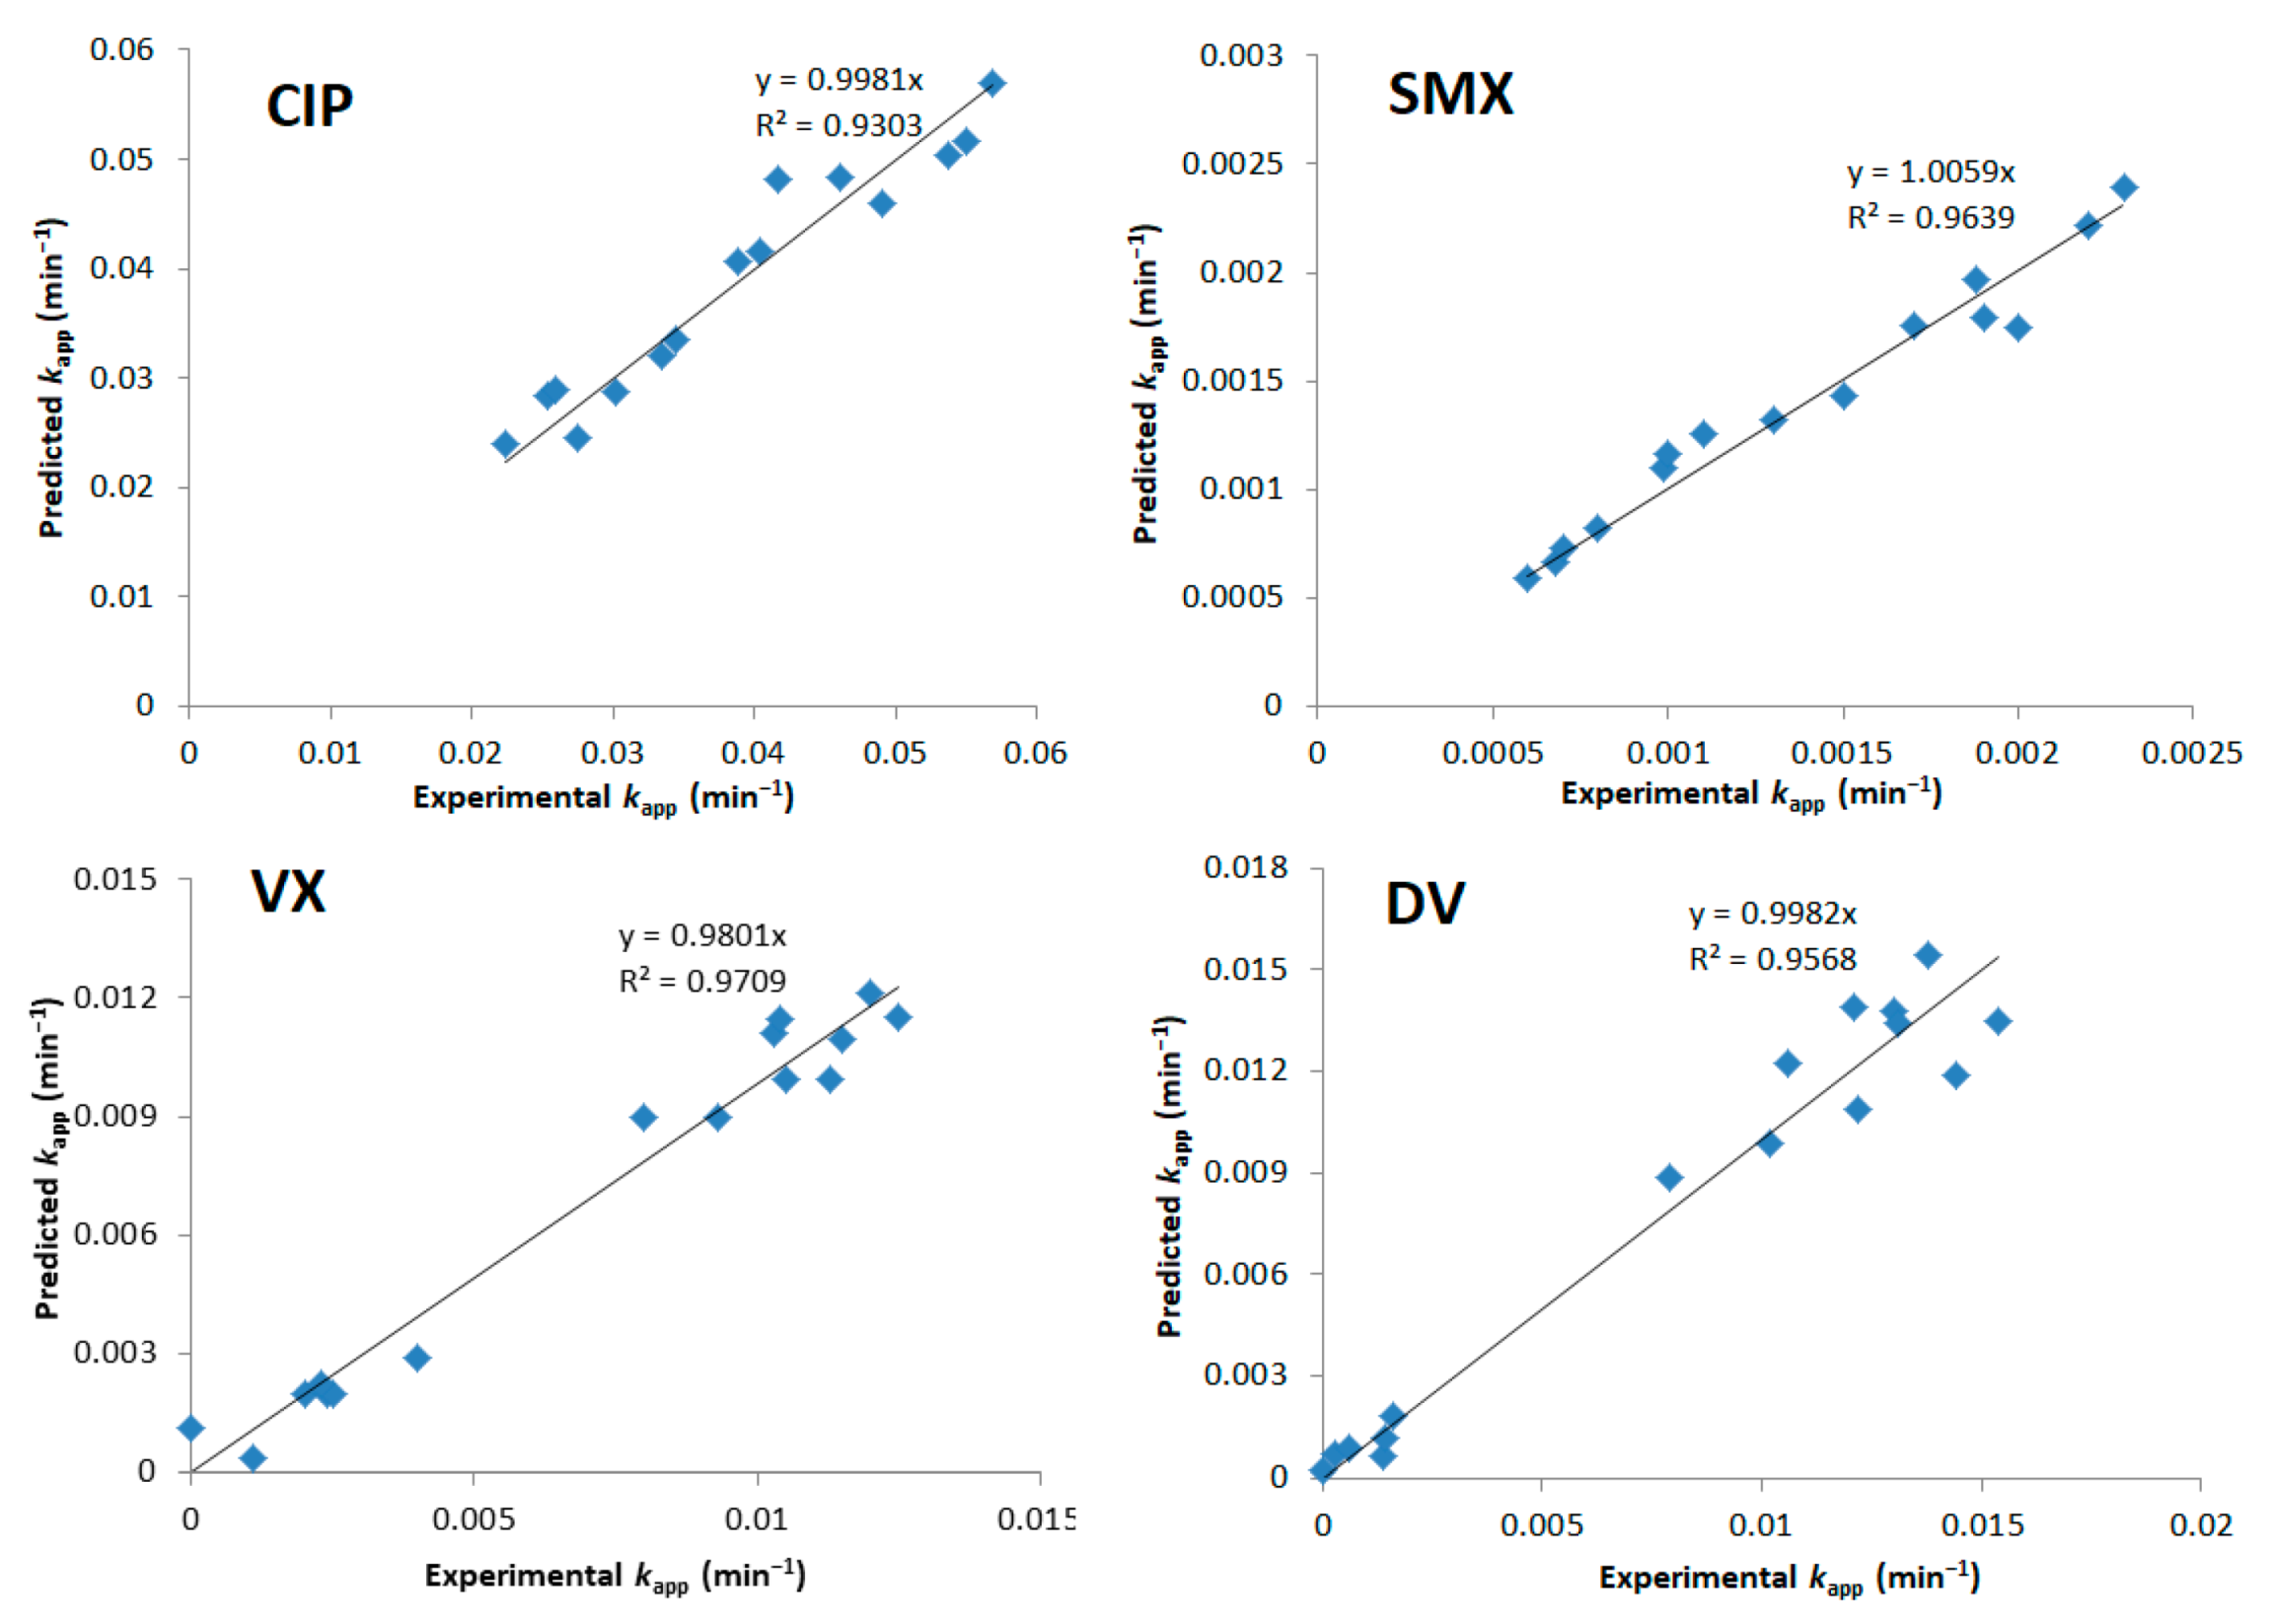
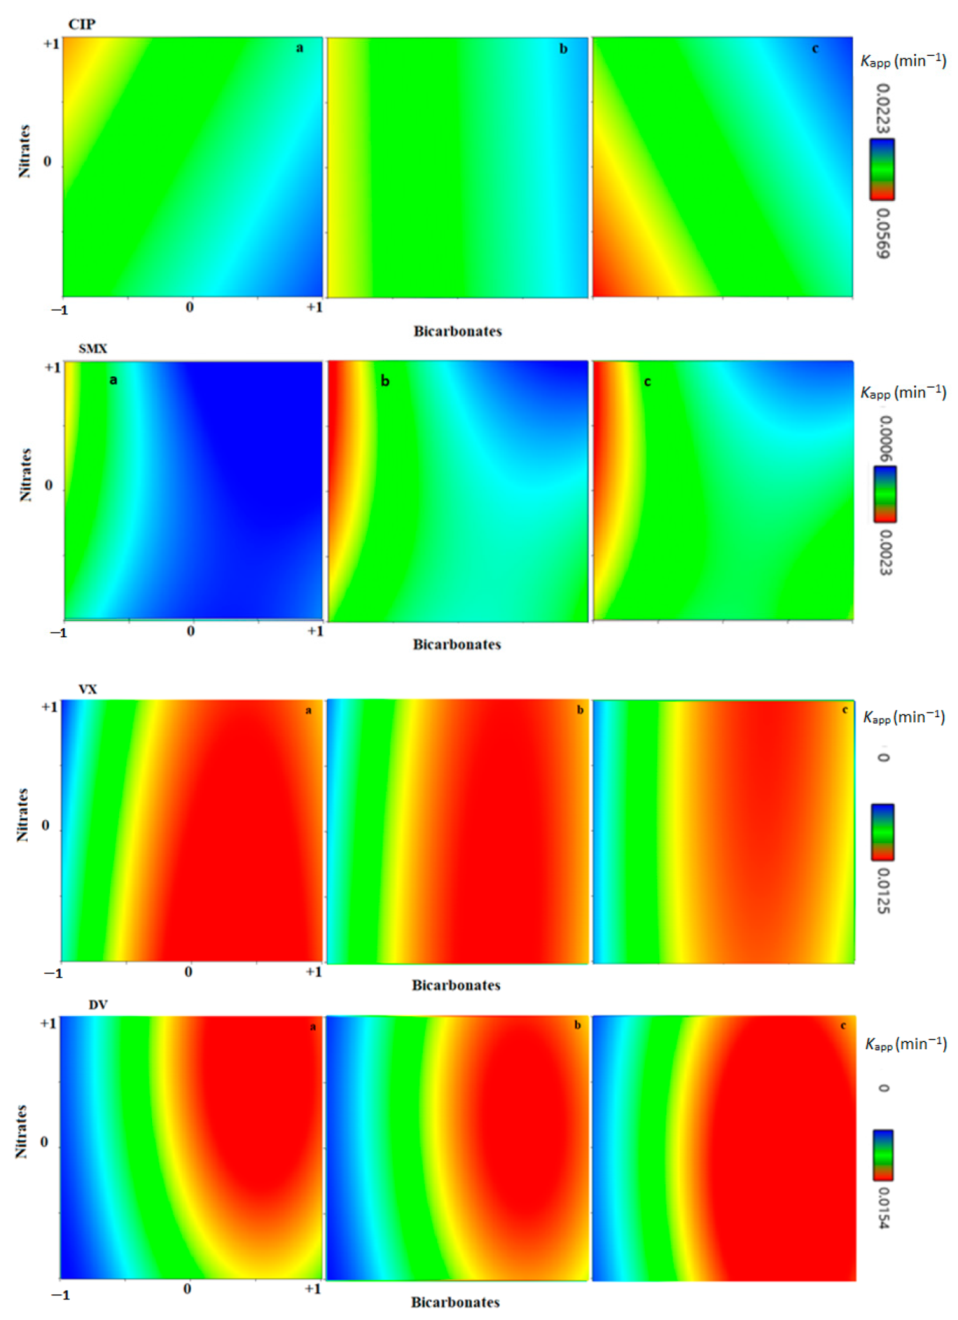
3.5. Effect of the Matrix Constituents: Bicarbonates, Nitrates, and Humic Acids

For a more in-depth study of the large influence of the matrix in photocatalytic processes (discussed in Section 3.2), another DoE was performed, investigating the impact of the concentrations of commonly found substances in water matrices. For this analysis, the Box–Behnken design was chosen because it provides surface response graphs which fit the continuous character of the chosen variables. For this DoE, three levels of each independent variable are established (see Table 2) and the method’s obtained mathematical module encompasses not only the chosen range limits (as the full factorial design of Section 3.2) but also the whole interval of this range. A deeper discussion of this method and its application can be found in [77].
The chosen substances were bicarbonates (HCO3), nitrates (NO3), and humic acids (HA). They are commonly found in waterbodies, so their mechanisms of reaction with ROS species should be well understood to optimize AOPs. The influence of bicarbonates on the performance of AOPs has been documented [26,28]. This ion acts as a scavenger, reacting with the hydroxyl radical and forming the carbonate radical, according to Equation (11) [78]. This may hinder the degradation processes because, compared to the hydroxyl radical, the carbonate radical has a reaction rate considerably slower with most substances [79].
OH + HCO 3 · CO 3 +   H 2 O
The presence of nitrates and humic acids in the photocatalytic reaction medium may cause positive and negative effects on radical production, with every target compound responding differently to specific process conditions. Humic acids may cause screening effects and divert radicals from the target compounds and lower their availability (negative effect) or they can generate new radicals via photosensitization under UV light (positive effect) [27,33,80]. Nitrates can act as electron capturers on the catalyst valence band, hampering ROS production (negative effect), or undergo photolysis under UV light, creating more radicals (positive effect) [80,81]. Additionally, the reaction of humic acids and nitrates with PhAC degradation products may cause all sorts of inhibition or promotion effects.
Figure S5 shows the ANOVA analysis of variance. It was possible to attain a significant model for four out of five PhACs. Their obtained coded Equations (12)–(15) are:
k a p p ( C I P ) = 0.1940 0.0253 A 0.0008 B + 0.0027 C 0.0006 A B 0.0023 A C 0.0131 B C
k a p p ( S M X ) = 0.0340 0.007 A 0.0015 B + 0.0043 C 0.0053 A B 0.0017 A C 0.0006 B C + 0.0062 A 2 0.002 B 2 0.0027 C 2  
k a p p ( V X ) = 0.012 + 0.004 A 0.0005 B 0.0005 C + 0.00005 A B 0.0004 A C + 0.0007 B C 0.0059 A 2 0.0002 B 2 0.00017 C 2  
k a p p ( D V ) = 0.1154 + 0.0445 A + 0.0048 B + 0.0063 C 0.0022 A B 0.0032 A C 0.0072 B C 0.0447 A 2 0.009 B 2 + 0.0053 C 2  
A significant model for the degradation of TMP could not be obtained (Figure S4). Possible explanations are: (1) an overall very low reactivity of TMP with all the agents present in the photocatalytic system; (2) a larger range of the tested variables is required; (3) the impact of other factors which were not accounted in the DoE was more significant (e.g., pH, different TMP reactivity for different ionization states, presence of multiple degradation products); (4) simultaneous positive and negative effects of matrix composition on kapp, as previously commented.
The experimental vs. the predicted (by Equations (11)–(14)) kapp are shown in Figure 9, with good fits for all cases.
Surface graphs for CIP, SMX, VX, and DV are shown in Figure 10. High F-values were obtained for the coefficients A (bicarbonate) and A2 (when a quadratic fit was adopted), indicating their high significance. The addition of bicarbonate affected the initial pH of the solution, which in turn further supported the prominent significance of bicarbonate-related coefficients (Table S4). As shown in Figure 9 and the literature [16], the initial pH of the reaction impacts the photolytic degradation rate, the availability of radicals, the ionization state of each pollutant, and, consequently, the overall degradation rates. Since the initial pH and the bicarbonate concentrations are narrowly related, it is not possible to study them as independent variables. Thus, the addition of bicarbonates increases the complexity of the system, enabling a multitude of reaction pathways that take place simultaneously, some of them fostering a faster PhAC degradation rate, while others slow it down. In this study, CIP and SMX had their degradation hindered by bicarbonates, while both VX and DV had their kapp increased by bicarbonate presence until a certain point.
The addition of nitrates and humic acids (B and C in Table 2, respectively) affected the kapp of CIP and SMX. In the case of CIP, the significant combined effect BC shows that the presence of either nitrate (B) or HA (C) in the absence of the other was beneficial for CIP degradation. For SMX, the addition of humic acid had an overall positive effect, and the presence of nitrates was beneficial as long as bicarbonates were low (AB effect). For DV and VX, the influence of nitrates and humic acids was much smaller (Figure 10).

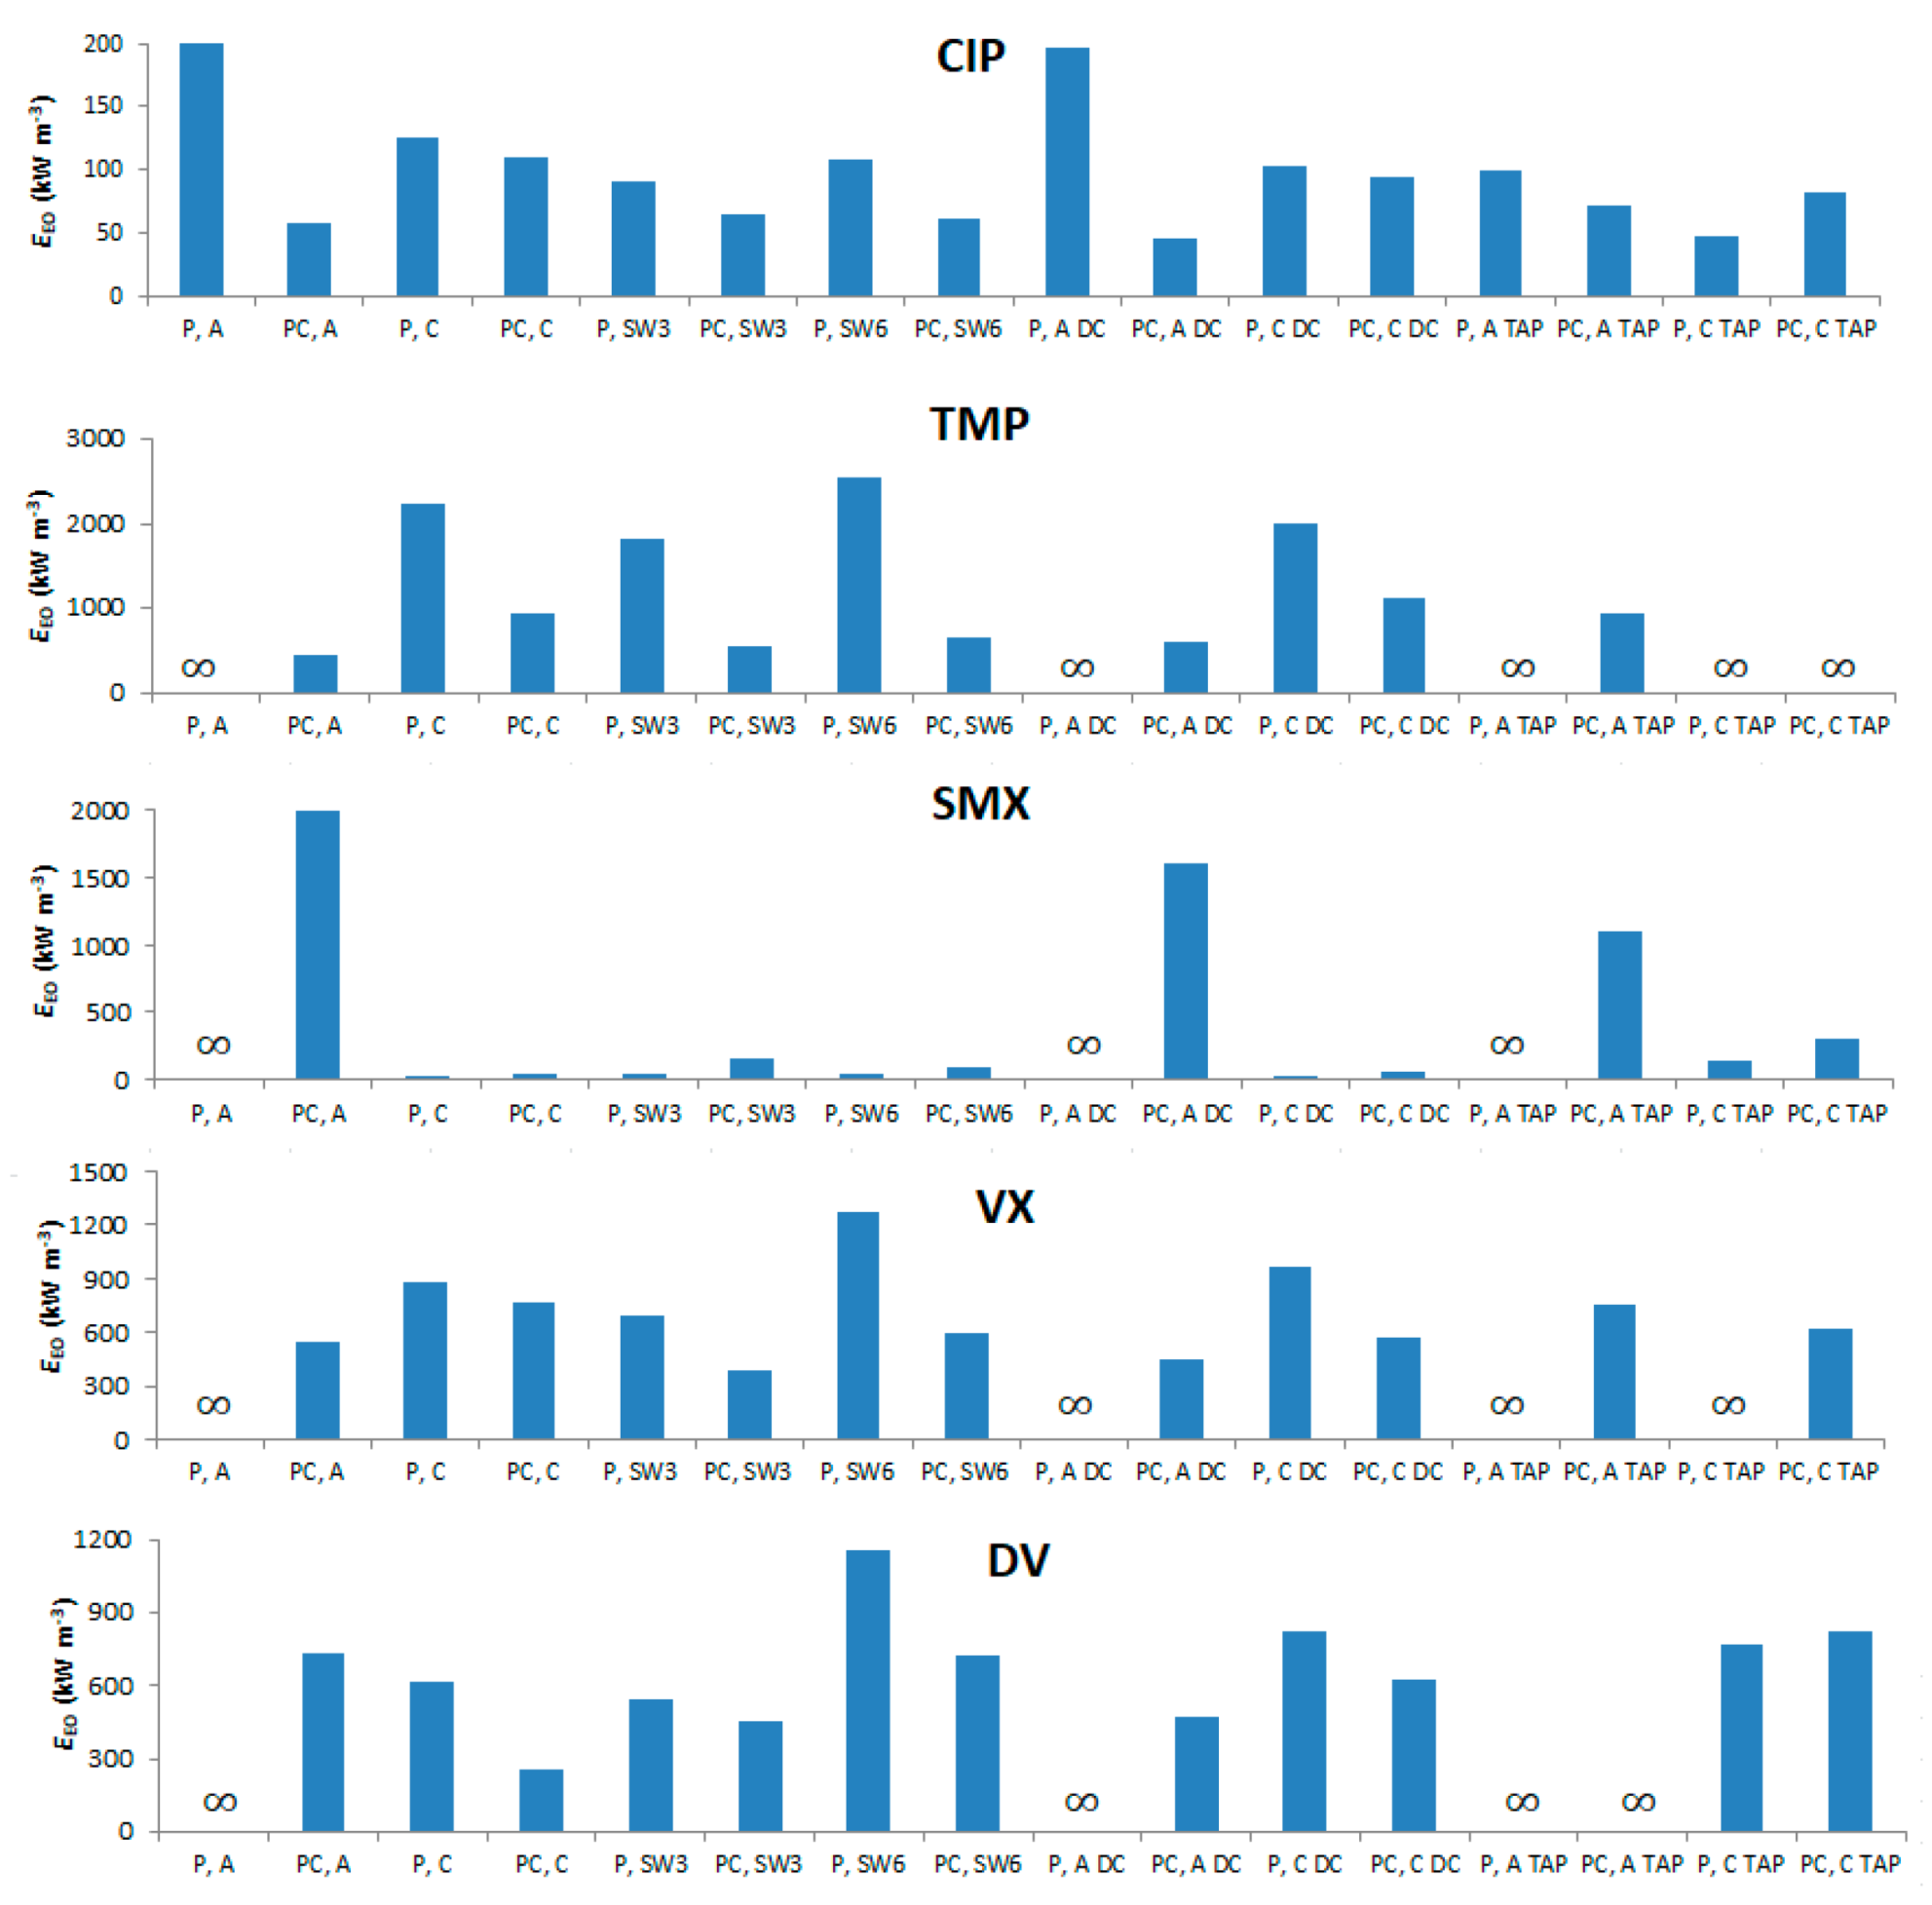
3.6. Electrical Energy per Order (EEO) Analysis

It is fundamental to analyze the energy expenses of the photolytic and photocatalytic processes and how they are affected by variables, such as wavelength, matrix, and controlled periodic illumination. It was not possible to include EEO in the previous DoE analysis because all values corresponding to kapp = 0 would tend to infinity. Figure 11 shows the EEO values of the five PhACs for different processes. The standard performances in MQ water were compared with cases using duty cycle and two varieties of simultaneous wavelength (SW). In the first one (P or PC, SW3 LEDs), two strips of UV-A LED and one of UV-C LED were used. In the second one (P or PC, SW6 LEDs), three strips of both UV-A and UV-C LEDs were used simultaneously. The objective was to analyze the possible benefit brought by additional light sources, controlled periodic illumination, and simultaneous wavelength on EEO, and to compare its results in MQ and tap water.
Studies have shown that controlled periodic illumination can be a powerful tool to reduce EEO [38], but care must be taken to consider the particularities of each system. Results show that the duty cycle had mixed results for energy consumption. Although CIP, SMX, VX, and DV reduced their EEOs, especially for the (PC, A) case, other processes had mixed results for all PhACs. Possibly, due to the small scale of the photoreactor, the addition of the ARDUINO control board added energy expenses that would be negligible at a larger scale. Another possibility is that the arbitrarily chosen duty cycle of 0.50 was not optimal in this case. Simultaneous wavelengths have shown interesting results for disinfection [82,83], but both cases with three and six LEDs did not present any significant gain in EEO compared to the standard photoreactor design. As explained elsewhere [33], the effect of wavelength coupling could benefit both photolysis and photocatalysis, but when light sources with too far away wavelengths (like the present case, UV-C and UV-A) are used simultaneously, no wave interference takes place. Adding more light sources (P, SW6 and PC, SW6) generally led to an increase in EEO values (except for photocatalysis of SMX). These results reinforce the conclusions of the previous work [37], in which it was shown that both CPI and the additional number of LED strips did not reduce EEO values of the target pollutant. Contrasting results were obtained with tap water, since some compounds had increasing EEO values for all cases (TMP and DV), while the others showed lower values for some processes. As was seen in Section 3.5, real water contains substances that can both increase or decrease degradation rates, depending on each situation and target compound.
Overall, the EEO values for photocatalysis obtained in this work are of the same order as the ones provided by a recent comprehensive literature review [33], mostly ranging between 100 and 1000 kWh m−3. Be that as it may, comparing EEO values of the five target PhACs in the recent literature results in largely different figures due to different process conditions (catalyst used, PhAC’s C0s, type of lamp, photoreactor design, matrix composition). To illustrate that, calculated EEO values of a study performed by [84] in hospital wastewaters using TiO2 P25 catalyst (slurry, 100 mg/L) and a solar lamp for VX, DV, and SMX degradation were 1920, 1900, and 2600 kWh m−3, respectively. In a study performed by [85], the photocatalytic degradation of CIP by Zn-doped Cu2O particles in ultrapure water illuminated by visible light (>400 nm) had a calculated EEO of 35,000 kWh m−3. Another study of photocatalytic degradation of CIP [86], using a Bi2Ti2O7/TiO2/RGO catalyst under visible light in ultrapure water had an EEO of 26,000 kWh m−3. Degradation of SMX and TMP in urban wastewater using a TiO2 P25 catalyst (slurry, 1000 mg/L) and UV-A LEDs obtained EEOs of 30 and 60 kWh m−3, respectively [87]. Lastly, degradation of TMP in ultrapure water was investigated by [88] using TiO2 and Ru/WO3/ZrO2 catalysts illuminated by a near UV–Vis lamp—both in solution and immobilized. The first catalyst attained EEO values of 15,300 and 21,500 kWh m−3 in solution and immobilized, respectively. The second catalyst obtained values of 9500 and 9000 kWh m−3 for solution and immobilized, respectively.
These values are still way beyond technology feasibility (<10 kWh m−3) [13] This, together with the potential formation of more toxic degradation by products (see Section 3.2), represents the main disadvantage of photocatalysis. Despite that, a non-significant difference was observed between UV-A and UV-C values. Until a few years ago, there were concerns that LEDs in the UV-C range were exceedingly energy-demanding when compared to longer wavelengths [35]. Certainly, each pollutant can have a different response depending on the emitted wavelength. Nevertheless, both UV-A and UV-C EEO magnitudes are on the same average level, which represents an important advance in this technology. UV-C can greatly contribute to the degradation of compounds highly reactive to it, e.g., sulfamethoxazole, which had the lowest EEO value of all the studied cases (28 kWh m−3).
The low photonic efficiency is still characteristic of photocatalysis itself [12], independently of the light source. Nevertheless, the recent developments in UV-LED technology could decrease EEO values 10 to 20 times in the next five years [2], which would have a direct impact on the feasibility and overall expenses of the process.

4. Practical Implications of this Study

After an exhaustive study investigating degradation of multiple compounds of emerging concern under different scenarios, electrical energy per order values of UV-LED photocatalysis are still way beyond feasibility values and real large-scale application of this technology is still distant. The quick development of UV-LEDs in the field of material sciences, which has been exponentially lowering this light source’s wall plug efficiency seems to be the main source of possible performance improvements, since up-scaling questions, such as mass transport of reactive species and UV light’s permeation through large reactors, remain as considerable technological hurdles.
In the pursuance of photocatalysis optimization, special attention should be paid to the kinetic response of the main target compounds. PhAC reactivity, in fact, varies drastically among tens of thousands of different substances and no single treatment or method could probably account for all of them. The optimal photoreactor design for each situation will depend on the full understanding of the matrix composition, the reactivity of target pollutants, and the required quality of the final effluent.
A potential advantage of UV-LED photocatalysis against other AOPs is the use of simultaneous wavelengths and the formation of multiple reactive species (OH, O2, and h+) which would open up more possibilities of reaction pathways to fulfill this difficult task of degrading thousands of vastly different pollutants. Short-term possible uses of UV-LED photocatalysis should focus on small scale point-of-use applications, as a final polishing step for drinking tap water, or adoption in places with difficult access to chemicals, such as O2 tanks and H2O2.
Moreover, there is a lack of information about the studied emerging compounds (hence their inclusion in the 2020/1161 Watch List). Any information regarding the possibility of their removal is hence of utmost importance. For future research, special attention should be paid to degradation products, since this work has shown that the toxicity of the effluent can increase after treatment, mainly depending on the chosen wavelength and the initial compounds in the matrix. It is important to monitor toxicity levels prior to and after photocatalysis to avoid this kind of issue.

5. Conclusions

In this work, the individual and simultaneous UV-LED degradation of five different pharmaceuticals from the current EU Watch List of substances of emerging concern (2020/1161) was studied under a wide variety of scenarios. A design of experiments approach involving multiple parameters was able to quantify the significance of different individual and combined effects on kinetic rate constants, effluents’ total organic carbon abatement, and toxicity levels.
The impact on the apparent first-order kinetic rate constant of initial pH, LEDs wavelength, presence of immobilized TiO2 catalyst, controlled periodic illumination, and matrix composition was investigated for each compound, and the obtained responses differed considerably depending on the target substance. Different ionic states, absorption spectra, degradation routes, and transformation products will impact the reactivity of each compound. The first categorical design of experiments showed that UV-A combined with TiO2 was the better option for faster degradation. UV-A alone, in fact, was incapable of degrading most of the pollutants and UV-C rays’ photolytic effects can be considerably hindered by the screening effect in the presence of a catalyst. The matrix also plays a large role in affecting the degradation rates. Higher pH values tend to favor faster UV-A photocatalytic degradation, but the influence of the ionic states with different reactivities should be carefully considered.
The mechanisms of reaction of each PhAC with OH, O2, and h+ were also investigated, demonstrating the reactivity of the target compound to each of these species and showing that photocatalysis can degrade substances by different reaction routes. The second design of experiments focused on matrix composition using surface graphs and it showed that the presence of bicarbonates, humic acids, and nitrates can have mixed positive and negative effects on degradation.
Electrical energy per order values of UV-LED photocatalysis are still way beyond feasibility values. Controlled periodic illumination, simultaneous wavelength use, and additional lights did not considerably reduce energetic expenses. Nevertheless, UV-C LED values have now reached the same order of magnitude as UV-A, which was unattainable a few years ago. The potential near-future application of UV-LED photocatalysis that has been discussed involves small-scale point-of-use applications, and the formation of toxic degradation products demands special attention.

Supplementary Materials

The following supporting information can be downloaded at: https://0-www-mdpi-com.brum.beds.ac.uk/article/10.3390/nano12020295/s1, Figure S1: Experimental setup. 1—energy source, 2—power meter, 3—LED control board, 4—LED columns, 5—UV rays reaching the reactor, 6—reactor, and 7—magnetic stirrer; Figure S2: Upview of photoreactor with six UV-LED strips on; Figure S3: Degradation profiles for the individual degradation experiments; Figure S4: ANOVA results for categorical DoE by Design Expert 12 software; Figure S5: ANOVA results for surface response DoE by Design Expert 12 software; Table S1: Tap water composition in Zagreb, Croatia (pH = 7.4); Table S2: LED specifications; Table S3: Acronyms of the performed treatments; Table S4: Experiments performed (experiments 1–20: individual degradation; experiments 21–23: initial pH investigation; experiments 24–39: categoric design of experiments; exp 40–56: continuous surface response design of experiments; exp 57–60: simultaneous wavelengths).

Author Contributions

Conceptualization, S.B., G.B. and D.B.S.; methodology, D.B.S., S.B., G.B. and D.A.; validation, D.B.S. and B.B.; formal analysis, D.B.S.; investigation, D.B.S. and B.B.; resources, S.B. and D.A.; writing—original draft preparation, D.B.S.; writing—review and editing, S.B., G.B. and D.B.S.; visualization, D.B.S.; supervision, S.B. and G.B; project administration, S.B. All authors have read and agreed to the published version of the manuscript.

Funding

This research was funded by the European Union’s Horizon 2020 research and innovation program under the Marie Skłodowska-Curie grant agreement No 812880 (NOWELTIES), Joint PhD Laboratory for New Materials and Inventive Water Treatment Technologies, Harnessing resources effectively through innovation. The authors thank Generalitat de Catalunya through the Consolidated Research Group 2017-SGR-1318. ICRA researchers give thanks for funding from the CERCA program/Generalitat de Catalunya.

Institutional Review Board Statement

Not applicable.

Informed Consent Statement

Not applicable.

Data Availability Statement

Not applicable.

Conflicts of Interest

The authors declare no conflict of interest.

References

  1. Hristov, J.; Barreiro-Hurle, J.; Salputra, G.; Blanco, M.; Witzke, P. Reuse of treated water in European agriculture: Potential to address water scarcity under climate change. Agric. Water Manag. 2021, 251, 106872. [Google Scholar] [CrossRef]
  2. Kneissl, M.; Seong, T.; Han, J.; Amano, H. The emergence and prospects of deep-ultraviolet light-emitting diode technologies. Nat. Photonics 2019, 13, 233–244. [Google Scholar] [CrossRef]
  3. Lempart, A.; Kudlek, E.; Dudziak, M. Determination of micropollutants in water samples from swimming pool systems. MDPI Proc. 2018, 2, 177. [Google Scholar] [CrossRef] [Green Version]
  4. Paíga, P.; Correia, M.; Fernandes, M.; Silva, A.; Carvalho, M.; Vieira, J.; Jorge, S.; Silva, J.; Freire, C.; Delerue-Matos, C. Assessment of 83 Pharmaceuticals in WWTP influent and effluent samples by UHPLC-MS/MS: Hourly variation. Sci. Total Environ. 2019, 648, 582–600. [Google Scholar] [CrossRef] [PubMed]
  5. Yu, X.; Liu, J. Prediction of reaction rate constants of hydroxyl radical with chemicals in water. Water Environ. Res. 2021, 93, 934–939. [Google Scholar] [CrossRef]
  6. Paredes, L.; Lema, F.; Carballa, M. What happens with organic micropollutants during UV disinfection in WWTPs? A global perspective from laboratory to full-scale. J. Hazard. Mater. 2018, 342, 670–678. [Google Scholar] [CrossRef] [PubMed]
  7. Shao, Y.; Chen, Z.; Hollert, H.; Zhou, S.; Deutschmann, B.; Seiler, T. Toxicity of 10 organic micropollutants and their mixture: Implications for aquatic risk assessment. Sci. Total Environ. 2019, 666, 1273–1282. [Google Scholar] [CrossRef]
  8. Awfa, D.; Ateia, M.; Fujii, M.; Yoshimura, C. Photocatalytic degradation of organic micropollutants: Inhibition mechanisms by different fractions of natural organic matter. Water Res. 2020, 174, 115643. [Google Scholar] [CrossRef]
  9. Zeghioud, H.; Khellaf, N.; Djelal, H.; Amrane, A.; Bouhelassa, M. Photocatalytic reactors dedicated to the degradation of hazardous organic pollutants: Kinetics, mechanistic aspects, and design—A review. Chem. Eng. Commun. 2016, 203, 1415–1431. [Google Scholar] [CrossRef]
  10. Magalhães, P.; Andrade, L.; Nunes, O.; Mendes, A. Titanium dioxide photocatalysis: Fundamentals and application on photoinactivation. Rev. Adv. Mater. Sci. 2017, 51, 91–129. [Google Scholar]
  11. Teodosiu, C.; Gilca, A.; Barjoveanu, G.; Fiore, S. Emerging pollutants removal through advanced drinking water treatment: A review on processes and environmental performances assessment. J. Clean. Prod. 2018, 197, 1210–1221. [Google Scholar] [CrossRef]
  12. Asif, A.; Wang, S.; Sun, H. Hematite-based nanomaterials for photocatalytic degradation of pharmaceuticals and personal care products (PPCPs): A short review. Curr. Opin. Green Sust. Chem. 2021, 28, 100447. [Google Scholar] [CrossRef]
  13. Miklos, D.; Remy, C.; Jekel, M.; Linden, K.; Drewes, J.; Hübner, U. Evaluation of advanced oxidation processes for water and wastewater treatment—A critical review. Water Res. 2018, 139, 118–131. [Google Scholar] [CrossRef] [PubMed]
  14. Loeb, S.; Alvarez, P.; Brame, J.; Cates, E.; Choi, W.; Sedlak, D.; Waite, T.; Westerhoff, P.; Kim, J.; Crittenden, J.; et al. The technology horizon for photocatalytic water treatment: Sunrise or sunset? Environ. Sci. Technol. 2019, 53, 2937–2947. [Google Scholar] [CrossRef]
  15. Foteinis, S.; Borthwick, A.; Frontistis, Z.; Mantzavinos, D.; Chatzisymeon, E. Environmental sustainability of light-driven processes for wastewater treatment applications. J. Clean. Prod. 2018, 182, 8–15. [Google Scholar] [CrossRef] [Green Version]
  16. Ye, Y.; Feng, Y.; Bruning, H.; Yntema, D.; Rijnaarts, H. Photocatalytic degradation of metoprolol by TiO2 nanotube arrays and UV-LED: Effects of catalyst properties, operational parameters, commonly present water constituents, and photo-induced reactive species. App. Catal. B Environ. 2018, 220, 171–181. [Google Scholar] [CrossRef]
  17. Cuervo Lumbaque, E.; Sirtori, C.; Vilar, V. Heterogeneous photocatalytic degradation of pharmaceuticals in synthetic and real matrices using a tube-in-tube membrane reactor with radial addition of H2O2. Sci. Total Environ. 2020, 746, 140629. [Google Scholar] [CrossRef] [PubMed]
  18. Ahmadpour, N.; Sayadi, M.; Sobhani, S.; Hajiani, M. Photocatalytic degradation of model pharmaceutical pollutant by novel magnetic TiO2@ZnFe2O4/Pd nanocomposite with enhanced photocatalytic activity and stability under solar light irradiation. J. Environ. Manag. 2020, 271, 110964. [Google Scholar] [CrossRef] [PubMed]
  19. Ding, M.; Ao, W.; Xu, H.; Chen, W.; Tao, L.; Shen, Z.; Huihong, L.; Lu, C.; Xie, Z. Facile construction of dual heterojunction CoO@TiO2/MXene hybrid with efficient and stable catalytic activity for phenol degradation with peroxymonosulfate under visible light irradiation. J. Hazardous. Mat. 2021, 420, 126686. [Google Scholar] [CrossRef]
  20. Deonikar, V.; Mujmule, R.; Patil, D.; Kim, H. Efficient decontamination of toxic phenol pollutant using LaCO3OH nanowires decorated Ag3PO4 hierarchical composites mediated by metallic Ag. Sci. Total. Environ. 2019, 675, 325. [Google Scholar] [CrossRef]
  21. Silva, A.; Martins, P.; Teixeira, S.; Carabineiro, S.; Kuehn, K.; Cuninberti, G.; Alves, M.; Lanceros-Mendez, S.; Pereira, S. Ciprofloxacin wastewater treated by UVA photocatalysis: Contribution of irradiated TiO2 and ZnO nanoparticles on the final toxicity as assessed by Vibrio Fischeri. RSC Adv. 2016, 6, 95494–95503. [Google Scholar] [CrossRef]
  22. Escudero, C.; Iglesias, O.; Dominguez, S.; Rivero, M.; Ortiz, I. Performance of electrochemical oxidation and photocatalysis in terms of kinetics and energy consumption. New insights into the p-cresol degradation. J. Environ. Manag. 2017, 195, 117–124. [Google Scholar] [CrossRef] [PubMed]
  23. Li, Q.; Jia, R.; Hu, J. Transformation products formation of ciprofloxacin in UVA/LED and UVA/LED/TiO2 systems: Impact of natural organic matter characteristics. Water Res. 2018, 132, 320–330. [Google Scholar] [CrossRef] [PubMed]
  24. Jallouli, N.; Pastrana-Martínez, L.; Ribeiro, A.; Moreira, N.; Faria, J.; Hentati, O.; Silva, A.; Ksibi, M. Heterogeneous photocatalytic degradation of ibuprofen in ultrapure water, municipal and pharmaceutical industry wastewaters using a TiO2/UV-LED system. Chem. Eng. J. 2018, 334, 976–984. [Google Scholar] [CrossRef]
  25. Li, Q.; Jia, R.; Shao, J.; He, Y. Photocatalytic degradation of amoxicillin via TiO2 nanoparticle coupling with a novel submerged porous ceramic membrane reactor. J. Clean. Prod. 2019, 209, 755–761. [Google Scholar] [CrossRef]
  26. Ye, Y.; Bruning, H.; Liu, W.; Rijnaarts, H.; Yntema, D. Effect of dissolved natural organic matter on the photocatalytic micropollutant removal performance of TiO2 nanotube array. J. Photochem. Photobiol. A Chem. 2019, 371, 216–222. [Google Scholar] [CrossRef]
  27. Verma, M.; Haritash, A. Photocatalytic degradation of amoxicillin in pharmaceutical wastewater: A potential tool to manage residual antibiotics. Environ. Technol. Innov. 2020, 20, 101072. [Google Scholar] [CrossRef]
  28. Negishi, N.; Miyazaki, Y.; Kato, S.; Yang, Y. Effect of HCO3 concentration in groundwater on TiO2 photocatalytic water purification. App. Catal. B Environ. 2019, 242, 449–459. [Google Scholar] [CrossRef]
  29. Russell, M.M.; Kempisty, D.; Kanel, S.; Kurwadkar, S.; Brittle, S.; Sizemore, I.; Yaal, L. Destruction of aqueous phase organic pollutants using ultraviolet light-emitting diodes and photocatalysis. Water Air Soil Pollut. 2018, 229, 139. [Google Scholar] [CrossRef]
  30. Ding, H.; Hu, J. Degradation of ibuprofen by UVA-LED/TiO2/persulfate process: Kinetics, mechanism, water matrix effects, intermediates and energy consumption. Chem. Eng. J. 2020, 397, 125462. [Google Scholar] [CrossRef]
  31. Ferreira, L.; Fernandes, J.; Rodríguez-Chueca, J.; Peres, J.; Lucas, M.; Tavares, P. Photocatalytic degradation of an agro-industrial wastewater model compound using a UV LEDs system: Kinetic study. J. Environ. Manag. 2020, 269, 110740. [Google Scholar] [CrossRef]
  32. Tapia-Tlatelpa, T.; Buscio, V.; Trull, J.; Sala, V. Performance analysis and methodology for replacing conventional lamps by optimized LED arrays for photocatalytic processes. Chem. Eng. Res. Des. 2020, 156, 456–468. [Google Scholar] [CrossRef]
  33. Bertagna Silva, D.; Buttiglieri, G.; Babić, S. State-of-the-art and current challenges for TiO2/UV-LED photocatalytic degradation of emerging organic micropollutants. Environ. Sci. Pollut. Res. 2021, 28, 103–120. [Google Scholar] [CrossRef]
  34. Matafonova, G.; Batoev, V. Recent advances in application of UV light-emitting diodes for degrading organic pollutants in water through advanced oxidation processes: A review. Water Res. 2018, 132, 177–189. [Google Scholar] [CrossRef] [PubMed]
  35. Casado, C.; Marugán, J.; Timmers, R.; Muñoz, M.; van Grieken, R. Comprehensive multiphysics modeling of photocatalytic processes by computational fluid dynamics based on intrinsic kinetic parameters determined in a differential photoreactor. Chem. Eng. J. 2017, 310, 368–380. [Google Scholar] [CrossRef] [Green Version]
  36. Chen, J.; Loeb, S.; Kim, J. LED revolution: Fundamentals and prospects for UV disinfection applications. Environ. Sci. Water Res. Technol. 2017, 3, 188–202. [Google Scholar] [CrossRef]
  37. Sharma, P.; Khan, M.; Choubey, A. LED revolution: Deep UV LED. Int. J. Eng. Technol. 2019, 6, 6486. [Google Scholar]
  38. Bertagna Silva, D.; Buttiglieri, G.; Babić, T.; Ćurković, L.; Babić, S. Impact of UV-LED photoreactor design on the degradation of contaminants of emerging concern. Process Saf. Environ. Prot. 2021, 153, 94–106. [Google Scholar] [CrossRef]
  39. Yu, L.; Achari, G.; Langford, C. Design and evaluation of a novel light-emitting diode photocatalytic reactor for water treatment. J. Environ. Eng. 2018, 144, 1–9. [Google Scholar] [CrossRef]
  40. Casado, C.; Timmers, R.; Sergejevs, A.; Clarke, C.; Allsopp, D.; Bowen, C.; van Grieken, R.; Marugán, J. Design and validation of a LED-based high intensity photocatalytic reactor for quantifying activity measurements. Chem. Eng. J. 2017, 327, 1043–1055. [Google Scholar] [CrossRef]
  41. Verma, S.; Nakamura, S.; Sillanpää, M. Application of UV-C LED activated PMS for the degradation of anatoxin-A. Chem. Eng. J. 2016, 284, 122–129. [Google Scholar] [CrossRef]
  42. Neto, J.; Saggioro, S.; Dezotti, M. Investigation of mechanism and kinetics in the TiO2 photocatalytic degradation of indigo carmine dye using radical scavengers. Int. J. Environ. Sci. Technol. 2021, 18, 163–172. [Google Scholar] [CrossRef]
  43. Lin, P.; Mehrvar, M. Photocatalytic treatment of an actual confectionery wastewater using Ag/TiO2/Fe2O3: Optimization of photocatalytic reactions using surface response methodology. Catalysts 2018, 8, 409. [Google Scholar] [CrossRef] [Green Version]
  44. Bizi, M.; Bachra, F. Evaluation of the ciprofloxacin adsorption capacity of common industrial minerals and application to tap water treatment. Powder Technol. 2020, 362, 323–333. [Google Scholar] [CrossRef]
  45. European Commission. EUR-Lex—2020/1161 of 4 August 2020 establishing a watch list of substances for Union-wide monitoring in the field of water policy pursuant to Directive 2008/105/EC of the European Parliament and of the Council. Off. J. Eur. Union 2020, 257, 32–35. [Google Scholar]
  46. Čizmić, M.; Ljubas, D.; Rožman, M.; Ašperger, D.; Ćurković, L.; Babíc, S. Photocatalytic degradation of azithromycin by nanostructured TiO2 film: Kinetics, degradation products, and toxicity. Materials 2019, 12, 873. [Google Scholar] [CrossRef] [PubMed] [Green Version]
  47. Ćurković, L.; Ljubas, D.; Šegota, S.; Bačić, I. Photocatalytic degradation of Lissamine Green B dye by using nanostructured sol–gel TiO2 films. J. Alloys Compd. 2014, 604, 309–316. [Google Scholar] [CrossRef]
  48. Waveform Lighting. Real UV LED Strip. 2020. Available online: https://store.waveformlighting.com/collections/led-strips/products/real-uv-led-strip-lights?variant=12527605252198 (accessed on 30 September 2021).
  49. Waveform Lighting. Clean UV-C Flex Strips Datasheet. 2020. Available online: https://www.waveformlighting.com/datasheets/CS_7026.pdf (accessed on 30 September 2021).
  50. Arduino. 2020. Available online: https://www.arduino.cc/en/tutorial/PWM. (accessed on 30 September 2021).
  51. Ljubas, D.; Smoljanić, G.; Juretić, H. Degradation of Methyl Orange and Congo Red dyes by using TiO2 nanoparticles activated by the solar and the solar-like radiation. J. Environ. Manag. 2015, 161, 83–91. [Google Scholar] [CrossRef]
  52. Council of the European Union. Council Directive 98/83/EC of 3 November 1998 on the Quality of water intended for human consumption (OJ L 330 05.12.1998 p. 32). Doc. Eur. Community Environ. Law 1998, 330, 865–878. [Google Scholar]
  53. Bolton, J.; Bircher, K.; Tumas, W.; Tolman, C. Figures-of-merit for the technical development and application of advanced oxidation technologies for both electric- and solar-driven systems. Pure Appl. Chem. 2001, 73, 627–637. [Google Scholar] [CrossRef]
  54. Davididou, K.; Nelson, R.; Monteagudo, J.; Durán, A.; Expósito, A.; Chatzisymeon, E. Photocatalytic degradation of bisphenol-A under UV-LED, blacklight and solar irradiation. J. Clean. Prod. 2018, 203, 13–21. [Google Scholar] [CrossRef] [Green Version]
  55. Natarajan, K.; Natarajan, T.; Tayade, H. Photocatalytic reactor based on UV-LED/TiO2 coated quartz tube for degradation of dyes. Chem. Eng. J. 2011, 178, 40–49. [Google Scholar] [CrossRef]
  56. Liang, R.; Van Leuwen, J.; Bragg, L.; Arlos, M.; Fong, L.C.L.C.; Schneider, O.; Jaciw-Zurakowsky, I.; Fattahi, A.; Rathod, S.; Peng, P.; et al. Utilizing UV-LED pulse width modulation on TiO2 advanced oxidation processes to enhance the decomposition efficiency of pharmaceutical micropollutants. Chem. Eng. J. 2019, 361, 439–449. [Google Scholar] [CrossRef]
  57. Bianco, A.; Passananti, M.; Perroux, H.; Voyard, G.; Mouchel-Vallon, C.; Chaumerliac, N.; Mailhot, G.; Deguillaume, L.; Brigante, M. A Better Understanding of hydroxyl radical photochemical sources in cloud waters collected at the Puy de Dôme station—Experimental versus modelled formation rates. Atmos. Chem. Phys. 2015, 15, 9191–9202. [Google Scholar] [CrossRef] [Green Version]
  58. Kim, H.; Kim, T.; Yu, S. Photolytic degradation of sulfamethoxazole and trimethoprim using UV-A, UV-C and vacuum-UV (VUV). J. Environ. Sci. Health A Tox. Hazard. Subst. Environ. Eng. 2015, 50, 292–300. [Google Scholar] [CrossRef]
  59. Sarafraz, M.; Sadeghi, M.; Yazdanbakhsh, A.; Amini, M.; Sadani, M.; Eslami, A. Enhanced photocatalytic degradation of ciprofloxacin by black Ti3+/N-TiO2 under visible LED light irradiation: Kinetic, energy consumption, degradation pathway, and toxicity assessment. Process Saf. Environ. Prot. 2020, 137, 261–272. [Google Scholar] [CrossRef]
  60. Ran, Z.; Fang, Y.; Sun, J.; Ma, C.; Li, S. Photocatalytic oxidative degradation of carbamazepine by TiO2 irradiated by UV light emitting diode. Catalysts 2020, 10, 540. [Google Scholar] [CrossRef]
  61. Nyangaresi, P.; Qin, Y.; Chen, G.; Zhang, B.; Lu, Y.; Shen, L. Comparison of UV-LED photolytic and UV-LED/TiO2 photocatalytic disinfection for Escherichia coli in water. Catal. Today. 2019, 335, 200–207. [Google Scholar] [CrossRef]
  62. Nasuhoglu, D.; Yargeau, V.; Berk, D. Photo-removal of sulfamethoxazole (SMX) by photolytic and photocatalytic processes in a batch reactor under UV-C radiation (Λmax = 254 nm). J. Hazard. Mater. 2011, 186, 67–75. [Google Scholar] [CrossRef] [PubMed]
  63. Zrnčić, M.; Babić, S.; Mutavdžic Pavlović, D. Determination of thermodynamic pKa values of pharmaceuticals from five different groups using capillary electrophoresis. J. Sep. Sci. 2015, 38, 1232–1239. [Google Scholar] [CrossRef] [PubMed]
  64. Salma, A.; Thoröe-Boveleth, S.; Schmidt, T.; Tuerk, J. Dependence of transformation product formation on pH during photolytic and photocatalytic degradation of ciprofloxacin. J. Hazard. Mater. 2016, 313, 49–59. [Google Scholar] [CrossRef] [PubMed]
  65. Yuan, R.; Zhu, Y.; Zhou, B.; Hu, J. Photocatalytic oxidation of sulfamethoxazole in the presence of TiO2: Effect of matrix in aqueous solution on decomposition mechanisms. Chem. Eng. J. 2019, 359, 1527–1536. [Google Scholar] [CrossRef]
  66. Giannakis, S.; Hendaoui, I.; Jovic, M.; Grandjean, D.; Alencastro, L.; Girault, H.; Pulgarin, C. Solar photo-Fenton and UV/H2O2 processes against the antidepressant venlafaxine in urban wastewaters and human urine. Intermediates formation and biodegradability assessment. Chem. Eng. J. 2017, 308, 492–504. [Google Scholar] [CrossRef] [Green Version]
  67. Lajeunesse, A.; Smyth, S.; Barclay, K.; Sauvé, S.; Gagnon, C. Distribution of antidepressant residues in wastewater and biosolids following different treatment processes by municipal wastewater treatment plants in Canada. Water Res. 2012, 46, 5600–5612. [Google Scholar] [CrossRef]
  68. Luo, X.; Zheng, Z.; Greaves, J.; Cooper, W.; Song, W. Trimethoprim: Kinetic and mechanistic considerations in photochemical environmental fate and AOP treatment. Water Res. 2012, 46, 1327–1336. [Google Scholar] [CrossRef] [PubMed]
  69. Willach, S.; Lutze, H.; Eckey, K.; Löppenberg, K.; Lueling, M.; Wolbert, J.; Kujawinski, D.; Jochmann, M.; Karst, U.; Schmidt, T. Direct photolysis of sulfamethoxazole using various irradiation sources and wavelength ranges—Insights from degradation product analysis and compound-specific stable isotope analysis. Environ. Sci. Technol. 2018, 52, 1225–1233. [Google Scholar] [CrossRef]
  70. Khan, M.; Shah, J.; Arshad, M.; Halim, S.; Khan, A.; Shaikh, A.; Riaz, N.; Khan, A.J.; Arfan, M.; Shahid, M.; et al. Photocatalytic decolorization and biocidal applications of non-metal doped TiO2: Isotherm, kinetic modeling and in silico molecular docking studies. Molecules 2020, 25, 4468. [Google Scholar] [CrossRef]
  71. Vaiano, V.; Sacco, O.; Sannino, D.; Di Capua, G.; Femia, N. Enhanced performances of a photocatalytic reactor for wastewater treatment using controlled modulation of LEDs light. Chem. Eng. Trans. 2017, 57, 553–558. [Google Scholar]
  72. Tokode, O.; Prabhu, R.; Lawton, L.; Robertson, P. Controlled periodic illumination in semiconductor photocatalysis. J. Photochem. Photobiol. A Chem. 2016, 319, 96–106. [Google Scholar] [CrossRef] [Green Version]
  73. Trinh, T.; Kim, J. Status quo in data availability and predictive models of nano-mixture toxicity. Nanomaterials 2021, 11, 124. [Google Scholar] [CrossRef]
  74. Wang, Q.; Yu, S.; Qin, W.; Wu, X. Isopropanol-assisted synthesis of highly stable MAPbBr3/p-g-C3N4 intergrowth composite photocatalysts and their interfacial charge carrier dynamics. Nanoscale Adv. 2020, 2, 274–285. [Google Scholar] [CrossRef] [Green Version]
  75. Liu, T.; Yin, K.; Liu, C.; Luo, J.; Crittenden, J.; Zhang, W.; Luo, S.; Crittenden, J.; Zhang, W.; Luo, S.; et al. The role of reactive oxygen species and carbonate radical in oxcarbazepine degradation via UV, UV/H2O2: Kinetics, mechanisms and toxicity evaluation. Water Res. 2018, 147, 204–213. [Google Scholar] [CrossRef]
  76. Alhaji, M.; Sanaullah, K.; Khan, A.; Hamza, A.; Muhammad, A.; Ishola, M.; Rigit, A.; Bhawani, S. Recent developments in immobilizing titanium dioxide on supports for degradation of organic pollutants in wastewater—A review. Int. J. Environ. Sci. Technol. 2017, 14, 2039–2052. [Google Scholar] [CrossRef]
  77. Ferreira, S.; Bruns, R.; Ferreira, H.; Matos, G.; David, J.; Brandao, G.; da Silva, E.; Portugal, L.; dos Reis, P.; Souza, A.; et al. Box-Behnken design: An alternative for the optimization of analytical methods. Analytica Chimica Acta 2007, 597, 179. [Google Scholar] [CrossRef]
  78. Xiong, P.; Hu, J. Decomposition of acetaminophen (Ace) using TiO2/UVA/LED system. Catal. Today 2017, 282, 48–56. [Google Scholar] [CrossRef]
  79. Dabić, D.; Babić, S.; Škorić, I. The role of photodegradation in the environmental fate of hydroxychloroquine. Chemosphere 2019, 230, 268–277. [Google Scholar] [CrossRef]
  80. Vinge, S.; Shaheen, S.L.; Sharpless, C.; Linden, K. Nitrate with benefits: Optimizing radical production during UV water treatment. Environ. Sci. Water Res. Technol. 2020, 6, 1163–1175. [Google Scholar] [CrossRef]
  81. Doudrick, K.; Yang, T.; Hristovski, K.; Westerhoff, P. Photocatalytic nitrate reduction in water: Managing the hole scavenger and reaction by-product selectivity. Appl. Catal. B Environ. 2013, 136–137, 40–47. [Google Scholar] [CrossRef]
  82. Qiao, Y.; Chen, D.; Wen, D. Use of coupled wavelength ultraviolet light-emitting diodes for inactivation of bacteria in subsea oil-field injection water. Sci. Total Environ. 2018, 640–641, 757–763. [Google Scholar] [CrossRef] [PubMed]
  83. Chevremont, A.; Farnet, A.; Sergent, M.; Coulomb, B.; Boudenne, J. Multivariate optimization of fecal bioindicator inactivation by coupling UV-A and UV-C LEDs. Desalination 2012, 285, 219–225. [Google Scholar] [CrossRef]
  84. Konstas, P.; Kosma, C.; Konstantinou, I.; Albanis, T. Photocatalytic Treatment of Pharmaceuticals in Real Hospital Wastewaters for Effluent Quality Amelioration. Water 2019, 11, 2165. [Google Scholar] [CrossRef] [Green Version]
  85. Yu, X.; Zhang, J.; Zhang, J.; Niu, J.; Zhao, J.; Wei, Y.; Yao, B. Photocatalytic degradation of ciprofloxacin using Zn-doped Cu2O particles: Analysis of degradation pathways and intermediates. Chem. Eng. J. 2019, 374, 316. [Google Scholar] [CrossRef]
  86. Li, W.; Zuo, Y.; Jiang, L.; Yao, D.; Chen, Z.; He, G.; Chen, H. Bi2Ti2O7/TiO2/RGO composite for the simulated sunlight-driven photocatalytic degradation of ciprofloxacin. Mater. Chem. Phys. 2020, 256, 123650. [Google Scholar] [CrossRef]
  87. Biancullo, F.; Moreira, N.; Ribeiro, A.; Manai, C.; Faria, J.; Nunes, O.; Castro-Silva, S.; Silva, A. Heterogeneous photocatalysis using UVA LEDs for the removal of antibiotics and antibiotic resistant bacteria from urban wastewater treatment plant effluents. Chem. Eng. J. 2019, 367, 304. [Google Scholar] [CrossRef]
  88. Samy, M.; Ibrahim, M.; Alalm, M.; Fujii, M.; Ookawara, S.; Ohno, T. Photocatalytic degradation of trimethoprim using S-TiO2 and Ru/WO3/ZrO2 immobilized on reusable fixed plates. J. Water Process. Eng. 2020, 33, 101012. [Google Scholar] [CrossRef]
Figure 1. kapp values for PhAC degradation individually (Ind.) and in a mixture (Mix.) in MQ water and at a concentration of 2 mg/L.
Nanomaterials 12 00295 g001
Figure 2. Pareto charts and significant effects (above Bonferroni limit) for kapp.
Nanomaterials 12 00295 g002aNanomaterials 12 00295 g002b
Figure 3. Model predictions vs. experimental kapp values for the categorical DoE.
Nanomaterials 12 00295 g003
Figure 4. Pareto charts and significant effects (above Bonferroni limit) for %TOC decrease and Δ luminescence.
Nanomaterials 12 00295 g004
Figure 5. Model predictions vs. experimental %TOC decrease and Δ luminescence for the categorical DoE.
Nanomaterials 12 00295 g005
Figure 6. Degradation in the presence of scavengers (UV-A photocatalysis in MQ water).
Nanomaterials 12 00295 g006
Figure 7. Effect of scavengers on PhACs kapp values (UV-A photocatalysis in MQ water).
Nanomaterials 12 00295 g007
Figure 8. kapp at different initial pH for the mixture of the five PhACs in MQ water, C0 = 2 mg/L each (UV-A photocatalysis).
Nanomaterials 12 00295 g008
Figure 9. Predicted vs. experimental kapp for CIP, SMX, VX, and DV (continuous surface DoE).
Nanomaterials 12 00295 g009
Figure 10. Surface graphs of kapp for CIP, SMX, VX, and DV. X-axis: coded bicarbonates; Y-axis: coded nitrates; a, b, and c of each row represents humic acids coded values of −1, 0, and +1, respectively.
Nanomaterials 12 00295 g010
Figure 11. EEO values for the five PhACs for different processes. Experiments performed on MQ water, except the ones labelled with “tap” (tap water). Experiments performed under continuous illumination, except the ones labelled with “DC“ (duty cycle = 0.50).
Nanomaterials 12 00295 g011
Table 1. Independent coded variables corresponding to the first DoE.
Independent Coded Variables−1+1
Matrix (A)MQ waterTap water
LEDs wavelength (B)272 nm (UV-C)365 nm (UV-A)
TiO2 nanofilm presence (C)NoYes
Duty Cycle (D)0.51.0 (continuous)
Table 2. Independent coded variables (quantities in mg/L) corresponding to the second DoE.
Independent Coded Variables−10+1
Bicarbonates (A)0200400
Nitrates (B)01530
Humic acids (C)01.53.0
Publisher’s Note: MDPI stays neutral with regard to jurisdictional claims in published maps and institutional affiliations.

