Article

Lanthanide(III) Ions and 5-Methylisophthalate Ligand Based Coordination Polymers: An Insight into Their Photoluminescence Emission and Chemosensing for Nitroaromatic Molecules

by
Oier Pajuelo-Corral
1,†,
Laura Razquin-Bobillo
1,†,
Sara Rojas
2,
Jose Angel García
3,
Duane Choquesillo-Lazarte
4,
Alfonso Salinas-Castillo
5,
Ricardo Hernández
1,
Antonio Rodríguez-Diéguez
2,* and
Javier Cepeda
1,*
1
Departamento de Química Aplicada, Facultad de Química, Universidad del País Vasco (UPV/EHU), 20018 Donostia, Spain
2
Departamento de Química Inorgánica, UEQ, C/Severo Ochoa s/n, University of Granada, 18071 Granada, Spain
3
Departamento de Física, Facultad de Ciencia y Tecnología, Universidad del País Vasco/Euskal Herriko Unibertsitatea (UPV/EHU), 48940 Leioa, Spain
4
Laboratorio de Estudios Cristalográficos, IACT, CSIC-Universidad de Granada, Avda. de las Palmeras 4, 18100 Armilla, Spain
5
Departamento de Química Analítica, C/Severo Ochoa s/n, University of Granada, 18071 Granada, Spain
*
Authors to whom correspondence should be addressed.
These authors contributed equally to this work.
Nanomaterials 2022, 12(22), 3977; https://0-doi-org.brum.beds.ac.uk/10.3390/nano12223977
Submission received: 15 October 2022 / Revised: 5 November 2022 / Accepted: 9 November 2022 / Published: 11 November 2022
(This article belongs to the Special Issue Theoretical Calculation and Molecular Modeling of Nanomaterials)

Abstract

:
The work presented herein reports on the synthesis, structural and physico-chemical characterization, luminescence properties and luminescent sensing activity of a family of isostructural coordination polymers (CPs) with the general formula [Ln24-5Meip)3(DMF)]n (where Ln(III) = Sm (1Sm), Eu (2Eu), Gd (3Gd), Tb (4Tb) and Yb (5Yb) and 5Meip = 5-methylisophthalate, DMF = N,N-dimethylmethanamide). Crystal structures consist of 3D frameworks tailored by the linkage between infinite lanthanide(III)-carboxylate rods by means of the tetradentate 5Meip ligands. Photoluminescence measurements in solid state at variable temperatures reveal the best-in-class properties based on the capacity of the 5Meip ligand to provide efficient energy transfers to the lanthanide(III) ions, which brings intense emissions in both the visible and near-infrared (NIR) regions. On the one hand, compound 5Yb displays characteristic lanthanide-centered bands in the NIR with sizeable intensity even at room temperature. Among the compounds emitting in the visible region, 4Tb presents a high QY of 63%, which may be explained according to computational calculations. At last, taking advantage of the good performance as well as high chemical and optical stability of 4Tb in water and methanol, its sensing capacity to detect 2,4,6-trinitrophenol (TNP) among other nitroaromatic-like explosives has been explored, obtaining high detection capacity (with Ksv around 105 M−1), low limit of detection (in the 10−6–10−7 M) and selectivity among other molecules (especially in methanol).

Graphical Abstract

1. Introduction

In recent years, coordination polymers (CPs) and their particular subclass of metal-organic frameworks (MOFs) have awakened an increasing interest, especially for researchers developing novel multifunctional materials [1,2,3,4,5] due to their structural and chemical versatility. These features are a result of the rational design by which these materials are constructed, given the endless combinations of metal centers and organic ligands that make it possible to finally obtain the desired properties [6,7,8]. In fact, these materials have been explored in a large range of interesting applications [9], such as gas adsorption and separation [10,11,12], drug or biomolecule release [13,14], heterogeneous catalysis [15,16,17], ionic conductivity [18,19] and crystallization templates, among others [20,21]. Moreover, the presence of ordered metal ions and organic molecules in the structure imbues these materials with interesting photoluminescence (PL) properties, a fact that combined with their chemical tuneability at molecular level has also boosted their use as sensors in front of an external stimuli [22,23,24]. In this sense, it is worth specifying that the stimuli can be either a physical magnitude, such as temperature change (where luminescent thermometers provide an accurate sensitivity) [25,26,27], or a target molecule, usually promoting the attenuation of the luminescence signal [28]. Microporous luminescent CPs, provided that they present an intense signal, represent an ideal choice for fabricating devices based on luminescent sensors, given that organic ligands present in both the internal and external surface of the particles may interact with the gas molecules and modify the PL performance of the bulk material [29,30]. Regarding the PL sensing, explosive detection is, without any doubt, one of the most promising applications because of its implications in anti-terrorist operations, homeland security and environmental protection in contaminated areas [30,31,32]. Among the wide variety of explosive molecules, 2,4,6-trinitrophenol (TNP) is the most employed energetic material for the construction of improvised explosive devices, mainly due to its easy synthesis, chemical stability (because it requires a primary explosive to detonate), and accessibility from stockpiled landmines, ordnances and civilian-use explosives, all of which makes its detection a task of primary importance [33,34].
In the search and development of novel CPs with enhanced PL, those built from lanthanide(III) ions have been significantly grown during the last decade because these ions exhibit large and flexible coordination geometries and also unique luminescent properties derived from their shielded 4f electron shell [34,35]. In essence, lanthanide-based MOFs (LnMOFs) or, generally speaking, lanthanide-based coordination polymers (LnCPs), owe their luminescence to the intraionic f-f transitions, which are characterized by narrow and long-lived emissions in the range of near-infrared (NIR) and visible regions of the electromagnetic spectrum [36,37]. Moreover, the shielded nature of the f-electrons somehow isolates their inner transitions from the influence of the chemical environment, in such a way that they possess a characteristic emission pattern. The main advantage of LnMOFs is the improvement of the emission by the well-known antenna effect, since the lanthanide coordination to ligands may yield an efficient ligand-to-metal energy transfer that enhances the low absorption coefficients associated to these Laporte forbidden f-f transitions [38,39,40]. In this sense, and taking into account that the effect nurtures from the metal-ligand bond strength, ligands containing good light-harvesting groups (aromatic rings, chemical functions with lone pairs, etc.) and hard donor atoms to fulfil the HSAB principle [40] (such as carboxylate groups) are appropriate to build new materials with improved PL performance [41].
Continuing with our quest for novel materials showing enhanced PL properties, and based on the previous ideas, we report herein on five isostructural 3D CPs consisting of Ln(III) ions and 5-methylisophthalate (5Meip) ligand, named GR-MOFs15–19. These compounds present very good luminescence properties given the capacity of carboxylate linker 5Meip ligand to efficiently transfer energy to the Ln(III) centers, generating metal-centered intense emissions in both the visible and NIR with significantly high quantum yields (QY), especially for the Tb counterpart. In addition to a detailed study of their performance in solid state, involving both experimental measurements and computational calculations to unravel the PL mechanism, compounds 2Eu and 4Tb also prove to keep an adequate emission in liquid suspensions. Taking advantage of this fact, the sensing capacity of these materials towards a batch of solvents and nitroaromatic molecules has been studied, where 4Tb presents a promising capacity in the detection of TNP.

2. Materials and Methods

2.1. Syntheses of [Ln24-5Meip)3(DMF)]n [Where Ln(III) = Sm (1Sm), Eu (2Eu), Gd (3Gd), Tb (4Tb) and Yb (5Yb)]

All compounds were obtained by slowly dropping an H2O-DMF solution (10 mL, 1:1) of the corresponding lanthanide(III) nitrate hydrated salt (0.4 mmol, using 0.1778 g for Sm(NO3)3·6H2O, 0.1784 g for Eu(NO3)3·6H2O, 0.1805 g for Gd(NO3)3·6H2O, 0.1812 g for Tb(NO3)3·6H2O and 0.1869 g for Yb(NO3)3·5H2O) over an H2O-DMF solution (10 mL, 1:1) of 5-methylisophthalic acid (H2-5Meip) (0.6 mmol, 0.1081 g). The resulting solution was placed in a glass vessel, closed with a screw cap and placed in an oven at 140 °C. Small crystals for 3Gd, 4Tb and 5Yb and X-ray quality single crystals for 1Sm and 2Eu were grown after 2 days. They were filtered off, washed with water and ethanol and dried. Yields (based on metal): 68% for 1Sm, 63% for 2Eu, 70% for 3Gd, 65% for 4Tb, 63% for 5Yb. Anal. Calcd for C30H25Sm2NO13 (1Sm) (%): C, 39.67; H, 2.77; N, 1.54. Found: C, 39.43; H, 2.89; N, 1.81. Anal. Calcd for C30H25Eu2O13 (2Eu) (%): C, 39.53; H, 2.76; N, 1.54. Found: C, 39.25; H, 2.91; N, 1.78. Anal. Calcd for C30H25Gd2NO13 (3Gd) (%): C, 39.08; H, 2.73; N, 1.52. Found: C, 39.18; H, 3.03; N, 1.72. Anal. Calcd for C30H25Tb2NO13 (4Tb) (%): C, 38.94; H, 2.72; N, 1.51. Found: C, 39.10; H, 2.89; N, 1.64. Anal. Calcd for C30H25NO13Yb2 (5Yb) (%): C, 37.79; H, 2.64; N, 1.47. Found: C, 37.53; H, 2.49; N, 1.55.

2.2. Physical Measurements

Elemental analyses (C, H, N) were performed on a Leco CHNS-932 microanalyzer. IR spectra were acquired on diluted KBr pellets in a ThermoNicolet IR 200 spectrometer in the 4000–400 cm−1 spectral region. Thermal analyses (TG/DTA) were performed on a TA Instruments SDT 2960 thermal analyzer in a synthetic air atmosphere (79% N2/21% O2) with a heating rate of 5 °C·min−1.

2.3. X-ray Diffraction Data Collection and Structure Determination

X-ray data collections were performed on suitable single crystals of compounds 1Sm and 2Eu on a Bruker VENTURE diffractometer equipped with area detector and graphite monochromated Mo Kα radiation (λ = 0.71073 Å) through the ω-scan method at 130(2) K. The data reduction was performed with the APEX2 [42] software, correcting the absorption of the crystal with SADABS [43]. The crystal structures were solved by direct methods using the SHELXT program [44] and refined by full-matrix least-squares on F2 including all reflections with OLEX2 crystallographic package [45]. All hydrogen atoms were introduced in the difference Fourier map as fixed contributions using riding models with isotropic thermal displacement parameters of 1.2-times those of their parent atoms in both the 5Meip ligand and DMF molecules. The main crystallographic details and refinement data are gathered in Table 1.
The X-ray powder diffraction (XRPD) patterns were measured on grounded single crystals or polycrystalline samples with a Philips X’PERT powder diffractometer equipped with Cu-Kα radiation (λ = 1.5418 Å). The patterns were acquired over the 5 < 2θ < 50° range with a step size of 0.026° and an acquisition time of 2.5 s per step at 25 °C. Indexation of the diffraction profiles was made using FULLPROF program (pattern matching analysis) [46] on the basis of the space group and cell parameters obtained for single crystal X-ray diffraction of 1Sm.

2.4. Photoluminescence Measurements

Fluorescence excitation and emission spectra and lifetime measurements on solid state were recorded on an Edinburgh Instruments FLS920 spectrometer at variable temperatures using a closed-cycle helium cryostat enclosed in the spectrometer. For steady-state measurements, a Müller-Elektronik-Optik SVX1450 Xe lamp or an IK3552R-G He–Cd continuous laser (325 nm) were used as excitation sources, whereas a microsecond pulsed µF900 lamp was used for the decay curves. The emission spectra in the NIR region and the decay curves were acquired on a Hamamatsu NIR-PMT PicoQuant FluoTime 200 detector. For the variable temperature measurements in solid state, the samples were first placed under high vacuum (of ca. 10−9 mbar) to avoid the presence of oxygen or water in the sample holder. For the measurements performed at room temperature on the liquid suspensions (sensing experiments), the spectra were collected on quartz cuvettes (see Luminescence Sensing Experiments section) using a Varian Cary-Eclipse Fluorescence spectrofluorometer. The photomultiplier detector voltage was set at 600 V and the instrument excitation and emission slits were open 5 nm. The quantum yield was measured in the solid state by means of a Horiba Quanta-f integrating sphere using an Oriel Instruments MS257 lamp as the excitation source and an iHR550 spectrometer from Horiba to analyze the emission. Five measurements were accomplished to properly estimate the mean and standard deviation values for each compound. Photographs of irradiated single-crystals and polycrystalline samples were taken at room temperature in a micro-PL system included in an Olympus optical microscope illuminated with a Hg lamp.

2.5. Luminescence Detection Experiments

For the sensing experiments conducted for compounds 2Eu and 4Tb, their emission capacity was first measured into different solvents by dispersing 5 mg of powder samples of the compounds into 5 mL of the corresponding solvent (water, methanol (MeOH), ethanol (EtOH), 2-isopropanol (2-isoPro), dimethylformamide (DMF), acetonitrile (MeCN), tetrahydrofurane (THF), dimethylsulfoxide (DMSO), acetone (AcO), toluene (Tol) and p-xilene). In view of the low quenching capacity of water, the dispersions for the nitroaromatics sensing experiments were prepared by adding 5 mg of powder sample of 4Tb in 5 mL of an aqueous solution of 0.1 mM concentration of the corresponding nitroaromatic molecule. Quite stable suspensions were achieved after sonicating the mixture for 15 min. In view of the high sensitivity exhibited towards 2,4,6-trinitrophenol (TNP), the luminescence signal was studied according to its concentration in water. To that end, a diluted solution of TNP (0.1 mM) was added (10 μL in each addition) to the initial 4Tb@H2O mixture and once homogenized, an emission spectrum was recorded keeping the same setup configuration. The quenching curves were quantitatively analyzed by the Stern-Volmer equation (as detailed in Section S7 of the ESI), using the first suspension as a reference and calculating the concentration of the analyte from the total volume of the mixture. The detection limit was calculated according to the IUPAC recommendation of 3σ/slope, where the standard deviation σ is estimated by ten repeated fluorescence measurements of the blank dispersion of 4Tb@H2O, and the slope value is obtained using a calibration curve of the fluorescence intensity against the concentration of TNP [47].

2.6. Computational Details

All Sparkle calculations were carried out using MOPAC2016 and all RM1 model for europium calculations were carried out by a modified version of the same software [48]. Calculations were performed either at the crystallographic geometry, or by fully optimizing the geometry at the particular level of theory, taking care to ensure the absence of imaginary vibrational frequencies. The Judd-Ofelt intensity parameters were calculated using the Lanthanide Luminescence Software Package (LUMPAC) [49].

3. Results and Discussion
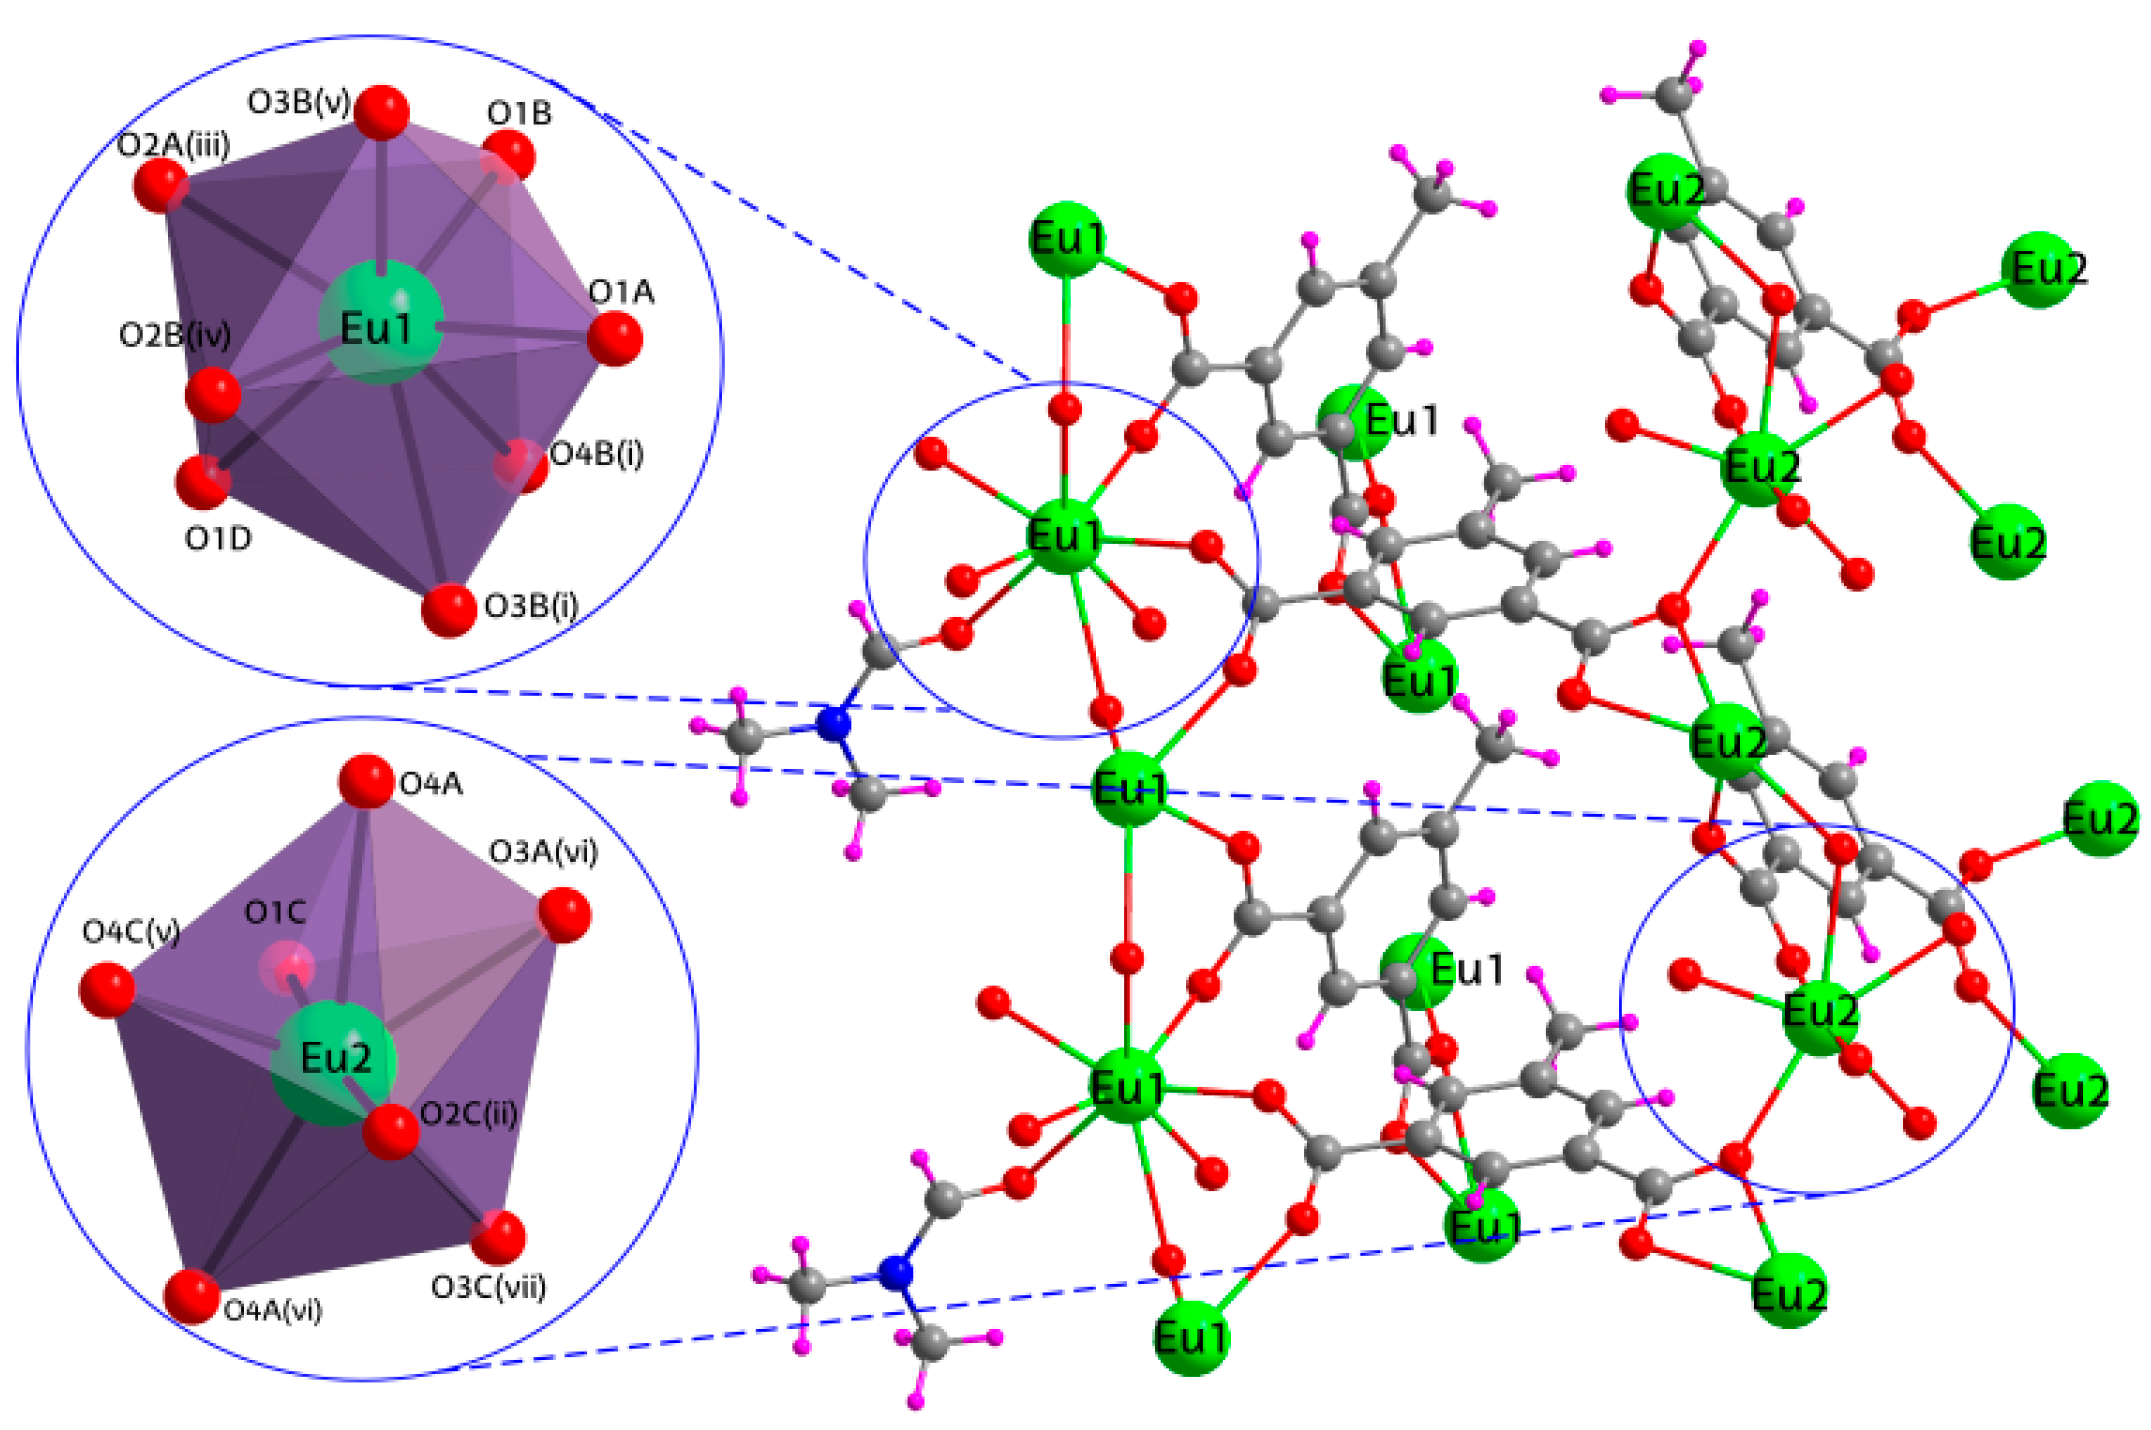
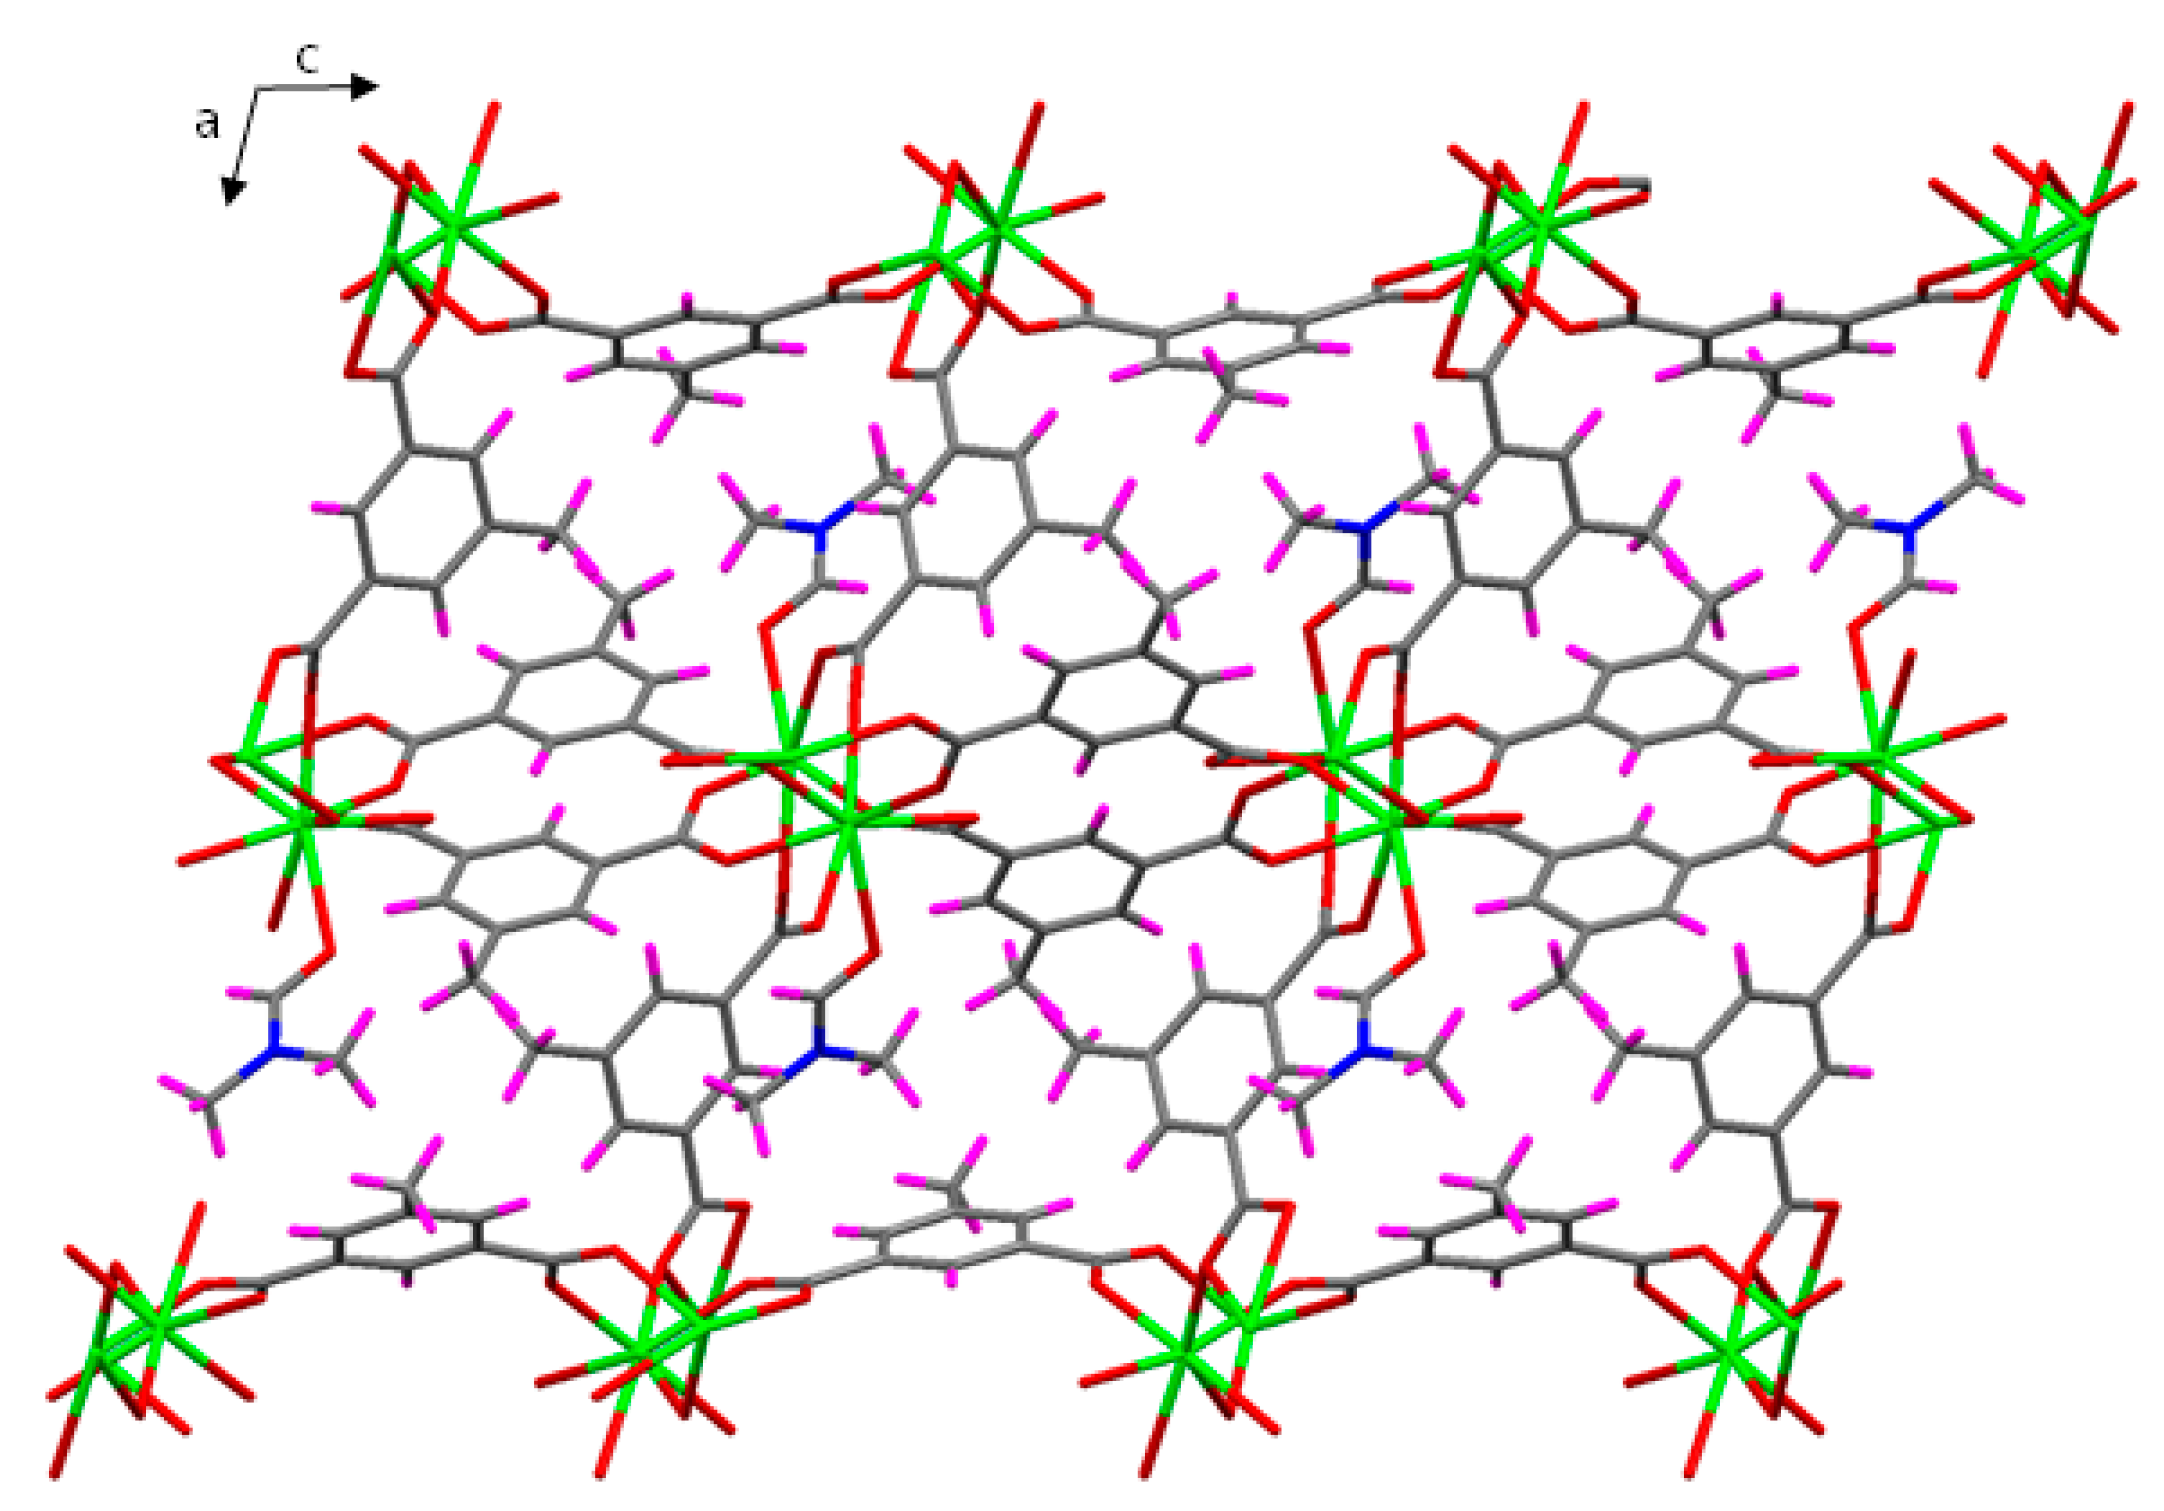
3.1. Structural Description of [Ln24-5Meip)3(DMF)]n [Where Ln(III) = Sm (1Sm), Eu (2Eu), Gd (3Gd), Tb (4Tb) and Yb (5Yb)]

The synthesized CPs are isostructural, as revealed by the analysis of the X-ray diffraction data, and crystallize in the P21/c space group in the form of a three-dimensional structure. Therefore, only compound 2Eu will be described in detail as a representative counterpart. The asymmetric unit consists of two europium(III) metal atoms, Eu1 and Eu2, three 5Meip ligands and a coordinated DMF molecule, which precisely concords with the neutral chemical formula of the compound. The Eu1 atom is coordinated by eight oxygen atoms, seven from carboxylate groups of 5Meip ligands and one from the DMF molecule, whereas the Eu2 atom is not coordinated to any DMF molecule, so it binds to seven carboxylate oxygen atoms (Figure 1). Both centers share the occurrence of displaying a unique chelating carboxylate moiety. According to the continuous shape measures (CShMs) performed by SHAPE program [50], the coordination sphere of Eu1 resembles a biaugmented trigonal prism (BTPR) (SJBTPR = 1.936), characterized for the C2V symmetry (Table 2). Instead, Eu2 atom shows a more regular pentagonal bipyramidal environment (SPBPY = 1.403), which presents an ideal D5h symmetry.
The three independent 5Meip ligands bind to Eu(III) ions with tetradentate modes with slightly different coordination patterns. On the one hand, two of them, denoted as A and B (see Figure S1 in the ESI), are equivalent and show the µ4-κO:κ2O,O’:κO’’:κO’’’ coordination mode, which contains the four-membered chelate ring. Moreover, the O3B atom is linked to two Eu1 atoms acting as a bridge between them. The unique difference between A and B is that the former is coordinated to Eu1 and Eu2 atoms separately by each carboxylate side, whereas the latter exclusively coordinates to Eu1 atoms. The third ligand of the asymmetric unit (C molecule) shows the µ4-κO:κO’:κO’’:κO’’’ coordination mode, in which each oxygen atom binds to one Eu2 atom (see Figure S2 in the ESI). The shortest intermetallic distance mediated by carboxylate groups are Eu1∙∙∙Eu1 of 4.430 Å and Eu2∙∙∙Eu2 of 4.324 Å, in which the bridging-chelating modes of A and B ligands are present. As for the three-dimensional structure, the Eu1 ions bind to each other with the B ligand and the Eu2 ions with the C ligand, building metal-carboxylate rods in both cases along the crystallographic b axis. The junction among the chains takes place by both B and C ligands, intertwining rods of the same Eu atom, whereas A ligands, for their part, establish the links join the Eu1-based and Eu2-based rods one another (Figure 2).
As a result, the 3D framework presents no solvent accessible voids because the potential pores are blocked by the coordinated DMF molecule. From a topological point of view, this framework may be described as a five-connected network in which both the three ligands (four-connected) and Eu(III) ions (six-connected) act as nodes, which presents as (42·84)(44·62)2(48·66·8)2 and belongs to the fsy topology.

3.2. Luminescence Properties

Lanthanide-based emissions in crystalline materials, such as CPs, are known to be useful for developing solid-state photodevices [25,51] given their intense emissions in the visible spectra or in the NIR region [52,53]. Therefore, photoluminescence measurements were performed on polycrystalline samples of all compounds to study their properties.

3.2.1. Photoluminescence of 3Gd and H2-5Meip-Centred Emission Analysis

To start with, we first inspected the PL of the compound 3Gd because, having no other possible inner emission line except for that at 317 nm when an UV light of 248 nm is used [54], Gd(III)-based counterpart represents faithfully the electronic structure of the ligand in the present crystalline framework. Under excitation of laser light (λex = 325 nm), the emission spectrum presents a wide band containing two shoulders at 383 and 418 nm and the maximum sited at 505 nm (with a shoulder at 465 nm, see Figure S14). Monitoring the emission maximum, the excitation spectrum reveals the presence of a wide and band peaking at 340 nm, in agreement with the molecular nature of the ligand-centered process. In this sense, it must be remarked that both the emission spectra are substantially different to that of the free H2-5Meip ligand sample, since the main emission band is blue-shifted whereas the first bands (with comparatively less intensity than in the ligand) are almost maintained (Figures S10–S12). Time-dependent DFT (TDDFT) calculations performed on a suitable model of the ligand molecule (see Computational details for further information) reproduced both spectra and revealed that the main excitation and emission of H2-5Meip are attributed to π-π* transitions occurring between molecular orbitals extended over the carboxylate groups and aromatic rings. Taking into account that in the structure of these Ln-MOFs the MOs localized on both carboxylate groups and π-clouds of the aromatic ring are significantly affected by the coordination to the Ln and by the π-π stacking interactions of the ligands, respectively, the observed shifts in the bands are expected (see ESI for detailed explanation). Seeking for a possible explanation of the observed shift, additional TDDFT calculations were also computed on a monomeric complex directly taken from the RX coordinates of compound 3Gd. Although the excitation spectrum reproduces the experimental one fairly well, the emission could not be correctly simulated using singlet-to-singlet transitions, since the most intense bands found in the computed emission (λem = 414 and 475 nm) seem to correspond to shoulders of the experimental spectrum (λem = 383 and 418 nm), whereas the main experimental band (λem = 505 nm) is not observed. Seeking for a possible explanation, we turned to the idea that isophthalate derivatives are known to possess phosphorescent emissions, as proven by some CPs based on alkaline-earth ions published by us [55]. In these compounds, the phosphorescence is derived from the effective shielding of the low-energy triplet excitons occurring in the framework mainly because of the low mobility of the ligand in the framework (owing to its coordination to metal ions) and also due to the heavy atom effect [56,57]. Another emission calculation based on the previously computed excitation but using the singlet-to-triplet methodology gave rise to an emission spectrum dominated by a main band peaking at 510 nm with a shoulder at 450, representative of the main experimental band (λem = 505 nm with shoulder at 465 nm), in such a way that it supports the fact that the observed main emission derives from the triplet and not from singlet states. The MOs involved in this singlet ← triplet emission present a similar shape to those of the previously mentioned singlet ← singlet transition, which may be a possible reason for the intersystem crossing to occur. The decay curves collected on the sample at the emission maximum (λem = 505 nm) confirmed the phosphorescent nature of the main process, since the lifetime was estimated to be of 494 µs according to the exponential fitting (see Figure S24). It is worth noticing that this delayed emission is quite weak as depicted from the low intensity observed in the measurement. Moreover, assuming that this emission band concerns the lowest-lying triplet state, as dictated by Kasha’s rule [58], the energy of that state may be estimated to be at about 22,000 cm−1 over the ground state, which is within the range found for other related ligands. The calculation of the vertical excitation (singlet-to-triplet transition) upon the ligand molecule at the triplet state geometry gives a reasonable energy (22,912 cm−1) that agrees with the experimental estimation (Figure S18). These data may be relevant to explain the suitability of the ligand for the sensitization of the remaining luminescent ions, given that the triplet energy level is a key parameter in the energy transfer processes governing the luminescence of CPs (vide infra).

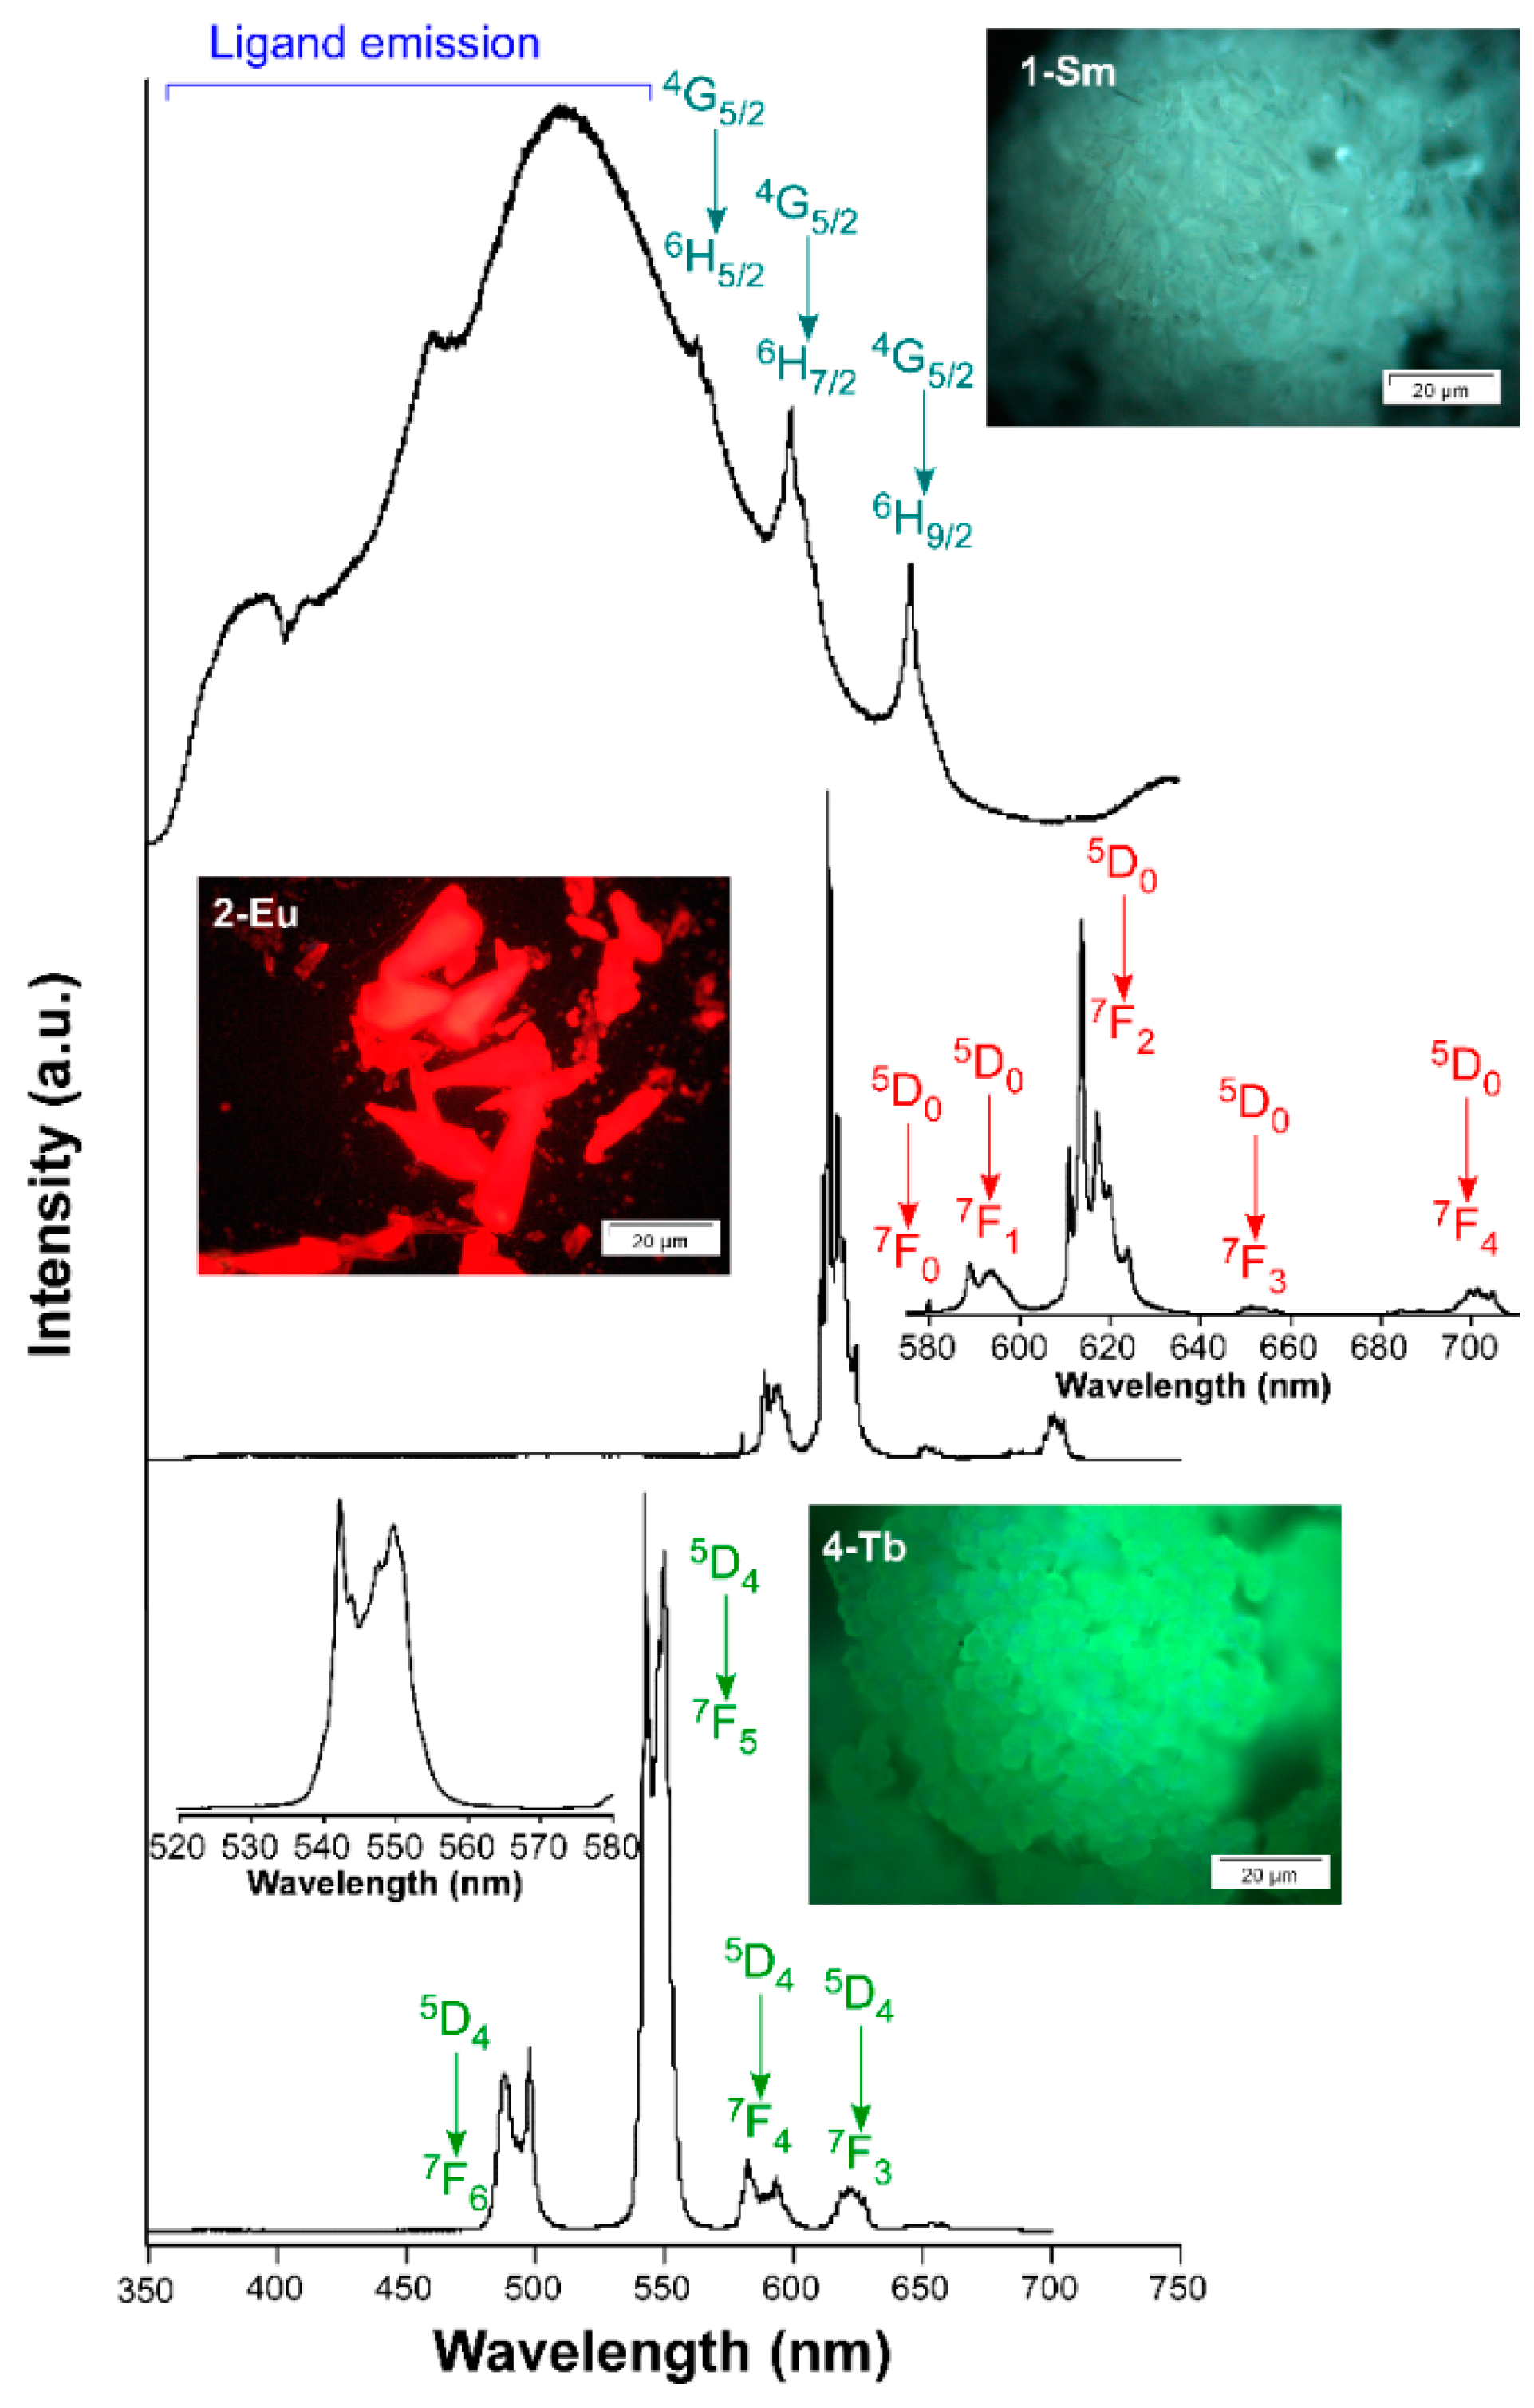
3.2.2. Photoluminescence Performance of Visible Emitters (1Sm, 2Eu and 4Tb)

To follow with the compounds emitting in the visible range, a sample of 1Sm was excited under laser irradiation (λex = 325 nm) at RT to collect the corresponding emission spectrum (Figure 3). This spectrum is characterized for a similar pattern of that shown for 3Gd, because the main band corresponding to the ligand emission is almost unchanged while three narrow contributions at λem = 563, 600 and 646 nm are observed. The latter bands may be attributed to Sm(III)-centered emissions assigned to 6HJ4G5/2 transitions according to the bibliography (where J = 5/2, 7/2 and 9/2), among which the first one, practically immersed into the ligand-centered emission, is the most intense [59,60]. In fact, when excitation spectra are recorded focusing on both λem = 600 and 646 nm, a set of narrow and intense bands (attributed to intraionic 4f transitions) arising from a wide band covering the 300–450 nm range is observed (Figure S19). It is worth noticing that the intensity of these inner transitions is notoriously different for each emission line, a fact not commonly observed in other compounds.
In any case, the opposite situation is found in the excitation of this compound with regard to the intensity of the bands, which is characteristic of low sensitization of Sm(III) by the ligand. Surprisingly, when the temperature of the sample is cooled down to 10 K, the Sm-centered emission lines are comparatively less intense than the ligand-based pattern, which is an unexpected behavior because the antennae effect is usually enhanced with the decrease in the temperature [49,61]. However, in the present case, the cryoscopic decrease does not seem to affect the ligand-to-samarium energy transfer capacity while it substantially reduces the vibrational quenching in the ligand molecule, thus bringing an increase in the latter signal which, in turn, seems to mask the Sm-centered bands [62]. The excitation of compound 2Eu under UV laser light (λex = 325 nm) gives an emission spectrum containing, apart from a negligible band covering the 400–550 nm range, the characteristic narrow bands ascribed to the Eu-centered transitions (Figure 3). In particular, five groups of signals are observed: a single narrow band at 580 nm and multiplets centered at 592, 616, 653 and 703 nm, which are assigned to 7FJ5D0 transitions (where J = 0, 1 2, 3 and 4). Among these bands, the third multiplet (7F25D0 transition), known as hypersensitive, dominates the spectrum with an integrated intensity of more than four times that of the 7F15D0 (222,603 vs. 50,509 counts), a fact that is in agreement with the low symmetry of the Eu sites in the crystal structure. Monitoring the main emission line, the excitation spectrum exhibits a wide band centered at 375 nm in which two contributions (305 and 340 nm) may be observed, which correspond to ligand-centered excitations. Moreover, the spectrum contains stronger narrow bands attributed to the intraionic f-f transitions, among which that sited at 395 nm is the strongest one. Cooling down the sample to 10 K brings an increase in the emission intensity (see Figure S29) that, in the present case, is not only motivated by the decrease in the vibrational quenching but also by the shift occurred in the first ligand-centered band of the excitation spectrum, in such a way that the intensity is higher at λex = 325 nm (see Figure S21). When Tb(III) ion is coordinated to 5Meip ligands in the three-dimensional network of compound 4Tb, it displays a bright green emission upon irradiation with UV light. Under monochromatic laser beam (λex = 325 nm), the emission spectrum displays four multiplets centered at 493 nm (7F65D4), 547 nm (7F55D4), 588 nm (7F45D4) and 623 nm (7F35D4) corresponding to the mentioned intraionic transitions. With much less intensity, a fifth multiplet around 654 nm is also observed, with may be attributed to the transitions of the excited state to the lower-lying states of the ground state (7FJ5D4, being J = 2, 1 and 0, see Figure 3). Among all those bands, the second one is the most intense with an intensity that quadruples that of the first band. Under a fixed emission at the most intense peak of the 7F55D4 multiplet (λem = 542 nm), the excitation spectrum contains a wide band covering the 250–350 nm range that is assigned to the 5Meip ligand excitation, in agreement with that observed for 3Gd. The absence of any Tb(III)-centered narrow lines in the excitation spectra, a priori, indicates that this ligand exerts a good antennae effect. Cooling down the sample to 10 K does not bring a significant difference in the emission but for the expected increase in the intensity derived from the decrease of the vibrational quenching (Figures S22 and S23). To further analyze the emissive properties, the decay curves were recorded at the most intense emission wavelengths to check the lifetimes of the corresponding excited states: 600 nm (4G5/2) for 1Sm, 616 nm (5D0) for 2Eu and 542 nm (5D4) for 4Tb. All the curves show a curvilinear exponential shape (expressed in the form of log(intensity) vs. time plot) that suggests that the emission occurs from more than one radiative component, in agreement with the fact that the crystal structure contains two independent lanthanide(III) centers. Accordingly, the curves were fitted to a multi-exponential expression (It = A0 + A1exp(t/τ1) + A2exp(t/τ2) + A3exp(t/τ3)). Note that a third component had to be included in the fitting of compound 2Eu to correctly reproduce the data close to the pulse of the lamp. The lifetimes were estimated by means of the weighted sum of the components, obtaining the values of 12.6(2) µs (for 1Sm), 289(11) µs (for 2Eu) and 806(8) µs (for 4Tb). These results are in line with other previously reported CPs based on eight-coordinated Ln environments [53,61,63]. The cooling of the samples to 13 K does not affect the emission lifetimes (they are kept as 12.9(2) µs for 1Sm and 816(8) µs for 4Tb) except for the Eu(III) counterpart, in which the lifetime increases to 543(14) µs at low temperature. On its part, the decay curve measured for 1Sm at 510 nm in the ligand emission pattern shows a lifetime of 772 ns, which remains far below that measured for 3Gd (494 µs) and falls in the range of fluorescence. The reason for the shortening of the ligand-centered emission in 1Sm could be due to the coupling between the triplet state and the excited states of the lanthanide(III) ion, in such a way that the charge is donated from the former to the latter partially preventing the delayed emission from the triplet to the ground state.
Additionally, the absolute emission quantum yields (QY) were also measured in the solid state at room temperature by means of an integrating sphere, using the same excitation and emission conditions as for the estimation of lifetimes. Among them, compound 4Tb showed the highest QY with a value of 63(2)%, followed by 2Eu with 12(2)% and a low value of 1.5(1) % for 1Sm. Taking into account that the triplet state is estimated to lye at ca. 22,900 cm−1 over the ground state and that the emitting states of lanthanide(III) atoms are known to lye at the following energies: 5D4 for Tb(III) ≈ 20,500 cm−1, 5D0 for Eu(III) ≈ 17,500 cm−1, and 4G5/2 for Sm(III) ≈ 17,700 cm−1) [64], it may be stated that the system obeys Latva’s empirical rule [65]. This rule estimates that the optimal ligand-to-metal energy transfer process occurs when the afore mentioned energy gap falls in the 2500–4000 cm−1 range, meaning that although a direct transfer may be occurring to Tb(III), it should involve other high-lying excited states for Eu(III)- and Sm(III)-based compounds.

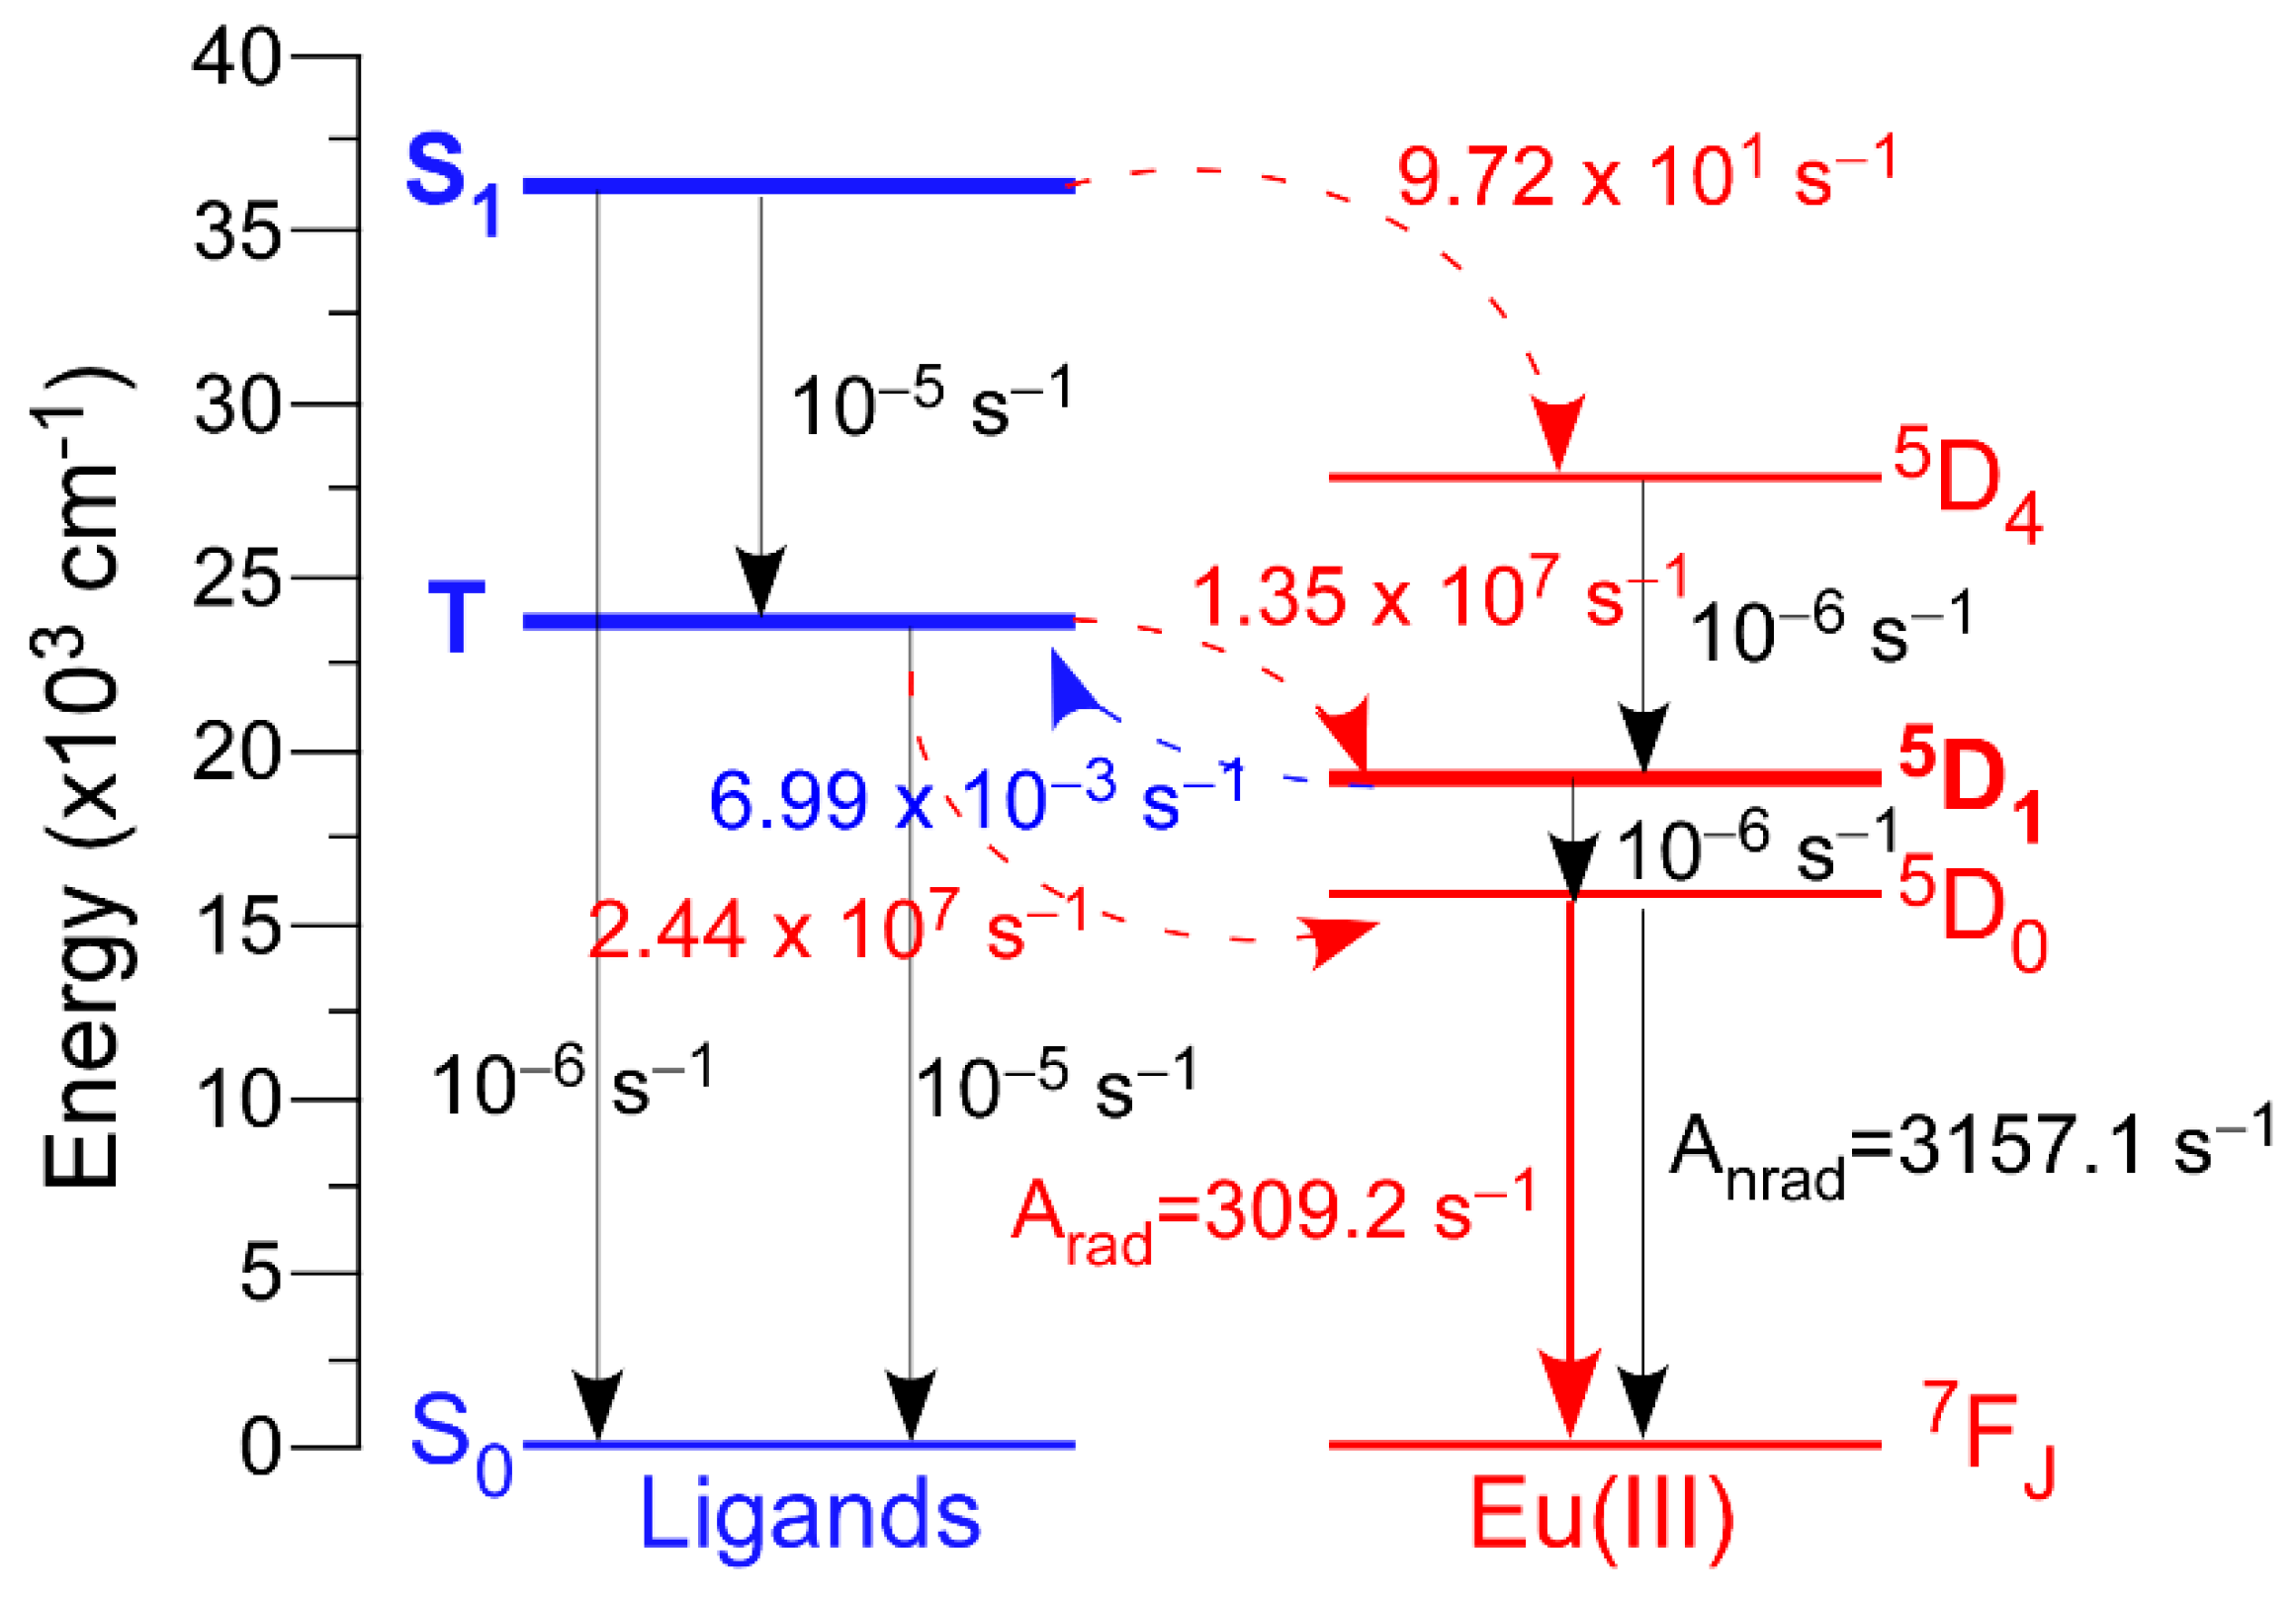
3.2.3. Theoretical Analysis of the Luminescence on Compound 2Eu

In order to better understand the luminescence properties of these isostructural compounds, 2Eu has been taken as a representative example in which describe in depth the most relevant parameters governing the transfers occurring in the lanthanide/5Meip system. This analysis has been done on the basis of the experimentally recorded spectra by means of LUMPAC program [66], which has been previously used to discuss the luminescence mechanism [67,68,69,70]. To that end, we employed two models of the compound (models 2-Eu-1 and 2-Eu-2 hereafter) using the spherical atomic coordinates of the coordination excerpt of the two crystallographically independent centers (see Computational Details section). These coordinates were optimized by the Sparkle/RM1 model and charge factor (g) and polarizability (α) were estimated according to the experimental emission spectra (Table S2). Fitting of the data by LUMPAC allowed for the estimating of the Judd-Offelt parameter as 7.93 × 10⁻²⁰ cm−1 and 7.68 × 10⁻²⁰ cm−12), 1.03 × 10⁻²⁰ cm−1 and 1.93 × 10⁻²⁰ cm−14) and 0.45 × 10⁻²⁰ cm−1 and 0.06 × 10⁻²⁰ cm−16), from which the intensity parameters were estimated as follows: Arad equals to 309.13 and 303.16 s−1 for 2-Eu-1 and 2-Eu-2, respectively, with the main contribution to the radiative decay rate by 7F25D0 transition (78.5 and 74.6 s−1). Taking into account the experimental lifetime of 0.289 ms at RT, the non-radiative rate (Anrad) was determined to be of 3157.1 and 3139.3 s−1, respectively for 2-Eu-1 and 2-Eu-2. In view of the very similar results for both centers, we thought that the mean data could represent the system.
Another relevant parameter that describes the energy transfers occurring in this compound is the energy of the ligand’s excited states. To that end, the configuration interaction simple (CIS) of INDO/S implemented into ORCA program was employed [71]. These calculations set the singlet (S) and triplet (T) excited states around 36,000 (36,046 and 36,360 cm−1, respectively for 2-Eu-1 and 2-Eu-2) and 23,700 cm−1 (23,737 and 23,608 cm−1 for 2-Eu-1 and 2-Eu-2). Among these data, it is worth remarking the good fit found for the energy of the triplet state, lying at 22,912 cm−1. The non-radiative energy transfer rates between the ligands’ and Eu(III) excited states were also calculated by means of Malta’s models [70], which consider the occurrence of three mechanisms for the excitation of metal ions during the antenna effect: dipole-2λpole, dipole-dipole and exchange. Taking model 2-Eu-1 as representative for both centers, it could be confirmed that this compound presents an appropriate antenna effect given the large value found for the dominant triplet (T) → 5D1,0 multipolar transfers (WET being 2.44 × 10⁷ and 1.35 × 10⁷ s−1, respectively) when compared, for instance, with the low transfer rate observed for singlet (S) → 5D4 (WET = 9.72 101 s−1) (Figure 4). In addition, the back-transfer rates are significantly poor (among which the T ← 5D1 is the dominant with values of WBET = 6.99 × 10⁻³ s−1), reaffirming the effectivity of the ligand-mediated energy transfer mechanism. Another relevant aspect to mention is that O2B(ii) atom of the Eu1 center is the greatest contributor to the radiative component of the compound, with 38% of the electric dipole mediated Arad. A close inspection of this atom shows that it pertains to the carboxylate group presenting the lowest angle with regard to the mean plane of the aromatic ring of 5Meip ligand (that is, it is most coplanar carboxylate group). This fact becomes relevant on the basis of the shape of the MO describing the triplet state of the 5Meip ligand which, as detailed above (see also Figure S18), corresponds to a π orbital extended through the whole molecule. Being that so, the carboxylate-to-aromatic ring coplanarity may bring a higher overlap of the LUMO with the Ln-based inner orbitals and hence, an improved energy transfer (see Section S1 in the ESI for more details). This trend is also maintained for the ligands forming the chromophore of Eu2 center. Using all these data, the quantum efficiency is determined as 8.73% (mean value for models 2-Eu-1 (8.60%) and 2-Eu-2 (8.85%)), which serves as another indication of the goodness of these calculations given the similarity to the experimentally measured value (12%).

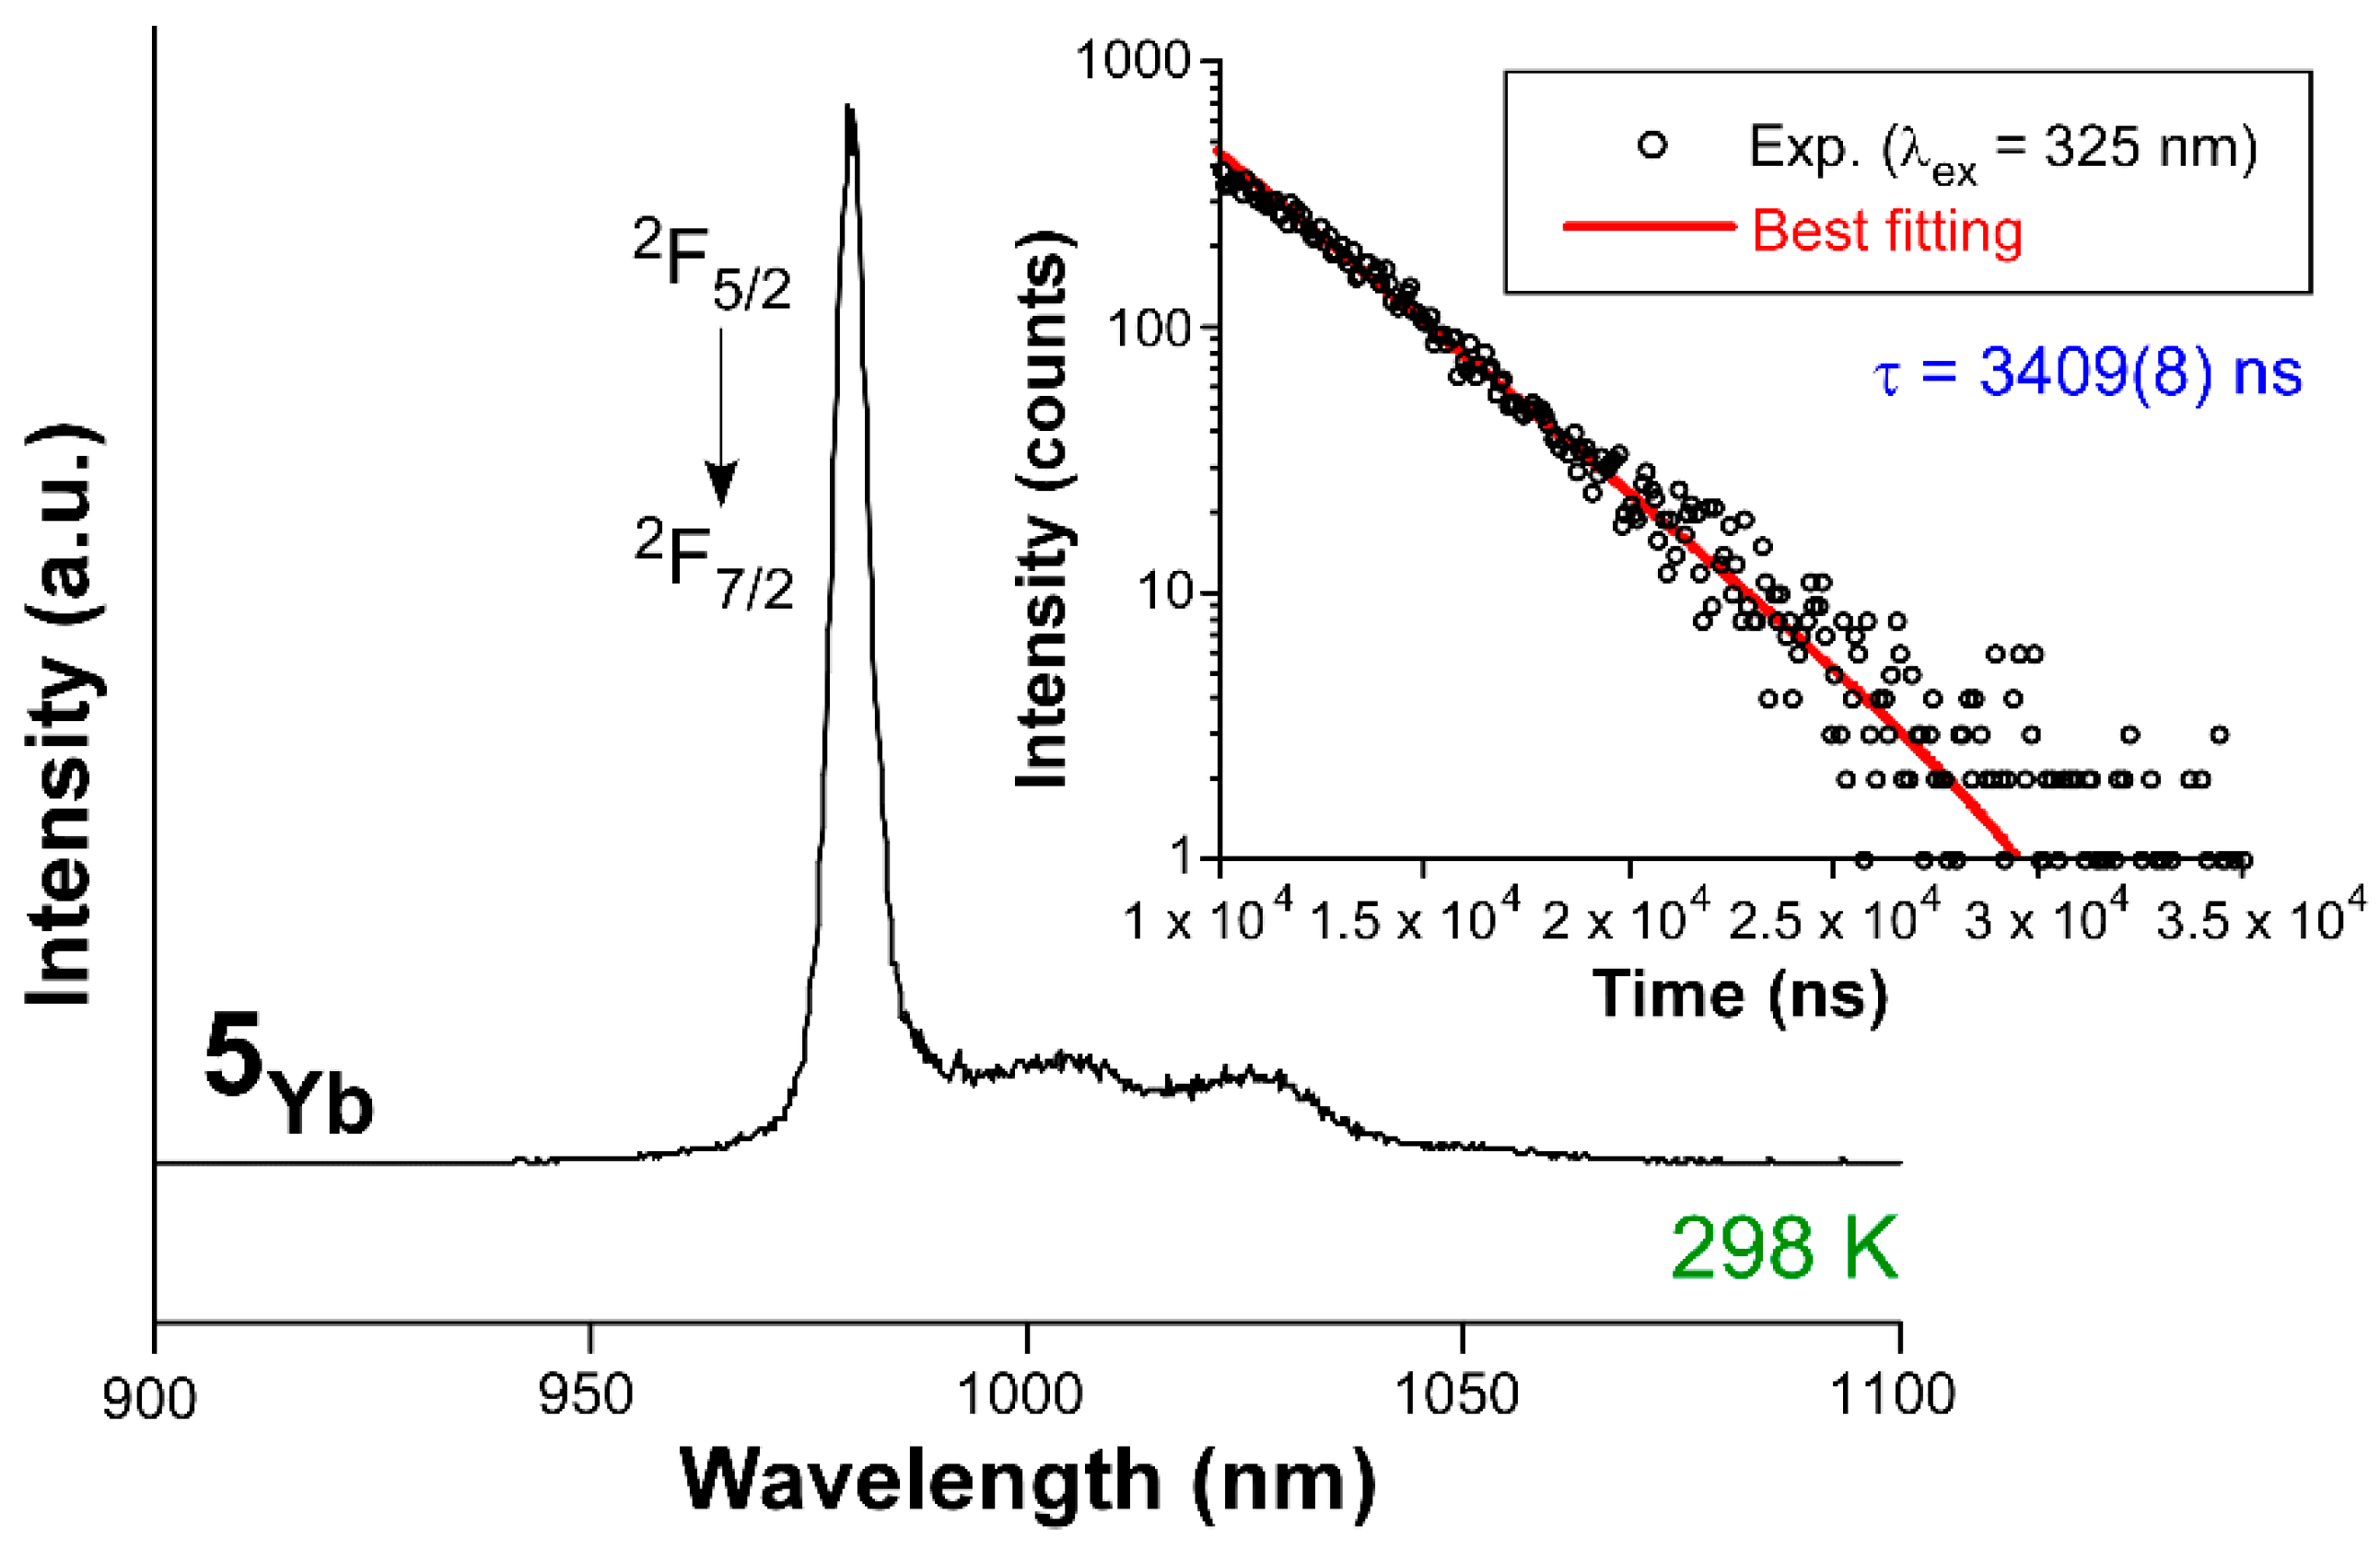
3.2.4. Photoluminescence Performance of the NIR Emitter 5Yb

At last, PL measurements were also performed for compound 5Yb to check its potential emission capacity in the NIR range. The photoluminescent characterization of compound 5Yb (Figure 5) revealed that, at RT and under UV laser light (λex = 325 nm), it exhibits a similar emission profile compared to 3Gd, showing a wide band with the maximum centered at 500 nm (Figure S31). This fact is, a priori, a good indication for the properties of the compound because the emission could be dominated by the population of the triplet state, a fact that could enable the antenna effect. As confirmed by the decay curve measurement at the emission maximum, it is characterized by a long-lived process with an emission lifetime of ca. 300 µs (Figure S32). Under these conditions, the bulk sample also presents a sharp emission in the NIR region that is characteristic for the Yb(III) ion, since it is majorly composed of a narrow and intense band peaking at 980 nm corresponding to the 2F7/22F5/2 transition. This main transition is accompanied by two weak wide bands at 1005 and 1027 nm, which could be part of less probable emission of the same multiplet. The NIR emission of MOFs at room temperature is not commonly appreciated, as largely discussed earlier [72,73], because these sorts of low-energy transitions are easily quenched at room temperature. The fitting of the decay curve measured at the previous emission line gives a lifetime of 3409(8) ns. We also checked the evolution of the emission by dropping the temperature of the sample to 10 K. As observed in the ESI (Figure S33), the emission spectra remain almost unchanged, although there is an enhancement of the signal intensity and the two weak wide bands are better defined. Interestingly, the emission lifetime is almost duplicated, reaching a τ of 6784(9) ns (Figure S34). The measured values are somewhat short and fit within the range for other Yb-based complexes [74,75]. Therefore, these measurements raise their interest for some abovementioned specific biomedical applications in which short emissions in the NIR are needed in response to the light stimulus.

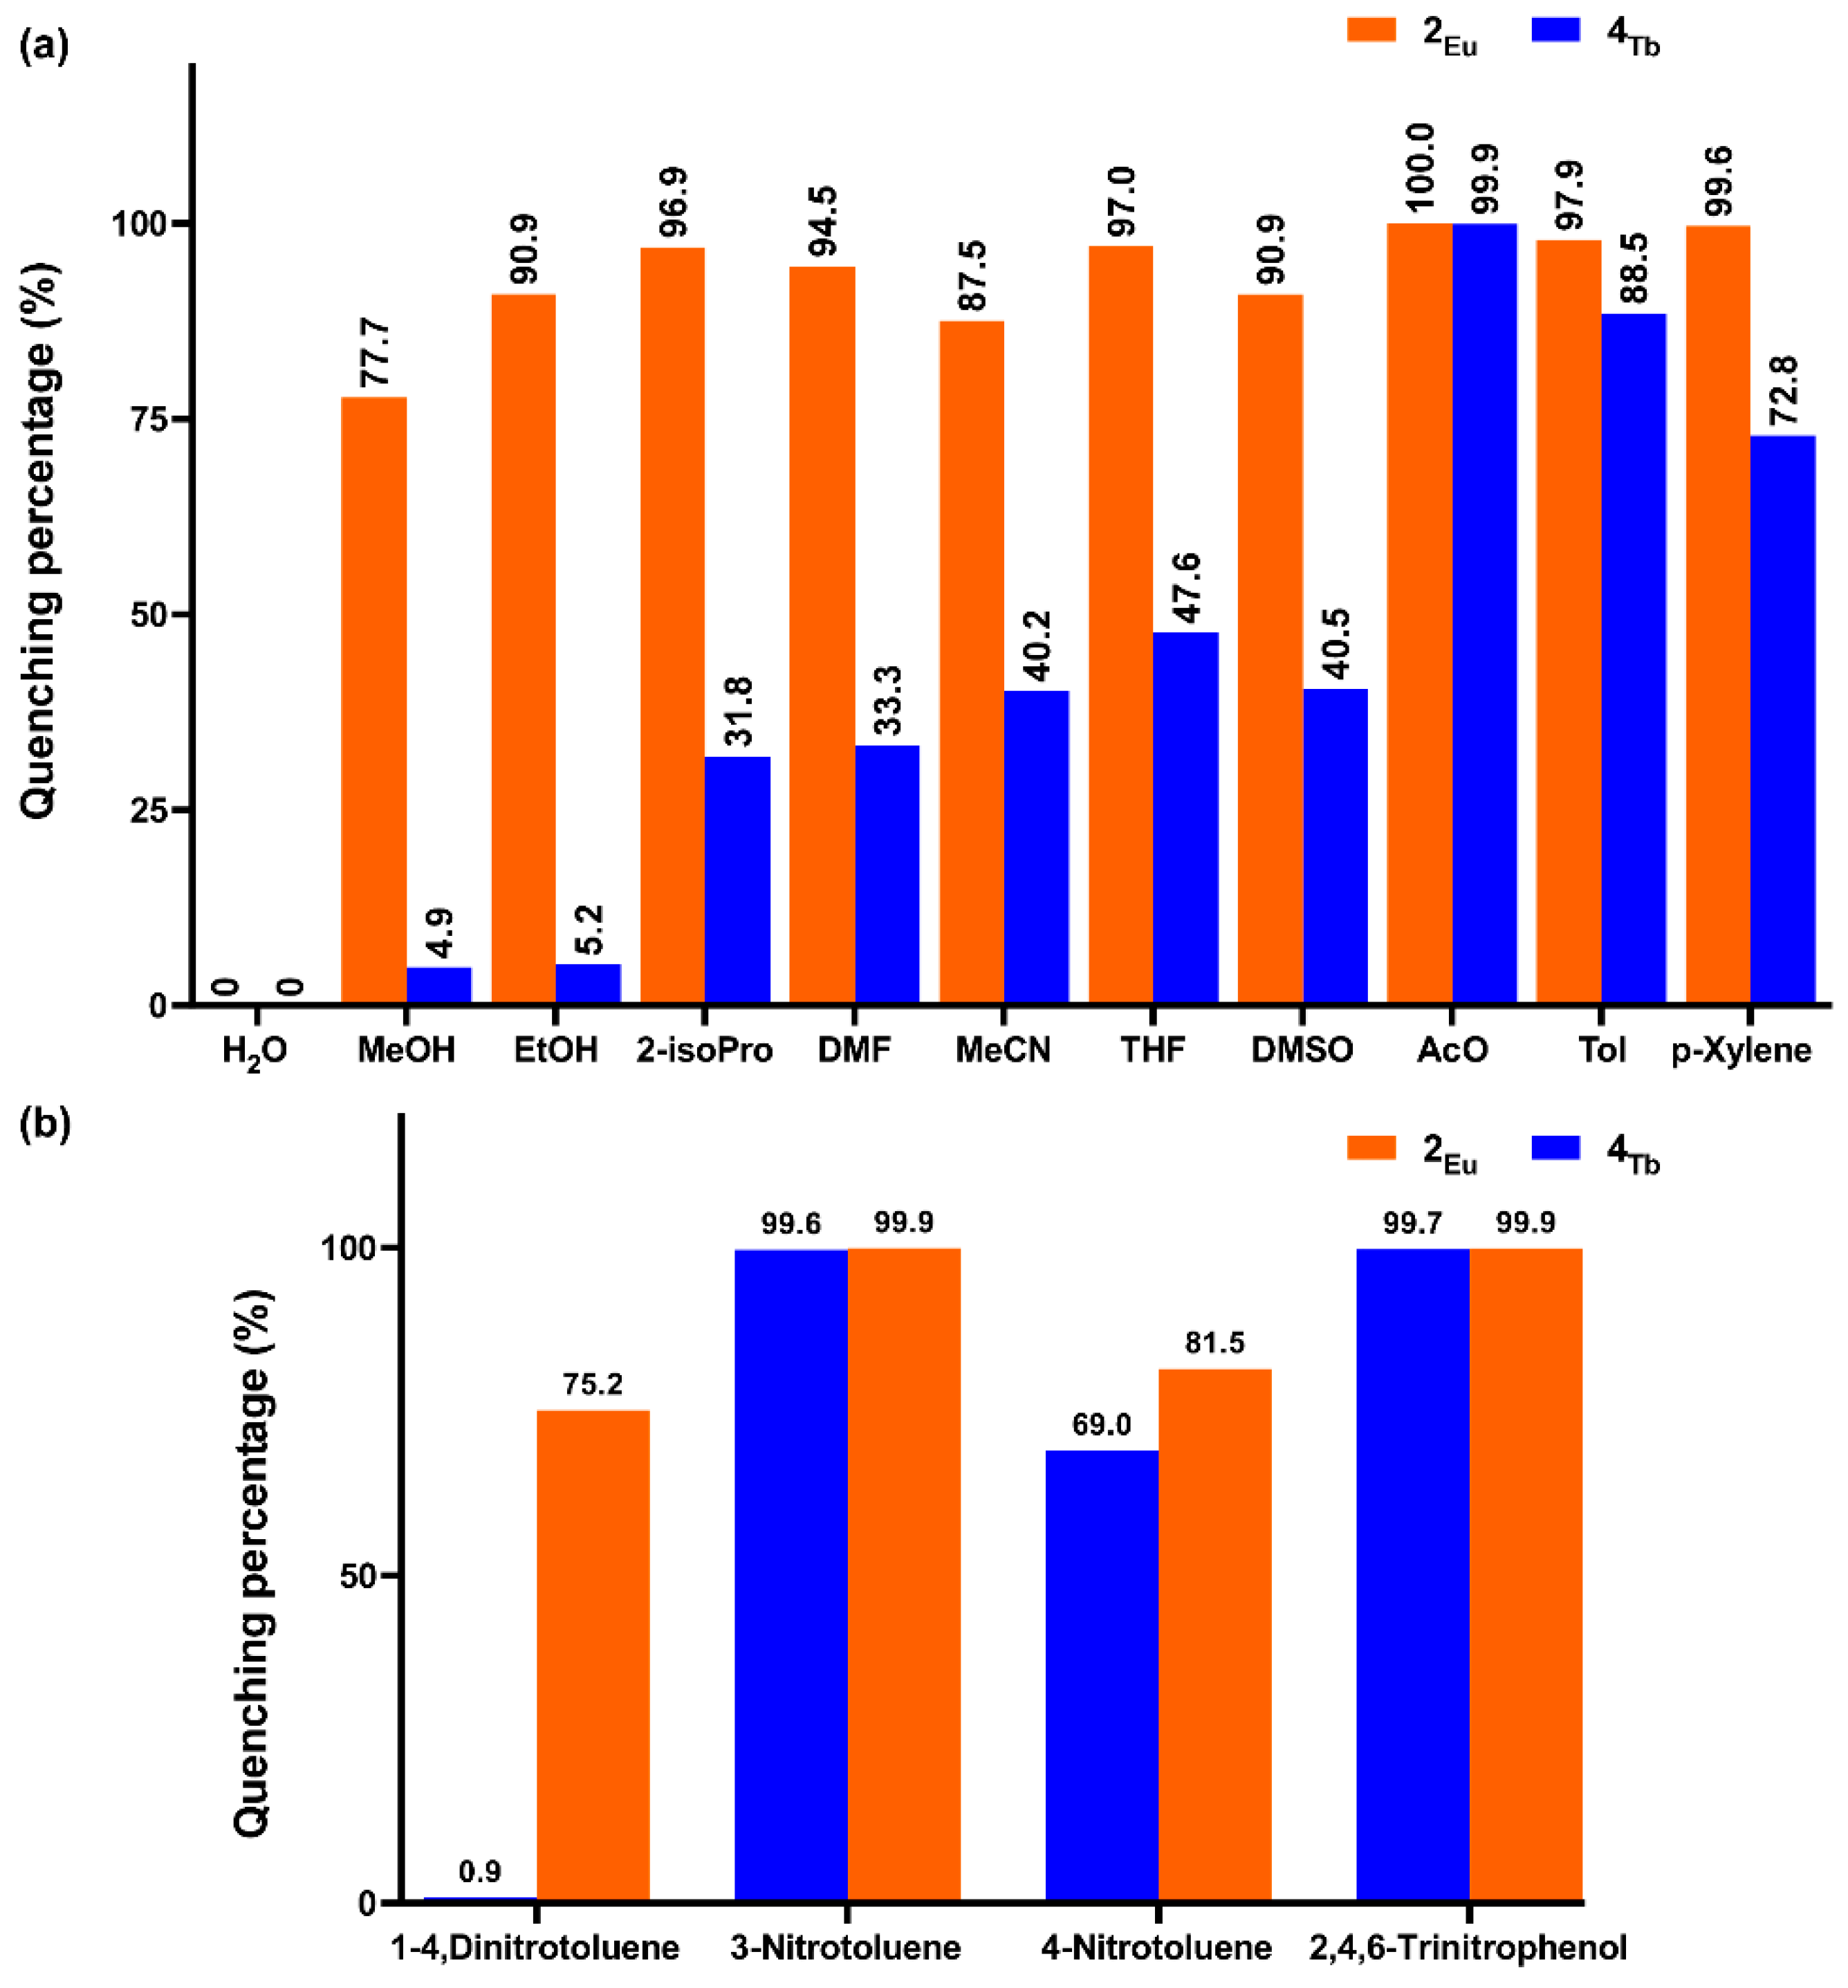
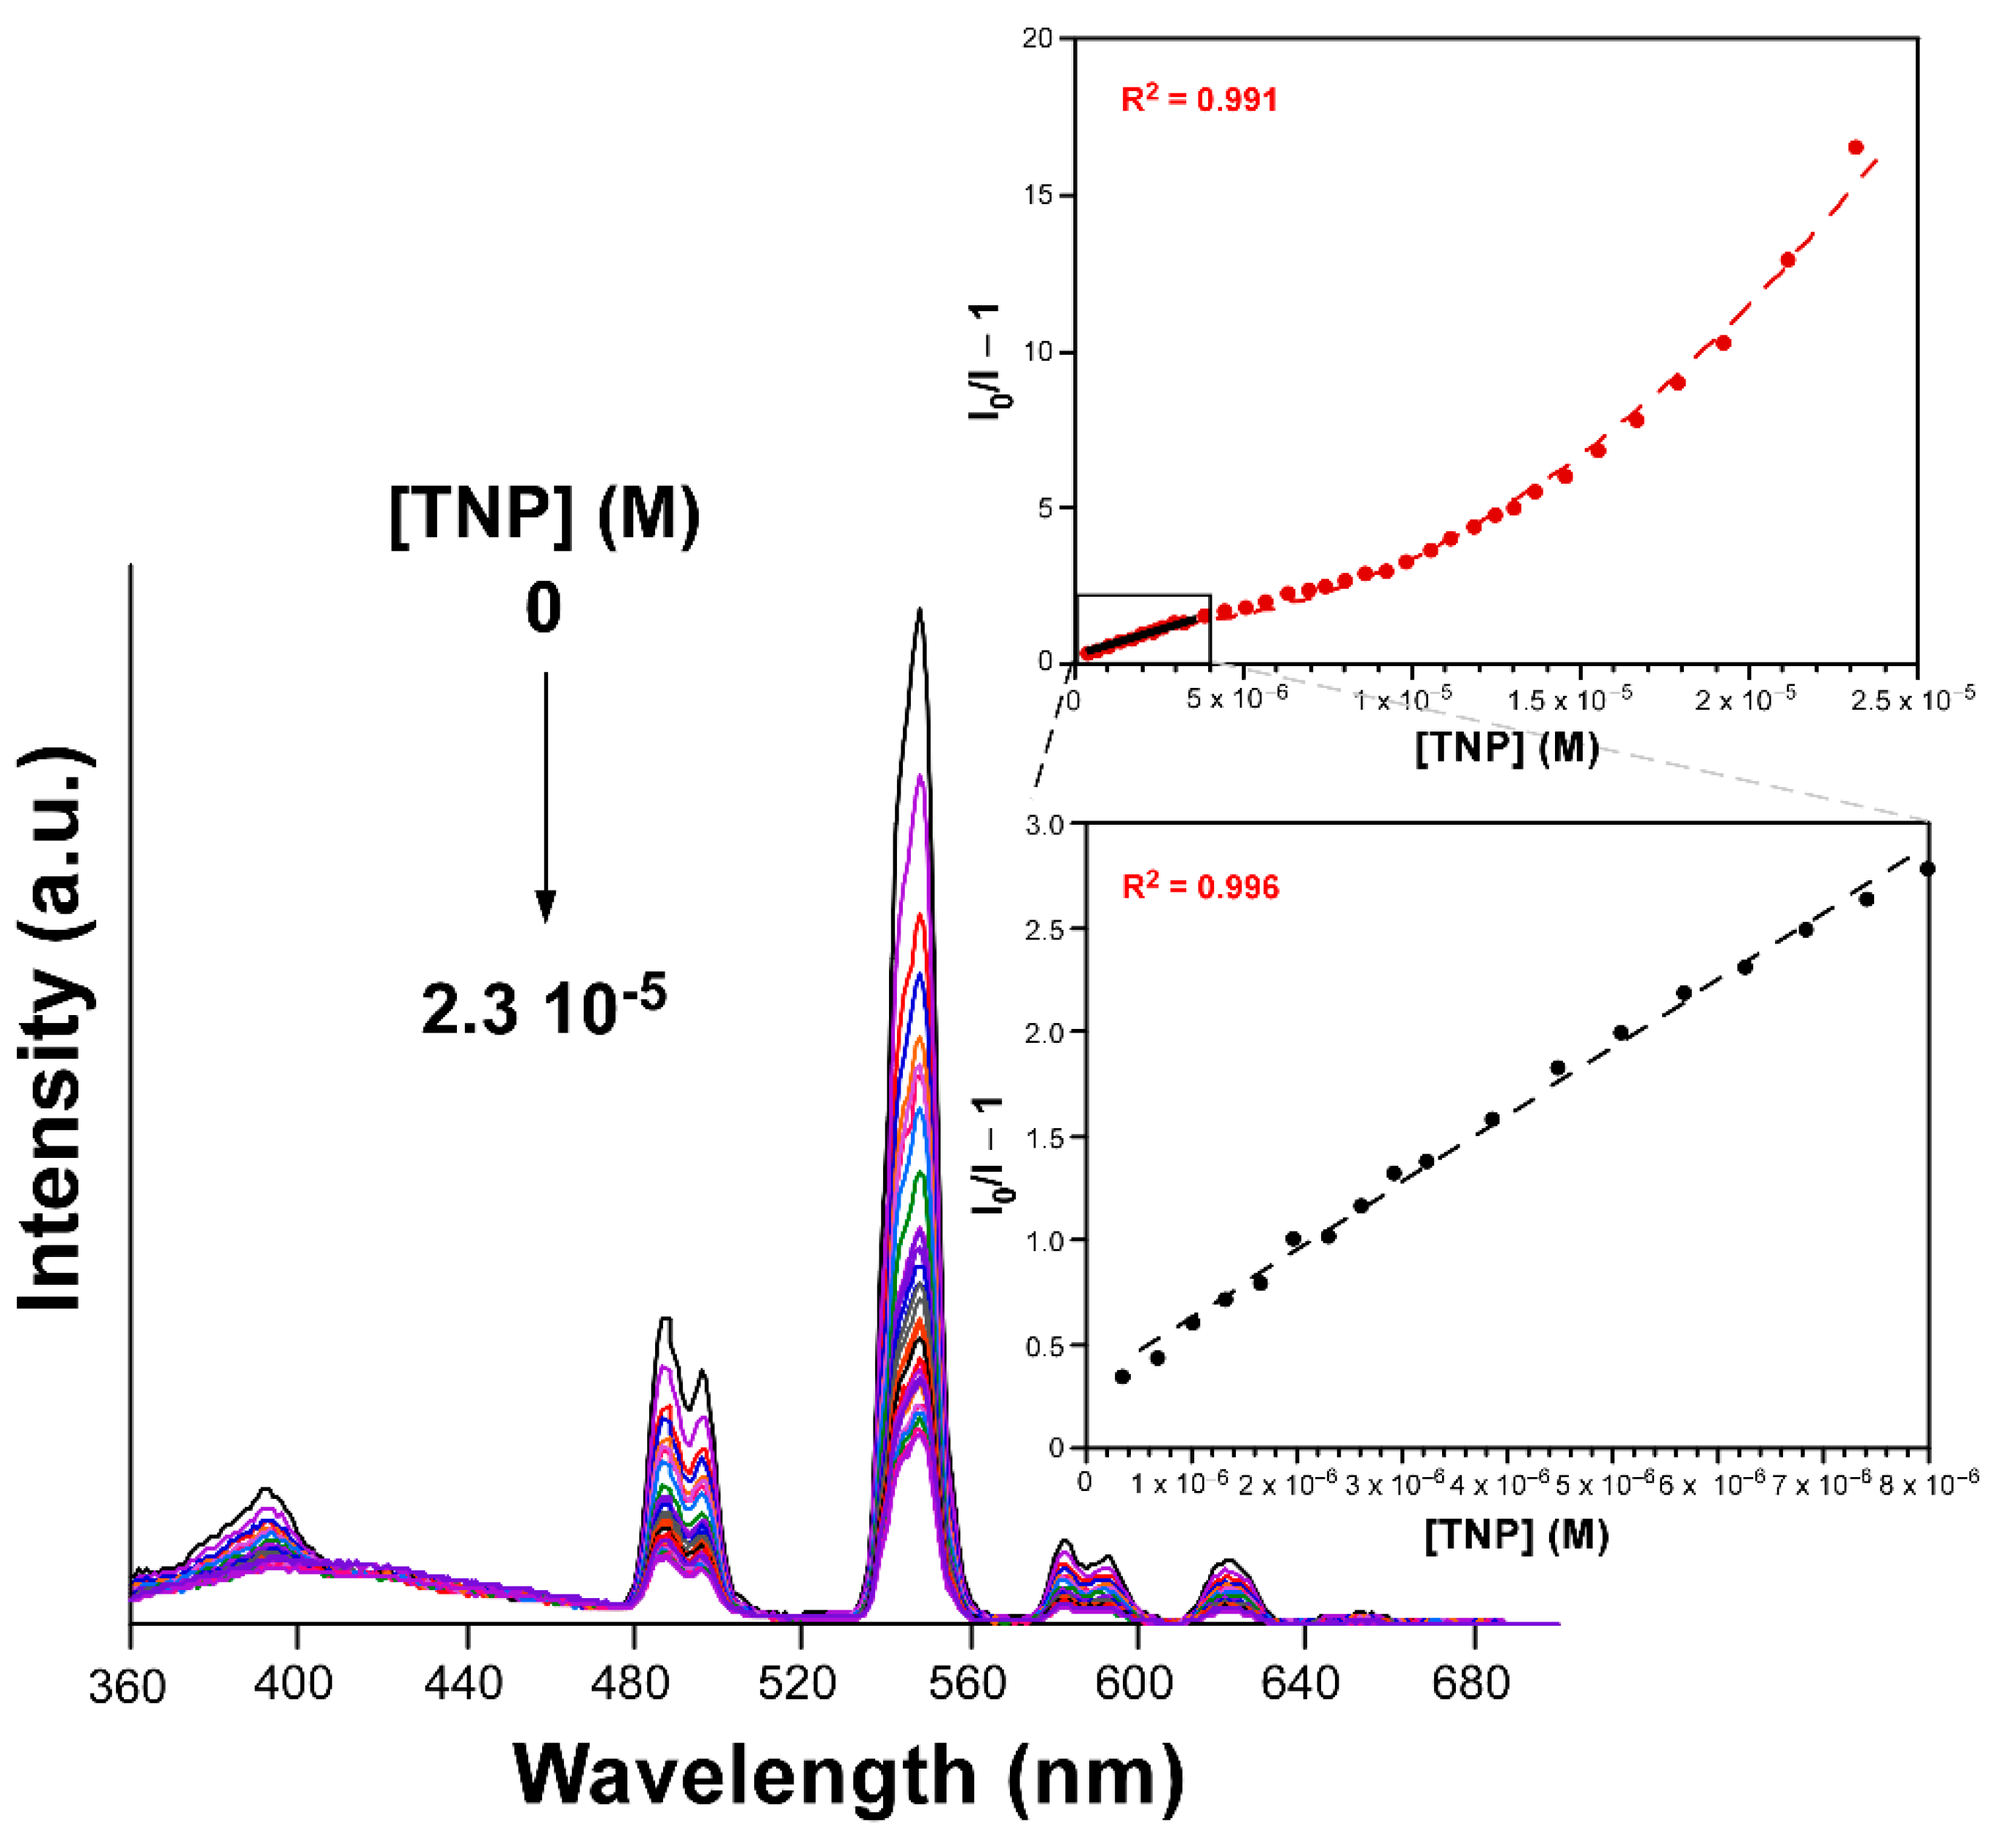
3.3. Sensing Experiments

The excellent PL performance revealed by compounds 2Eu and 4Tb in the solid state prompted us to study their sensing capacity of both toxic and explosive molecules. Taking into account that these experiments are carried out in liquid dispersions to facilitate the diffusion of the target molecules with the surface of the compounds, the solubility (using water as reference, 2Eu@H2O hereafter) and luminescence emission capacity of these compounds were first checked. Both compounds are completely insoluble in water and maintain their structural integrity, at least by suspending the solids for 48 h, because the recovered samples keep their crystalline and unaltered PXRD diffractogram (Figure S37). Moreover, as shown in Figure S37 in the ESI, their emission spectra retain the intense characteristic emission bands (slightly broadened) while another wide band peaking at 393 nm (dominant for 2Eu) is also observed. The appearance of the latter band, attributed to the ligand’s fluorescence, may be due to a worsening of the antenna effect in the compounds, probably caused by the interactions between ligands scaffold and the solvent. Subsequently, various suspensions were prepared using many different solvents (water, methanol (MeOH), ethanol (EtOH), 2-isopropanol (2-isoPro), N,N’-dimethylformamide (DMF), acetonitrile (MeCN), tetrahydrofuran (THF), dimethylsulfoxide (DMSO), acetone (AcO), toluene (Tol) and p-xylene), and their PL response was analyzed (Figure S38). A common feature in the emission spectra of both compounds is the fact that the intensity drop of the characteristic (lanthanide-centered) emission bands is accompanied by the increase in the ligand-centered signal, which further corroborates the abovementioned hypothesis. The two compounds show distinct solvent-dependent emission behaviors and, more interestingly, very different turning-off (evaluated as the quenching percentage of the main characteristic emission line: 7F25D0 for 2Eu and 7F55D4 for 4Tb taking H2O as a reference) processes derived from the solvent quenching action (Figure 6). In particular, high quenching percentages are observed for compound 2Eu, that is, the emission intensity is dropped by 78-100% for all solvents, thus showing less specificity for a particular solvent. On the contrary, the turning-off process is quite diverse for 4Tb, for which a high quenching effect (>75%) is only observed for Tol and AcO solvents (see Figure 6a), which also lead the quenching percentage trend for 2Eu.
According to the literature, the luminescence quenching of CPs by small molecules, such as the herein studied solvents, may be caused by different phenomena, involving collapse of the framework, guest exchange, host-guest interaction, competing absorption, etc., [76]. The ligand-centered excitation band describes a distinct shape due to the different antenna effect efficiency, but shares the presence of remarkable absorption intensity in the 275–350 nm range, which is largely overlapped with the absorption band of the AcO (200–320 nm) [77]. As largely analyzed in other works [76,78], none of the remaining solvents presents such an intense absorption band above 300 nm, in such a way that the competing absorption of AcO is assumed to be the major cause for the signal decrease. However, the trend observed for the rest of solvents in the case of 2Eu seems to indicate the occurrence of an additional effect. To explore the possibility of a collapse in this framework, a PXRD pattern was recorded upon a dried sample of 2Eu previously suspended in AcO for 2 h. The diffractogram shows an almost amorphous phase, which confirms the low chemical stability of 2Eu in most of organic solvents and explains the overall large quenching observed. Although it is not expected that two isostructural compounds present different solubility and chemical stability in solvents, this is not new since it has been already reported for other CPs [79]. In any case, despite the good sensitivity of 4Tb towards AcO, no further characterization was made to study its detection capacity given the lack of enough specificity. The PL response of the compounds was also studied for the sensing of a batch of nitroaromatic molecules (1,4-dinitroluene (1,4-DNP), 3-nitrotoluene (3-NP), 4-nitrotoluene (4-NP) and 2,4,6-trinitrotoluene (TNP)), for which aqueous solutions containing them in 0.1 mM concentration were prepared. To those solutions, 5 mg of 2Eu/4Tb were added and the suspension was sonicated for 15 min to get a quite stable mixture prior to the measurement. When the emission spectra were compared to the blank compound@H2O, we observed a similar behavior to that discussed before. In particular, 2Eu revealed a significant regular quenching for the four explosives, whereas 4Tb showed a more irregular pattern, presenting an almost unchanged signal for 1,4-DNP and a very high turning-off for 3-NP and TNP (with quenching percentages above 99%, see Figure 6b). In this case, it cannot be argued that the framework collapse can explain the behavior of 2Eu, because it is perfectly insoluble in water, so the different quenching observed for the compounds must be related to the lower efficiency of the ligand to transfer the energy to Eu(III) centers. Given the large importance of the TNP detection worldwide, further measurements were carried out with this molecule. In essence, additional suspensions containing compound 4Tb were prepared by the same method in which the concentration of TNP was gradually increased (Figure S41). As inferred from the emission spectra, all the bands experienced a rapid drop in intensity with the increase in TNP, although the hypersensitive band (7F55D4 transition) exhibited a steeper decrease. The trend of the signal quenching in the form of a Stern-Volmer plot shows a linear relationship at low concentration, suggesting that a diffusion-controlled quenching by TNP is taking place (see insets of Figure S41). A quantitative analysis with the I0/I = 1 + Ksv[TNP], where all the parameters have their usual meaning [80], gives a Ksv = 2.45 × 10⁶ M−1 in the ranges of 0–4 μM (R2 = 0.994). The quenching occurring in this regime may be attributed to a static quenching, which is an expected situation given the overlap between the excitation band of 4Tb and the absorption of TNP [81]. Hence, it may be assumed that a fluorescence resonance energy transfer process [82] takes place by which TNP strongly absorbs light and competes with the excitation of 4Tb, in such a way that the pristine effective ligand-to-terbium(III) energy transfer is weakened. To get deeper insights into this behavior, the excitation spectrum was recorded for the 4Tb@H2O suspension containing a low TNP concentration (2.5 × 10⁻⁶ M). As observed in Figure S42, the excitation band is split in two and significantly blue-shifted with respect to solid state and thus more overlapped with the absorption band of TNP, which explains the large quenching generated by the latter. In contrast, at higher concentrations, the S-V plot describes a curve, a phenomenon that is usually attributed to the self-absorption by the quencher [83,84]. To properly analyze the turning-off process in the full concentration region, the curve was fitted to polynomial expression that considers both a static and a dynamic quenching (see the ESI for further details) [85]. The Ksv calculated for the whole range was estimated to be of 1.4 × 10⁵ M−1 (R2 = 0.998), which is, as far as we are aware, among the best results found for other lanthanide-based MOFs reported so far (usually in the range of 10−4 M−1, see Table 3) [30,86].
The limit of detection (LOD) is as low as 5.6 × 10⁻⁷ M, a fact that reveals the great capacity of this material to detect the TNP molecule. In order to further investigate the mechanism for the TNP sensing of this compound, the emission lifetime was also measured in a solution of a [TNP] = 1.0 × 10⁻⁵ M, estimating a τ of 367(3) µs from the exponential fitting. Such a drop in the lifetime (from 806(8) µs in solid state) is concordant with the fact that the quenching process follows not only a static but also a dynamic mechanism when the concentration of TNP is increased, probably arising from π-π interactions occurring between the TNP and ligand molecules among the external surface of the compound particles. Therefore, it can be concluded that the quenching process follows a static and dynamic mechanism. In view of the excellent sensing capacity of the compound towards TNP but the low selectivity, given the similar quenching response observed for 3-NP, we decided to explore their detection in other solvents. Among the studied ones, MeOH was selected as a good alternative not only because of its high capacity to dissolve both 3-NP and TNP, but also its relatively low quenching capacity for the emission of 4Tb. In an initial comparison, the emission spectra were recorded for two 4Tb@MeOH suspensions containing a small concentration of dissolved 3-NP and TNP molecules (7.5 × 10⁻⁵ M), finding that the characteristic terbium-based emissions are much weaker for the solution containing TNP than for 3-NP (Figure S43). Essentially, the quenching percentages for these two solutions are estimated to be of 25% and 93% for the 3-NP and TNP, which is a good starting point for a selective detection of TNP. Motivated by these results, we decided to perform a new titration experiment to analyze the quenching capacity of TNP in MeOH (Figure 7).
A similar behavior was observed for the Stern-Volmer plot, because only the low concentration (3.32 × 10⁻⁷–7.98 × 10⁻⁶ M) region followed a linear distribution (where a KSV of 3.33 × 10⁶ M−1 was obtained from the fitting, with R2 = 0.996) whereas a second order polynomial better described the whole concentration range. Best fitting results for the whole range gave a KSV of 1.07 × 10⁵ M−1 (R2 = 0.991) and a LOD of 3.0 × 10⁻⁶ M. Although the values are comparatively lower than those found in H2O, the greater selectivity observed towards TNP quenching in MeOH makes the latter a more appropriate solvent for the sensing experiment. At last, in an attempt to further corroborate the sensing selectivity of 4Tb@MeOH towards TNP, an additional luminescence experiment was performed. When 4Tb was dispersed on a MeOH solution containing the rest of nitroaromatic molecules (a cocktail of 1,4-DNP, 3-NP and 4-NP) in a total concentration of 5.0 × 10⁻⁵ M, the emission signal retained most of its intensity compared to the blank MeOH solution (the intensity of the hypersensitive band remained above 75%). However, when a solution of TNP (0.1 mM) is added so that TNP reaches the same concentration in the mixture, the emission signal practically vanishes (Figure 8).

4. Conclusions

A family of five isostructural CPs based on Ln(III) cations and 5-methylisophthalate ligands, namely GR-MOFs15-19, has been synthesized for the first time, structurally determined and fully characterized. The crystal structure is built up through the linkage of carboxylate groups to the two crystallographically independent lanthanide(III) centers, first establishing metal-carboxylate rods which joined one another to render a quite compact building with the fsy topology. All compounds present good photoluminescence properties upon excitation of the ligand absorption band in the UV region. Compounds 1Sm, 2Eu and 4Tb present emissions in the visible spectrum featuring a variable antennae effect following the 1Sm < 2Eu < 4Tb trend, as confirmed by the quantum yields measured in solid state (1.5 < 12 < 63%, respectively). On its part, 3Gd presents phosphorescent ligand-centered green emission derived from a singlet ← triplet emission, corroborated by TDDFT calculations. These calculations also allow for the estimation of the lowest-lying triplet state at ca. 22,900 cm−1, thus explaining the 5Meip ligand sensitization order of Tb(III) > Eu(III) > Sm(III) on the basis of Latva’s empirical rule. Moreover, CIS INDO/S calculations performed on a model of compound 2Eu by means of LUMPAC software allow us to draw a key lumino-structural correlation: the higher the coplanarity of the carboxylate group with respect to the aromatic ring the higher the overlap between the LUMO describing the triplet state and the lanthanide-based inner orbitals, and hence, the higher the ligand-to-metal energy transfer. On its part, compound 5Yb also presents lanthanide-centered characteristic emissions in the NIR range even at room temperature.
On the other hand, 4Tb presents a promising sensing capacity towards nitroaromatic molecules, showing a preferred turning-off process when exposed to 3-NP and TNP molecules, among which the detection of TNP may be considered very sensitive in view of the high KSV (1.4 × 10⁵ M−1) and low LOD (5.6 × 10⁻⁷ M) extracted from the Stern-Volmer fitting. More interestingly, when the sample is suspended in MeOH, the sensing capacity of 4Tb is maintained (KSV = 1.1 × 10⁵ M−1) but it provides a more selective detection compared to the rest of the molecules studied.

Supplementary Materials

The following supporting information can be downloaded at: https://0-www-mdpi-com.brum.beds.ac.uk/article/10.3390/nano12223977/s1. Figure S1. Representation of the bonds of ligand B, which are the same as in ligand A; Figure S2. Representation of the C ligand bonds; Figure S3. TG/DTA analysis for compound 3Gd; Figure S4. Pattern-matching analysis of polycrystalline sample of compound 1Sm; Figure S5. Pattern-matching analysis of polycrystalline sample of compound 2Eu; Figure S6. Pattern-matching analysis of polycrystalline sample of compound 3Gd; Figure S7. Pattern-matching analysis of polycrystalline sample of compound 4Tb; Figure S8. Pattern-matching analysis of polycrystalline sample of compound 5Yb; Figure S9. FTIR spectra of all compounds; Figure S10. Emission spectra of the free H25Meip ligand sample taken at room temperature at λex = 325 nm; Figure S11. Excitation spectra of the free H25Meip ligand sample taken at room temperature: (a) λem = 408 and (b) 531 nm; Figure S12. Decay curves of the two emission maxima of free H25Meip ligand sample taken at room temperature: (a) λem = 408 and (b) 531 nm; Figure S13. MOs of the H25Meip ligand involved in the main excitation and emission; Figure S14. Experimental (solid line) and computed (dotted line) excitation and emission spectra of compound 3Gd taken at room temperature: (a) λem = 505 and (b) λex = 325 nm. Vertical green bars represent the computed main vertical excitations; Figure S15. MOs of compound 3Gd involved in the main excitation and emission calculated for singlet-to-singlet transitions; Figure S16. Experimental (solid line) and computed (dotted line) emission spectrum of compound 3Gd taken at room temperature. Vertical green bars represent the computed main vertical excitations; Figure S17. MOs of compound 3Gd involved in the main excitation and emission calculated for singlet-to-triplet transitions; Figure S18. MOs of the ligand molecule involved in the triplet-to-singlet transition; Figure S19. Excitation spectra of compound 1Sm taken at room temperature under the main emission lines: (a) λem = 600 and (b) 646 nm; Figure S20. Excitation spectra of compound 1Sm taken at 10 K under the main emission lines: (a) λem = 600 and (b) 646 nm; Figure S21. Excitation spectra of compound 2Eu recorded at the main emission line (λem = 613.8 nm) at variable temperature; Figure S22. Excitation spectra of compound 4Tb recorded at the main emission line (λem = 542 nm) at variable temperature; Figure S23. Comparison of the emission spectra of compound 4Tb recorded at the main emission line (λex = 325 nm) at variable temperature; Figure S24. Decay curve of compound 3Gd taken at low temperature at the emission band maximum (λem = 505 nm); Figure S25. Decay curves of compound 1Sm taken at variable temperature under the main emission line (λem = 600 nm); Figure S26. Decay curves of compound 2Eu taken at variable temperature under the main emission line (λem = 616 nm); Figure S27. Decay curves of compound 4Tb taken at variable temperature under the main emission line (λem = 542 nm); Figure S28. Decay curve of compound 1Sm taken at room temperature under the main line of the ligand emission (λem = 510 nm); Figure S29. Variable temperature emission spectra of compound 2Eu under laser excitation (λex = 325 nm); Figure S30. Schematic diagram of the main states involved in the luminescence of compound 2Eu using model 2-Eu-2 showing the main calculated energy transfer rates; Figure S31. Excitation and emission spectra of compound 5Yb taken at room temperature: (a) λem = 500 and (b) λex = 325 nm; Figure S32. Decay curve of compound 5Yb measured at room temperature at the ligand emission (λem = 500 nm); Figure S33. Emission spectra of compound 5Yb taken at 10 K showing the (a) visible and (b) NIR ranges; Figure S34. Decay curve of compound 5Yb measured at 10 K focusing the NIR emission line (λem = 980 nm); Figure S35. Emission spectra of the free H25Meip ligand sample taken at room temperature at λex = 325 nm; Figure S36. Emission spectra of compounds (a) 2Eu and (b) 4Tb suspended in water at room temperature; Figure S37. Comparison of the PXRD patterns for the as-synthesized and water suspended samples of compounds 2Eu and 4Tb; Figure S38. Emission spectra of compounds (a) 2Eu and (b) 4Tb suspended in different solvents at room temperature; Figure S39. Emission decay curve of compound 4Tb suspended in water at a given concentration of TNP at room temperature; Figure S40. Comparison of the PXRD data for compound 4Tb for the as-synthesized sample and after water suspension titration with TNP; Figure S41. Room temperature emission spectra of 4Tb@H2O in which variable concentration of TNP is added (λex = 310 nm). Insets show the Stern-Volmer plots for the titration experiment with the whole studied concentration region (top) and the low concentration linear regime (bottom); Figure S42. Comparative excitation spectrum of compound 4Tb in solid state and in water suspension containing a low concentration of TNP; Figure S43. Emission spectra for 4Tb@MeOH suspensions containing the corresponding nitroaromatic molecule dissolved: (a) 3-NP and (b) TNP; Figure S44. Emission decay curve of the suspension 4Tb@MeOH at a given concentration of TNP at room temperature; Table S1. Continuous Shape Measurements for the coordination environment for compounds 1Sm and 2Eu. The lowest SHAPE values for each ion are shown in bold blue, indicating best fits; Table S2. Spherical atomic coordinates, charge factors (g) and polarizabilities (α) for compounds 2D_Eu-L and 3D_Eu-L. References [92,93] are cited in the supplementary materials.

Author Contributions

Conceptualization, J.C. and A.R.-D.; methodology, O.P.-C. and R.H.; software, J.C., D.C.-L. and A.R.-D.; validation, J.C. and S.R.; formal analysis, J.A.G. and R.H.; investigation, L.R.-B., O.P.-C. and S.R.; resources, J.C. and A.R.-D.; data curation, J.C., A.R.-D., J.A.G. and D.C.-L.; writing—original draft preparation, J.C. and O.P.-C.; writing—review and editing, A.R.-D. and J.C.; visualization, J.C. and S.R.; supervision, A.S.-C., R.H. and S.R.; project administration, J.C. and A.R.-D.; funding acquisition, J.C. and A.R.-D. All authors have read and agreed to the published version of the manuscript.

Funding

This work has been funded by University of the Basque Country (GIU20/028), Gobierno Vasco/Eusko Jaurlaritza (IT1755-22 and IT1500-22), Junta de Andalucía (FQM-394 and B-FQM-734-UGR20, B-FQM-478-UGR20 and ProyExcel_00386) and the Spanish Ministry of Economy and Competitiveness (MCIU/AEI/FEDER, UE) (PGC2018-102052-A-C22, PGC2018-102052-B-C21 and PID2020-117344RB-I00).

Data Availability Statement

Not applicable.

Acknowledgments

O.P.C. is grateful to the UPV/EHU for his predoctoral grant. S.R. acknowledges the Juan de la Cierva Incorporación Fellowship (grant agreement no. IJC2019-038894-I). The authors thank the technical and human support provided by SGIker (UPV/EHU/ERDF, EU).

Conflicts of Interest

The authors declare no conflict of interest.

References

  1. Guillerm, V.; Kim, D.; Eubank, J.F.; Luebke, R.; Liu, X.; Adil, K.; Lah, M.S.; Eddaoudi, M. A supermolecular building approach for the design and construction of metal-organic frameworks. Chem. Soc. Rev. 2014, 43, 6141–6172. [Google Scholar] [CrossRef] [PubMed] [Green Version]
  2. Eddaoudi, M.; Sava, D.F.; Eubank, J.F.; Adil, K.; Guillerm, V. Zeolite-like metal–organic frameworks (ZMOFs): Design, synthesis, and properties. Chem. Soc. Rev. 2015, 44, 228–249. [Google Scholar] [CrossRef] [Green Version]
  3. O’Keeffe, M.; Yaghi, O.M. Deconstructing the crystal structures of metal-organic frameworks and related materials into their underlying nets. Chem. Rev. 2012, 112, 675–702. [Google Scholar] [CrossRef]
  4. Tranchemontagne, D.J.; Tranchemontagne, J.L.; O’keeffe, M.; Yaghi, O.M. Secondary building units, nets and bonding in the chemistry of metal–organic frameworks. Chem. Soc. Rev. 2009, 38, 1257–1283. [Google Scholar] [CrossRef] [PubMed] [Green Version]
  5. Batten, S.R.; Champness, N.R.; Chen, X.M.; Garcia-Martinez, J.; Kitagawa, S.; Öhrström, L.; O’Keeffe, M.; Suh, M.P.; Reedijk, J. Terminology of metal-organic frameworks and coordination polymers (IUPAC recommendations 2013). Pure Appl. Chem. 2013, 85, 1715–1724. [Google Scholar] [CrossRef] [Green Version]
  6. Allendorf, M.D.; Stavila, V. Crystal engineering, structure–function relationships, and the future of metal–organic frameworks. CrystEngComm 2014, 17, 229–246. [Google Scholar] [CrossRef]
  7. Zhang, Y.B.; Zhou, H.L.; Lin, R.B.; Zhang, C.; Lin, J.B.; Zhang, J.P.; Chen, X.M. Geometry analysis and systematic synthesis of highly porous isoreticular frameworks with a unique topology. Nat. Commun. 2012, 3, 642. [Google Scholar] [CrossRef] [Green Version]
  8. Cepeda, J.; Beobide, G.; Castillo, O.; Luque, A.; Pérez-Yáñez, S. Structural diversity of coordination compounds derived from double-chelating and planar diazinedicarboxylate ligands. Coord. Chem. Rev. 2017, 352, 83–107. [Google Scholar] [CrossRef]
  9. Gangu, K.K.; Maddila, S.; Mukkamala, S.B.; Jonnalagadda, S.B. A review on contemporary Metal–Organic Framework materials. Inorg. Chim. Acta 2016, 446, 61–74. [Google Scholar] [CrossRef]
  10. ZelěNák, V.; Saldan, I.; Giannakoudakis, D.; Barczak, M.; Pasán, J. Factors Affecting Hydrogen Adsorption in Metal–Organic Frameworks: A Short Review. Nanomaterials 2021, 11, 1638. [Google Scholar] [CrossRef]
  11. Zhang, J.P.; Liao, P.Q.; Zhou, H.L.; Lin, R.B.; Chen, X.M. Single-crystal X-ray diffraction studies on structural transformations of porous coordination polymers. Chem. Soc. Rev. 2014, 43, 5789–5814. [Google Scholar] [CrossRef] [PubMed]
  12. Tan, J.C.; Civalleri, B. Metal–Organic Frameworks and Hybrid Materials: From Fundamentals to Applications. CrystEngComm 2014, 17, 197–198. [Google Scholar] [CrossRef]
  13. Horcajada, P.; Gref, R.; Baati, T.; Allan, P.K.; Maurin, G.; Couvreur, P.; Férey, G.; Morris, R.E.; Serre, C. Metal-organic frameworks in biomedicine. Chem. Rev. 2012, 112, 1232–1268. [Google Scholar] [CrossRef] [PubMed]
  14. Abánades Lázaro, I.; Forgan, R.S. Application of zirconium MOFs in drug delivery and biomedicine. Coord. Chem. Rev. 2019, 380, 230–259. [Google Scholar] [CrossRef] [Green Version]
  15. Liu, S.; Chen, H.; Lv, H.; Qin, Q.P.; Fan, L.; Zhang, X. Chemorobust 4p-5p {InPb}-organic framework for efficiently catalyzing cycloaddition of CO2 with epoxides and deacetalization-Knoevenagel condensation. Mater. Today Chem. 2022, 24, 100984. [Google Scholar] [CrossRef]
  16. Liu, S.; Chen, H.; Zhang, X. Bifunctional {Pb10K2}-Organic Framework for High Catalytic Activity in Cycloaddition of CO2with Epoxides and Knoevenagel Condensation. ACS Catal. 2022, 12, 10373–10383. [Google Scholar] [CrossRef]
  17. Liu, J.; Chen, L.; Cui, H.; Zhang, J.; Zhang, L.; Su, C.Y. Applications of metal–organic frameworks in heterogeneous supramolecular catalysis. Chem. Soc. Rev. 2014, 43, 6011–6061. [Google Scholar] [CrossRef] [Green Version]
  18. Cepeda, J.; Pérez-Yáñez, S.; Beobide, G.; Castillo, O.; Goikolea, E.; Aguesse, F.; Garrido, L.; Luque, A.; Wright, P.A. Scandium/Alkaline Metal-Organic Frameworks: Adsorptive Properties and Ionic Conductivity. Chem. Mater. 2016, 28, 2519–2528. [Google Scholar] [CrossRef]
  19. Fujie, K.; Ikeda, R.; Otsubo, K.; Yamada, T.; Kitagawa, H. Lithium Ion Diffusion in a Metal-Organic Framework Mediated by an Ionic Liquid. Chem. Mater. 2015, 27, 7355–7361. [Google Scholar] [CrossRef]
  20. Inokuma, Y.; Yoshioka, S.; Ariyoshi, J.; Arai, T.; Hitora, Y.; Takada, K.; Matsunaga, S.; Rissanen, K.; Fujita, M. X-ray analysis on the nanogram to microgram scale using porous complexes. Nature 2013, 495, 461–466. [Google Scholar] [CrossRef]
  21. Wang, C.; Liu, D.; Lin, W. Metal-organic frameworks as a tunable platform for designing functional molecular materials. J. Am. Chem. Soc. 2013, 135, 13222–13234. [Google Scholar] [CrossRef] [PubMed] [Green Version]
  22. Hao, Y.; Chen, S.; Zhou, Y.; Zhang, Y.; Xu, M. Recent Progress in Metal–Organic Framework (MOF) Based Luminescent Chemodosimeters. Nanomaterials 2019, 9, 974. [Google Scholar] [CrossRef] [PubMed] [Green Version]
  23. Sun, Z.; Khurshid, A.; Sohail, M.; Qiu, W.; Cao, D.; Su, S.J. Encapsulation of Dyes in Luminescent Metal-Organic Frameworks for White Light Emitting Diodes. Nanomaterials 2021, 11, 2761. [Google Scholar] [CrossRef] [PubMed]
  24. San Sebastian, E.; Rodríguez-Diéguez, A.; Seco, J.M.; Cepeda, J. Coordination Polymers with Intriguing Photoluminescence Behavior: The Promising Avenue for Greatest Long-Lasting Phosphors. Eur. J. Inorg. Chem. 2018, 2018, 2155–2174. [Google Scholar] [CrossRef]
  25. Rocha, J.; Brites, C.D.S.; Carlos, L.D. Lanthanide Organic Framework Luminescent Thermometers. Chem.—Eur. J. 2016, 22, 14782–14795. [Google Scholar] [CrossRef]
  26. Leo, P.; Briones, D.; García, J.A.; Cepeda, J.; Orcajo, G.; Calleja, G.; Rodríguez-Diéguez, A.; Martínez, F. Strontium-Based MOFs Showing Dual Emission: Luminescence Thermometers and Toluene Sensors. Inorg. Chem. 2020, 59, 18432–18443. [Google Scholar] [CrossRef]
  27. Errulat, D.; Marin, R.; Gálico, D.A.; Harriman, K.L.M.; Pialat, A.; Gabidullin, B.; Iikawa, F.; Couto, O.D.D.; Moilanen, J.O.; Hemmer, E.; et al. A Luminescent Thermometer Exhibiting Slow Relaxation of the Magnetization: Toward Self-Monitored Building Blocks for Next-Generation Optomagnetic Devices. ACS Cent. Sci. 2019, 5, 1187–1198. [Google Scholar] [CrossRef] [Green Version]
  28. Lustig, W.P.; Mukherjee, S.; Rudd, N.D.; Desai, A.V.; Li, J.; Ghosh, S.K. Metal-organic frameworks: Functional luminescent and photonic materials for sensing applications. Chem. Soc. Rev. 2017, 46, 3242–3285. [Google Scholar] [CrossRef]
  29. Yi, F.Y.; Chen, D.; Wu, M.K.; Han, L.; Jiang, H.L. Chemical Sensors Based on Metal–Organic Frameworks. Chempluschem 2016, 81, 675–690. [Google Scholar] [CrossRef]
  30. Hu, Z.; Deibert, B.J.; Li, J. Luminescent metal–organic frameworks for chemical sensing and explosive detection. Chem. Soc. Rev. 2014, 43, 5815–5840. [Google Scholar] [CrossRef]
  31. Feng, X.; Shang, Y.; Zhang, K.; Hong, M.; Li, J.; Xu, H.; Wang, L.; Li, Z. In situ ligand-induced Ln-MOFs based on a chromophore moiety: White light emission and turn-on detection of trace antibiotics. CrystEngComm 2022, 24, 4187–4200. [Google Scholar] [CrossRef]
  32. Feng, X.; Shang, Y.; Zhang, H.; Liu, X.; Wang, X.; Chen, N.; Wang, L.; Li, Z. Multi-functional lanthanide-CPs based on tricarboxylphenyl terpyridyl ligand as ratiometric luminescent thermometer and highly sensitive ion sensor with turn on/off effect. Dalton Trans. 2020, 49, 4741–4750. [Google Scholar] [CrossRef] [PubMed]
  33. Mosca, L.; Khnayzer, R.S.; Lazorski, M.S.; Danilov, E.O.; Castellano, F.N.; Anzenbacher, P. Sensing of 2,4,6-Trinitrotoluene (TNT) and 2,4-Dinitrotoluene (2,4-DNT) in the Solid State with Photoluminescent RuII and IrIII Complexes. Chem.—Eur. J. 2015, 21, 4056–4064. [Google Scholar] [CrossRef] [PubMed]
  34. Layfield, R.; Murugesu, M. Lanthanides and Actinides in Molecular Magnetism; Wiley: Hoboken, NJ, USA, 2015; ISBN 978-3-527-33526-8. [Google Scholar]
  35. Atwood, D.A. (Ed.) The Rare Earth Elements: Fundamentals and Applications; John Wiley & Sons: Hoboken, NJ, USA, 2012. [Google Scholar]
  36. Bünzli, J.C.G.; Piguet, C. Taking advantage of luminescent lanthanide ions. Chem. Soc. Rev. 2005, 34, 1048–1077. [Google Scholar] [CrossRef] [PubMed]
  37. Heine, J.; Müller-Buschbaum, K. Engineering metal-based luminescence in coordination polymers and metal–organic frameworks. Chem. Soc. Rev. 2013, 42, 9232–9242. [Google Scholar] [CrossRef]
  38. Yip, Y.W.; Wen, H.; Wong, W.T.; Tanner, P.A.; Wong, K.L. Increased antenna effect of the lanthanide complexes by control of a number of terdentate n-donor pyridine ligands. Inorg. Chem. 2012, 51, 7013–7015. [Google Scholar] [CrossRef]
  39. Barry, D.E.; Caffrey, D.F.; Gunnlaugsson, T. Lanthanide-directed synthesis of luminescent self-assembly supramolecular structures and mechanically bonded systems from acyclic coordinating organic ligands. Chem. Soc. Rev. 2016, 45, 3244–3274. [Google Scholar] [CrossRef]
  40. LoPachin, R.M.; Gavin, T.; DeCaprio, A.; Barber, D.S. Application of the Hard and Soft, Acids and Bases (HSAB) theory to toxicant—Target interactions. Chem. Res. Toxicol. 2012, 25, 239–251. [Google Scholar] [CrossRef]
  41. Jiang, F.L.; Gai, Y.L.; Xiong, K.C.; Chen, L.; Bu, Y.; Li, X.J.; Hong, M.C. Visible and NIR photoluminescence properties of a series of novel lanthanide-organic coordination polymers based on hydroxyquinoline-carboxylate ligands. Inorg. Chem. 2012, 51, 13128–13137. [Google Scholar] [CrossRef]
  42. Bruker Apex2; Bruker AXS Inc.: Billerica, MA, USA, 2004.
  43. Sheldrick, G.M. SADABS 1996, Program for Empirical Adsorption Correction. Available online: https://www.scienceopen.com/ (accessed on 18 March 2022).
  44. Sheldrick, G.M. SHELXT—Integrated space-group and crystal-structure determination. Acta Crystallogr. Sect. A Found. Crystallogr. 2015, 71, 3–8. [Google Scholar] [CrossRef]
  45. Dolomanov, O.V.; Bourhis, L.J.; Gildea, R.J.; Howard, J.A.K.; Puschmann, H. OLEX2: A complete structure solution, refinement and analysis program. J. Appl. Crystallogr. 2009, 42, 339–341. [Google Scholar] [CrossRef]
  46. Rodríguez-Carvajal, J. FULLPROF 2000, version 2.5d. Available online: https://www.ill.eu/sites/fullprof/ (accessed on 18 May 2022).
  47. Li, L.; Shen, S.; Lin, R.; Bai, Y.; Liu, H. Rapid and specific luminescence sensing of Cu(II) ions with a porphyrinic metal–organic framework. Chem. Commun. 2017, 53, 9986–9989. [Google Scholar] [CrossRef] [PubMed]
  48. James, J.P. Stewart MOPAC2016. Available online: http://OpenMOPAC.net (accessed on 20 July 2022).
  49. Cepeda, J.; Pérez-Yáñez, S.; Beobide, G.; Castillo, O.; García, J.Á.; Lanchas, M.; Luque, A. Enhancing luminescence properties of lanthanide(iii)/pyrimidine-4,6-dicarboxylato system by solvent-free approach. Dalton Trans. 2015, 44, 6972–6986. [Google Scholar] [CrossRef] [PubMed]
  50. Alvarez, S. Continuous Shape Measures Study of the Coordination Spheres of Actinide Complexes—Part 1: Low Coordination Numbers. Eur. J. Inorg. Chem. 2021, 2021, 3632–3647. [Google Scholar] [CrossRef]
  51. Zhu, C.Y.; Wang, Z.; Mo, J.T.; Fan, Y.N.; Pan, M. A long persistent phosphorescent metal–organic framework for multi-level sensing of oxygen. J. Mater. Chem. C 2020, 8, 9916–9922. [Google Scholar] [CrossRef]
  52. Binnemans, K. Lanthanide-Based Luminescent Hybrid Materials. Chem. Rev. 2009, 109, 4283–4374. [Google Scholar] [CrossRef] [Green Version]
  53. Bünzli, J.-C.G. On the design of highly luminescent lanthanide complexes. Coord. Chem. Rev. 2015, 293–294, 19–47. [Google Scholar] [CrossRef]
  54. López, I.; Lorenz, K.; Nogales, E.; Méndez, B.; Piqueras, J.; Alves, E.; García, J.A. Study of the relationship between crystal structure and luminescence in rare-earth-implanted Ga2O3 nanowires during annealing treatments. J. Mater. Sci. 2014, 49, 1279–1285. [Google Scholar] [CrossRef]
  55. Briones, D.; Leo, P.; Cepeda, J.; Orcajo, G.; Calleja, G.; Sanz, R.; Rodríguez-Diéguez, A.; Martínez, F. Alkaline-earth metal based MOFs with second scale long-lasting phosphor behavior. CrystEngComm 2018, 20, 4793–4803. [Google Scholar] [CrossRef]
  56. Nyokong, T. Effects of substituents on the photochemical and photophysical properties of main group metal phthalocyanines. Coord. Chem. Rev. 2007, 251, 1707–1722. [Google Scholar] [CrossRef]
  57. Solov’ev, K.N.; Borisevich, E.A. Intramolecular heavy-atom effect in the photophysics of organic molecules. Physics-Uspekhi 2005, 48, 231–253. [Google Scholar] [CrossRef]
  58. del Valle, J.C.; Catalán, J. Kasha’s rule: A reappraisal. Phys. Chem. Chem. Phys. 2019, 21, 10061–10069. [Google Scholar] [CrossRef] [PubMed]
  59. Ruiz-Muelle, A.B.; García-García, A.; García-Valdivia, A.A.; Oyarzabal, I.; Cepeda, J.; Seco, J.M.; Colacio, E.; Rodríguez-Diéguez, A.; Fernández, I. Design and synthesis of a family of 1D-lanthanide-coordination polymers showing luminescence and slow relaxation of the magnetization. Dalton Trans. 2018, 47, 12783–12794. [Google Scholar] [CrossRef]
  60. Zabala-Lekuona, A.; Cepeda, J.; Oyarzabal, I.; Rodríguez-Diéguez, A.; García, J.A.; Seco, J.M.; Colacio, E. Rational design of triple-bridged dinuclear ZnIILnIII-based complexes: A structural, magnetic and luminescence study. CrystEngComm 2017, 19, 256–264. [Google Scholar] [CrossRef]
  61. Pajuelo-Corral, O.; García, J.A.; Castillo, O.; Luque, A.; Rodríguez-Diéguez, A.; Cepeda, J. Single-ion magnet and photoluminescence properties of lanthanide(Iii) coordination polymers based on pyrimidine-4,6-dicarboxylate. Magnetochemistry 2021, 7, 8. [Google Scholar] [CrossRef]
  62. Bigwood, R.; Gruebele, M.; Leitner, D.M.; Wolynes, P.G. The vibrational energy flow transition in organic molecules: Theory meets experiment. Proc. Natl. Acad. Sci. USA 1998, 95, 5960–5964. [Google Scholar] [CrossRef] [PubMed] [Green Version]
  63. Hasegawa, M.; Ohmagari, H.; Tanaka, H.; Machida, K. Luminescence of lanthanide complexes: From fundamental to prospective approaches related to water- and molecular-stimuli. J. Photochem. Photobiol. C Photochem. Rev. 2022, 50, 100484. [Google Scholar] [CrossRef]
  64. Yamamoto, H.; Shionoya, S.; Yen, W.M. Phosphor Handbook, 2nd ed.; Yamamoto, H., Shionoya, S., Yen, W.M., Eds.; CRC Press: Boca Raton, FL, USA, 2007; ISBN 9780849335648. [Google Scholar]
  65. Latva, M.; Takalob, H.; Mukkala, V.M.; Matachescu, C.; Rodríguez-Ubis, J.C.; Kankare, J. Correlation between the lowest triplet state energy level of the ligand and lanthanide(III) luminescence quantum yield. J. Lumin. 1997, 75, 149–169. [Google Scholar] [CrossRef]
  66. Dutra, J.D.L.; Bispo, T.D.; Freire, R.O. LUMPAC lanthanide luminescence software: Efficient and user friendly. J. Comput. Chem. 2014, 35, 772–775. [Google Scholar] [CrossRef]
  67. Borges, A.S.; Caliman, E.V.; Dutra, J.D.L.; Da Silva, J.G.; Araujo, M.H. Structure and luminescent investigation of new Ln(III)-TTA complexes containing N-methyl-ε-caprolactam as ligand. J. Lumin. 2016, 170, 654–662. [Google Scholar] [CrossRef]
  68. Malta, O.L.; Gonçalves e Silva, F.R. A theoretical approach to intramolecular energy transfer and emission quantum yields in coordination compounds of rare earth ions. Spectrochim. Acta Part A Mol. Biomol. Spectrosc. 1998, 54, 1593–1599. [Google Scholar] [CrossRef]
  69. Malta, O.L. Ligand—Rare-earth ion energy transfer in coordination compounds. A theoretical approach. J. Lumin. 1997, 71, 229–236. [Google Scholar] [CrossRef]
  70. de Sá, G.F.; Malta, O.L.; de Mello Donegá, C.; Simas, A.M.; Longo, R.L.; Santa-Cruz, P.A.; da Silva, E.F. Spectroscopic properties and design of highly luminescent lanthanide coordination complexes. Coord. Chem. Rev. 2000, 196, 165–195. [Google Scholar] [CrossRef]
  71. Neese, F.; Wennmohs, F.; Becker, U.; Riplinger, C. The ORCA quantum chemistry program package. J. Chem. Phys. 2020, 152, 224108. [Google Scholar] [CrossRef] [PubMed]
  72. Monguzzi, A.; Milani, A.; Lodi, L.; Trioni, M.I.; Tubino, R.; Castiglioni, C. Vibrational overtones quenching of near infrared emission in Er3+ complexes. New J. Chem. 2009, 33, 1542–1548. [Google Scholar] [CrossRef]
  73. Ermolaev, V.L.; Sveshnikova, E.B. The application of luminescence-kinetic methods in the study of the formation of lanthanide ion complexes in solution. Russ. Chem. Rev. 1994, 63, 905–922. [Google Scholar] [CrossRef]
  74. Cavalli, E.; Ruggieri, S.; Mizzoni, S.; Nardon, C.; Bettinelli, M.; Piccinelli, F. NIR-emission from Yb(III)- and Nd(III)-based complexes in the solid state sensitized by a ligand system absorbing in a broad UV and visible spectral window. Results Chem. 2022, 4, 100388. [Google Scholar] [CrossRef]
  75. Kasprzycka, E.; Carneiro Neto, A.N.; Trush, V.A.; Malta, O.L.; Jerzykiewicz, L.; Amirkhanov, V.M.; Legendziewicz, J.; Gawryszewska, P. Spectroscopic aspects for the Yb3+ coordination compound with a large energy gap between the ligand and Yb3+ excited states. Spectrochim. Acta Part A Mol. Biomol. Spectrosc. 2022, 274, 121072. [Google Scholar] [CrossRef]
  76. Huang, Y.L.; Qiu, P.L.; Bai, J.P.; Luo, D.; Lu, W.; Li, D. Exclusive Recognition of Acetone in a Luminescent BioMOF through Multiple Hydrogen-Bonding Interactions. Inorg. Chem. 2019, 58, 7667–7671. [Google Scholar] [CrossRef]
  77. Bayliss, N.S.; Mcrae, E.G. Solvent effects in the spectra of acetone, crotonaldehyde, nitromethane and nitrobenzene. J. Phys. Chem. 1954, 58, 1006–1011. [Google Scholar] [CrossRef]
  78. Klongdee, F.; Youngme, S.; Boonmak, J. A luminescent sensor based on zinc(II) 1D chain coordination polymer for effective acetone detection. Polyhedron 2020, 180, 114437. [Google Scholar] [CrossRef]
  79. Terzyk, A.P.; Bieniek, A.; Bolibok, P.; Wiśniewski, M.; Ferrer, P.; da Silva, I.; Kowalczyk, P. Stability of coordination polymers in water: State of the art and towards a methodology for nonporous materials. Adsorption 2019, 25, 1–11. [Google Scholar] [CrossRef] [Green Version]
  80. McNaught, A.D.; Wilkinson, A. Compendium of Chemical Terminology. IUPAC Recommendations, (the “Gold Book”), 2nd ed.; Blackwell Scientific Publications: Oxford, UK, 1997; ISBN 0-9678550-9-8. [Google Scholar]
  81. Nath, S.; Pathak, S.K.; Pradhan, B.; Gupta, R.K.; Reddy, K.A.; Krishnamoorthy, G.; Achalkumar, A.S. A sensitive and selective sensor for picric acid detection with a fluorescence switching response. New J. Chem. 2018, 42, 5382–5394. [Google Scholar] [CrossRef]
  82. Qian, L.L.; Wang, Z.X.; Ding, J.G.; Tian, H.X.; Li, K.; Li, B.L.; Li, H.Y. A 2D copper(I) metal-organic framework: Synthesis, structure and luminescence sensing for cupric, ferric, chromate and TNP. Dye. Pigment. 2020, 175, 108159. [Google Scholar] [CrossRef]
  83. Honglae, S.; Sailor, M.J.; Magde, D.; Trogler, W.C. Detection of Nitroaromatic Explosives Based on Photoluminescent Polymers Containing Metalloles. J. Am. Chem. Soc. 2003, 125, 3821–3830. [Google Scholar] [CrossRef]
  84. Zhou, X.H.; Li, L.; Li, H.H.; Li, A.; Yang, T.; Huang, W. A flexible Eu(III)-based metal–organic framework: Turn-off luminescent sensor for the detection of Fe(III) and picric acid. Dalton Trans. 2013, 42, 12403–12409. [Google Scholar] [CrossRef]
  85. Xu, H.; Hu, H.C.; Cao, C.S.; Zhao, B. Lanthanide Organic Framework as a Regenerable Luminescent Probe for Fe3+. Inorg. Chem. 2015, 54, 4585–4587. [Google Scholar] [CrossRef] [PubMed]
  86. Wang, S.; Sun, B.; Su, Z.; Hong, G.; Li, X.; Liu, Y.; Pan, Q.; Sun, J. Lanthanide-MOFs as multifunctional luminescent sensors. Inorg. Chem. Front. 2022, 9, 3259–3266. [Google Scholar] [CrossRef]
  87. Liu, W.; Huang, X.; Xu, C.; Chen, C.; Yang, L.; Dou, W.; Chen, W.; Yang, H.; Liu, W. A Multi-responsive Regenerable Europium–Organic Framework Luminescent Sensor for Fe3+, CrVI Anions, and Picric Acid. Chem.-Eur. J. 2016, 22, 18769–18776. [Google Scholar] [CrossRef]
  88. Zhang, F.; Wang, Y.; Chu, T.; Wang, Z.; Li, W.; Yang, Y. A facile fabrication of electrodeposited luminescent MOF thin films for selective and recyclable sensing of nitroaromatic explosives. Analyst 2016, 141, 4502–4510. [Google Scholar] [CrossRef]
  89. He, H.; Chen, S.H.; Zhang, D.Y.; Yang, E.C.; Zhao, X.J. A luminescent metal–organic framework as an ideal chemosensor for nitroaromatic compounds. RSC Adv. 2017, 7, 38871–38876. [Google Scholar] [CrossRef] [Green Version]
  90. Song, X.Z.; Song, S.Y.; Zhao, S.N.; Hao, Z.M.; Zhu, M.; Meng, X.; Wu, L.L.; Zhang, H.J. Single-Crystal-to-Single-Crystal Transformation of a Europium(III) Metal–Organic Framework Producing a Multi-responsive Luminescent Sensor. Adv. Funct. Mater. 2014, 24, 4034–4041. [Google Scholar] [CrossRef]
  91. Cao, L.H.; Shi, F.; Zhang, W.M.; Zang, S.Q.; Mak, T.C.W. Selective Sensing of Fe3+ and Al3+ Ions and Detection of 2,4,6-Trinitrophenol by a Water-Stable Terbium-Based Metal–Organic Framework. Chem. Eur. J. 2015, 21, 15705–15712. [Google Scholar] [CrossRef] [PubMed]
  92. Goodpaster, J.V.; McGuffin, V.L. Rapid and accurate determination of Stern-Volmer quenching constants. Appl. Spectrosc. 1999, 53, 1000–1008. [Google Scholar]
  93. Kusba, J.; Bogdanov, V.; Gryczynski, I.; Lakowicz, J.R. Theory of light quenching: Effects of fluorescence polarization, intensity, and anisotropy decays. Biophys. J. 1994, 67, 2024–2040. [Google Scholar] [CrossRef]
Figure 1. Polymeric structure and coordination polyhedra of compound 2Eu. Color coding: carbon (grey), nitrogen (blue), oxygen (red), hydrogen (pink) and europium (green).
Nanomaterials 12 03977 g001
Figure 2. Crystal packing of compound 2Eu showing the alternating propagation of the metal-carboxylate rods along b axis.
Nanomaterials 12 03977 g002
Figure 3. Emission spectra of compounds 1Sm, 2Eu and 4Tb recorded at room temperature showing the intraionic assignations. Insets show selected augmented regions corresponding to the main intraionic transitions and ligand-centered emission.
Nanomaterials 12 03977 g003
Figure 4. Schematic diagram of the main states involved in the luminescence of compound 2Eu using model 2-Eu-1 showing the main calculated energy transfer rates. Dotted lines represent the ligand-to-metal (red) and reverse (blue) transfers.
Nanomaterials 12 03977 g004
Figure 5. Emission spectra of compound 5Yb recorded under ligand-mediated excitation in the UV region (λex = 325 nm).
Nanomaterials 12 03977 g005
Figure 6. Bar charts showing the PL sensing results in the form of quenching percentages with respect to the blank compound@H2O dispersion for various: (a) solvents and (b) nitroaromatic molecules.
Nanomaterials 12 03977 g006
Figure 7. Room temperature emission spectra of 4Tb@MeOH with TNP in variable concentration (λex = 310 nm). Insets show the Stern-Volmer plots for the titration experiment with the whole studied concentration region (top) and the low concentration linear regime (bottom).
Nanomaterials 12 03977 g007
Figure 8. Comparison of the luminescent emission of 4Tb@MeOH in the absence or presence of nitroaromatic molecules: (a) as a bar chart and (b) photographs of the irradiated suspension.
Nanomaterials 12 03977 g008
Table 1. Single crystal X-ray diffraction data and structure refinement details of compounds 1Sm and 2Eu.
Compound1Sm2Eu
Empirical formulaC30H25Sm2NO13C30H25Eu2NO13
Formula weight908.21911.43
Crystal systemmonoclinicmonoclinic
Space groupP21/cP21/c
a (Å)19.662(1)19.618(1)
b (Å)8.3368(6)8.3105(7)
c (Å)18.794(1)18.764(1)
β (°)104.867(3)104.959(3)
V (Å3)2977.5(4)2955.4(5)
Reflections collected26,18631,478
Unique data/parameters6814/4205215/420
Rint0.02850.0424
GoF (S) 11.0811.095
R1 2/wR2 [I > 2σ(I)] 30.0521/0.13430.0288/0.0642
R1 2/wR2 [all] 30.0608/0.14190.0343/0.0668
1 S = [∑w(F02 − Fc2)2/(Nobs − Nparam)]1/2. 2 R1 = ∑||F0| − |Fc||/∑|F0|; 3 wR2 = [∑w(F02 − Fc2)2/∑wF02]1/2; w = 1/[σ2(F02) + (aP)2 + bP] where P = (max(F02,0) + 2Fc2)/3 with a = 0.0755 and b = 15.2245 (1Sm) and a = 0.0230 and b = 11.6862 (2Eu).
Table 2. Selected bond lengths for compound 2Eu (Å) 1.
Coordination sphere of the Eu1 atom
Eu1–O1A2.353(4)Eu1–O2B(iv)2.335(4)
Eu1–O1B2.300(4)Eu1-O3B(i)2.656(3)
Eu1–O1D2.476(4)Eu1-O3B(v)2.436(3)
Eu1–O2A(iii)2.403(4)Eu1–O4B(i)2.413(4)
Coordination sphere of the Eu2 atom
Eu2–O1C2.315(4)Eu2–O4A2.426(3)
Eu2–O2C2.296(3)Eu2–O4A(vi)2.626(3)
Eu2–O3A(iv)2.429(4)Eu2–O4C(v)2.306(4)
Eu2–O3C(vii)2.342(4)
1 Symmetries: (i) 1−x, −y, 1−z; (ii) 2−x, −½ + y, 3/2−z; (iii) 1−x, ½ + y, 3/2−z; (iv) 1−x, −½ + y, 3/2−z; (v) +x, 3/2−y, ½ + z; (vi) 2−x, ½ + y, 3/2−z; (vii) 2−x, 1−y, 1−z.
Table 3. Results for the sensing of TNP for other lanthanide-based MOFs.
MOFMediumKsv (M−1)Ref.
{[Eu2(L1)1.5(H2O)2EtOH]·DMF}n DMF2.0 × 103[87]
{[Eu2(TDC)3(CH3OH)2]·CH3OH}n Methanol1.1 × 104[88]
[Pr2(TATMA)2·4DMF·4H2O]n DMF1.6 × 104[89]
{[Eu3(bpydb)3(HCOO)(µ3-OH)2(DMF)]·3DMF·H2O}n Water2.1 × 104[90]
{[Tb(L2)1.5(H2O)]·3H2O}n Water7.5 × 104[91]
[Eu(BDPO)(H2O)4]n Water6.0 × 105[90]
[Tb(BDPO)(H2O)4]n Water6.0 × 105[90]
1 L1 = 5,5′-(carbonylbis(azanediyl))diisophthalate, 2 TDC = thiophene-2,5-dicarboxylate, 3 TATMA = 4,4′,4′′-s-triazine-1,3,5-triyltri-m-aminobenzoate, 4 bpydb = 4,4′-(4,4′-bipyridine-2,6-diyl)dibenzoate, 5 L2 = 2-(2-Hydroxy-propionylamino)-terephthalate, 6 BDPO = N,N′ bis(3,5-dicarboxyphenyl)-oxalamide).
Publisher’s Note: MDPI stays neutral with regard to jurisdictional claims in published maps and institutional affiliations.

