
Black TiO2-Based Dual Photoanodes Boost the Efficiency of Quantum Dot-Sensitized Solar Cells to 11.7%

Abstract
:1. Introduction
2. Materials and Methods
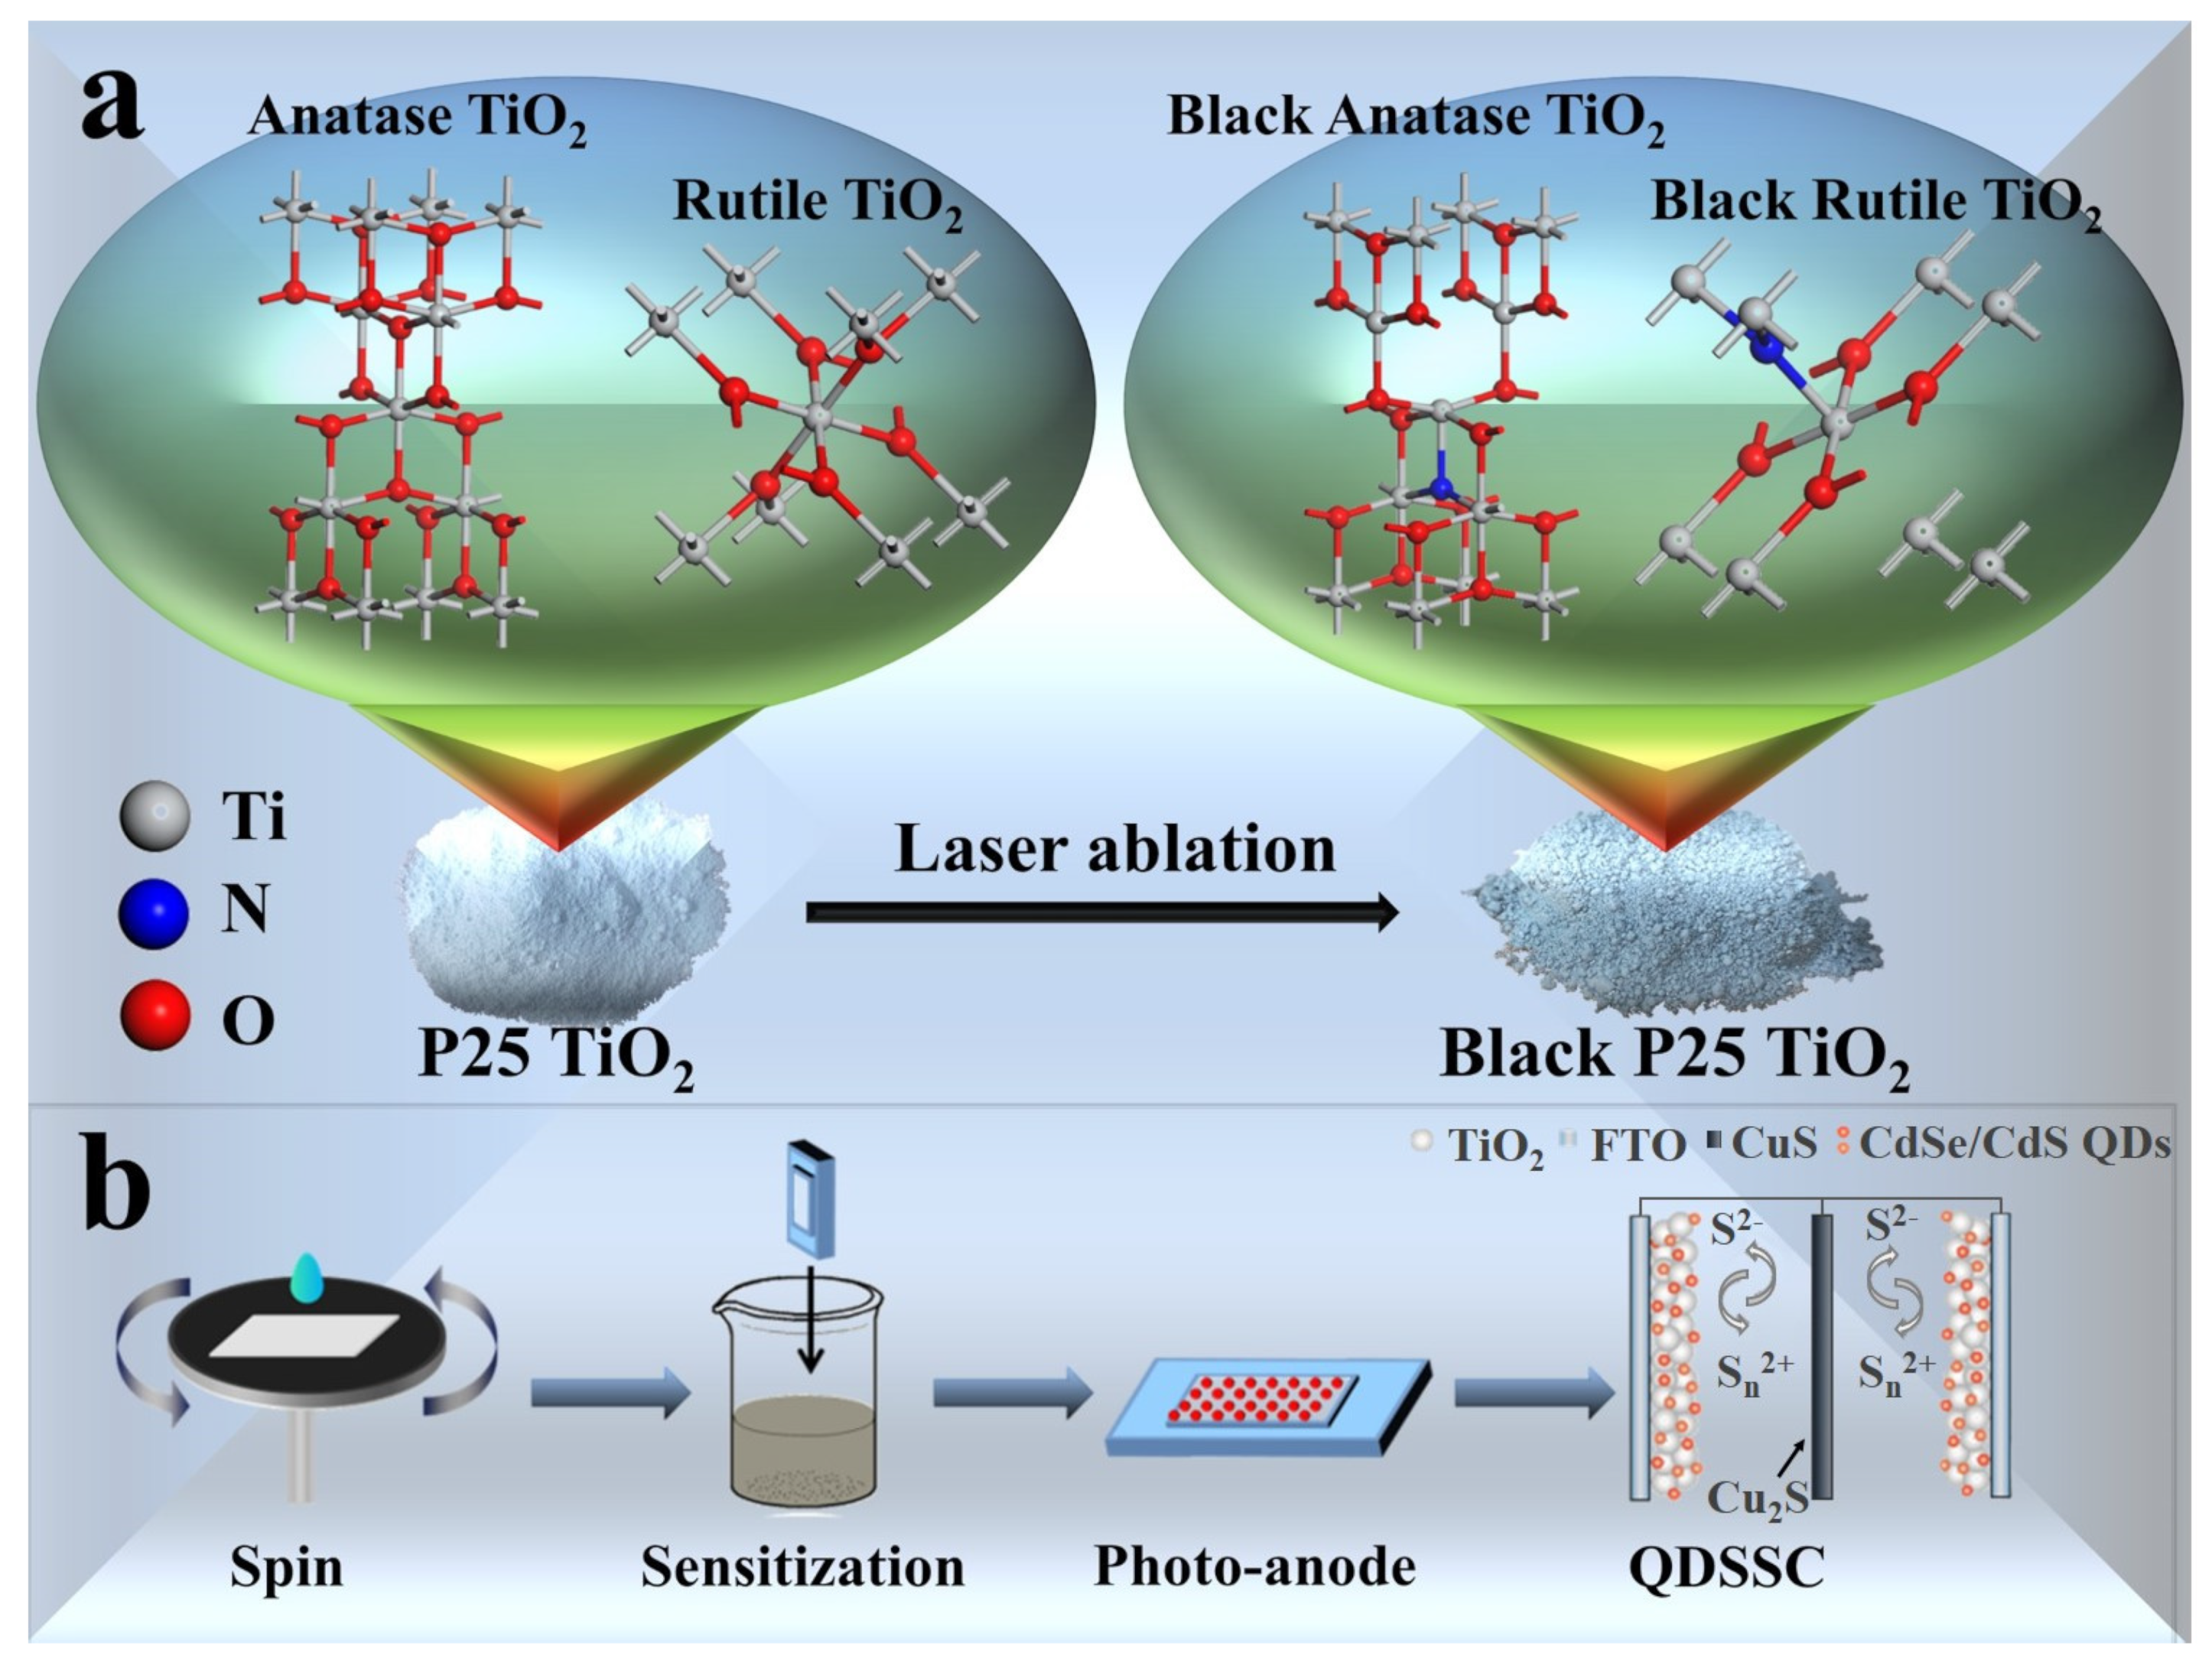
2.1. Preparation of Black TiO2
2.2. Preparation of Photoanodes
2.3. Preparation of CuS and CuS/Brass-Mesh Counter Electrode (CE)
2.4. Assembly of QDSSCs and Dual Photoanode QDSSCs
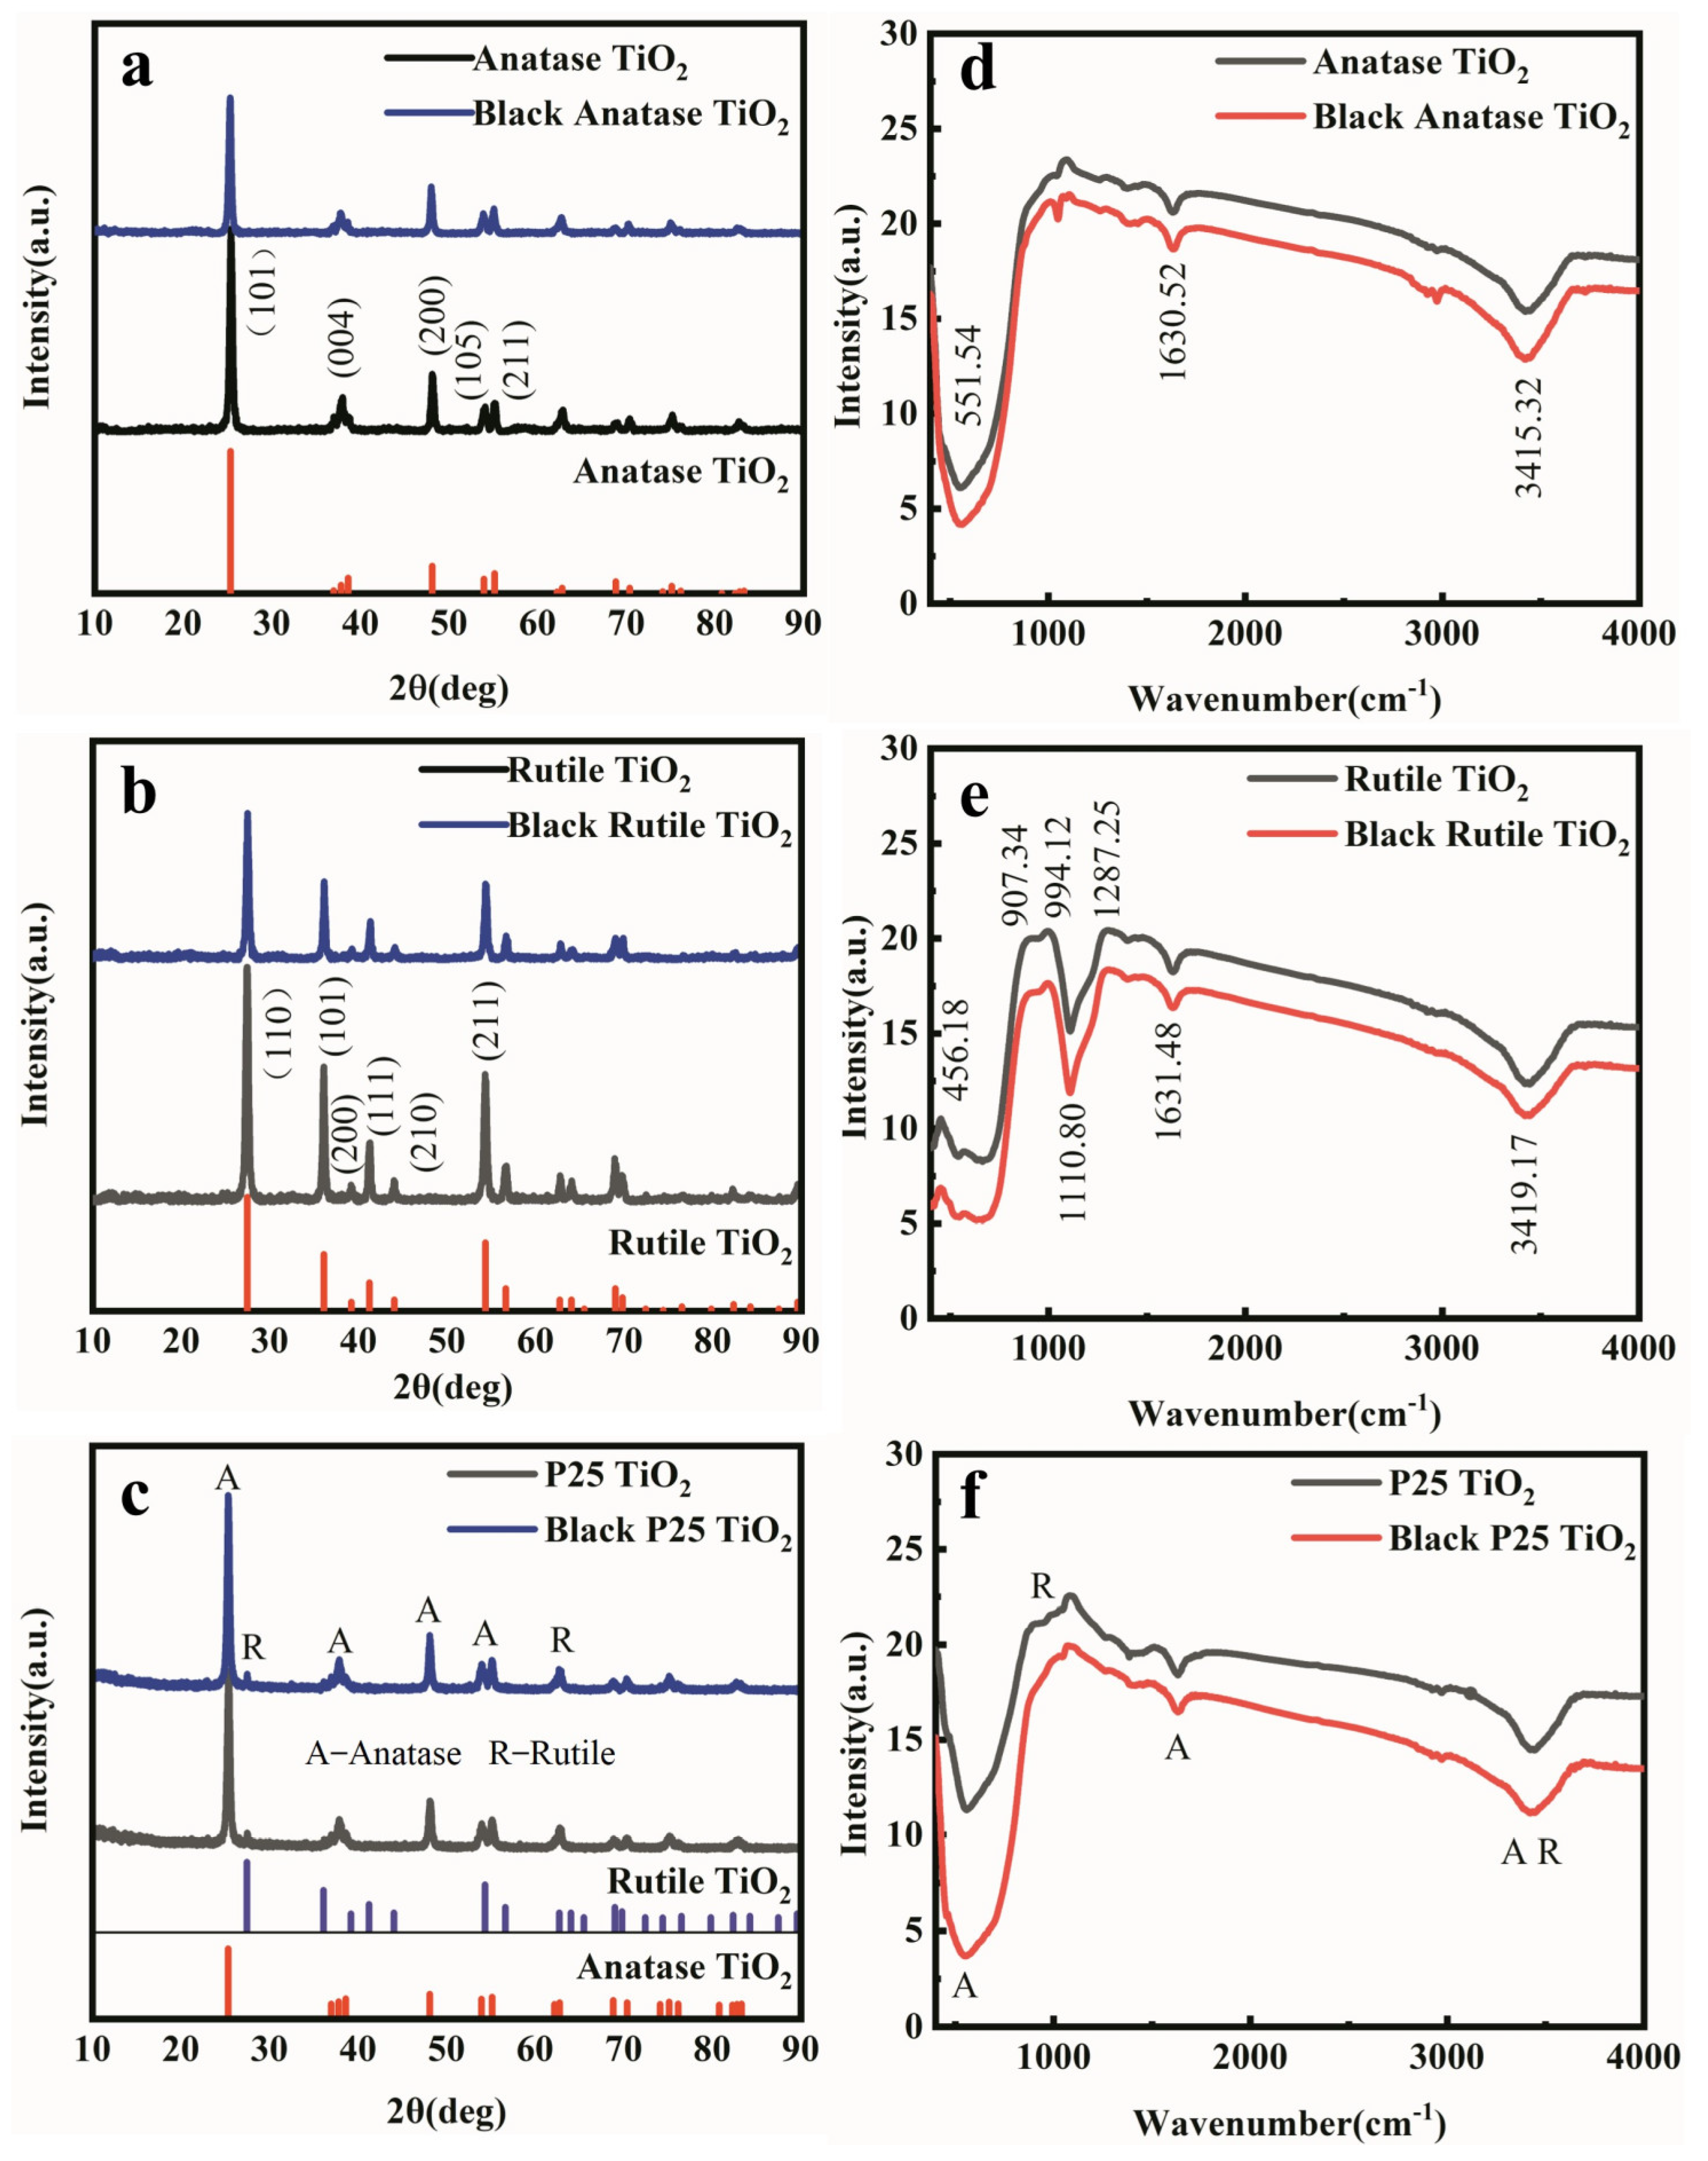
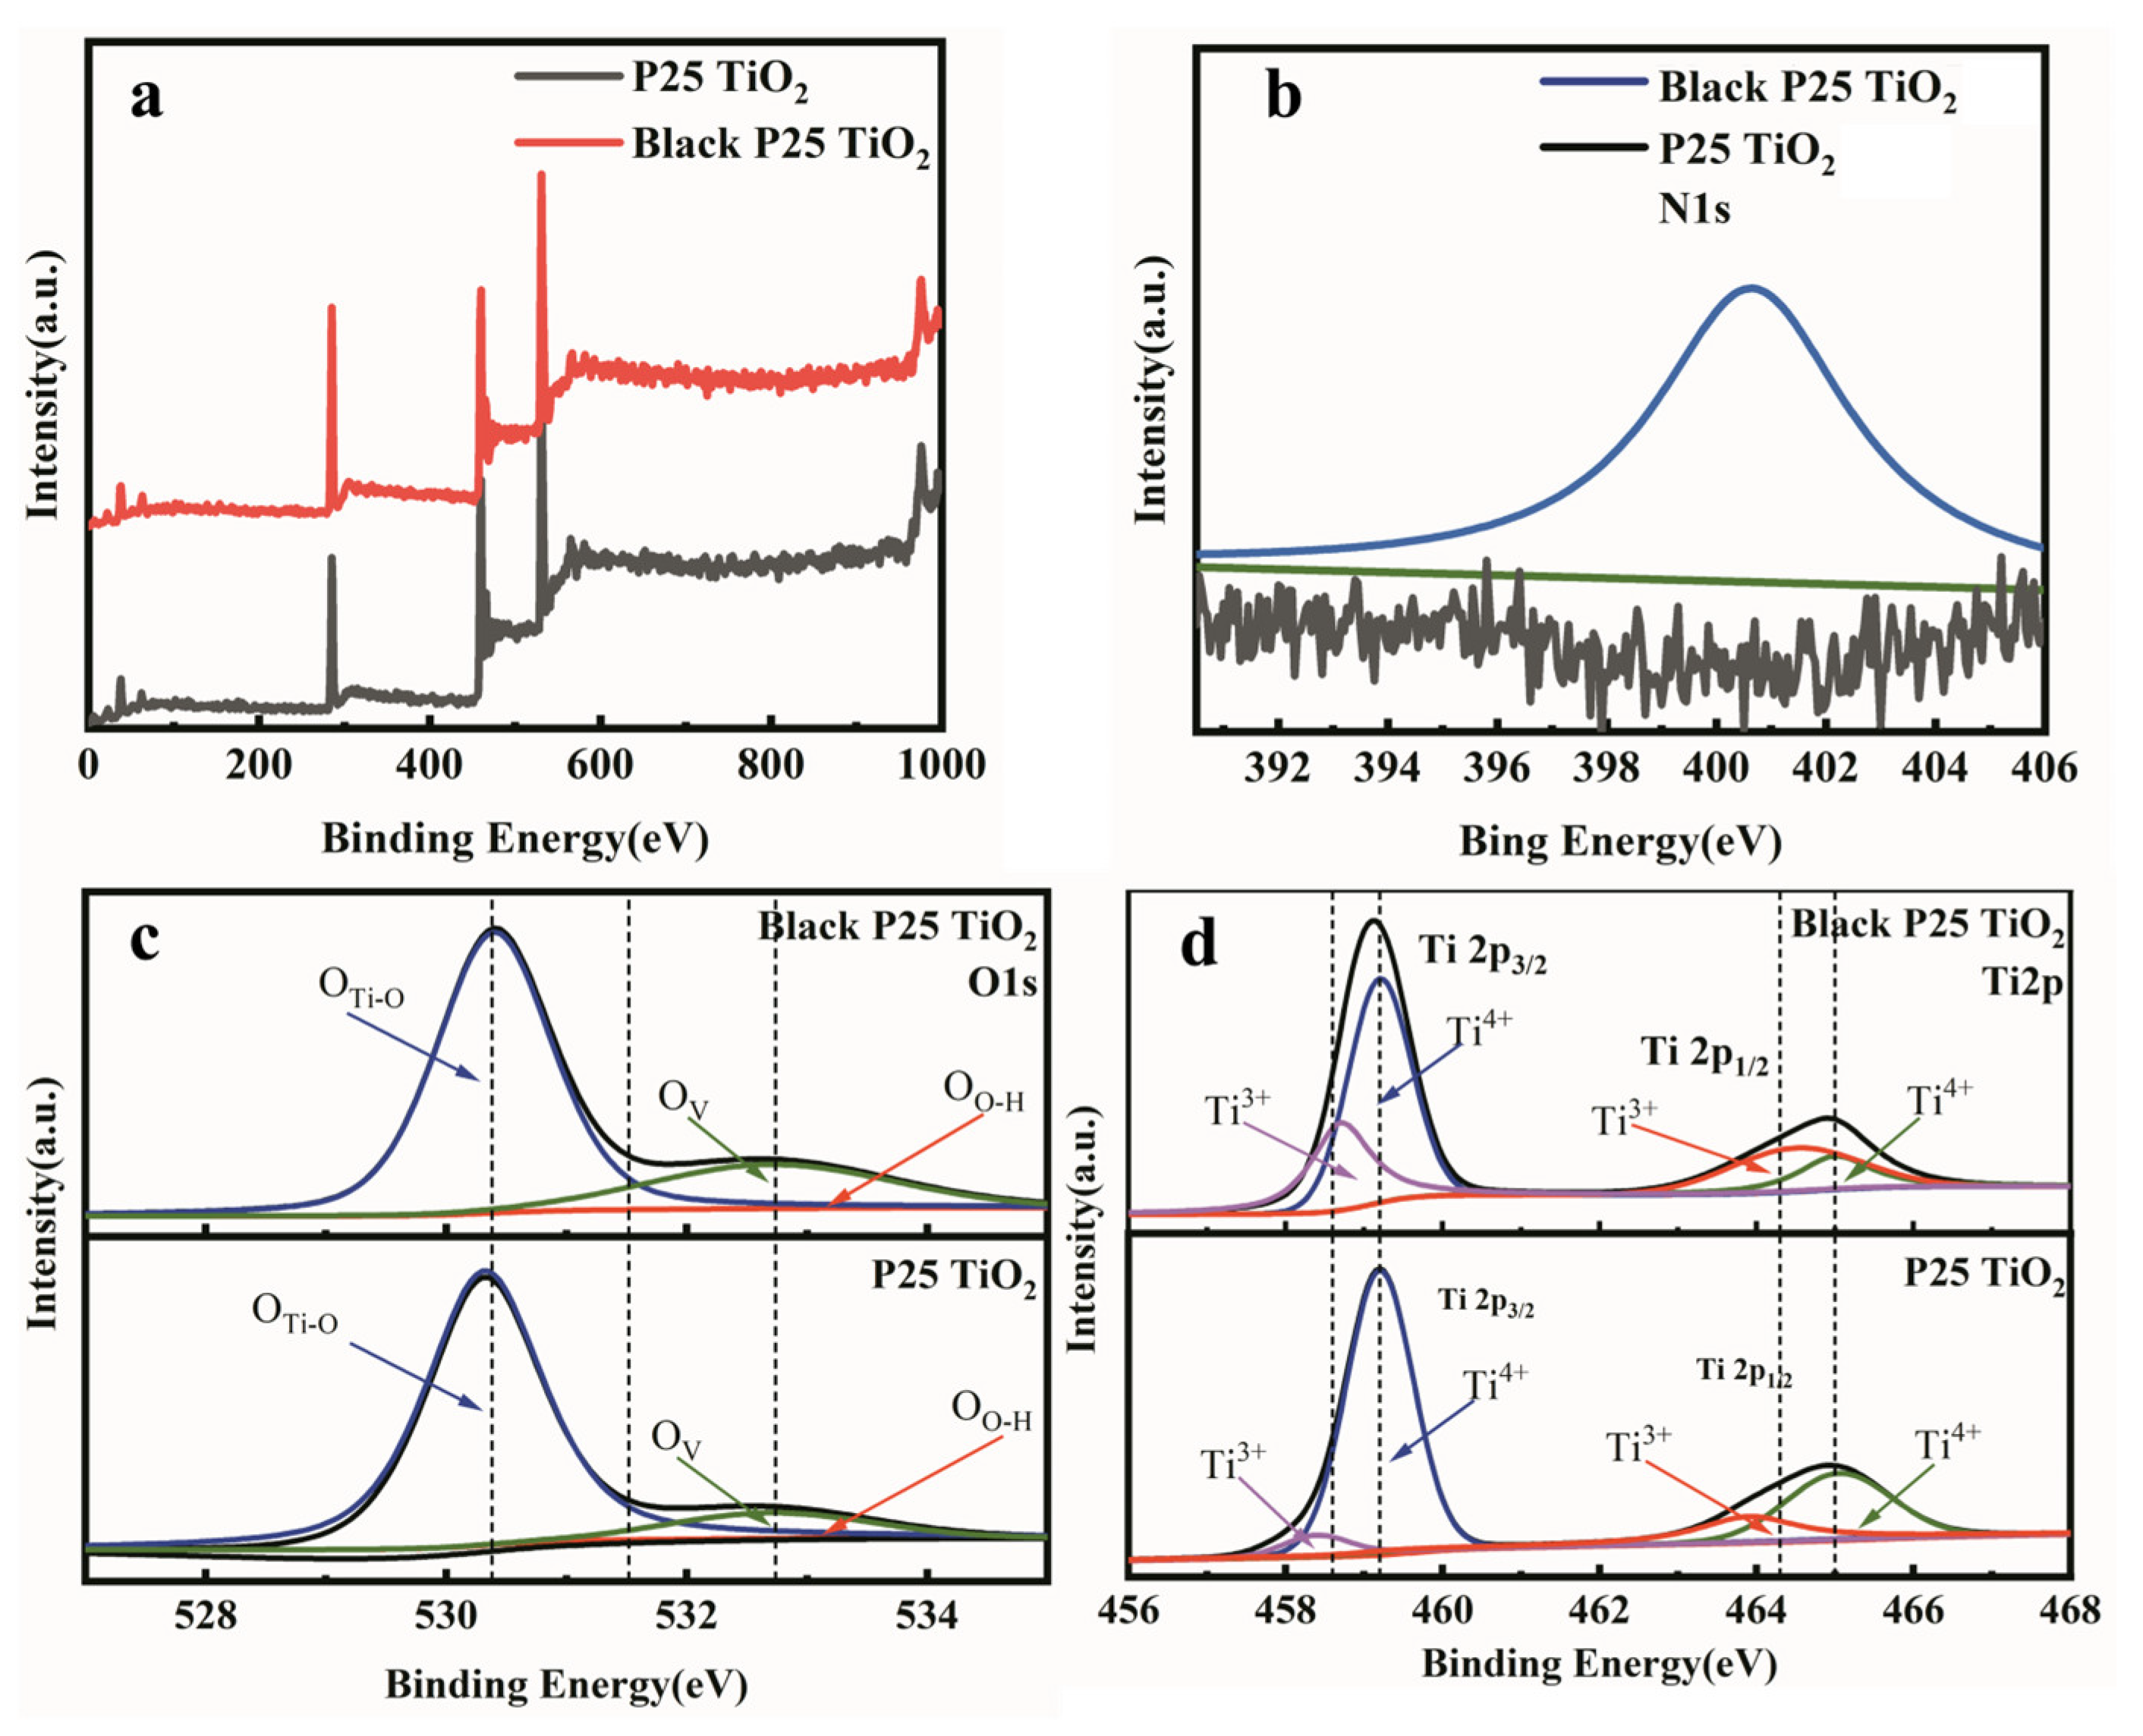
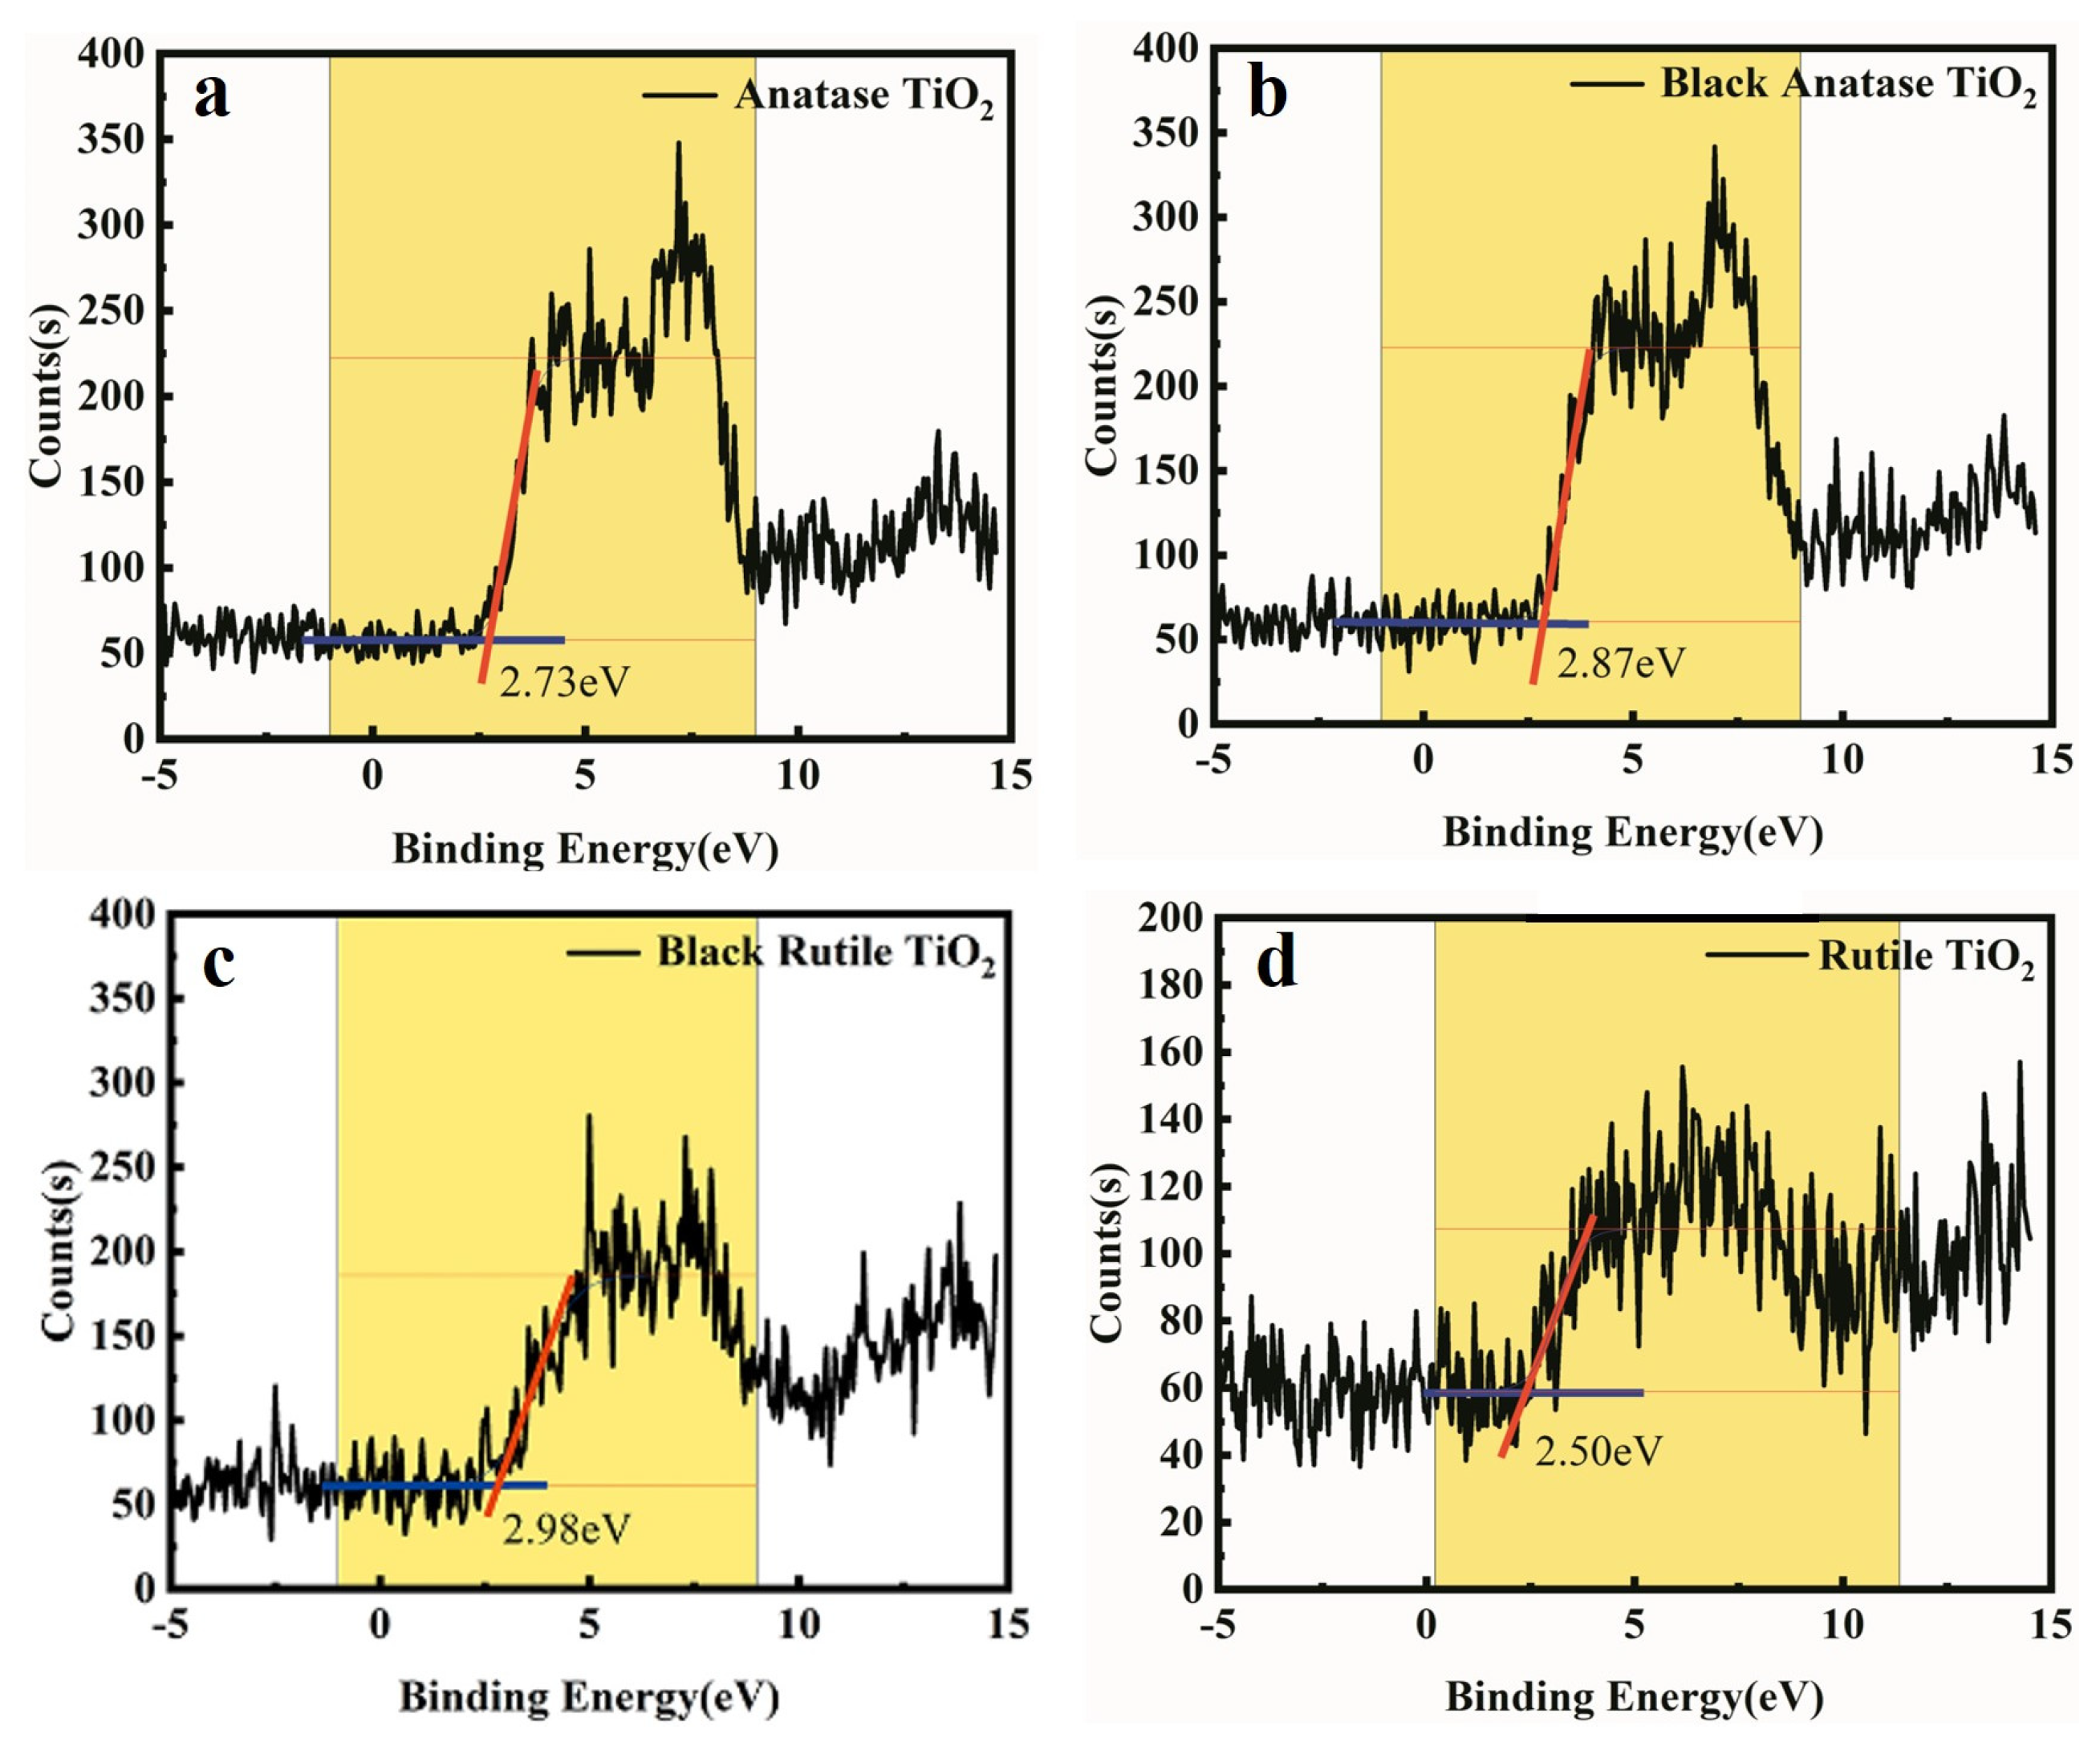
2.5. Characterization and Electrochemical Measurement
3. Results
4. Conclusions
Supplementary Materials
Author Contributions
Funding
Institutional Review Board Statement
Informed Consent Statement
Data Availability Statement
Conflicts of Interest
References
- Chen, C.; Tang, J. Open-Circuit Voltage Loss of Antimony Chalcogenide Solar Cells: Status, Origin, and Possible Solutions. ACS Energy Lett. 2020, 5, 2294–2304. [Google Scholar] [CrossRef]
- Cheng, Y.; Smith, K.J.; Arinze, E.S.; Dziatko, R.A.; Gao, T.; Frank, B.P.; Thon, S.M.; Bragg, A.E. Size- and Surface-Dependent Photoresponses of Solution-Processed Aluminum Nanoparticles. ACS Photonics 2020, 7, 637–645. [Google Scholar] [CrossRef]
- Elibol, E. Synthesis of near unity photoluminescence CdSeTe alloyed Quantum Dots. J. Alloys Compd. 2020, 817, 152726. [Google Scholar] [CrossRef]
- An, S.; Gao, Q.; Zhang, X.; Li, X.; Duan, L.; Lü, W. Introducing of MnS passivation layer on TiO2 mesoporous film for improving performance of quantum dot-sensitized solar cells. J. Alloys Compd. 2019, 799, 351–359. [Google Scholar] [CrossRef]
- Ou, J.; Xiang, J.; Liu, J.; Sun, L. Surface-Supported Metal-Organic Framework Thin-Film-Derived Transparent CoS1.097@N-Doped Carbon Film as an Efficient Counter Electrode for Bifacial Dye-Sensitized Solar Cells. ACS Appl. Mater. Interfaces 2019, 11, 14862–14870. [Google Scholar] [CrossRef]
- Yue, L.; Rao, H.; Du, J.; Pan, Z.; Yu, J.; Zhong, X. Comparative advantages of Zn–Cu–In–S alloy QDs in the construction of quantum dot-sensitized solar cells. RSC Adv. 2018, 8, 3637–3645. [Google Scholar] [CrossRef] [Green Version]
- Zhang, H.; Ji, X.; Liu, N.; Zhao, Q. Synergy effect of carbon nanotube and graphene hydrogel on highly efficient quantum dot-sensitized solar cells. Electrochim. Acta 2019, 327, 134937. [Google Scholar] [CrossRef]
- Zhang, H.; Tong, J.; Fang, W.; Qian, N.; Zhao, Q. Efficient Flexible Counter Electrode Based on Modified Graphite Paper and in Situ Grown Copper Sulfide for Quantum Dot Sensitized Solar Cells. ACS Appl. Energy Mater. 2018, 1, 1355–1363. [Google Scholar] [CrossRef]
- Song, H.; Lin, Y.; Zhang, Z.Y.; Rao, H.S.; Wang, W.R.; Fang, Y.P.; Pan, Z.X.; Zhong, X.H. Improving the Efficiency of Quantum Dot Sensitized Solar Cells beyond 15% via Secondary Deposition. J. Am. Chem. Soc. 2021, 143, 4790–4800. [Google Scholar] [CrossRef]
- Balati, A.; Tek, S.; Nash, K.; Shipley, H. Nanoarchitecture of TiO2 microspheres with expanded lattice interlayers and its heterojunction to the laser modified black TiO2 using pulsed laser ablation in liquid with improved photocatalytic performance under visible light irradiation. J. Colloid Interface Sci. 2019, 541, 234–248. [Google Scholar] [CrossRef]
- Chatzitakis, A.; Sartori, S. Recent Advances in the Use of Black TiO2 for Production of Hydrogen and Other Solar Fuels. ChemPhysChem 2019, 20, 1272–1281. [Google Scholar] [CrossRef]
- Chen, S.; Wang, Y.; Li, J.; Hu, Z.; Zhao, H.; Xie, W.; Wei, Z. Synthesis of black TiO2 with efficient visible-light photocatalytic activity by ultraviolet light irradiation and low temperature annealing. Mater. Res. Bull. 2018, 98, 280–287. [Google Scholar] [CrossRef]
- Ding, Y.; Wu, Y.; Zhang, T.; Tao, L.; Liu, X.; Liu, X.; Hu, L.; Hayat, T.; Alsaedi, A.; Dai, S. Colorful TiO2−x microspheres cooperating with titanium Schiff base complex for efficient visible light photocatalysts. Catal. Today 2019, 335, 550–556. [Google Scholar] [CrossRef]
- Hamad, H.; Bailón-García, E.; Maldonado-Hódar, F.J.; Pérez-Cadenas, A.F.; Carrasco-Marín, F.; Morales-Torres, S. Synthesis of TixOy nanocrystals in mild synthesis conditions for the degradation of pollutants under solar light. Appl. Catal. B 2019, 241, 385–392. [Google Scholar] [CrossRef]
- He, M.; Ji, J.; Liu, B.; Huang, H. Reduced TiO2 with tunable oxygen vacancies for catalytic oxidation of formaldehyde at room temperature. Appl. Surf. Sci. 2019, 473, 934–942. [Google Scholar] [CrossRef]
- Kavil, J.; Ullattil, S.G.; Alshahrie, A.; Periyat, P. Polyaniline as Photocatalytic Promoter in Black Anatase TiO2. Sol. Energy 2017, 158, 792–796. [Google Scholar] [CrossRef]
- Li, H.; Shen, L.; Zhang, K.; Sun, B.; Ren, L.; Qiao, P.; Pan, K.; Wang, L.; Zhou, W. Surface plasmon resonance-enhanced solar-driven photocatalytic performance from Ag nanoparticle-decorated self-floating porous black TiO2 foams. Appl. Catal. B 2018, 220, 111–117. [Google Scholar] [CrossRef]
- Li, H.; Sun, B.; Yang, F.; Wang, Z.; Xu, Y.; Tian, G.; Pan, K.; Jiang, B.; Zhou, W. Homojunction and defect synergy-mediated electron–hole separation for solar-driven mesoporous rutile/anatase TiO2 microsphere photocatalysts. RSC Adv. 2019, 9, 7870–7877. [Google Scholar] [CrossRef]
- Lin, L.; Huang, J.; Li, X.; Abass, M.A.; Zhang, S. Effective surface disorder engineering of metal oxide nanocrystals for improved photocatalysis. Appl. Catal. B 2017, 203, 615–624. [Google Scholar] [CrossRef]
- Liu, Y.; Tian, L.; Tan, X.; Li, X.; Chen, X. Synthesis, properties, and applications of black titanium dioxide nanomaterials. Sci. Bull. 2017, 62, 431–441. [Google Scholar] [CrossRef]
- Negi, S.S. Enhanced light harvesting and charge separation over wormhole mesoporous TiO2−X nanocrystallites towards efficient hydrogen generation. Sustain. Energy Fuels 2019, 3, 1191–1200. [Google Scholar] [CrossRef]
- Pan, X.; Yang, M.Q.; Fu, X.; Zhang, N.; Xu, Y.J. Defective TiO2 with oxygen vacancies: Synthesis, properties and photocatalytic applications. Nanoscale 2013, 5, 3601–3614. [Google Scholar] [CrossRef] [PubMed]
- Qiu, J.; Li, S.; Gray, E.; Liu, H.; Gu, Q.F.; Sun, C.; Lai, C.; Zhao, H.; Zhang, S. Hydrogenation Synthesis of Blue TiO2 for High-Performance Lithium-Ion Batteries. J. Phys. Chem. C 2014, 118, 8824–8830. [Google Scholar] [CrossRef]
- Rajaraman, T.S.; Parikh, S.P.; Gandhi, V. Black TiO2: A review of its properties and conflicting trends. Chem. Eng. J. 2020, 389, 123918. [Google Scholar] [CrossRef]
- Sabzehparvar, M.; Kiani, F.; Tabrizi, N.S. Synthesis and characterization of black amorphous titanium oxide nanoparticles by spark discharge method. AIP Conf. Proc. 2018, 1920, 020046. [Google Scholar] [CrossRef]
- Su, Y.; Zhang, W.; Chen, S.M.; Yao, D.W.; Xu, J.L.; Chen, X.B.; Xu, H.L. Engineering black titanium dioxide by femtosecond laser filament. Appl. Surf. Sci. 2020, 520, 146298. [Google Scholar] [CrossRef]
- Yao, D.W.; Hu, Z.Y.; Su, Y.; Chen, S.M.; Zhang, W.; Lü, W.; Xu, H.L. Significant efficiency enhancement of CdSe/CdS quantum-dot sensitized solar cells by black TiO2 engineered with ultrashort filamentating pulses. Appl. Surf. Sci. Adv. 2021, 6, 100142. [Google Scholar] [CrossRef]
- Zang, H.W.; Li, H.L.; Zhang, W.; Fu, Y.; Chen, S.M.; Li, R.L. Robust and ultralow-energy-threshold ignition of a lean mixture by an ultrashort-pulsed laser in the filamentation regime. Light Sci. Appl. 2021, 10, 49. [Google Scholar] [CrossRef]
- Xu, H.L.; Cheng, Y.; Chin, S.L.; Sun, H.B. Femtosecond laser ionization and fragmentation of molecules for environmental sensing. Laser Photonics Rev. 2015, 9, 275–293. [Google Scholar] [CrossRef]
- Fu, Y.; Cao, J.C.; Yamanouchi, K.; Xu, H.L. Air-Laser-Based Standoff Coherent Raman Spectrometer. Ultrafast Sci. 2022, 2022, 9867028. [Google Scholar] [CrossRef]
- Zimbone, M.; Cacciato, G.; Boutinguiza, M.; Gulino, A.; Cantarella, M.; Privitera, V.; Grimaldi, M.G. Hydrogenated black–TiOx: A facile and scalable synthesis for environmental water purification. Catal. Today 2019, 321–322, 146–157. [Google Scholar] [CrossRef]
- Xu, Y.; Ahmed, R.; Klein, D.; Cap, S.; Freedy, K.; McDonnell, S.; Zangari, G. Improving photo-oxidation activity of water by introducing Ti3+ in self-ordered TiO2 nanotube arrays treated with Ar/NH3. J. Power Sources 2019, 414, 242–249. [Google Scholar] [CrossRef]
- Zhang, S.; Cao, S.; Zhang, T.; Lee, J.Y. Plasmonic Oxygen-Deficient TiO-x Nanocrystals for Dual-Band Electrochromic Smart Windows with Efficient Energy Recycling. Adv Mater. 2020, 32, e2004686. [Google Scholar] [CrossRef]
- Zuñiga-Ibarra, V.A.; Shaji, S.; Krishnan, B.; Johny, J.; Sharma Kanakkillam, S.; Avellaneda, D.A.; Martinez, J.A.A.; Roy, T.K.D.; Ramos-Delgado, N.A. Synthesis and characterization of black TiO2 nanoparticles by pulsed laser irradiation in liquid. Appl. Surf. Sci. 2019, 483, 156–164. [Google Scholar] [CrossRef]
- Xu, P.; Chang, X.; Liu, R.; Wang, L.; Li, X.; Zhang, X.; Yang, X.; Wang, D.; Lu, W. Boosting Power Conversion Efficiency of Quantum Dot-Sensitized Solar Cells by Integrating Concentrating Photovoltaic Concept with Double Photoanodes. Nanoscale Res. Lett. 2020, 15, 188. [Google Scholar] [CrossRef]
- Yin, Y.; Jiang, C.; Ma, Y.; Tang, R.; Wang, X.; Zhang, L.; Li, Z.; Zhu, C.; Chen, T. Sequential Coevaporation and Deposition of Antimony Selenosulfide Thin Film for Efficient Solar Cells. Adv Mater. 2021, 33, e2006689. [Google Scholar] [CrossRef]
- Wang, Z.; Yang, C.; Lin, T.; Yin, H.; Chen, P.; Wan, D.; Xu, F.; Huang, F.; Lin, J.; Xie, X. H-Doped Black Titania with Very High Solar Absorption and Excellent Photocatalysis Enhanced by Localized Surface Plasmon Resonance. Adv. Funct. Mater. 2013, 23, 5444–5450. [Google Scholar] [CrossRef]
- Yan, X.; Li, Y.; Xia, T. Black Titanium Dioxide Nanomaterials in Photocatalysis. Int. J. Photoenergy 2017, 2017, 8529851. [Google Scholar] [CrossRef] [Green Version]
- Yao, D.; Zhen, Y.; Zheng, L.; Chen, S.; Lü, W.; Xu, H. Laser-engineered black rutile TiO2 photoanode for CdS/CdSe-sensitized quantum dot solar cells with a significant power conversion efficiency of 9.1 %. Appl. Surf. Sci. 2023, 608, 155230. [Google Scholar] [CrossRef]
- Zhang, K.; Zhou, W.; Zhang, X.; Qu, Y.; Wang, L.; Hu, W.; Pan, K.; Li, M.; Xie, Y.; Jiang, B. Large-scale synthesis of stable mesoporous black TiO2 nanosheets for efficient solar-driven photocatalytic hydrogen evolution via an earth-abundant low-cost biotemplate. RSC Adv. 2016, 6, 50506–50512. [Google Scholar] [CrossRef]
- Galiyeva, P.; Rinnert, H.; Balan, L.; Alem, H.; Medjahdi, G.; Uralbekov, B.; Schneider, R. Single-source precursor synthesis of quinary AgInGaZnS QDs with tunable photoluminescence emission. Appl. Surf. Sci. 2021, 562, 150143. [Google Scholar] [CrossRef]
- Kim, S.K.; Raj, C.J.; Kim, H.J. CdS/CdSe quantum dot-sensitized solar cells based on ZnO nanoparticle/nanorod composite electrodes. Electron. Mater. Lett. 2014, 10, 1137–1142. [Google Scholar] [CrossRef]
- Jin, B.B.; Wang, Y.F.; Zeng, J.H. Performance enhancement in titania based quantum dot sensitized solar cells through incorporation of disc shaped ZnO nanoparticles into photoanode. Chem. Phys. Lett. 2016, 660, 76–80. [Google Scholar] [CrossRef] [Green Version]
- Feng, H.L.; Wu, W.Q.; Rao, H.S.; Wan, Q.; Li, L.B.; Kuang, D.B.; Su, C.Y. Three-dimensional TiO2/ZnO hybrid array as a heterostructured anode for efficient quantum-dot-sensitized solar cells. ACS Appl. Mater. Interfaces 2015, 7, 5199–5205. [Google Scholar] [CrossRef] [PubMed]
- Feng, H.L.; Wu, W.Q.; Rao, H.S.; Li, L.B.; Kuang, D.B.; Su, C.Y. Three-dimensional hyperbranched TiO2/ZnO heterostructured arrays for efficient quantum dot-sensitized solar cells. J. Mater. Chem. A 2015, 3, 14826–14832. [Google Scholar] [CrossRef]
- Xu, Y.F.; Wu, W.Q.; Rao, H.S.; Chen, H.Y.; Kuang, D.B.; Su, C.Y. CdS/CdSe co-sensitized TiO2 nanowire-coated hollow Spheres exceeding 6% photovoltaic performance. Nano Energy 2015, 11, 621–630. [Google Scholar] [CrossRef]
- Kim, S.K.; Son, M.K.; Park, S.; Jeong, M.S.; Prabakar, K.; Kim, H.J. Surface modification on TiO2 nanoparticles in CdS/CdSe Quantum Dot-sensitized Solar Cell. Electrochim. Acta 2014, 118, 118–123. [Google Scholar] [CrossRef]
- Raj, C.J.; Karthick, S.N.; Hemalatha, K.V.; Kim, H.J.; Prabakar, K. Highly efficient ZnO porous nanostructure for CdS/CdSe quantum dot-sensitized solar cell. Thin Solid Films 2013, 548, 636–640. [Google Scholar] [CrossRef]
- Seol, M.; Kim, H.; Tak, Y.; Yong, K. Novel nanowire array based highly efficient quantum dot-sensitized solar cell. Chem. Commun. 2010, 46, 5521–5523. [Google Scholar] [CrossRef] [Green Version]
- Kim, S.K.; Gopi, C.V.V.M.; Rao, S.S.; Punnoose, D.; Kim, H.J. Highly efficient yttrium-doped ZnO nanorods for quantum dot-sensitized solar cells. Appl. Surf. Sci. 2016, 365, 136–142. [Google Scholar] [CrossRef]
- Zhao, H.; Huang, F.; Hou, J.; Liu, Z.; Wu, Q.; Cao, H.; Jing, Q.; Peng, S.; Cao, G. Efficiency Enhancement of Quantum Dot Sensitized TiO2/ZnO Nanorod Arrays Solar Cells by Plasmonic Ag Nanoparticles. ACS Appl. Mater. Interfaces 2016, 8, 26675–26682. [Google Scholar] [CrossRef]


| Sample | Jsc (mA/cm2) | Voc (V) | FF | PCE (%) |
|---|---|---|---|---|
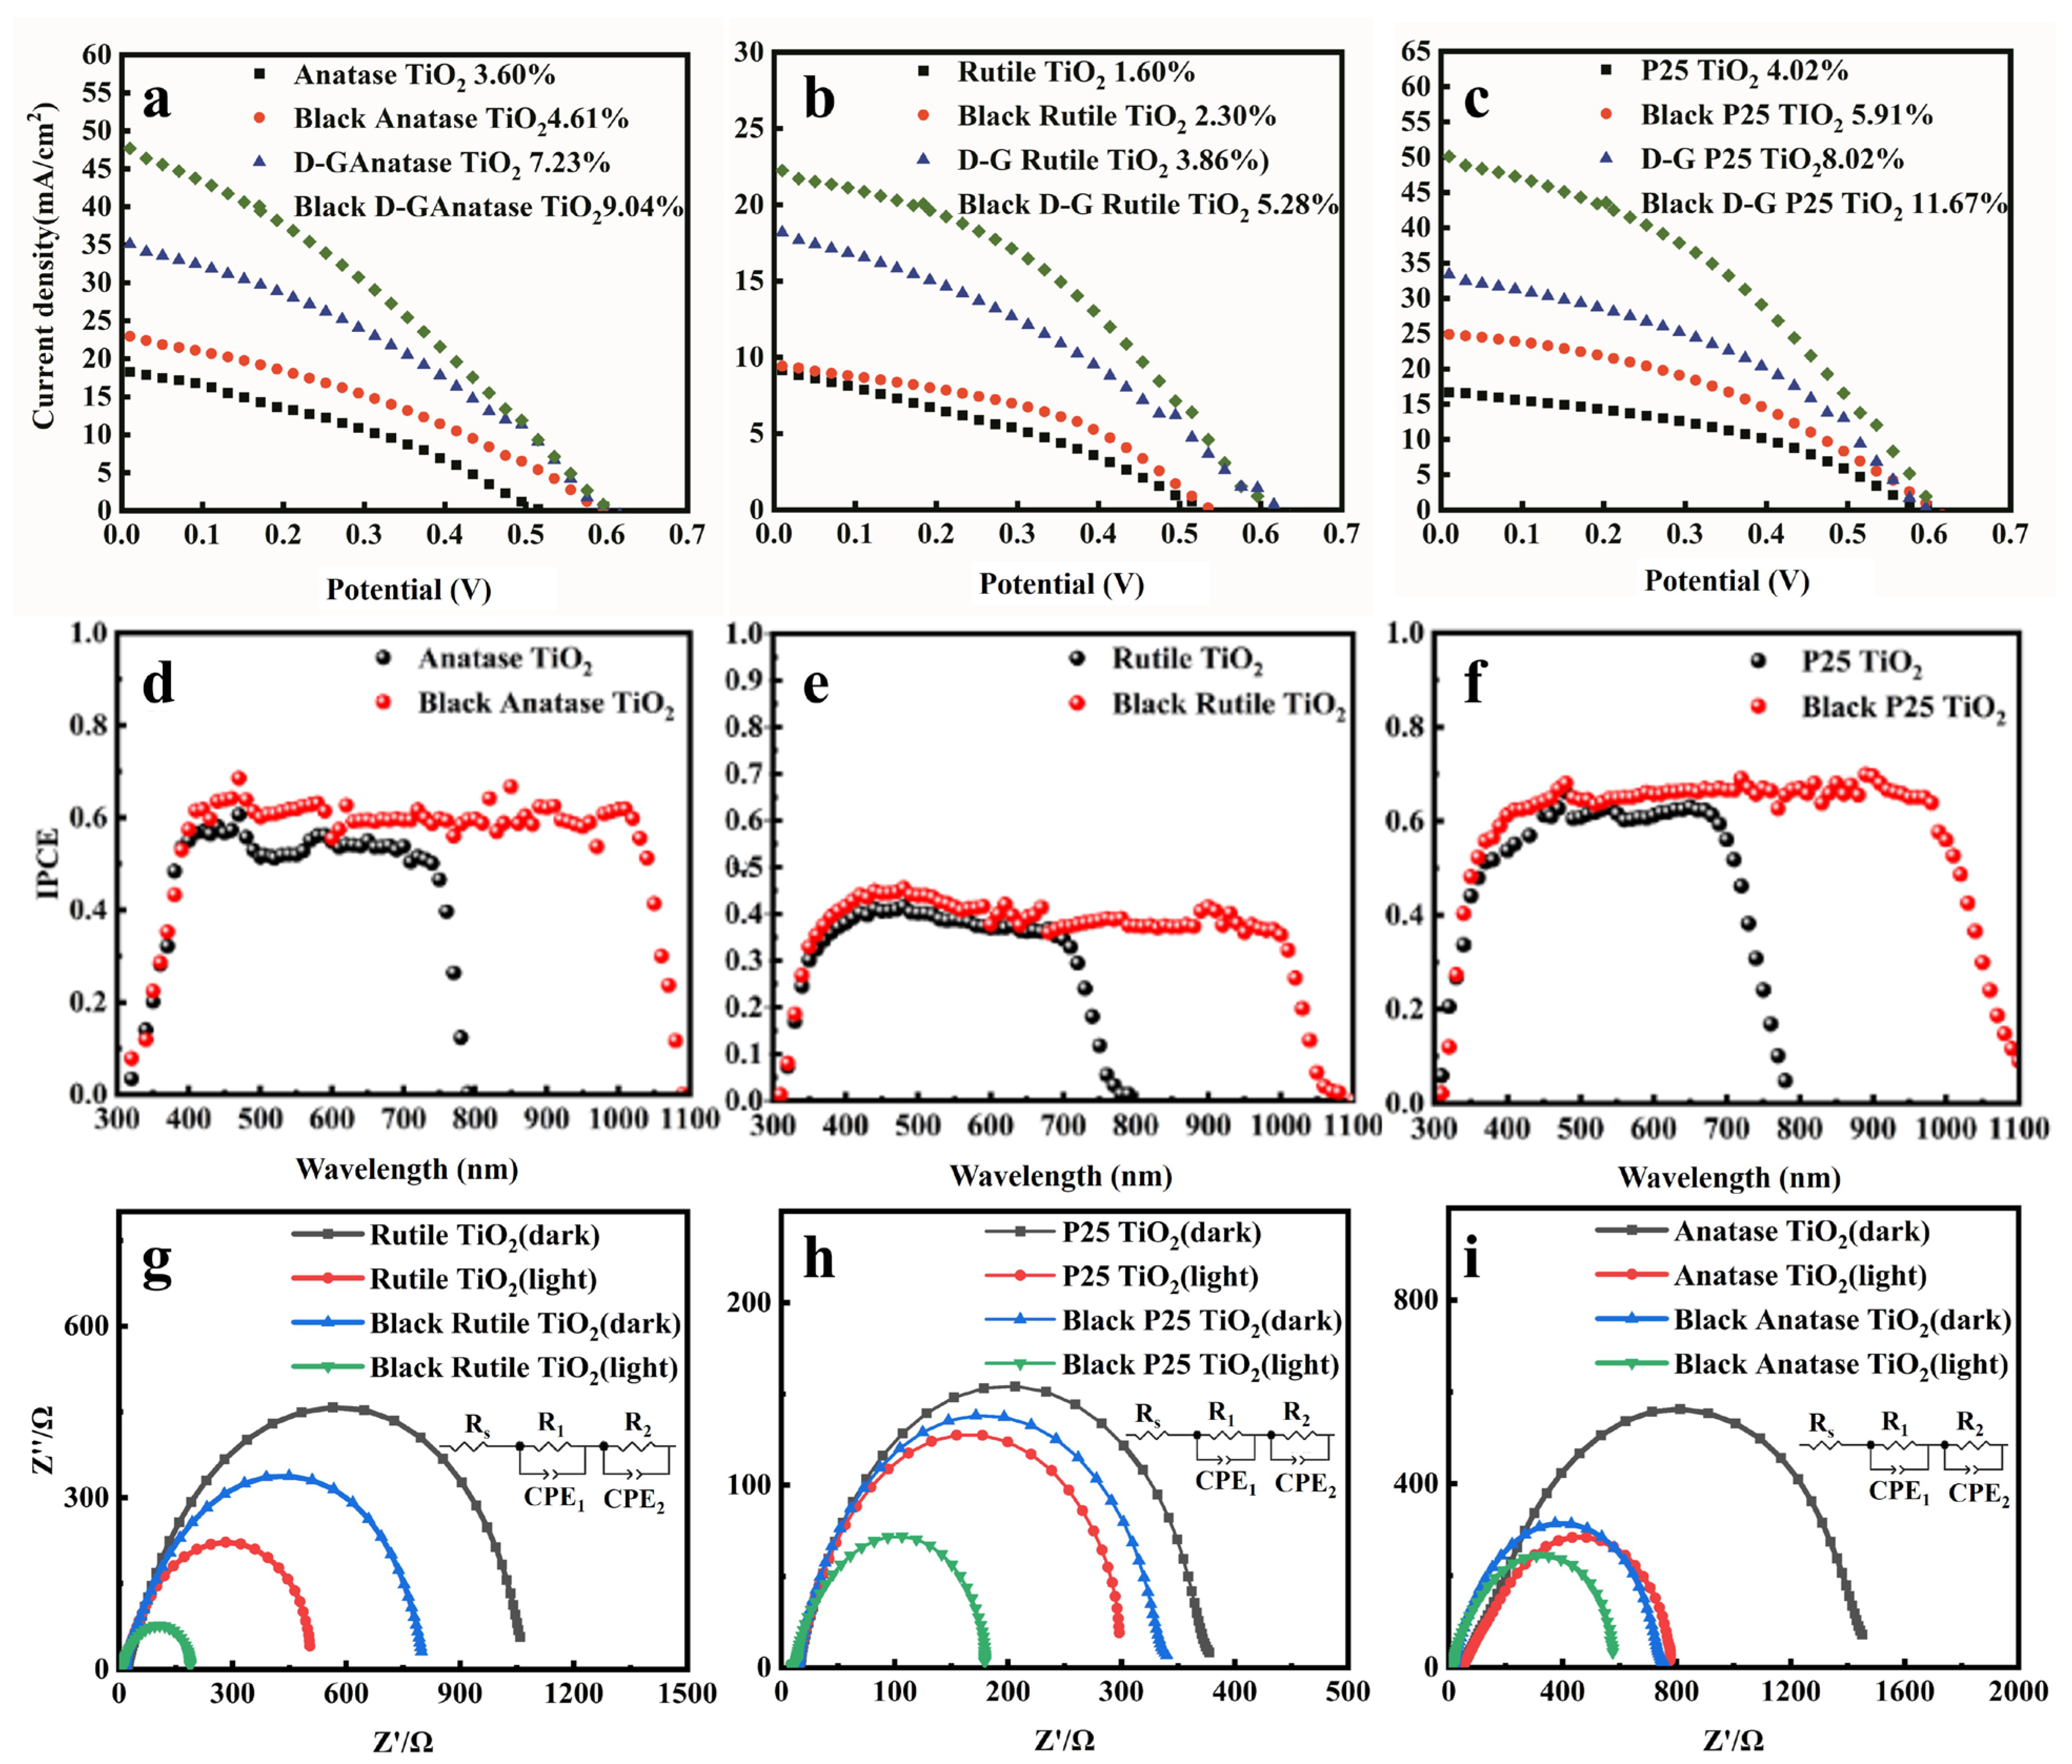
| Rutile TiO2 | 9.2 ± 0.2 | 0.510 ± 0.003 | 0.267 ± 0.001 | 1.6 ± 0.1 |
| Anatase TiO2 | 16.5 ± 0.2 | 0.569 ± 0.001 | 0.385 ± 0.003 | 3.6 ± 0.1 |
| P25 TiO2 | 16.6 ± 0.3 | 0.594 ± 0.002 | 0.403 ± 0.004 | 4.0 ± 0.1 |
| Black Rutile TiO2 | 12.1 ± 0.2 | 0.542 ± 0.003 | 0.379 ± 0.003 | 2.3 ± 0.1 |
| Black Anatase TiO2 | 22.9 ± 0.3 | 0.607 ± 0.002 | 0.341 ± 0.006 | 4.7 ± 0.1 |
| Black P25 TiO2 | 25.0 ± 0.3 | 0.616 ± 0.004 | 0.383 ± 0.008 | 5.9 ± 0.2 |
| D-A Rutile TiO2 | 18.2 ± 0.2 | 0.634 ± 0.002 | 0.345 ± 0.004 | 3.9 ± 0.2 |
| D-A Anatase TiO2 | 34.2 ± 0.3 | 0.616 ± 0.005 | 0.342 ± 0.006 | 7.2 ± 0.1 |
| D-A P25 TiO2 | 33.1 ± 0.4 | 0.602 ± 0.003 | 0.405 ± 0.005 | 8.0 ± 0.2 |
| D-A Black Rutile TiO2 | 22.1 ± 0.4 | 0.612 ± 0.006 | 0.398 ± 0.006 | 5.3 ± 0.2 |
| D-A Black Anatase TiO2 | 47.7 ± 0.4 | 0.607 ± 0.007 | 0.326 ± 0.008 | 9.1 ± 0.3 |
| D-A Black P25 TiO2 | 50.3 ± 0.4 | 0.619 ± 0.007 | 0.399 ± 0.007 | 11.7 ± 0.3 |
Publisher’s Note: MDPI stays neutral with regard to jurisdictional claims in published maps and institutional affiliations. |
© 2022 by the authors. Licensee MDPI, Basel, Switzerland. This article is an open access article distributed under the terms and conditions of the Creative Commons Attribution (CC BY) license (https://creativecommons.org/licenses/by/4.0/).
Share and Cite
Yao, D.; Hu, Z.; Zheng, R.; Li, J.; Wang, L.; Yang, X.; Lü, W.; Xu, H. Black TiO2-Based Dual Photoanodes Boost the Efficiency of Quantum Dot-Sensitized Solar Cells to 11.7%. Nanomaterials 2022, 12, 4294. https://0-doi-org.brum.beds.ac.uk/10.3390/nano12234294
Yao D, Hu Z, Zheng R, Li J, Wang L, Yang X, Lü W, Xu H. Black TiO2-Based Dual Photoanodes Boost the Efficiency of Quantum Dot-Sensitized Solar Cells to 11.7%. Nanomaterials. 2022; 12(23):4294. https://0-doi-org.brum.beds.ac.uk/10.3390/nano12234294
Chicago/Turabian StyleYao, Danwen, Zhenyu Hu, Ruifeng Zheng, Jialun Li, Liying Wang, Xijia Yang, Wei Lü, and Huailiang Xu. 2022. "Black TiO2-Based Dual Photoanodes Boost the Efficiency of Quantum Dot-Sensitized Solar Cells to 11.7%" Nanomaterials 12, no. 23: 4294. https://0-doi-org.brum.beds.ac.uk/10.3390/nano12234294