
A Fluorescent Nanosensor for Silver (Ag+) and Mercury (Hg2+) Ions Using Eu (III)-Doped Carbon Dots


Centro de Química Estrutural (CQE) and Institute of Molecular Science, Instituto Superior Técnico, Universidade de Lisboa, 1049-001 Lisboa, Portugal
*
Author to whom correspondence should be addressed.
Nanomaterials 2022, 12(3), 385; https://0-doi-org.brum.beds.ac.uk/10.3390/nano12030385
Submission received: 4 January 2022
/
Revised: 19 January 2022
/
Accepted: 21 January 2022
/
Published: 25 January 2022
(This article belongs to the Special Issue Optically Responsive Nanomaterials)
Abstract
:Carbon dots doped with Eu3+ ions (Eu-Cdots) were prepared by a hydrothermal treatment, using citric acid and urea as precursors and Eu (NO3)3 as a europium source. The Eu3+ ions are strongly coordinated with the carboxylate groups at the surface of the Cdots and incorporated within the nanographene network in the carbon core. Vibrational spectroscopy provides evidence of such interaction with identification of bands assigned to the stretching of the Eu-O bond. Eu3+ doped Cdots have larger diameters then undoped Cdots, but they are divided into smaller domains of sp2 carbon. The UV-vis excitation spectrum provides evidence of energy transfer from the Cdots to the Eu3+. The luminescence spectrum shows the characteristic sharp peaks of Eu3+ in the red part of the visible spectrum and a broad emission of Cdots centered at 450 nm. The luminescence of the Cdots is strongly quenched by Hg2+ and Ag+, but not by other cations. The quenching mechanism differs significantly depending on the nature of the ion. Both the blue emission of Cdots and the red emission of Eu3+ are quenched in the presence of Hg2+ while only the emission of the Cdots is affected by the presence of Ag+. A ratiometric sensor can be built using the ratio of luminescence intensities of the Cdots to the Eu3+ peaks.
1. Introduction
Carbon dots (Cdots) are a new class of carbon nanomaterials with interesting optical properties, such as high emission yields, excitation wavelength dependent emission, and high photostability. When combined with secondary properties, such as low toxicity, chemical stability, and water solubility, this makes them uniquely suited for applications in bioimaging, sensing, nanomedicine, catalysis, lightning, and photonics [1,2,3,4,5,6]. Cdots can be easily prepared by top–down and bottom–up approaches using low-cost and environmentally-friendly materials. Moreover, their physicochemical properties can be controlled and tuned by doping, surface passivation and functionalization. The photoluminescence of Cdots can be employed to build optical sensors for metal cations (e.g., Fe3+, Cu2+, Ag+, Hg2+, Pb2+), anions (e.g., NO2−, S2−, Cl−, P2O74−), and molecular species (e.g., amino acids, vitamins, carbohydrates) [7]. Generally, the carbon dots need to be doped or appropriately functionalized to probe selectively the specific analyte. In many cases the analyte induces the quenching of the fluorescence (turn-off), while in others the fluorescence can be enhanced (turn-on) by suppressing the quenching or by generating new fluorescent species. A typical example of a turn-off-on mechanism is that of the detection of pyrophosphates (P2O74−) by nitrogen-doped carbon dots in the presence of Eu3+. The Eu3+ ions initially linked to the surface groups of Cdots suppress the luminescence, which is restored in the presence of P2O74− due to the higher affinity of Eu3+ to the pyrophosphates than to the carboxylic and amido groups onto the surface of the Cdots [8].
Silver is a very toxic heavy metal generated in diverse activities like electronics, photography, and pharmaceutics. To meet the demand for simple and fast determination of Ag+ in aquatic environments and organisms, both turn-on and turn-off Cdots based sensors have been proposed [9,10,11,12,13,14,15,16,17,18]. The sensing mechanism remains quite elusive, with the fluorescence quenching by Ag+ being explained by complexation via the carboxylic [11], and the oxygen/nitrogen containing surface groups of Cdots [14], or the enhanced interactions with S; S, N, and N, F-doped Cdots [12,13,18], and also the coordination reaction between C=N surface groups of formamide-bases of N-doped Cdots and Ag+ [16,17]. The fluorescence enhancement of the Cdots in the presence of Ag+ has been attributed to the formation of silver clusters and/or complexation of silver ions by amines at the surface of the Cdots [9,10]. The amine and/or phenol hydroxyl groups on the surface of Cdots were shown to be able to reduce Ag+ to elemental Ag (0) with the formation of silver nanoparticles detected by resonance light scattering [19].
Only a few Ag+ ratiometer sensors were proposed until now [17,20,21]. One of them uses, as a sensor, formamide-derived N-doped Cdots encapsulated in the cavities of Eu (III)-based metal-organic frameworks (Eu-MOFs). The Cdots luminescence is quenched by Ag+, while the Eu3+ emission remains almost constant, working as an internal standard [17]. An alternative approach is the use of a mixture of Cdots and o-phenylenediamine [20]. The addition of Ag+ to the mixture oxidizes the non-fluorescent o-phenylenediamine to the fluorescent 2,3-diaminophenazine by the reduction of Ag+ to Ag (0). The emission of Cdots is then quenched by energy transfer to diaminophenazine resulting in the increase of the fluorescence intensity ratio of diaminophenazine to Cdots. In addition, a dual emitting nanohybrid composed of Si,N-co-doped carbon dots and N-acetyl-L-cysteine-capped CdTe quantum dots was proposed as an Ag+ ratiometric sensor based on the quenching of the quantum dots luminescence by Ag+ and using as internal standard the Cdots fluorescence that remain almost constant [21].
The mercury cation (Hg2+) can be released into the environment through a variety of anthropogenic and natural sources. The Hg2+ is a potent neurotoxin that can cause severe damage to the central nervous system and interfere with mitochondrial activity [22,23]. Several analytical techniques have been used to detect Hg2+, those based on Cdots fluorescence quenching being very appealing due to their rapid response, high sensitivity, and low cost [24,25,26,27,28]. To increase selectivity, the Cdots surface has been engineered to inhibit the interference of other metal ions that bind to surface functional groups and thymine-rich DNA was covalently linked to the surface to specifically recognize the mercury ions [27]. An alternative strategy used a Tb3+-Cdots/3-aminophenylboronic acid hybrid with dual emission from the Cdots and the Tb3+ ion to detect simultaneously NO2− and Hg2+ in environmental water [28]. The 3-aminophenylboronic acid coordinates with Hg2+ that quenches selectively the Cdots emission by electron transfer, while the emission of Tb3+ remains unchanged. NO2− is detected by the quenching of the Tb3+ luminescence by electron transfer to NO2−, while the emission of the Cdots remains unaffected.
The aim of these work is to develop a fluorescent nanosensor for Ag+ and Hg2+ ions using Eu3+ doped Cdots (Eu-Cdots). The Eu3+ ion was chosen among other lanthanide dopants because it is a well-known red light-emitter with high adsorption energy and low diffusion barrier when adsorbed in graphene compared to other lanthanides [29]. The emission of the Eu-Cdots is composed of a broad emission of the Cdots in the blue (450 nm) and the characteristic narrow bands of the red emission of Eu3+ ions (>590 nm). The broad emission of the Eu-Cdots is quenched by both cations with a significantly higher efficiency compared to pristine Cdots. The Eu3+ emission of the Eu-Cdots is quenched by Hg2+ but not by Ag+, which can be used to distinguish the two metals. Furthermore, the invariance of the Eu3+ emission in the presence of Ag+ can be used as an internal standard to build a ratiometer Ag+ sensor by measuring the ratio of emission intensities of the Cdots band to the Eu3+ peak at non-overlapping wavelengths. This sensor has de advantage of being non-toxic as the quantum dots are considerably more photostable than alternative sensors based on organic fluorophores.
2. Materials and Methods
2.1. Materials
All chemicals used were of analytical pure grade. Citric acid (99.5%), urea (99.5%), and Eu (NO3)3 (99.9%)) were purchased from Sigma Aldrich (Darmstadt, Germany).
2.2. Methods
The linear absorption spectra were recorded in a JASCO V-540 spectrophotometer (Cremella, LC, Italy). The fluorescence spectra were recorded using a HORIBA Jobin Yvon Fluorolog 3–22 Spectrofluorometer (Kyoto, Japan) with a 450 W xenon lamp. Typically, the optical properties were measured in solutions of 0.3 g/L of Cdots, 3 g/L of Eu (NO3)3, 0.8 g/L of Eu-Cdots and a mixture of Cdots plus Eu3+ in water containing 3 g/L of Eu (NO3)3 and 0.03 g/L of Cdots. For the metal titrations, stock solutions of the metals (1–3 mM) were prepared directly in the dispersions of Eu-Cdots, Cdots or Cdots + Eu3+ mixture and added systematically directly into quartz cuvettes containing 3 mL of the corresponding dispersions without the metals. This procedure avoids dilution of the dispersion during titration. The fluorescence quantum yields were determined by the reference method using coumarin 153 in ethanol (ΦF = 0.38, λem = 410–470 nm) [30]. The fluorescence decay curves were recorded at 450 nm by the Single-Photon Timing technique under excitation at 330 nm using a multichannel analyzer working with 1024 channels and time scales of 68.36 ps/channel (Eu-Cdots + Hg2+) and 29.30 ps/channel (Cdots, Eu-Cdots and Eu-Cdots + Ag+). The excitation source was the second harmonic of a Coherent Radiation Dye laser 700 series (laser dye DCM, 610–680 nm, 130 mW, 5 ps, 4 MHz). The emission was collected at the magic angle relative to the vertical polarized excitation and selected by a Jobin Yvon HR320 monochromator (HORIBA Jobin Yvon, Inc., Kyoto, Japan). The instrument response function for deconvolution (35–80 ps FWHM) was recorded using a scattering dispersion of colloidal silica in water. The FTIR spectra were recorded in KBr pellets (Aldrich, 99%, FT-IR grade) using a Mattson 7000 FT-IR spectrometer (Madison, WI, USA) by accumulating 256 interferograms with a resolution of 8 cm−1. Raman characterization was carried out by unpolarized Raman microscopy (HORIBA LabRAM HR 800 Evolution (Kyoto, Japan) using a 532 nm diode laser delivering 10 mW at the sample position and a 600 groves per mm grating. Data were collected in the range of 900–1800 cm−1 with a resolution of 4 cm−1 using only 10–20% of the laser power, with acquisition times of 20 s and 20 accumulations using either 50× or 100× objective lenses. Transmission electron microscopy (TEM) images were obtained on a Hitachi transmission electron microscope (Model H-8100 with a LaB6 filament) (Tokyo, Japan) with an acceleration voltage of up to 200 kV. One drop of the dispersion of the Cdots in water was deposited on the TEM grid (ultrathin carbon grid on a lacey carbon support film, 400 mesh (PELCO®, Fresno, CA, USA) and dried under a flow of nitrogen. The images were processed with the open-source Fiji software to calculate the size distribution plots from the Feret diameter.
2.3. Synthesis of Doped and Undoped Cdots
The Eu-Cdots were synthesized by the hydrothermal method. Briefly, 0.4 g of citric acid, 0.4 g of urea and 0.3 g of Eu (NO3)3 were dissolved in 10 mL Milli-Q water. The mixture was transferred into a 50 mL Teflon-lined stainless-steel autoclave where it was heated at 160° for 12 h. The final product was centrifuged at 15,000 rpm during 5 min (three times) to remove the solid contents. The supernatant was diluted in 10 mL of water and dialyzed using a 1 kDa dialysis bag of cellulose acetate (standard grade membrane of regenerated cellulose, Spectra/PorTM, Spectrum™ 132638, Thermo Fisher Scientific, Waltham, MA, USA) against deionized water for 8 to 12 days, until no color could be observed in the dialysate. This procedure is used to remove the molecular products present alongside the Cdots and uncomplexed Eu3+ in solution. Upon dialysis, the solid Eu-Cdots were collected by lyophilization. For the preparation of control Cdots without Eu3+, a similar procedure was followed with no addition of Eu (NO3)3 to the reaction mixture. On average, the overall yield of the process is only 1.0–2.0 wt% for both procedures.
3. Results and Discussion
3.1. Structural and Morphological Characterization
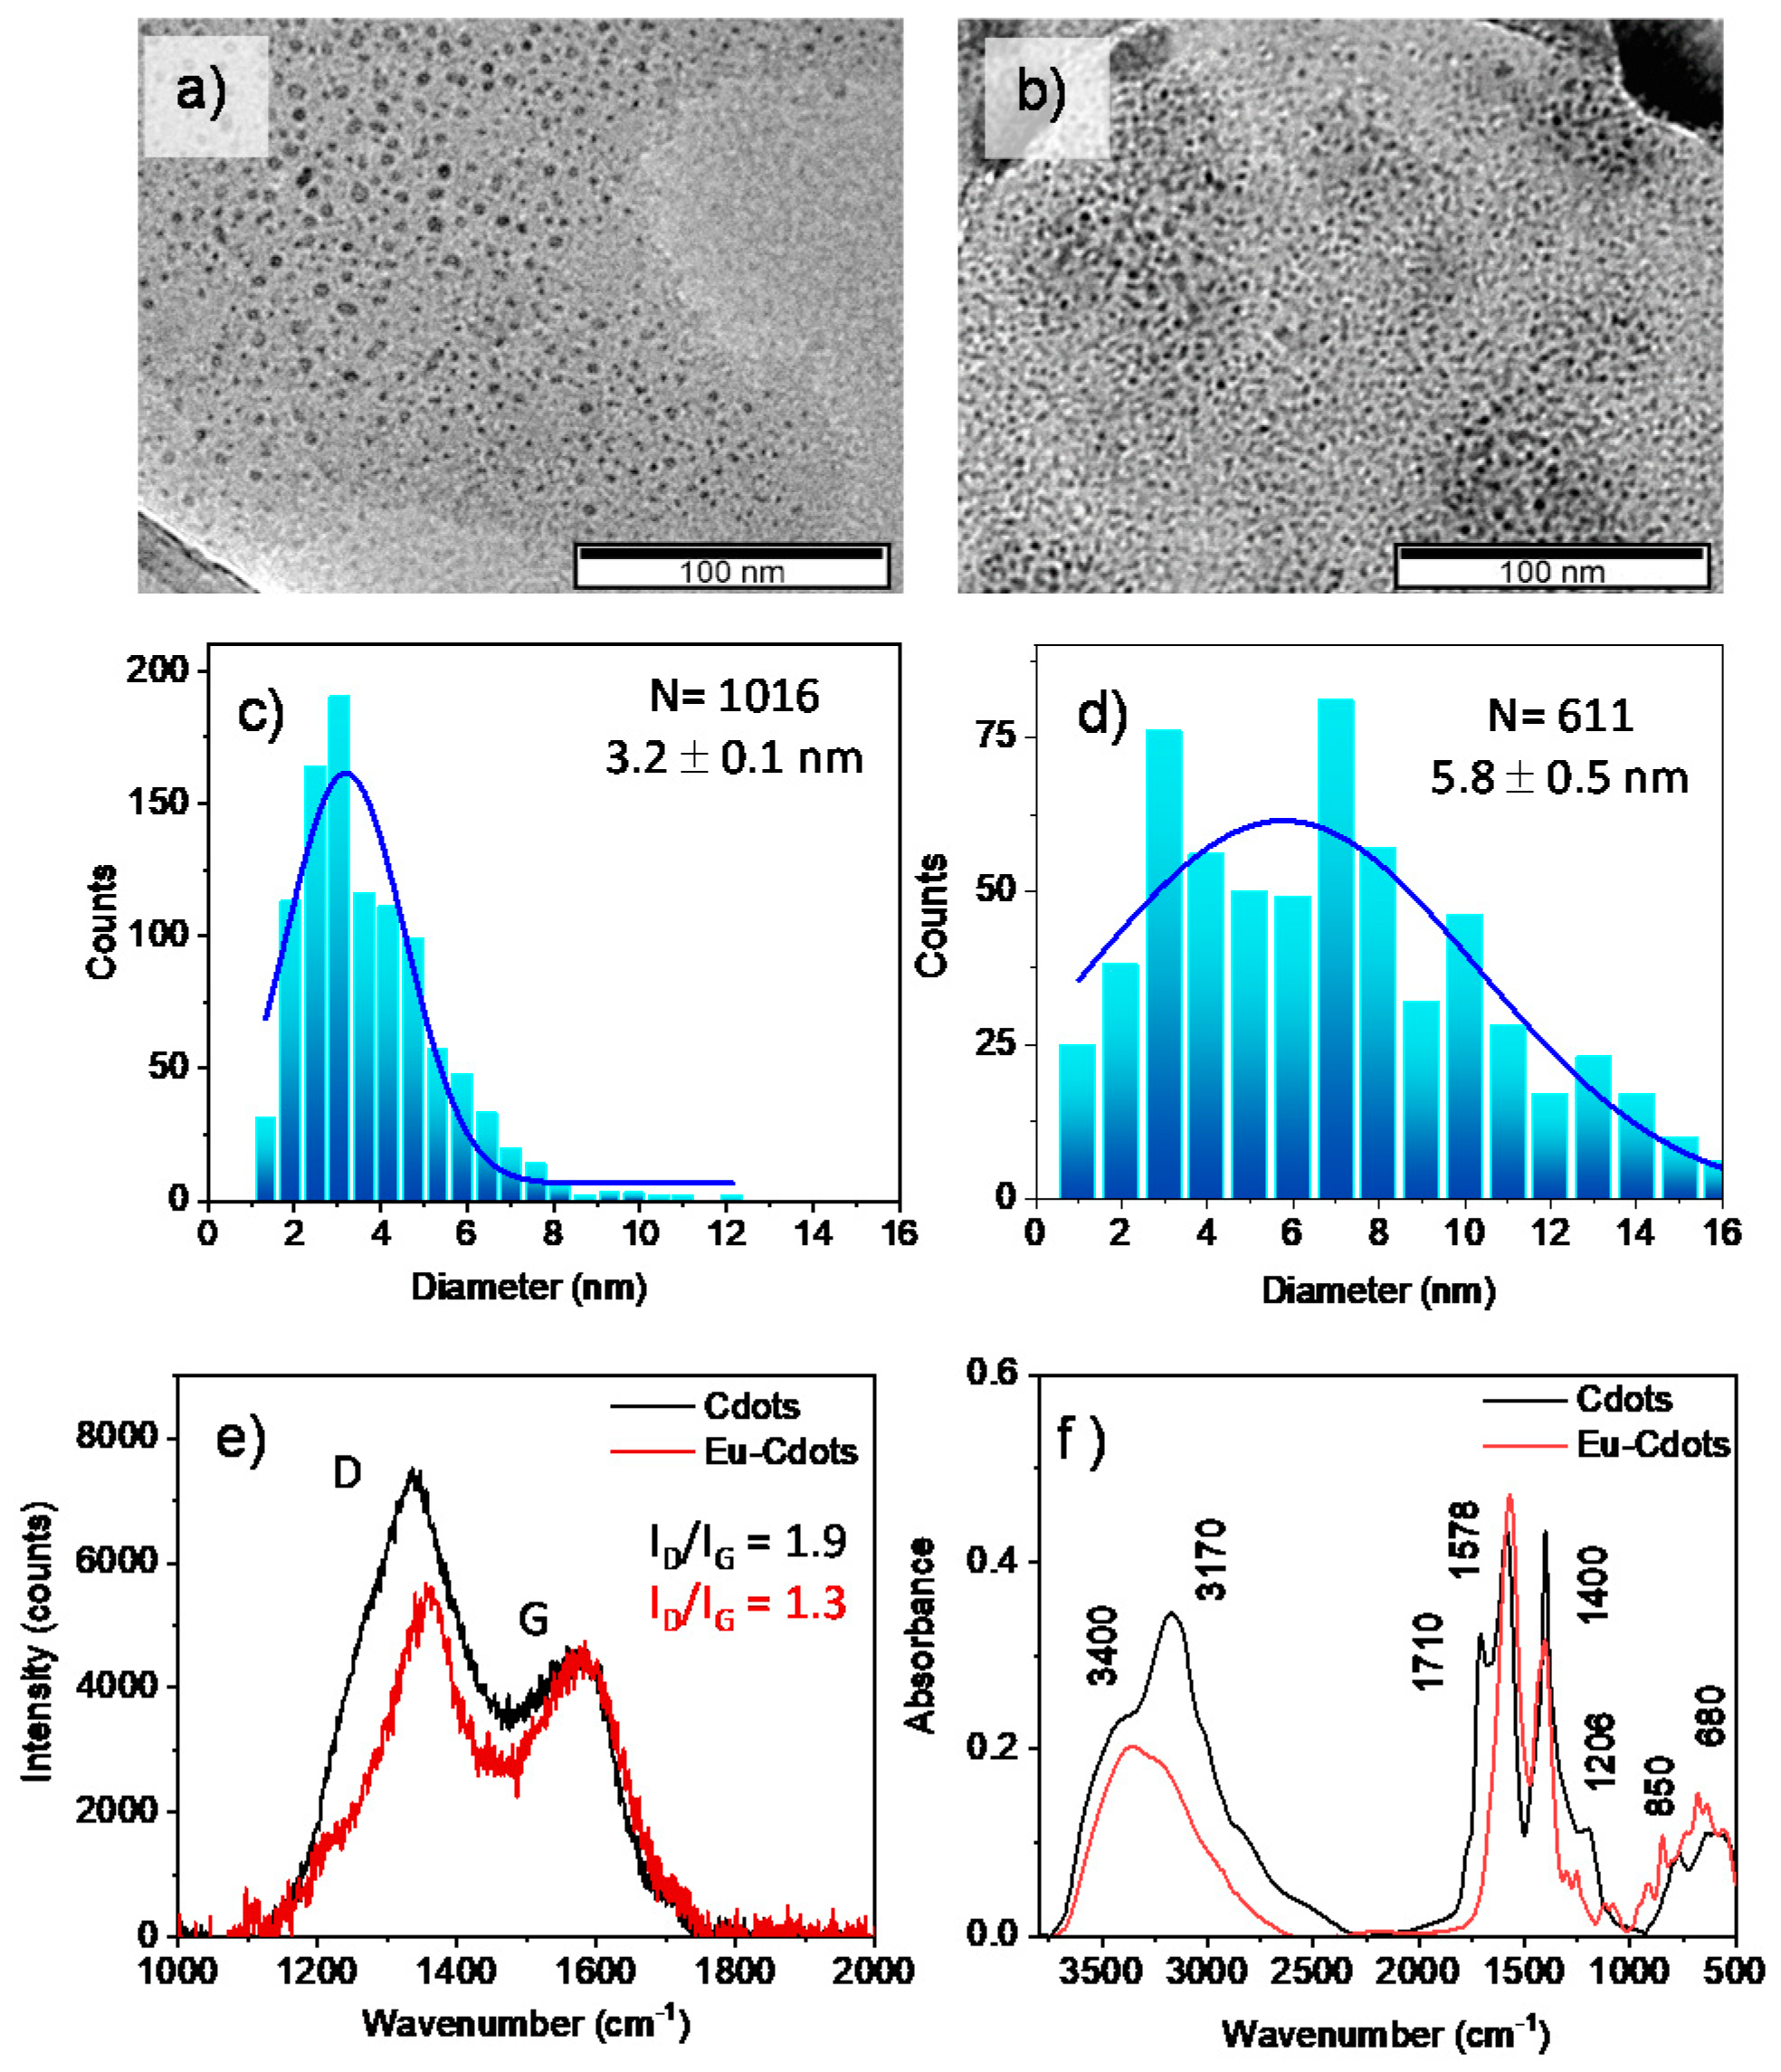
Europium doped Cdots where prepared by a hydrothermal process at 160 °C for 12 h using citric acid, urea and Eu (NO3)3 as a source of carbon, nitrogen, and europium, respectively. Undoped Cdots were prepared following the same procedure in the absence of europium salt. The TEM images of the Eu-Cdots and the Cdots are shown in Figure 1, together with the Raman and FTIR spectra.
The size distribution of Cdots, with an average diameter of 3.2 ± 0.1 nm (Figure 1c), is typical of the synthesis by the bottom-up procedure. The size distribution of the Eu-Cdots (Figure 1d) is broader with a larger average diameter centered at 5.8 ± 0.5 nm. Similar findings were reported recently for Eu-Cdots with an incorporation of Eu3+ of the order of 6% (w/w) [31]. The increase in size was attributed to the incorporation of the Eu3+ ions in the Cdots with a concomitant increase in the disorder induced in the carbon network for high percentages of Eu3+, as confirmed by both Raman and X-ray diffraction. The Raman spectra of the Cdots and Eu-Cdots shown in Figure 1e) confirms that there was a slight increase in the disorder of carbon network upon incorporation of Eu3+ ions. The Raman spectra is dominated by the characteristic D and G bands of graphitic materials. The D band at 1347 cm−1 (Cdots) and 1360 cm−1 (Eu-Cdots) is attributed to the sixfold breathing mode of the aromatic rings, and the G band at 1576 cm−1 (Cdots) and 1579 cm−1 (Eu-Cdots) is attributed to the in-plane bond-stretching motion of pairs of sp2 carbon atoms [32,33]. The ID/IG integrated intensity ratio was estimated to be 1.9 for the Cdots and 1.3 for the Eu-Cdots. This ID/IG of the Eu-Cdots is slightly larger than the values reported for Eu decorated graphene (1.02) [34] and three-dimensional europium-complexed with reduced graphene oxide (1.05) [35]. Within the amorphous carbon regime, characterized by an ID/IG increasing with the square of the diameter of the sp2 cluster, the Eu-Cdots appear to have a smaller cluster diameter than the Cdots [32]. The average cluster size, estimated using the Ferrari and Robertson relationship for amorphous carbon, [32] is 1.9 nm for the Cdots and 1.6 nm for the Eu-Cdots. The average cluster size for the Cdots is closer to the average diameter of the Cdots estimated by TEM (~3 nm) suggesting that these dots are largely constituted by a pristine core of sp2 carbons. In contrast, the Eu-Cdots have an average sp2 cluster size that is more than three times smaller than their overall diameter estimated by TEM (5.8 nm). The Raman data suggests a mechanism of formation of the Eu-Cdots that involves a nucleation step induced by coordination of citric acid and urea to Eu3+ in solution followed by the typical dehydration and condensation steps that make the sp2 network grow around the nucleation center. Thus, we expect that Eu3+ is incorporated inside the carbon network in Eu-Cdots, as well as coordinated with suitable functional groups at the edge of the Cdots.
The FTIR spectra of both Cdots and Eu-Cdots (Figure 1f) show the characteristic broad absorption band centered at 3400 cm−1 due to the stretching of the OH (νOH) of the carboxylic and/or hydroxyl groups. Adsorbed water at the surface of Cdots might also contribute to this broad absorption band. What are also common to both materials are the C=C stretching (νC=C) of the sp2 clusters in the core at ca. 1578 cm−1, and the highly coupled COH bending (δCOH) and C-O stretching (νC-O) modes that usually give two characteristic bands with variable relative intensity at ~1400 cm−1 and ~1200 cm−1 [36]. Most importantly, the relatively sharp and intense band of the C=O stretching (νC=O) of the carbonyl group observed at 1709 cm−1 in the Cdots is absent in the Eu-Cdots. This observation suggests that in Eu-Cdots the Eu3+ is coordinated via the oxygen atom of the carbonyl and carboxylate groups. The asymmetric and symmetric O-C-O stretching bands of carboxylates coordinated with Eu3+ appears at lower wavenumbers, ca 1575 cm−1 (νOCOas) and 1400 cm−1 (νOCOs). The former overlaps with the νC=C mode at 1578 cm−1. In addition, several sharp features appear in the 600–900 cm−1 spectral region of Eu-Cdots (ca 680 cm−1 and 850 cm−1) previously associated with Eu-O vibrational modes due to covalent coordination of Eu with oxygen [37].
What is also noteworthy is the absence in the Eu-Cdots of the band observed at 3175 cm−1 in the Cdots that we assign to the symmetric N-H stretching (νNH2,s) of amides. In addition, in the amide I (1700–1650 cm−1) and amide II (1600–1550 cm−1) region, Eu-Cdots show a relatively uncomplicated spectra with only one broad band peaking at 1578 cm−1 that, as discussed above, is likely to have a contribution from both the νC=C and νO-C-Oas. Conversely, a closer look at the complex envelop of bands observed in the Cdots in this region allows us to identify contributions at 1667 and 1635 cm−1 that could be due to the strong amide I and amide II bands. The absence of the amide bands in Eu-Cdots indicate that the incorporation of nitrogen in Eu-Cdots is lower than in the Cdots. This observation is further confirmed by the XPS data shown in Figure 2.
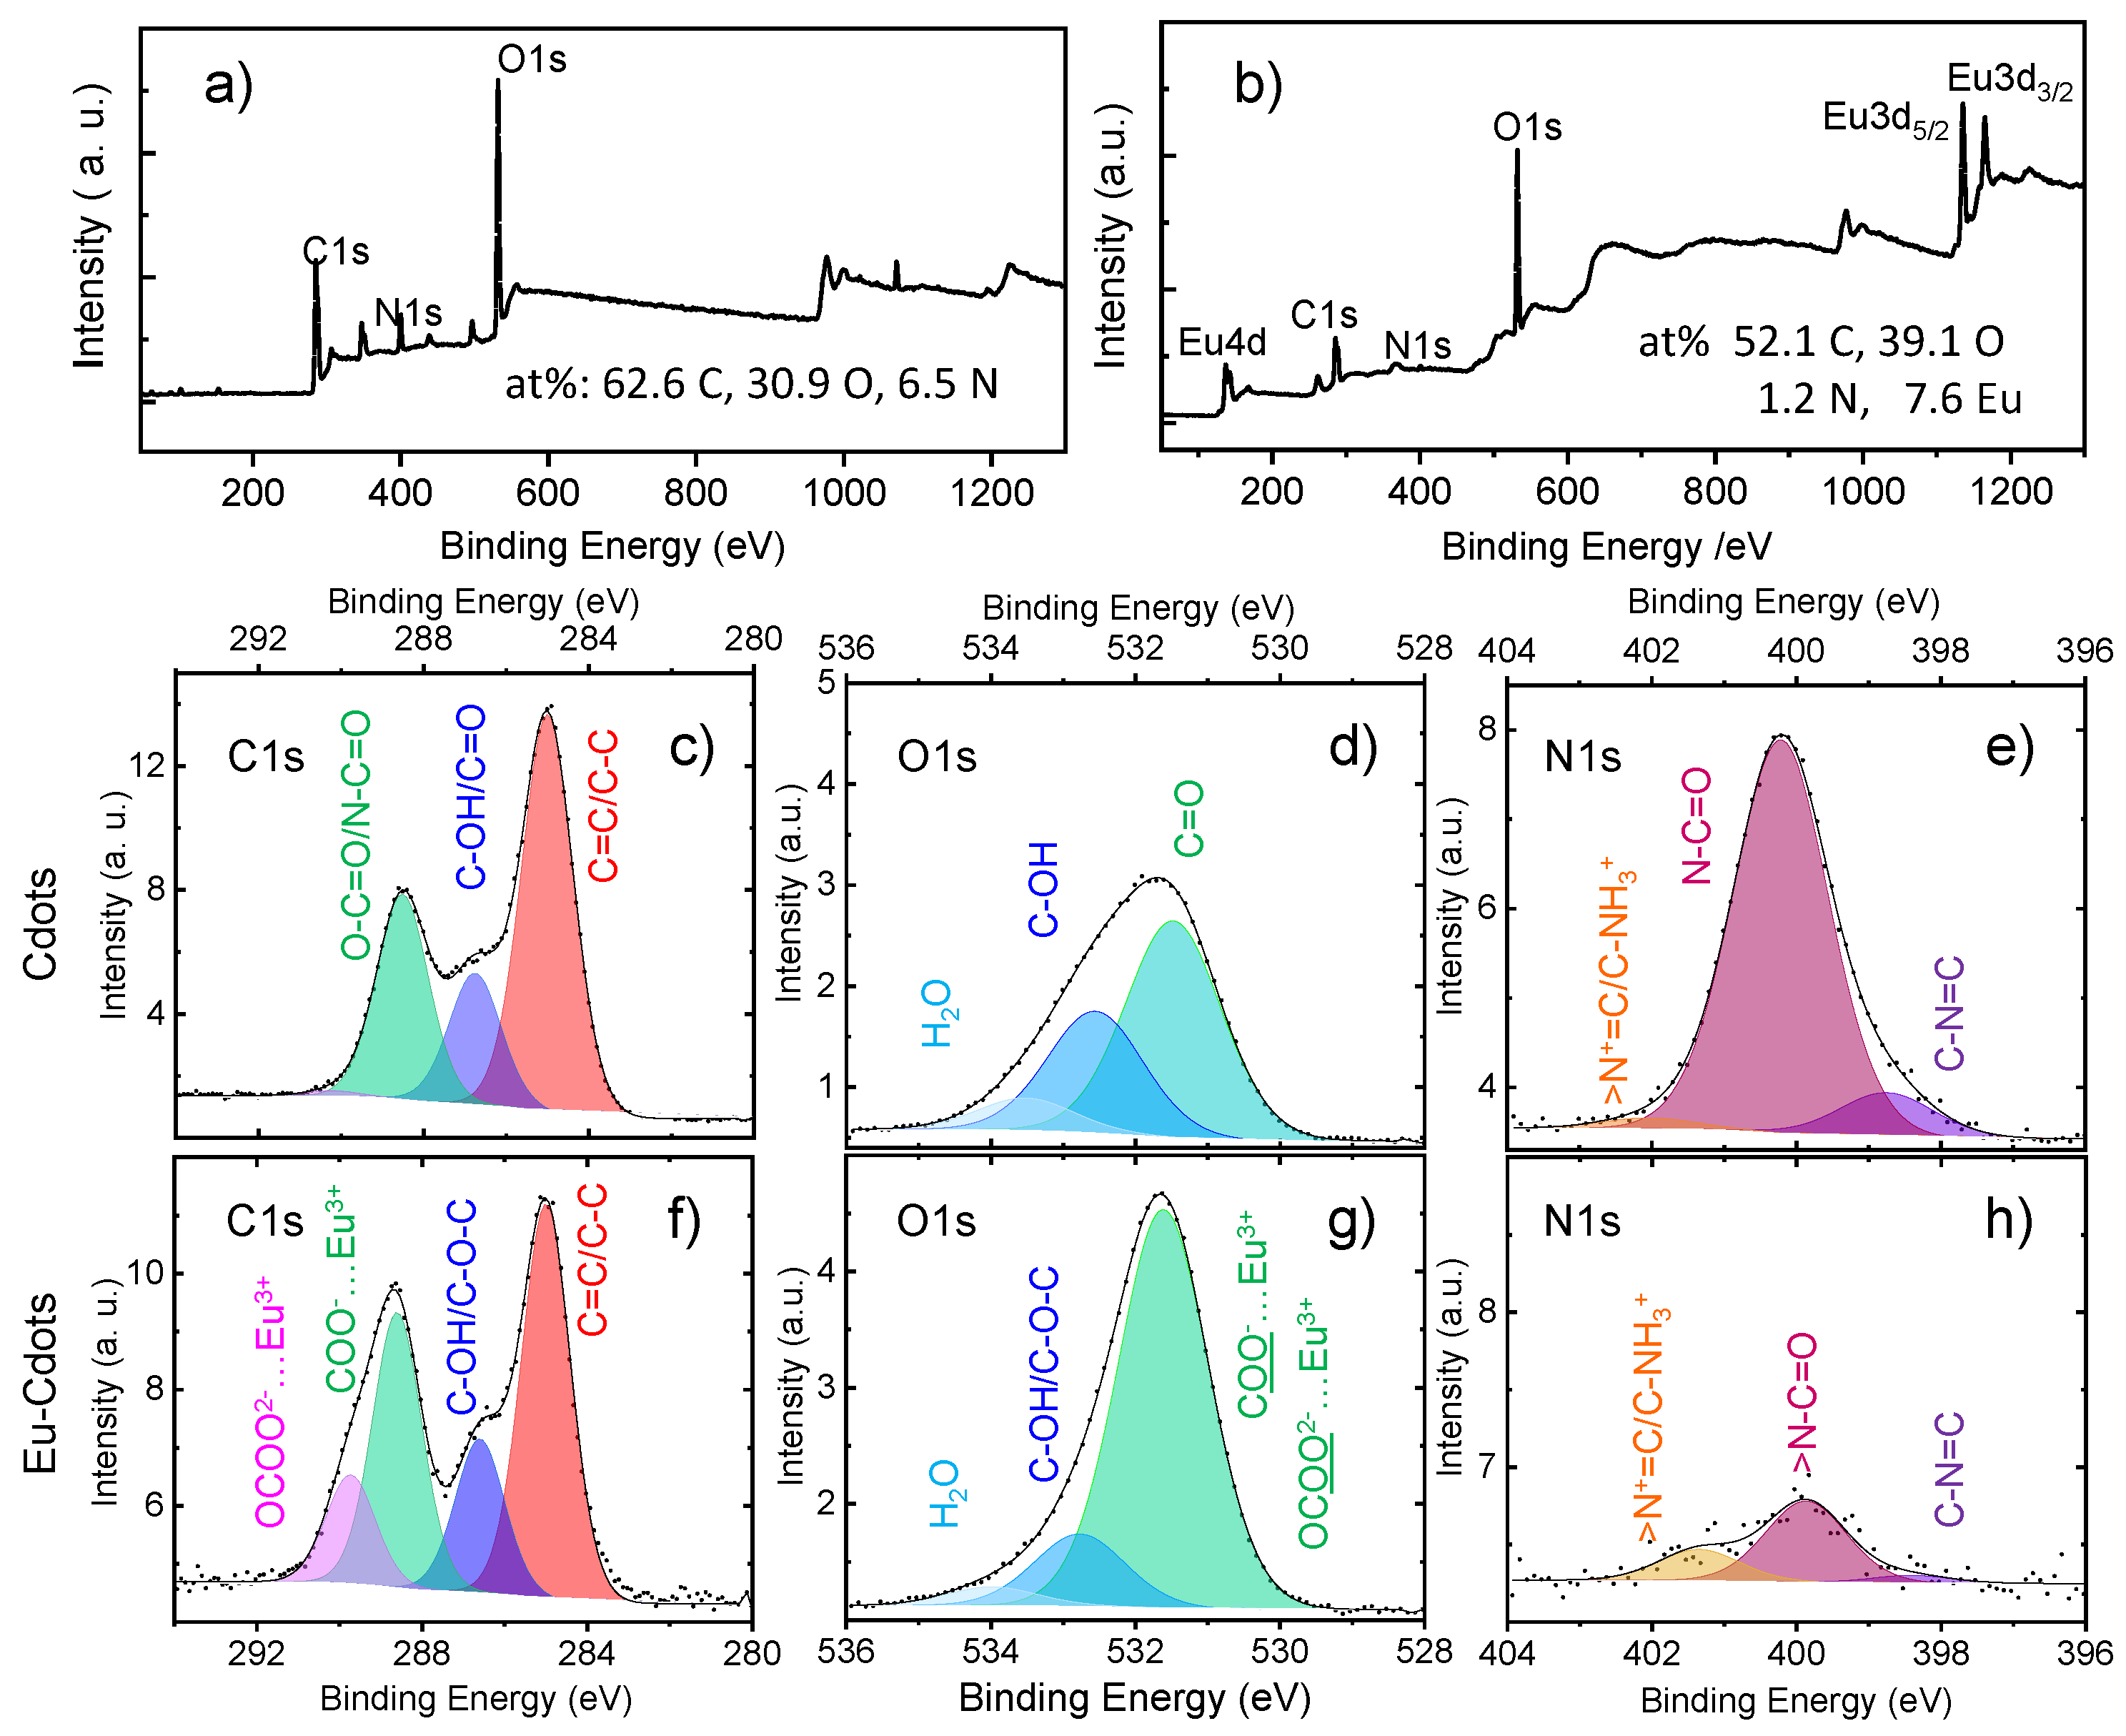
The XPS spectrum of Eu-Cdots (Figure 2b) shows the peaks characteristic of Eu3+ at 1135 eV (Eu3d5/2), 1165 eV (Eu3d3/2), and 137 eV (Eu 4d) in addition to the peaks of C1s, N1s, and O1s around 285, 400, and 532 eV, also present in the Cdots (Figure 2a). The atomic percentages calculated based on the area of the peaks are indicated in Figure 2. The results show that the Eu-Cdots have a higher percentage of oxygen and a lower percentage of nitrogen (39.1% O and 1.2% N) than the Cdots (30.9% O and 7.6% N) that we attribute to the high affinity of Eu3+ to the carboxylic groups of citric acid and carbonyl groups of urea favoring the retention of oxygen during the formation of the carbon network.
The high resolution C1s band in Eu-Cdots (Figure 2f) can be deconvoluted in four peaks, with binding energies at: 285.0 eV due to C=C/C-C; 286.6 eV due to hydroxyl (C-OH) and epoxy (C-O-C); 288.6 eV attributed to carboxylate (COO−) and the peak at 289.7 eV due to carbon in a more electronegative chemical environment, such as in the carbonate ion (CO32−) [38,39]. Many of these carboxylates and carbonates are likely to be coordinated with Eu3+. In the C1s region, the major difference between the XPS spectra of doped and undoped dots is the significant decrease of the carbonate band in the Cdots (Figure 2c). The peaks at 286.8 eV and 288.6 eV are relatively unaffected by the coordination with Eu3+, because in the Cdots these bands have a smaller contribution from COO− and C-O-C, but they include a contribution from N-C=O and C=O, respectively. Table S1 in Supplementary Materials collects the contribution of each band to the high-resolution spectra in each region. Due to the high number of oxygenated species at the surface of the Cdots and Eu-Cdots, with a strong contribution from carboxylates in both, and carbonates in Eu-Cdots, a negative surface charge can be inferred in both cases.
The O1s spectra of both Cdots and Eu-Cdots can be deconvoluted in three peaks. In Eu-Cdots (Figure 2g), the intense peak at 531.6 eV is attributed to the two equivalent oxygens of carboxylate and carbonate ions, some of which will be coordinated with Eu3+. The peak at 532.8 eV is due to the C-O-C of the carboxylate and the C-OH. At higher binding energies, we find a minor contribution from adsorbed water. In the Cdots (Figure 2d), the most intense band is due to the C=O from amides and carboxylic acids at binding energies of 531.5 eV, the COH peaks at 532.6 eV, and there is also a contribution from adsorbed water at higher energies [40].
The N1s spectrum of Cdots can be deconvoluted in three peaks with the major contribution from sp3 N at 400.2 eV (amides). Smaller contributions from sp2 N at 398.8 eV and quaternary N at 402.0 eV are also observed. The same three contributions, albeit with different relative intensities, can be found in Eu-Cdots, which have a considerably lower amount of nitrogen.
3.2. Optical Properties
Figure 3 shows the UV-vis absorption and the luminescence spectra of the Eu-Cdots and compares it with data for isolated Cdots and Eu (NO3)3 and a mixture of Cdots and Eu (NO3)3 in water (Cdots + Eu3+).
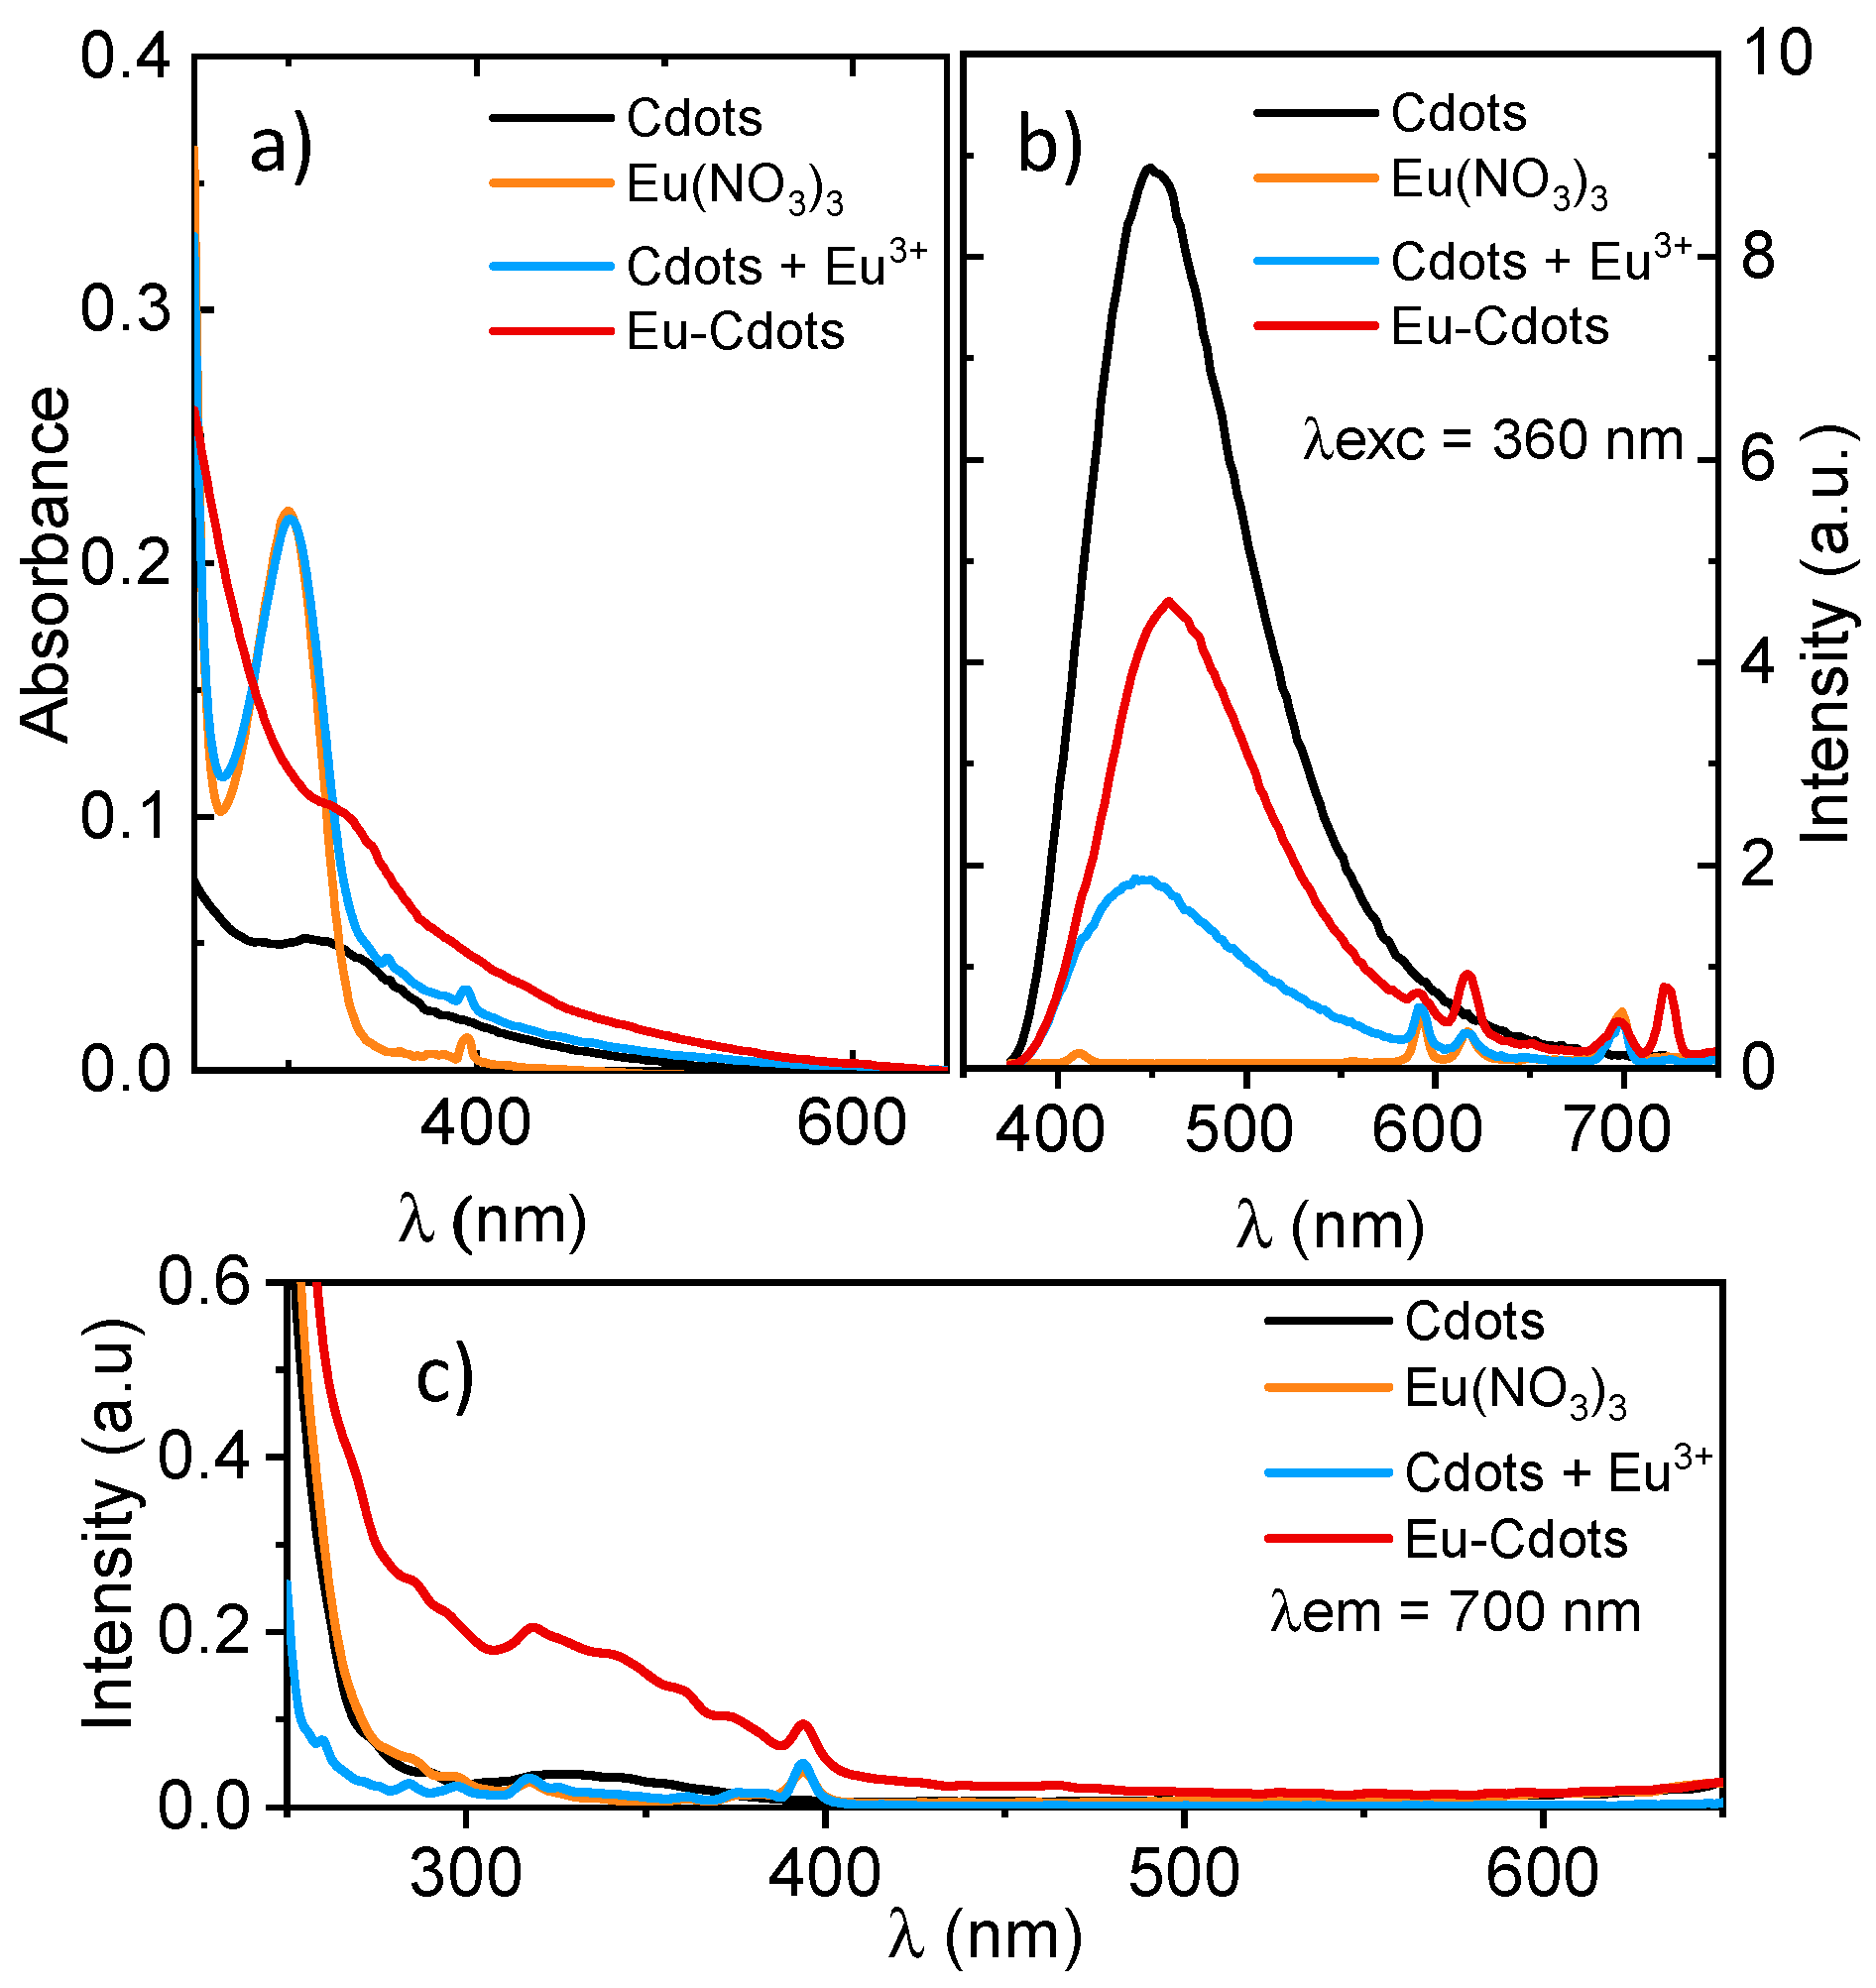
The absorption spectrum of Cdots (Figure 3a) shows a broad and relatively unstructured absorption extending from the UV through the visible region with a characteristic shoulder ~350 nm with contributions from n–π* transition involving the O or N atoms of the functional groups of the Cdots and π–π* transition within the sp2 core possibly involving interlayer charge transfer [41]. The UV-vis absorption spectrum of the Cdots + Eu3+ mixture is the sum of the spectrum of the isolated Cdots and Eu (NO3)3 in aqueous solutions. The spectrum of the mixture is dominated by a strong and relatively broad band centered at ~300 nm due to electron transfer from the oxygen to Eu3+. This charge transfer band is observed in the Eu (NO3)3 aqueous solutions whose spectrum is shown in Figure 3a. In addition, the mixture shows a small and sharp peak at 395 nm attributed to the direct absorption of the most intense 5L6←7F0 transitions of Eu3+ ions that is also observed in the spectrum of Eu (NO3)3 aqueous solutions [42,43]. The Laporte’s parity selection rule that forbids transition between same parity states is relaxed under the influence of a ligand-field due to non-centrosymmetric interactions that allow the mixing of electronic states of opposite parity into the 4f wavefunctions [43]. Thus, in aqueous solutions the intraconfigurational f–f transitions are partially allowed, and weak absorption and emission can be observed between f-states. Weaker f–f transitions are absent in both the Cdots + Eu3+ mixture and the aqueous solution of Eu (NO3)3. In the mixture, the strong band at 300 nm and the sharp peak at 395 nm due to Eu3+ appear superimposed on a broad and continuous absorption extending from the UV through the visible region due to the Cdots. The doped Eu-Cdots have an absorption spectrum that differs significantly from that of the Cdots + Eu3+ mixture. The strong absorption at 300 nm that dominated the absorption spectrum of the Cdots + Eu3+ mixture is absent in the Eu-Cdots. The absorption spectrum shows a continuous absorption extending from the UV to the red part of the visible spectrum with a shoulder at 350 nm that coincides with that observed in the Cdots.
The emission spectra of Eu-Cdots shows the characteristic sharp peaks at 592, 616 and 698 nm due to the 5D0→7FJ (J = 1, 2, 4) transition of Eu3+ [43,44] in addition to the broad emission of Cdots centered at 450 nm (Figure 3b). The emission of Eu-Cdots differs from that of the mixture in the relative intensity of the Eu3+ sharp peaks above 550 nm that are known for being extremely sensitive to the environment. In Eu-Cdots, the 5D0→7F2 transition at 616 nm is the strongest 5D0→7FJ transition, whereas in the mixture this peak appears weaker than the peaks observed at 592 and 698 nm due to the 5D0→7F1 and 5D0→7F4 transitions, respectively. Indeed, the 5D0→7F2 transition is considered a hypersensitive transition whose strength is particularly sensitive to the nature of the ligand field. Note that the peak at 720 nm in Eu-Cdots should not be considered in the discussion for it is an artifact from leaking 2nd harmonic of the excitation light at 360 nm.
The origin of the relative intensity changes of the Eu3+ centered emission can be elucidated by looking at the excitation spectra collected at 700 nm shown in Figure 3c. This figure shows that direct excitation of the metal-to-ligand charge transfer transition at 300 nm does not result in emission as this band is absent in the excitation spectra of both the Eu (NO3)3 aqueous solutions and the Cdots + Eu3+ mixture. The excitation spectra of the Eu (NO3)3 aqueous solutions and that of the Cdots + Eu3+ mixture are similar showing only the sharp features due to direct excitation of the 5L6←7F0 transitions of Eu3+. Conversely, in Eu-Cdots, the fact that there is an intensity redistribution in the emission of Eu3+ hints to a different excitation mechanism possibly sensitized by the Cdots. The sharp emission bands of the Eu3+ in Eu-Cdots result from an indirect excitation by energy transfer (Dexter type exchange mechanism) [45] from the electronic excited sates of the Cdots [31,45,46]. This interpretation agrees with the excitation spectra of Eu-Cdots collected at 700 nm showing a broad structureless excitation consistent with absorption of the Cdots, in addition to the sharp band due to direct excitation of the 5L6←7F0 of Eu3+. Note that such a broad excitation feature is absent in the spectrum of the Cdots + Eu3+ mixture, where no sensitized emission occurs (Figure 3c).
The characteristic broad emission band of Cdots centered around 450 nm is observed in all the three samples containing Cdots (undoped Cdots, Cdots + Eu3+ mixture and Eu-Cdots). The emission is excitation wavelength dependent with the maximum of emission shifting towards the red as the excitation energy decreases (see spectrum in Figures S1 and S2 in the Supplementary Material) for the variation of the emission with the excitation wavelength in Cdots and Eu-Cdots, respectively). This trend is usually associated with heterogeneity of the Cdots either due to the size distribution of the sp2 domains or due to the heterogeneous composition of the emitting sites [47]. The luminescence quantum yield of Cdots are quite low (Φ Cdots = 0.016) as expected for emission localized within the sp2 carbon core that is free from molecular fluorophores [48]. The slightly lower luminescence quantum yield of Eu-Cdots (ΦEu-Cdots = 0.013) could be due to energy transfer from the Cdots to the weakly emissive Eu3+. The low photoluminescence quantum yield observed are in good agreement with values reported earlier for Eu-decorated graphene quantum dots (Eu-GQD) with ΦEu-GQD = 0.03 [37]. The photostability of the nanomaterials was evaluated upon prolonged irradiation at 330 nm using the lamp of the spectrofluorometer. In Cdots, a drop of 30% intensity upon 10 min of irradiation was observed due to degradation of some labile defect. Beyond that, no further degradation was observed. For Eu-Cdots, with an intensity drop in the emission of only 15% upon 1 h of irradiation in the same conditions, the degradation kinetics is slower and continuous. Figure S3 was introduced in the Supplementary Material showing the emission intensity upon prolonged irradiation.
3.3. Quenching of Emission by Silver and Mercury
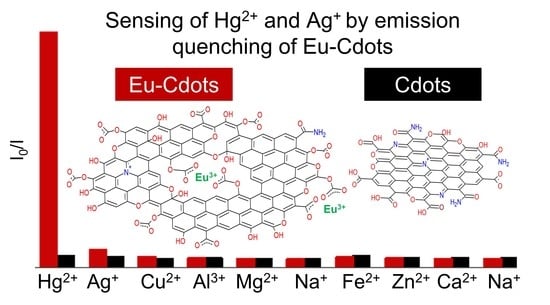
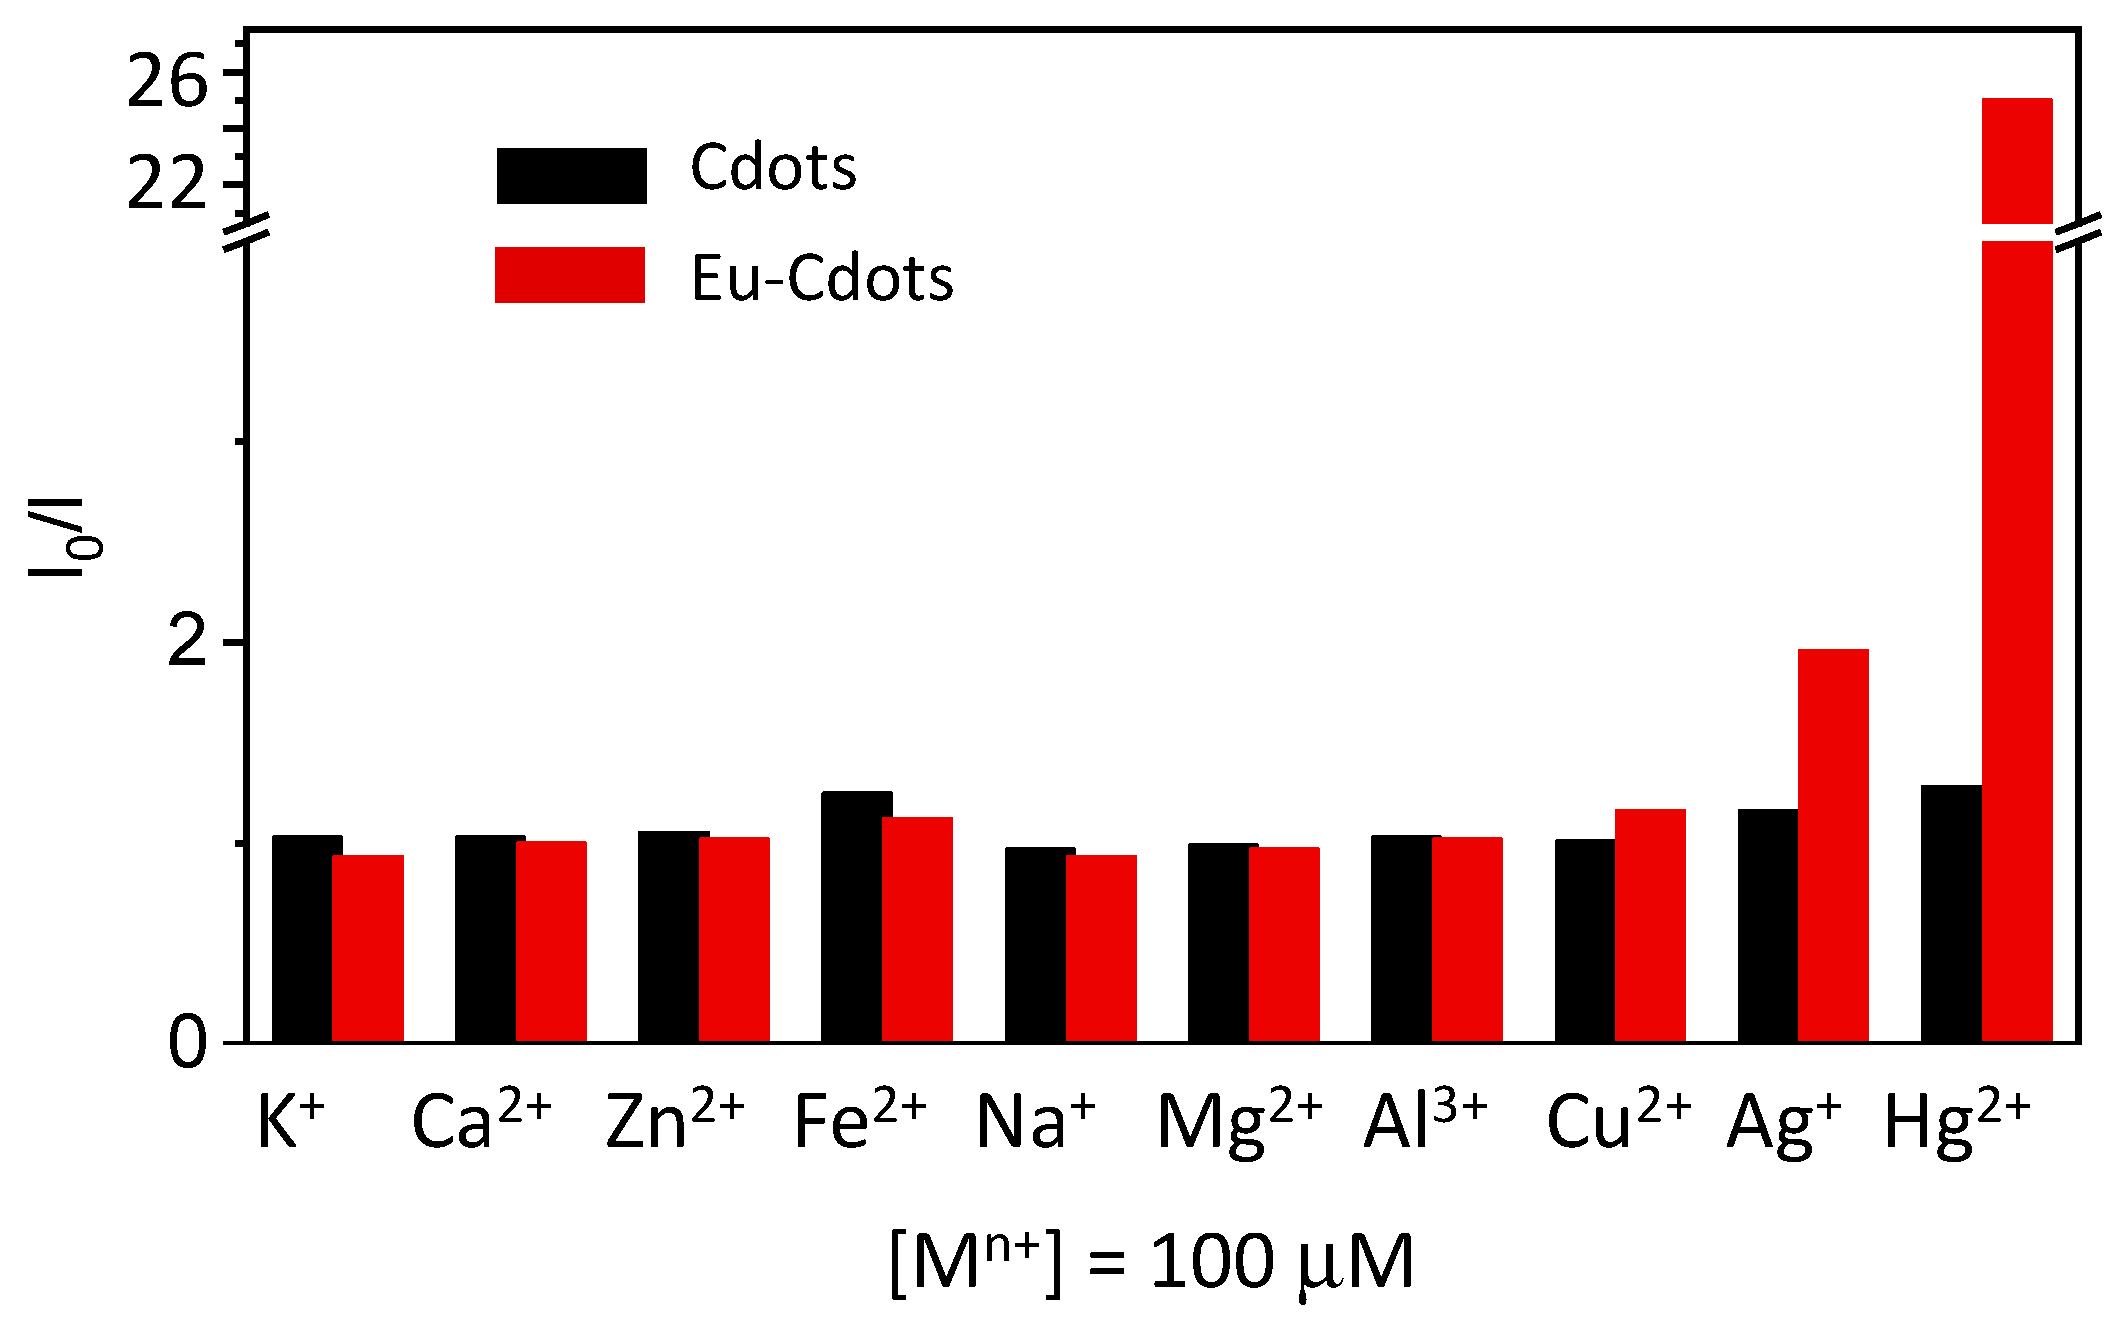
Figure 4 shows the effect of addition of an excess of metal cations (100 μM) on the luminescence intensity of Cdots and Eu-Cdots. The plot shows the ratio between the peak intensity at 450 nm before (I0) and after (I) addition of the metal cation upon excitation at 396 nm. Figure 4 shows that the emission of Eu-Cdots is quenched by the presence of Ag+ and Hg2+. There is a quenching by more than a factor of 25 in the Hg2+ and a more modest quenching effect (factor of 2) is induced by Ag+. Except for these two cations, the Eu-Cdots are relatively insensitive to all the other cations tested. Similar results were obtained for excitation in the 280–400 nm range. The Cdots dispersion produced in the absence of Eu3+ is insensitive to all the cations including Ag+ and Hg2+ (Figure 4).
The enhanced sensitivity to the presence of metal cations of Eu-Cdots, with respect to undoped Cdots, reflects the differences in structure and availability of active sites for cation binding of the two nanomaterials. The TEM images show that the average size of the Eu-Cdots is larger than that of undoped Cdots suggesting that there is an incorporation of Eu3+ ions in the graphene sheets during the growth of the sp2 network. It is possible that the Eu3+ becomes part of the carbon layer due to coordination with the carboxylic groups of the citric acid and the carbonyl groups of urea during the condensation reactions to form the sp2 clusters [49]. Eu3+ acts as a nucleating center expanding the overall size of the Cdots. In this case it is not unreasonable to expect a smaller size for the sp2 clusters in each layer due the presence of oxygenated defects induced by incorporation of Eu3+ in the carbon network, as it was effectively estimated based on the Raman spectroscopy data. Furthermore, the incorporation of Eu3+ in the Cdots might also affect the structure of the Cdots by inducing interaction between stacks of layers with different orientation. Recent computational studies have shown that the structure of the Cdots is influenced by the number of layers of sp2 carbons, with a uniaxial stacked structure observed for a low number of layers (up to 5), while for larger numbers of layers, the stacking breaks down into multi-axial stacked structures, where stacked layers with different orientations coexist. [50] The Eu3+ ion can operate as a seed for multiaxial stacking, as it was predicted earlier for K+ ions and coronene clusters [50]. Furthermore, due to its small ionic radius (~0.95–1.12 Å depending on the coordination), [51] Eu3+ can also diffuse to some extent and intercalate between layers typically separated by a distance of 3.3 Å. Thus, there are several mechanisms by which the Eu-Cdots could incorporate Eu3+ ions in its structure affecting its response to the presence of metal cations in solution.
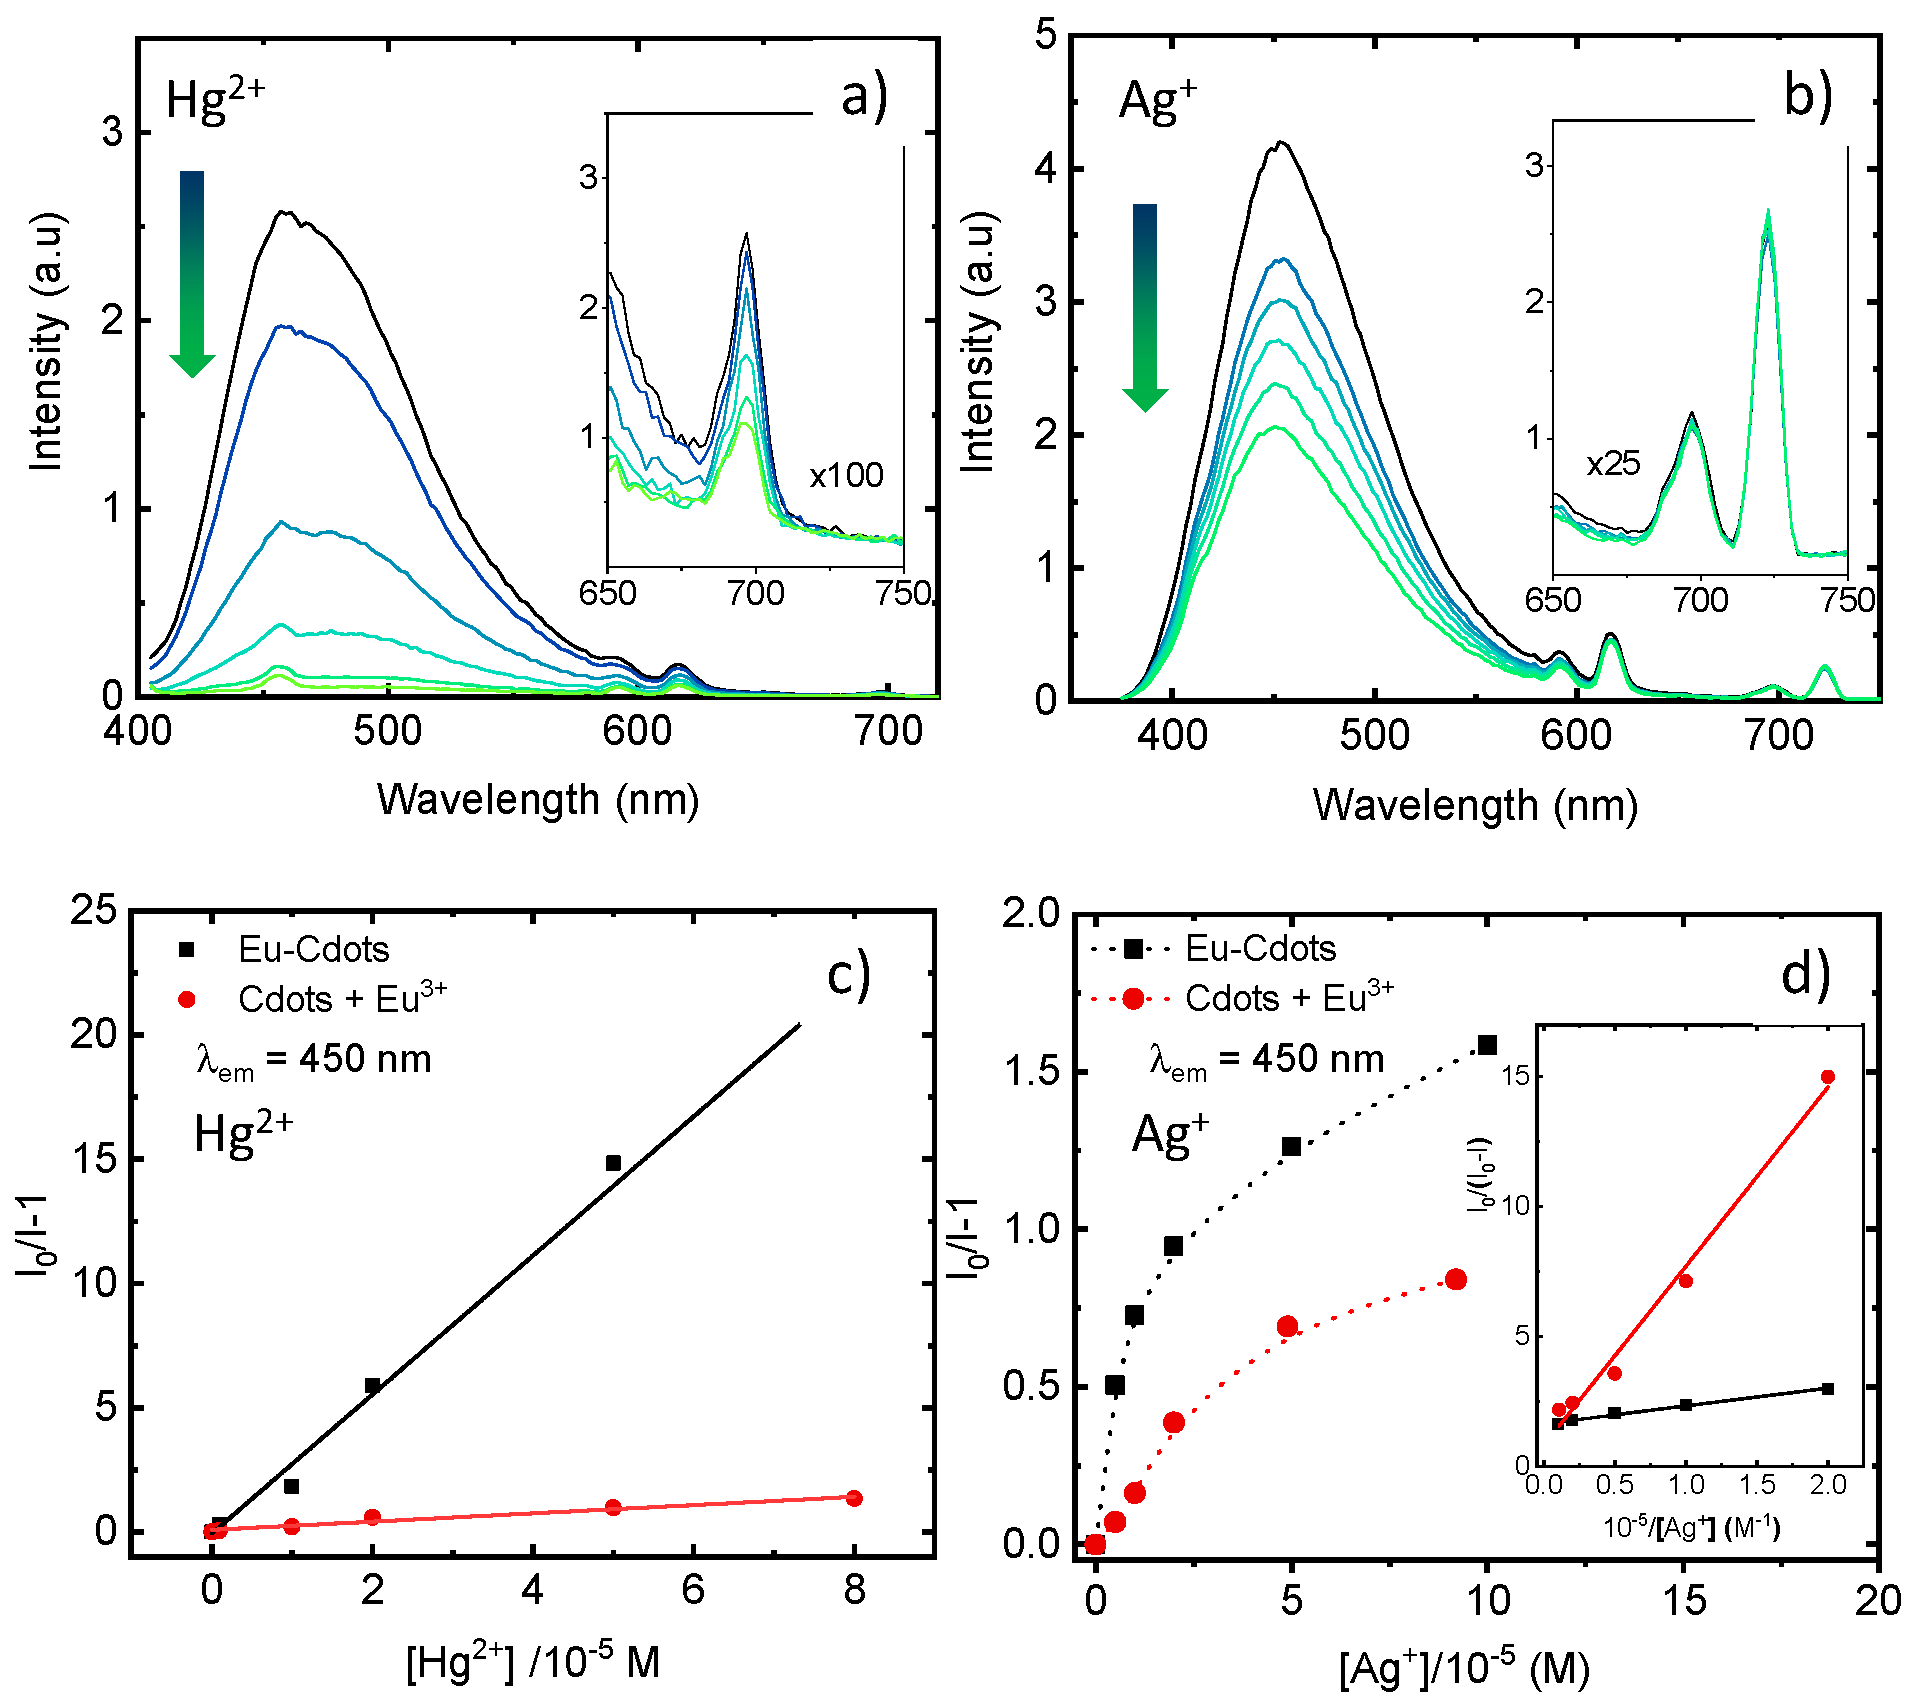
The Ag+ and Hg2+ quenching effect on the emission spectra of the dispersion of Eu-Cdots is shown in detail in Figure 5. For Hg2+, both the broad emission of the Cdots at 450 nm and the sharp emission bands of Eu3+ ions decrease in intensity with the amount of Hg2+ in solution, while the spectral shape is maintained (Figure 5a). In contrast, for the Ag+ ion (Figure 5b), quenching is observed in the emission of the Cdots, while the sharp Eu3+ emission peaks remain almost constant. This specificity in the quenching mechanism allows us to differentiate the two ions in solution. Furthermore, the constant intensity of Eu3+ for an increasing concentration of Ag+ can be used as an internal reference to build a ratiometer optical sensor for Ag+. Ratiometer sensors are less prone to artifacts and can correct for experimental and environmental effects, which are particularly problematic for ion sensing in complex biological matrixes where the concentration of the sensor can vary locally [52].
The plot of the intensity ratio (I0/I − 1) of the Eu-Cdots emission (λem = 450 nm) as a function of the concentration of Hg2+ is linear up to the concentration of 80 µM (Figure 5c), obeying a Stern–Volmer type equation:
where is a static quenching constant of = (2.8 ± 0.1) × 105 M−1. The limit of detection, estimated from the standard deviation of the straight-line intercept and the slope (LOD = 3σ/KSV), is 4 µM. The Stern–Volmer constant for the quenching of the Eu 3+ emission (λem = 698 nm) is one order of magnitude lower, = (1.7 ± 0.1) × 104 s−1, but still one order of magnitude larger than for the dispersion of undoped Cdots (3.6 ± 0.5) × 103 s−1.
For the Ag+ ion, the Stern–Volmer plot of the variation of the fluorescence intensity ratio (I0/I − 1) at 450 nm with the concentration of Ag+ in water shows a downward curvature (Figure 5d). This trend indicates that not all quenching centers are readily accessible for the Ag+ ions. In this case, considering that the fraction of active quencher centers is fa, a linear relationship is expected for the variation of I0/(I0 − I) with the reciprocal of the Ag+ following Equation (2): [53]
The inset in Figure 5d shows that such a linear trend is indeed observed for the quenching of the Eu-Cdots emission by Ag+. The fitting of the experimental data to Equation (2) gives for the fraction of active sites fa = 0.60 ± 0. 2 and KSV = (2.4 ± 0.4) × 105 s−1. Similar values for KSV were obtained for excitation at different wavelengths (e.g., λexc = 280 nm, fa = 0.40, KSV = 5.0 × 10⁵ s−1 λexc = 360 nm, fa = 0.47, KSV = 1.5 × 10⁶ s−1). The KSV value for the mixture of Cdots + Eu3+ is 3.3 × 10⁴ s−1 (fa = 0.58) and for undoped Cdots is lower than 103 s−1. The LOD was estimated as ~5 µM for Ag+.
3.4. Mechanistic Insight
The Hg2+ cation can accommodate a range of coordination numbers and geometries being the two-coordinated linear and four-coordinated tetrahedral very common [23]. Hg2+ is a soft acid that likes to coordinate with soft bases containing sulfur, phosphorous, and halides [30]. In the case of Cdots, the Hg2+ coordinates with free oxygen and nitrogen atoms at the surface of Eu-Cdots, and it can also replace Eu3+ ions coordinated at the surface. In addition, since the radius of Hg2+ (~0.60–1.14 Å depending on the coordination) [51] is similar to that of Eu3+ radius (~0.95–1.12 Å), it can also access the interlayer space and replace the Eu3+. Interaction of Hg2+ with Cdots can cause static quenching of the Eu-Cdots emission by several mechanisms, including the heavy atom spin–orbit coupling enhancement and charge transfer mechanisms [54]. The concomitant quenching of Eu3+ confirms that some of the Eu3+ ions are indeed displaced by Hg2+, in which case the sensitization of Eu3+ emission by energy transfer from the Cdots is no longer possible.
The Ag+ cation is a soft acid like Hg2+ with a radius of~0.67–1.28 Å that is slightly larger than that of Hg2+ and Eu3+ for the same coordination numbers [51]. Similarly to Hg2+, Ag+ also prefers to coordinate with soft bases, it favors linear or tetrahedral coordination, and it should also be able to access the interlayer space. The interaction of the Ag+ ions with the Cdots must involve coordination of the Ag+ with the carboxylates of the Cdots, and possibly also the minor amount of nitrogen containing groups. The fact that the intensity of Eu3+ remains almost constant for all Ag+ concentrations indicates that the Ag+ ions are unable to displace the Eu3+ coordinated with the Cdots. Thus, interactions of Ag+ with the Cdots must be mostly via free carboxylates. In this scenario, the number of active quenching sites, given by the fraction fa = 0.4–0.6, must be related with the amount of free carboxylate at the periphery of the Eu-Cdots. The quenching of the emission of Cdots upon complexation can occur by both the heavy atom spin-orbit coupling enhancement and the electron or charge transfer from Ag+ to the Cdots active sites. Most importantly, since the emission of Eu3+ remains unchanged, the ratio of the Cdots to the Eu3+ emission intensities can be used as an internal reference to build a ratiometer sensor for Ag+ that is less prone to artifacts and can correct for environmental effects.
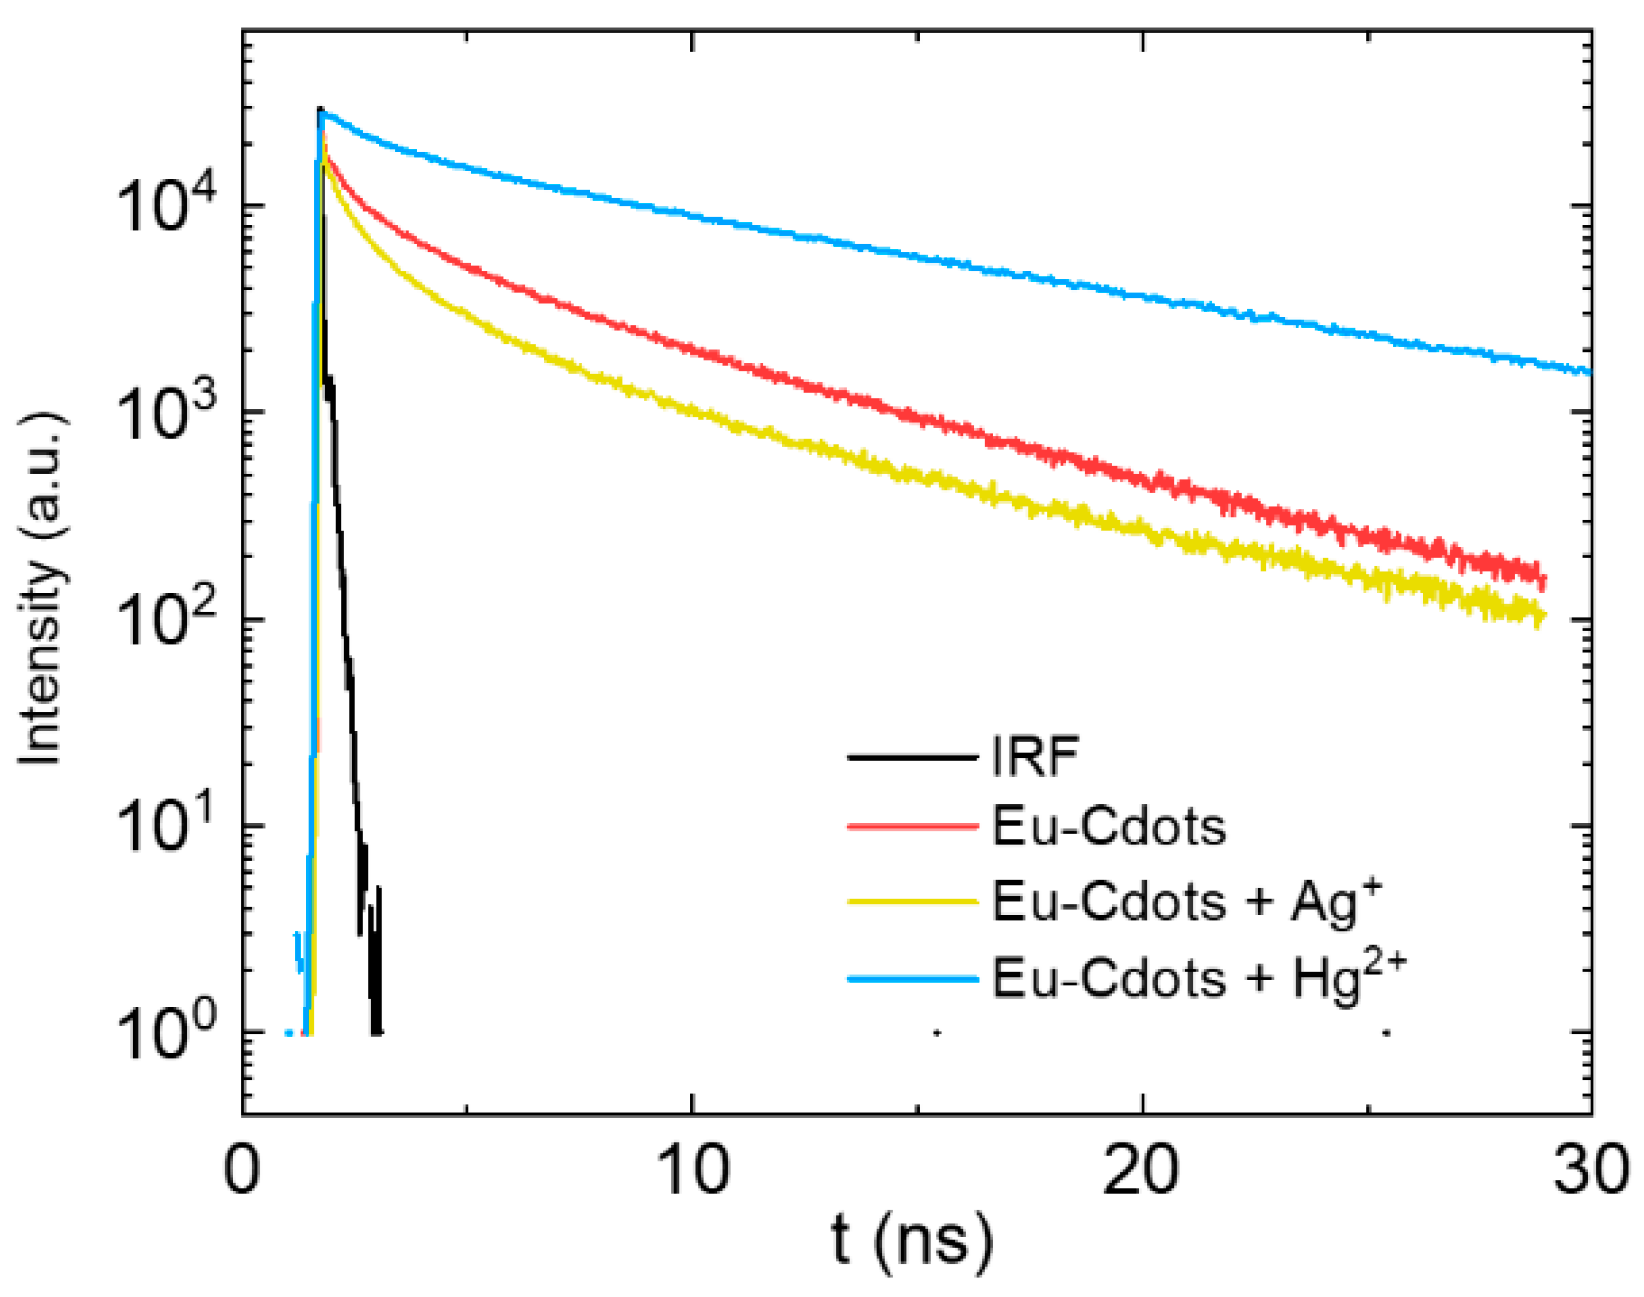
Additional insight into the sensing mechanism can be retrieved from the emission decay curves shown in Figure 6 with the intensity in a log scale to better convey the details of the curves. The same curves are shown in Figure S4 of the Supplementary Material, in a normal scale for longer times. The decay curves of the Eu-Cdots emission in the absence and in the presence of Ag+ and Hg2+ cations are complex and can only be fitted by a sum of 3 exponentials plus a very short lifetime component (~10 ps) attributed to light scattering. The average lifetime of the Cdots (3.2 ns) is slightly higher than that of the Eu-Cdots (2.95 ns) reflecting the energy transfer from the Cdots to the Eu3+ ions. The average lifetime of Eu-Cdots is shorter in the presence of 100 µM of Ag+ (2.2 ns). This indicates that, in addition to static quenching by formation of non-emissive complexes, the quenching by Ag+ has a dynamic component due to the weak coordination of the Ag+ to the oxygen of the Eu-Cdots functional groups allowing for some Ag+ ions to remain free in solution. The opposite trend is observed in the presence of Hg2+ where the lifetime increases to 7.8 ns. This is a rather unexpected observation given the strong quenching of the emission of Eu-Cdots in the presence of Hg2+. The main interaction of the Hg2+ with Eu-Cdots is the one leading to static quenching due to formation of non-emissive complexes via the carbonate and carboxylate groups. The stronger quenching in the presence of Hg2+ is correlated with the possibility of Hg2+ to replace Eu3+ not only at the surface of the dots but also in the interlayer spacing, which must require a fine balance between charge, size of the ions and also the preferred coordination geometry. Thus, the increase in the excited state lifetime can only be explained by a decrease of the nonradiative deactivation channels of uncomplexed Eu-Cdots upon transient interaction with the Hg2+ that remains in solution. The hydroxyl groups of the Cdots are strongly coupled with high frequency vibration modes of water via hydrogen bonding contributing to dissipation of the electronic excitation energy into the bath states of the solvent. The Hg2+ that remains in solution can transiently interact with the hydroxyl groups inhibiting this nonradiative deactivation channel and increasing the Eu-Cdots average lifetime.
4. Conclusions
Carbon dots and Eu-Cdots were prepared by a hydrothermal treatment using citric acid and urea as precursors and Eu (NO3)3 as a source of europium. The Eu3+ cation is coordinated with the oxygen of the functional groups at the Cdots surface and incorporate into the carbon network, forming Eu-O charge transfer complexes. It can also be intercalated between the nanographene sheets. The Eu-Cdots can be used as turn-off luminescent sensors for Hg2+ and Ag+ cations because their luminescence is strongly quenched in aqueous solutions in 10–100 µM range concentrations with a limit of detection of 4–5 µM
For Hg2+, both the broad emission of the Cdots at 450 nm and the sharp emission bands of Eu3+ ions are quenched, while for the Ag+ ion, quenching is observed only in the emission of the Cdots. The specificity in the quenching mechanism allows us to differentiate the two ions in solution. The constant intensity of Eu3+ for an increasing concentration of Ag+ can be used as an internal reference to build a ratiometer optical sensor for Ag+. It is worth noting that this ratiometric sensor can be of value in clinical mercury poisoning detection in complex biological matrixes, but further work should be done to improve the detection limits. Except for Hg2+ and Ag+, the Eu-Cdots are relatively insensitive to all other cations tested. The Cdots dispersion produced in the absence of Eu3+ is relatively insensitive to all cations, including Ag+ and Hg2+. This increase of reactivity of the Eu-Cdots when compared with undoped Cdots is associated with the differences in the composition of the doped dots (more oxygenated, with additional carboxylate groups) and availability of active sites for cation binding.
Supplementary Materials
The following supporting information can be downloaded at: https://0-www-mdpi-com.brum.beds.ac.uk/article/10.3390/nano12030385/s1, Figure S1: Absorption spectrum and luminescence spectra of undoped Cdots; Figure S2: Absorption spectrum and luminescence spectra of the Eu-Cdots upon excitation at several wavelengths; Figure S3: Photostability of Cdots and Eu-Cdots. Emission intensity of Cdots (black) and Eu-Cdots (red) under irradiation at 330 nm; Figure S4: Emission decay curves for Eu-Cdots (red), and Eu-Cdots in the presence of 100 mM of Ag+ (yellow) and Hg2+ (blue). The Instrumental response function (IRF) is shown in black. Table S1: High resolution XPS spectra of the C1s and O1s peaks of the Cdots and Eu-Cdots with the attribution to functional groups and the corresponding atomic percentages; Table S2: Decay parameters of the C-dots and Eu-Cdots emission in the absence and presence of 100 µM of Ag+ and Hg2+.
Author Contributions
Conceptualization, J.M. and E.M.; experimental work, C.C.; initial draft preparation, J.M.; all authors have participated in the data analysis, writing, review, and editing of the manuscript. All authors have read and agreed to the published version of the manuscript.
Funding
This research was funded by POCI, FCT and FEDER, grant number LISBOA-01-0145-FEDER-029319, PTDC/NAN-MAT/29317/2017, LA/P/0056/2020, UIDB/00100/2020, and PD/BD/127905/2016.
Institutional Review Board Statement
Not applicable.
Informed Consent Statement
Not applicable.
Data Availability Statement
The data presented in this study are available upon reasonable request from the corresponding author.
Conflicts of Interest
The authors declare no conflict of interest.
References
- Zhu, S.J.; Song, Y.B.; Zhao, X.H.; Shao, J.R.; Zhang, J.H.; Yang, B. The photoluminescence mechanism in carbon dots (graphene quantum dots, carbon nanodots, and polymer dots): Current state and future perspective. Nano Res. 2015, 8, 355–381. [Google Scholar] [CrossRef]
- Li, H.; Kang, Z.; Liu, Y.; Lee, S.-T. Carbon nanodots: Synthesis, properties and applications. J. Mater. Chem. 2012, 22, 24230–24253. [Google Scholar] [CrossRef]
- Zhang, J.F.; Zhou, Y.; Yoon, J.; Kim, J.S. Recent progress in fluorescent and colorimetric chemosensors for detection of precious metal ions (silver, gold and platinum ions). Chem. Soc. Rev. 2011, 40, 3416–3429. [Google Scholar] [CrossRef] [PubMed]
- Ganguly, S.; Das, P.; Bose, M.; Mondal, S.; Das, A.K.; Das, N.C. Strongly blue-luminescent N-doped carbogenic dots as a tracer metal sensing probe in aqueous medium and its potential activity towards in situ Ag-nanoparticle synthesis. Sens. Actuators B-Chem. 2017, 252, 735–746. [Google Scholar] [CrossRef]
- Das, P.; Maruthapandi, M.; Saravanan, A.; Natan, M.; Jacobi, G.; Banin, E.; Gedanken, A. Carbon Dots for Heavy-Metal Sensing, pH-Sensitive Cargo Delivery, and Antibacterial Applications. ACS Appl. Nano Mater. 2020, 3, 11777–11790. [Google Scholar] [CrossRef]
- Das, P.; Ganguly, S.; Margel, S.; Gedanken, A. Tailor made magnetic nanolights: Fabrication to cancer theranostics applications. Nanoscale Adv. 2021, 3, 6762–6796. [Google Scholar] [CrossRef]
- Hai, X.; Feng, J.; Chen, X.W.; Wang, J.H. Tuning the optical properties of graphene quantum dots for biosensing and bioimaging. J. Mater. Chem. B 2018, 6, 3219–3234. [Google Scholar] [CrossRef]
- Lin, L.P.; Song, X.H.; Chen, Y.Y.; Rong, M.C.; Zhao, T.T.; Jiang, Y.Q.; Wang, Y.; Chen, X. One-pot synthesis of highly greenish-yellow fluorescent nitrogen-doped graphene quantum dots for pyrophosphate sensing via competitive coordination with Eu3+ ions. Nanoscale 2015, 7, 15427–15433. [Google Scholar] [CrossRef]
- Qian, Z.S.; Ma, J.J.; Shan, X.Y.; Feng, H.; Shao, L.X.; Chen, J.R. Highly Luminescent N-Doped Carbon Quantum Dots as an Effective Multifunctional Fluorescence Sensing Platform. Chem.-Eur. J. 2014, 20, 2254–2263. [Google Scholar] [CrossRef]
- Gao, X.H.; Lu, Y.Z.; Zhang, R.Z.; He, S.J.; Ju, J.; Liu, M.M.; Li, L.; Chen, W. One-pot synthesis of carbon nanodots for fluorescence turn-on detection of Ag+ based on the Ag+-induced enhancement of fluorescence. J. Mater. Chem. C 2015, 3, 2302–2309. [Google Scholar] [CrossRef]
- Cayuela, A.; Soriano, M.L.; Kennedy, S.R.; Steed, J.W.; Valcarcel, M. Fluorescent carbon quantum dot hydrogels for direct determination of silver ions. Talanta 2016, 151, 100–105. [Google Scholar] [CrossRef] [PubMed] [Green Version]
- Zhang, M.R.; Su, R.G.; Zhong, J.; Fei, L.; Cai, W.; Guan, Q.W.; Li, W.; Li, N.; Chen, Y.; Cai, L.; et al. Red/orange dual-emissive carbon dots for pH sensing and cell imaging. Nano Res. 2019, 12, 815–821. [Google Scholar] [CrossRef]
- Bian, S.Y.; Shen, C.; Qian, Y.T.; Liu, J.Y.; Xi, F.N.; Dong, X.P. Facile synthesis of sulfur-doped graphene quantum dots as fluorescent sensing probes for Ag+ ions detection. Sens. Actuators B-Chem. 2017, 242, 231–237. [Google Scholar] [CrossRef]
- Song, T.; Zhu, X.F.; Zhou, S.H.; Yang, G.; Gan, W.; Yuan, Q.H. DNA derived fluorescent bio-dots for sensitive detection of mercury and silver ions in aqueous solution. Appl. Surf. Sci. 2015, 347, 505–513. [Google Scholar] [CrossRef]
- Dang, D.K.; Chandrasekaran, S.; Ngo, Y.L.T.; Chung, J.S.; Kim, E.J.; Hur, S.H. One pot solid-state synthesis of highly fluorescent N and S co-doped carbon dots and its use as fluorescent probe for Ag+ detection in aqueous solution. Sens. Actuators B-Chem. 2018, 255, 3284–3291. [Google Scholar] [CrossRef]
- Li, T.Z.; Shuang, E.; Wang, J.H.; Chen, X.W. Regulating the properties of carbon dots via a solvent-involved molecule fusion strategy for improved sensing selectivity. Anal. Chim. Acta 2019, 1088, 107–115. [Google Scholar] [CrossRef] [PubMed]
- Zhang, Y.H.; Zhou, K.; Qiu, Y.; Xia, L.; Xia, Z.N.; Zhang, K.L.; Fu, Q. Strongly emissive formamide-derived N-doped carbon dots embedded Eu (III)-based metal-organic frameworks as a ratiometric fluorescent probe for ultrasensitive and visual quantitative detection of Ag. Sens. Actuators B-Chem. 2021, 339, 129922. [Google Scholar] [CrossRef]
- Guo, J.Q.; Ye, S.; Li, H.; Song, J.; Qu, J. Novel carbon dots with dual excitation for imaging and silver ion detection in living cells. Dye. Pigment. 2020, 183, 108723. [Google Scholar] [CrossRef]
- Shen, L.M.; Chen, M.L.; Hu, L.L.; Chen, X.W.; Wang, J.H. Growth and Stabilization of Silver Nanoparticles on Carbon Dots and Sensing Application. Langmuir 2013, 29, 16135–16140. [Google Scholar] [CrossRef]
- Zhao, X.E.; Lei, C.H.; Gao, Y.; Gao, H.; Zhu, S.Y.; Yang, X.; You, J.; Wang, H. A ratiometric fluorescent nanosensor for the detection of silver ions using graphene quantum dots. Sens. Actuators B-Chem. 2017, 253, 239–246. [Google Scholar] [CrossRef]
- Wu, H.F.; Tong, C.L. Ratiometric fluorometric determination of silver(I) by using blue-emitting silicon- and nitrogen-doped carbon quantum dots and red-emitting N-acetyl-L-cysteine-capped CdTe quantum dots. Microchim. Acta 2019, 186, 723. [Google Scholar] [CrossRef] [PubMed]
- Desai, M.L.; Jha, S.; Basu, H.; Singhal, R.K.; Sharma, P.K.; Kailasa, S.K. Microwave-assisted synthesis of water-soluble Eu3+ hybrid carbon dots with enhanced fluorescence for the sensing of Hg2+ ions and imaging of fungal cells. New J. Chem. 2018, 42, 6125–6133. [Google Scholar] [CrossRef]
- Nolan, E.M.; Lippard, S.J. Tools and tactics for the optical detection of mercuric ion. Chem. Rev. 2008, 108, 3443–3480. [Google Scholar] [CrossRef] [PubMed]
- Goncalves, H.; Jorge, P.A.S.; Fernandes, J.R.A.; da Silva, J.C.G.E. Hg(II) sensing based on functionalized carbon dots obtained by direct laser ablation. Sens. Actuators B-Chem. 2010, 145, 702–707. [Google Scholar] [CrossRef] [Green Version]
- Goncalves, H.M.R.; Duarte, A.J.; da Silva, J.C.G.E. Optical fiber sensor for Hg(II) based on carbon dots. Biosens. Bioelectron. 2010, 26, 1302–1306. [Google Scholar] [CrossRef] [Green Version]
- Zhang, R.Z.; Chen, W. Nitrogen-doped carbon quantum dots: Facile synthesis and application as a ‘turn-off’ fluorescent probe for detection of Hg2+ ions. Biosens. Bioelectron. 2014, 55, 83–90. [Google Scholar] [CrossRef]
- Yang, M.; Liu, C.; Peng, Y.; Xiao, R.Z.; Zhang, S.; Zhang, Z.L.; Zhang, B.; Pang, D.-W. Surface chemistry tuning the selectivity of carbon nanodots towards Hg2+ recognition. Anal. Chim. Acta 2021, 1146, 33–40. [Google Scholar] [CrossRef]
- Wu, H.F.; Tong, C.L. Dual-Emission Fluorescent Probe for the Simultaneous Detection of Nitrite and Mercury(II) in Environmental Water Samples Based on the Tb3+-Modified Carbon Quantum Dot/3-Aminophenylboronic Acid Hybrid. Anal. Chem. 2020, 92, 8859–8866. [Google Scholar] [CrossRef]
- Liu, X.J.; Wang, C.Z.; Hupalo, M.; Yao, Y.X.; Tringides, M.C.; Lu, W.C.; Ho, K.M. Adsorption and growth morphology of rare-earth metals on graphene studied by ab initio calculations and scanning tunneling microscopy. Phys. Rev. B 2010, 82, 245408. [Google Scholar] [CrossRef]
- Valeur, B.; Berberan-Santos, M.N. Molecular Fluorescence, 2nd ed.; Wiley-VCH Verlag GmbH: Weinheim, Germany, 2012. [Google Scholar]
- He, H.; Ma, Y.; Li, J.F.; Lai, X.F.; Chen, X.; Wang, L.; Zhang, W.; Huang, Y.; Zhang, P. Free regulation of luminous color of Ln-CQDs synthesized with citric acid-chelated Ln ions as the precursor. J. Lumin. 2020, 221, 117006. [Google Scholar] [CrossRef]
- Ferrari, A.C.; Robertson, J. Interpretation of Raman spectra of disordered and amorphous carbon. Phys. Rev. B 2000, 61, 14095–14107. [Google Scholar] [CrossRef] [Green Version]
- Ferrari, A.C.; Robertson, J. Resonant Raman spectroscopy of disordered, amorphous, and diamondlike carbon. Phys. Rev. B 2001, 64, 075414. [Google Scholar] [CrossRef] [Green Version]
- Park, B.; Kim, S.J.; Lim, J.; Some, S.; Park, J.E.; Kim, S.J.; Kim, C.; Lee, T.J.; Jun, S.C. Tunable wide blue photoluminescence with europium decorated graphene. J. Mater. Chem. C 2015, 3, 4030–4038. [Google Scholar] [CrossRef]
- Wang, D.D.; Gao, H.; Roze, E.; Qu, K.; Liu, W.J.; Shao, Y.; Xin, S.; Wang, Y. Synthesis and photoluminescence of three-dimensional europium-complexed graphene macroassembly. J. Mater. Chem. C 2013, 1, 5772–5778. [Google Scholar] [CrossRef]
- Holá, K.; Sudolská, M.; Kalytchuk, S.; Nachtigallová, D.; Rogach, A.L.; Otyepka, M.; Zbořil, R. Graphitic Nitrogen Triggers Red Fluorescence in Carbon Dots. ACS Nano 2017, 11, 12402–12410. [Google Scholar] [CrossRef]
- Lin, L.P.; Song, X.H.; Chen, Y.Y.; Rong, M.C.; Wang, Y.R.; Zhao, L.; Zhao, T.; Chen, X. Europium-decorated graphene quantum dots as a fluorescent probe for label-free, rapid and sensitive detection of Cu2+ and L-cysteine. Anal. Chim. Acta 2015, 891, 261–268. [Google Scholar] [CrossRef]
- Stevens, J.S.; de Luca, A.C.; Pelendritis, M.; Terenghi, G.; Downes, S.; Schroeder, S.L.M. Quantitative analysis of complex amino acids and RGD peptides by X-ray photoelectron spectroscopy (XPS). Surf. Interface Anal. 2013, 45, 1238–1246. [Google Scholar] [CrossRef] [Green Version]
- Xia, D.D.; Li, J.F.; Li, W.Z.; Jiang, L.J.; Li, G.M. Lanthanides-based multifunctional luminescent films for ratiometric humidity sensing, information storage, and colored coating. J. Lumin. 2021, 231, 117784. [Google Scholar] [CrossRef]
- Idriss, H. On the wrong assignment of the XPS O1s signal at 531–532 eV attributed to oxygen vacancies in photo- and electro-catalysts for water splitting and other materials applications. Surf. Sci. 2021, 712, 121894. [Google Scholar] [CrossRef]
- Strauss, V.; Margraf, J.T.; Dolle, C.; Butz, B.; Nacken, T.J.; Walter, J.; Bauer, W.; Peukert, W.; Spiecker, E.; Clark, T.; et al. Carbon Nanodots: Toward a Comprehensive Understanding of Their Photoluminescence. J. Am. Chem. Soc. 2014, 136, 17308–17316. [Google Scholar] [CrossRef]
- Yamase, T.; Kobayashi, T.; Sugeta, M.; Naruke, H. Europium(III) luminescence and intramolecular energy transfer studies of polyoxometalloeuropates. J. Phys. Chem. A 1997, 101, 5046–5053. [Google Scholar] [CrossRef]
- Binnemans, K. Interpretation of europium(III) spectra. Coord. Chem. Rev. 2015, 295, 1–45. [Google Scholar] [CrossRef] [Green Version]
- Zhang, B.; Yang, J.; Li, H.R. Multiple color emission of solid-state hybrid material containing carbon dots and Europium(III) complexes. J. Lumin. 2020, 220, 116959. [Google Scholar] [CrossRef]
- Dexter, D.L. A Theory of Sensitized Luminescence in Solids. J. Chem. Phys. 1953, 21, 836–850. [Google Scholar] [CrossRef]
- Li, R.S.; Liu, J.H.; Yang, T.; Gao, P.F.; Wang, J.; Liu, H.; Zhen, S.J.; Li, Y.F.; Huang, C.Z. Carbon Quantum Dots-Europium(III) Energy Transfer Architecture Embedded in Electrospun Nanofibrous Membranes for Fingerprint Security and Document Counterspy. Anal. Chem. 2019, 91, 11185–11191. [Google Scholar] [CrossRef] [PubMed]
- Santos, C.I.M.; Mariz, I.F.A.; Pinto, S.N.; Goncalves, G.; Bdikin, I.; Marques, P.A.A.P.; Neves, M.G.P.M.S.; Martinho, J.M.G.; Maçôas, E.M.S. Selective two-photon absorption in carbon dots: A piece of the photoluminescence emission puzzle. Nanoscale 2018, 10, 12505–12514. [Google Scholar] [CrossRef] [PubMed] [Green Version]
- Essner, J.B.; Kist, J.A.; Polo-Parada, L.; Baker, G.A. Artifacts and Errors Associated with the Ubiquitous Presence of Fluorescent Impurities in Carbon Nanodots. Chem. Mater. 2018, 30, 1878–1887. [Google Scholar] [CrossRef]
- Gupta, B.K.; Thanikaivelan, P.; Narayanan, T.N.; Song, L.; Gao, W.; Hayashi, T.; Reddy, A.L.M.; Saha, A.; Shanker, V.; Endo, M.; et al. Optical Bifunctionality of Europium-Complexed Luminescent Graphene Nanosheets. Nano Lett. 2011, 11, 5227–5233. [Google Scholar] [CrossRef]
- Bartolomei, M.; Pirani, F.; Marques, J.M.C. Aggregation enhancement of coronene molecules by seeding with alkali-metal ions. Phys. Chem. Chem. Phys. 2019, 21, 16005–16016. [Google Scholar] [CrossRef]
- Shannon, R.D. Revised Effective Ionic-Radii and Systematic Studies of Interatomic Distances in Halides and Chalcogenides. Acta Crystallogr. A 1976, A32, 751–767. [Google Scholar] [CrossRef]
- Wu, P.; Hou, X.D.; Xu, J.J.; Chen, H.Y. Ratiometric fluorescence, electrochemiluminescence, and photoelectrochemical chemo/biosensing based on semiconductor quantum dots. Nanoscale 2016, 8, 8427–8442. [Google Scholar] [CrossRef] [PubMed]
- Lakowicz, R. Principles of Fluorescence Spectroscopy, 3rd ed.; Springer: Baltimore, MD, USA, 2006. [Google Scholar]
- Martinho, J.M.G. Heavy-Atom Quenching of Monomer and Excimer Pyrene Fluorescence. J. Phys. Chem. 1989, 93, 6687–6692. [Google Scholar] [CrossRef]
Figure 1.
Characterization of Cdots and Eu-Cdots by TEM (a–d), Raman (e), and FTIR (f); (a,b) TEM images of Cdots and Eu-Cdots, and (c,d) their corresponding distributions of Ferret diameter; (e) Raman spectra of the Cdots (black) and Eu-Cdots (red) showing the characteristic D and G bands, and (f) FTIR spectrum of Cdots (black) and Eu-Cdots (red).

Figure 2.
XPS spectra of the Cdots and Eu-Cdots: low resolution XPS spectra (a,b) and high resolution XPS spectra for the C1s, O1s, and N1s peaks of the Cdots (c–e) and Eu-Cdots (f–h).
Figure 2.
XPS spectra of the Cdots and Eu-Cdots: low resolution XPS spectra (a,b) and high resolution XPS spectra for the C1s, O1s, and N1s peaks of the Cdots (c–e) and Eu-Cdots (f–h).

Figure 3.
Optical properties of Cdots (black), Eu (NO3)3 (orange), a mixture of Cdots + Eu3+ in water (blue) and Eu-Cdots (dark red); (a) absorption spectra, (b) photoluminescence emission spectra excited at 360 nm, and (c) photoluminescence excitation spectra collected at 700 nm.
Figure 3.
Optical properties of Cdots (black), Eu (NO3)3 (orange), a mixture of Cdots + Eu3+ in water (blue) and Eu-Cdots (dark red); (a) absorption spectra, (b) photoluminescence emission spectra excited at 360 nm, and (c) photoluminescence excitation spectra collected at 700 nm.

Figure 4.
Ratio of the emission intensities before (I0) and after (I) addition of 100 μM of several metal cations upon excitation at 396 nm of a Cdots (black) and Eu-Cdots (dark red). A break was introduced in the y-axis to better convey the details of the response. A quenching of emission by a factor of 2 is observed for Ag+, while Hg2+ shows a quenching by a factor of 25.

Figure 5.
Emission quenching of Eu-Cdots by Hg2+ and Ag+. Emission spectra of the Eu-Cdots aqueous dispersion in the presence of Hg2+ at λexc = 390 nm (a) and Ag+ at λexc = 360 nm (b), and corresponding Stern–Volmer plots of the quenching measured at λem = 450 nm upon addition of Hg2+ (c) and Ag+ (d). In (c,d), similar quenching data are shown for the quenching of Cdots + Eu3+ mixture. The inset on panel (d) shows linear relationship between I0/(I0 − I) with the reciprocal of the Ag+ following Equation (2).

Figure 6.
Emission decay curves for Eu-Cdots (red), and Eu-Cdots in the presence of 100 mM of Ag+ (yellow) and Hg2+ (blue). The instrumental response function (IRF) is shown in black.
Figure 6.
Emission decay curves for Eu-Cdots (red), and Eu-Cdots in the presence of 100 mM of Ag+ (yellow) and Hg2+ (blue). The instrumental response function (IRF) is shown in black.

Publisher’s Note: MDPI stays neutral with regard to jurisdictional claims in published maps and institutional affiliations. |
© 2022 by the authors. Licensee MDPI, Basel, Switzerland. This article is an open access article distributed under the terms and conditions of the Creative Commons Attribution (CC BY) license (https://creativecommons.org/licenses/by/4.0/).
Share and Cite
MDPI and ACS Style
Correia, C.; Martinho, J.; Maçôas, E. A Fluorescent Nanosensor for Silver (Ag+) and Mercury (Hg2+) Ions Using Eu (III)-Doped Carbon Dots. Nanomaterials 2022, 12, 385. https://0-doi-org.brum.beds.ac.uk/10.3390/nano12030385
AMA Style
Correia C, Martinho J, Maçôas E. A Fluorescent Nanosensor for Silver (Ag+) and Mercury (Hg2+) Ions Using Eu (III)-Doped Carbon Dots. Nanomaterials. 2022; 12(3):385. https://0-doi-org.brum.beds.ac.uk/10.3390/nano12030385
Chicago/Turabian StyleCorreia, Cátia, José Martinho, and Ermelinda Maçôas. 2022. "A Fluorescent Nanosensor for Silver (Ag+) and Mercury (Hg2+) Ions Using Eu (III)-Doped Carbon Dots" Nanomaterials 12, no. 3: 385. https://0-doi-org.brum.beds.ac.uk/10.3390/nano12030385
Note that from the first issue of 2016, this journal uses article numbers instead of page numbers. See further details here.