
Controllability of Graphene Oxide Doxorubicin Loading Capacity Based on Density Functional Theory

 , ,
, , 
Abstract
:
1. Introduction
2. Materials and Methods
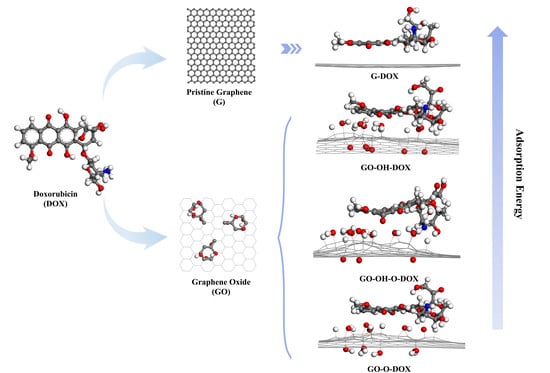
2.1. Model Building
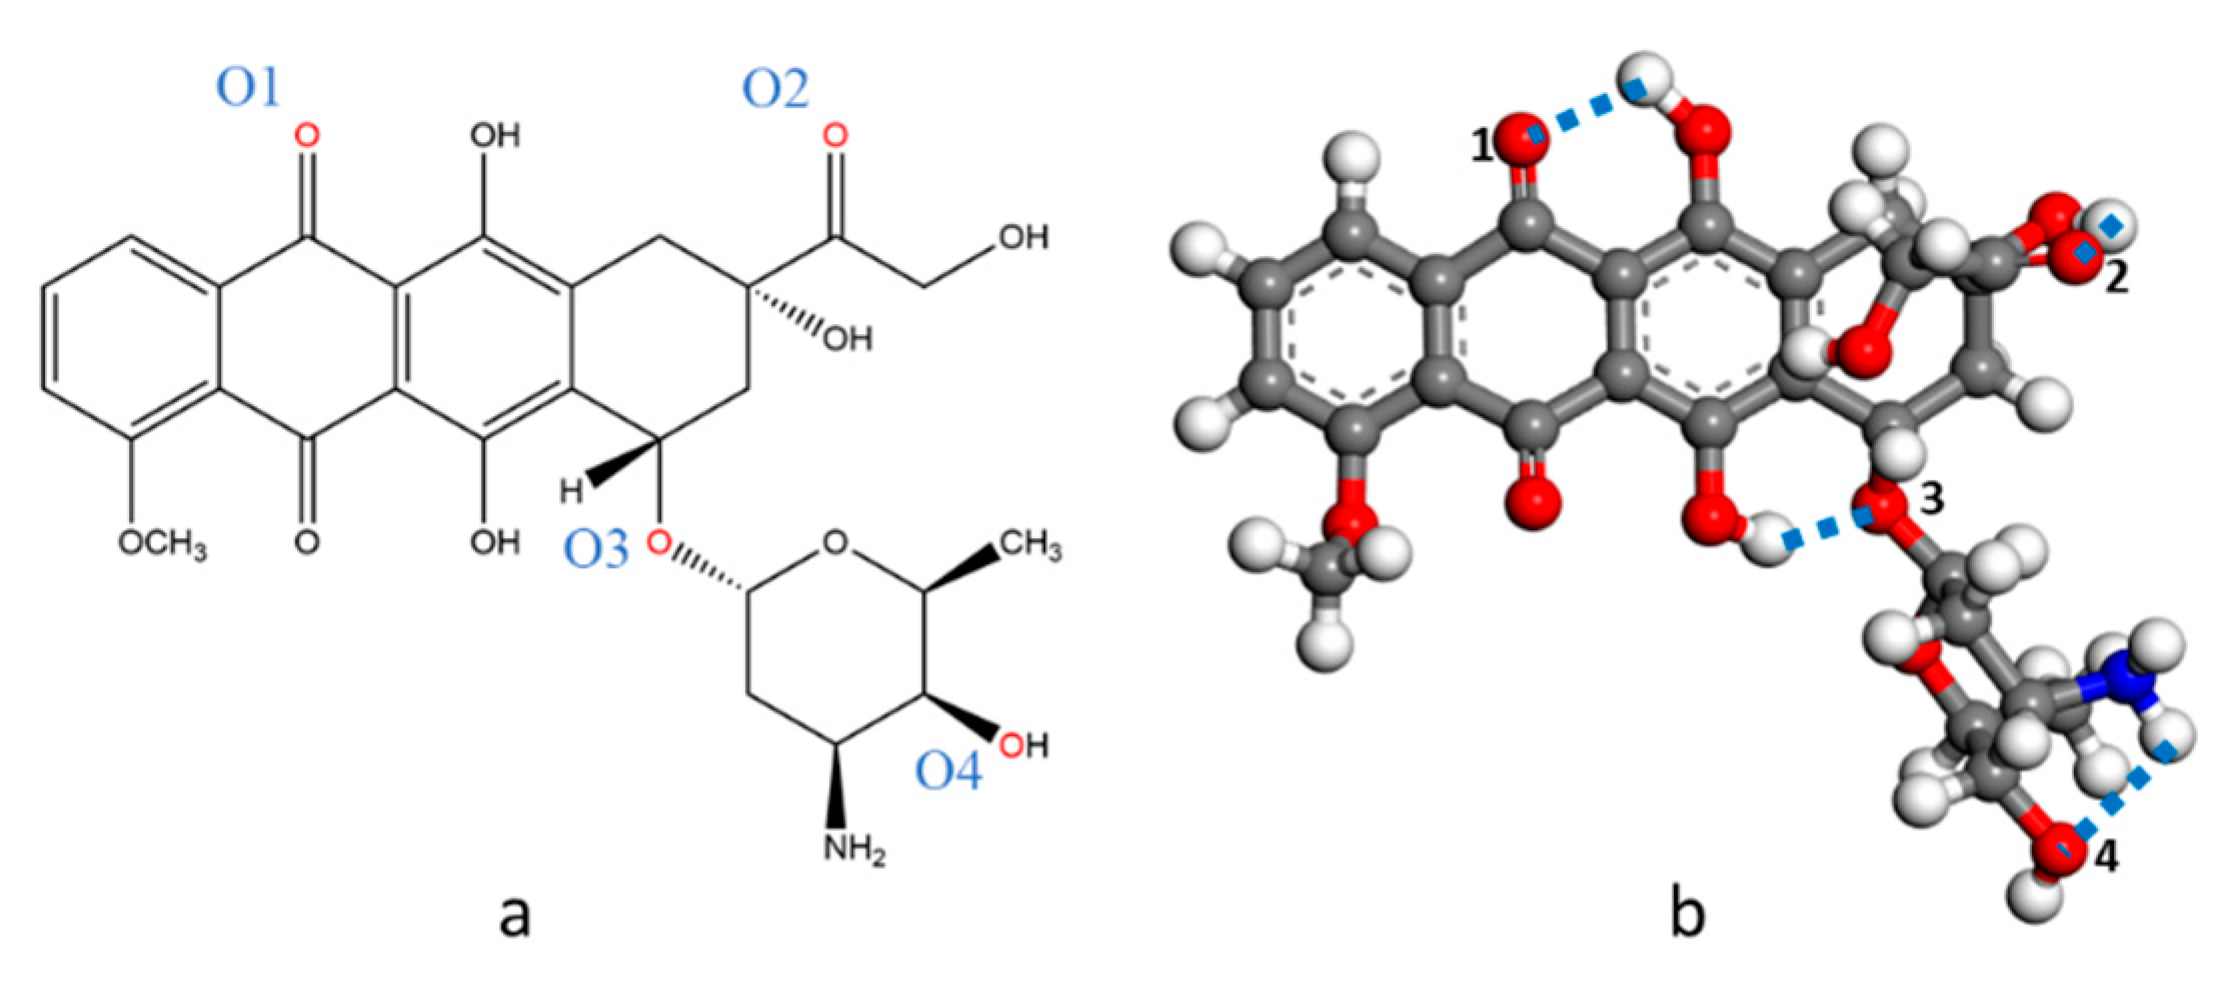
2.1.1. DOX
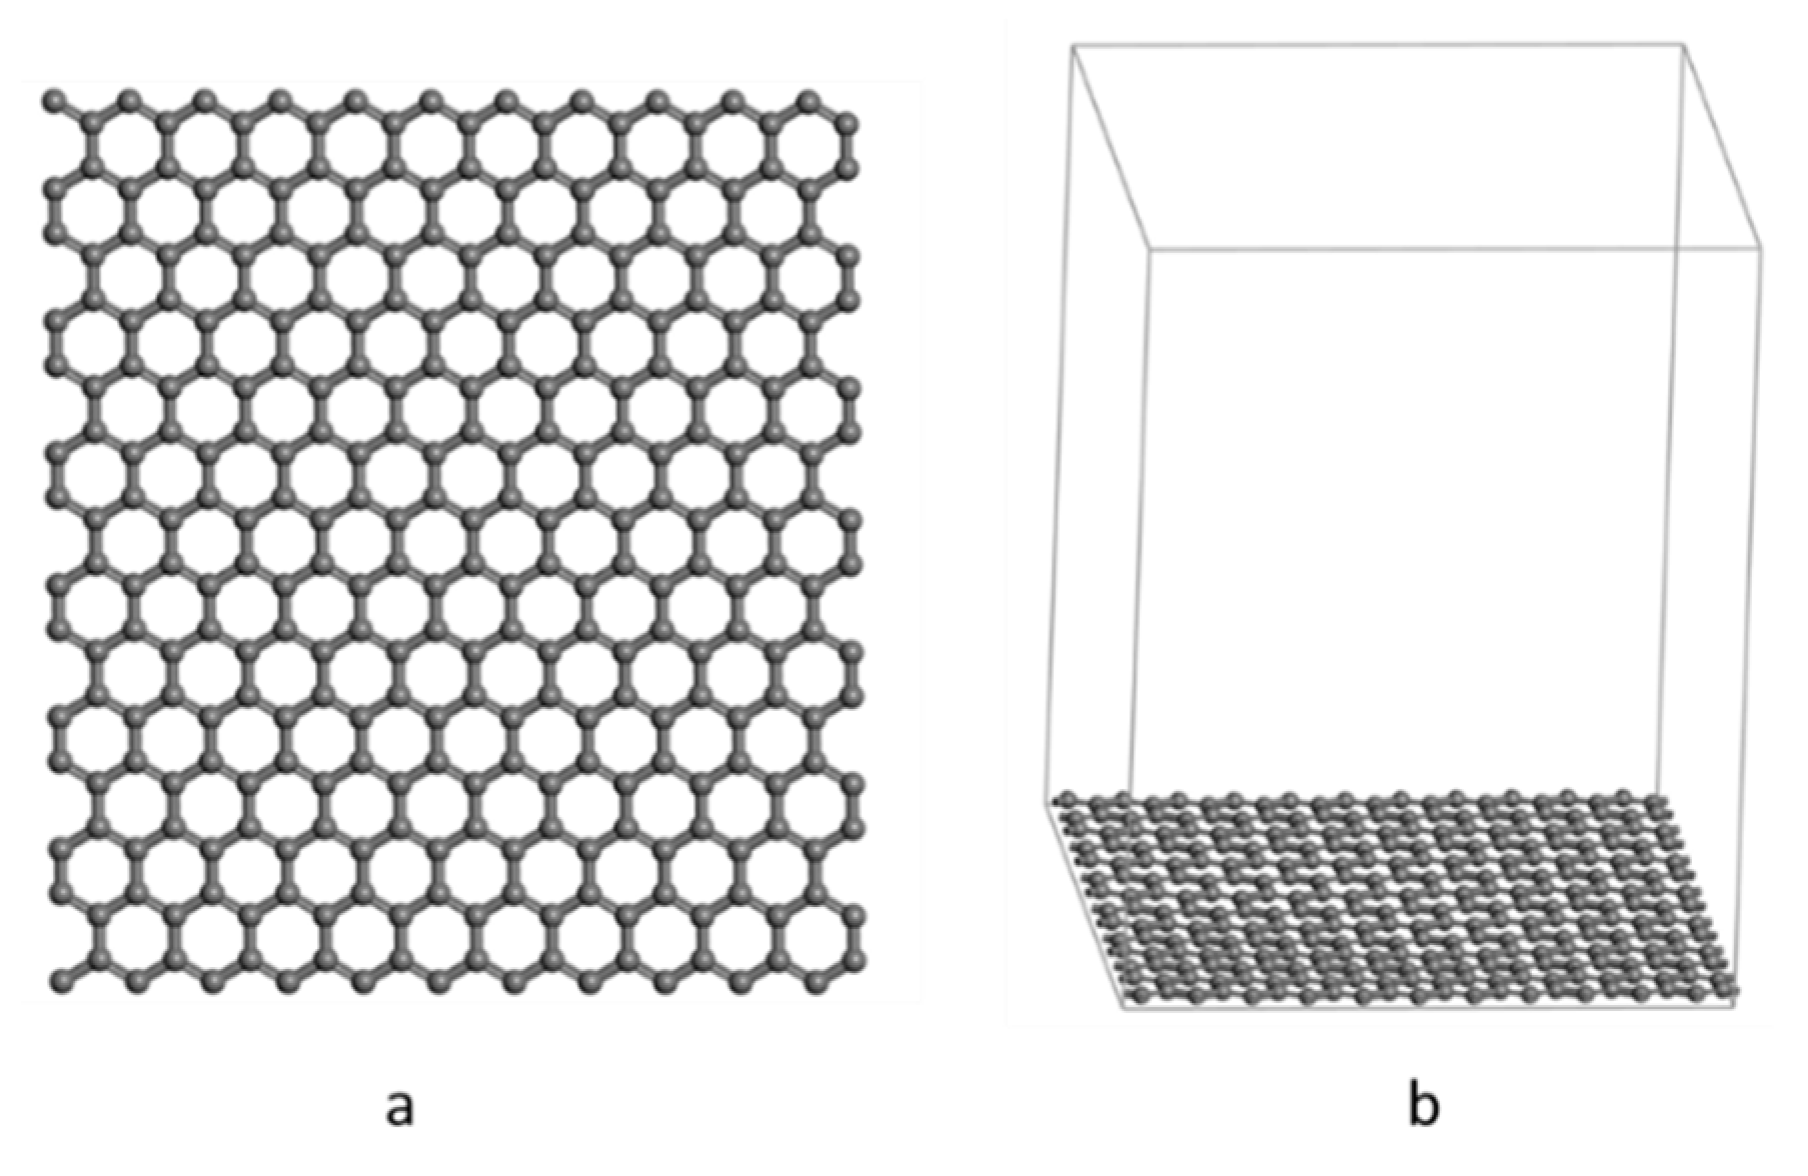
2.1.2. Pristine Graphene
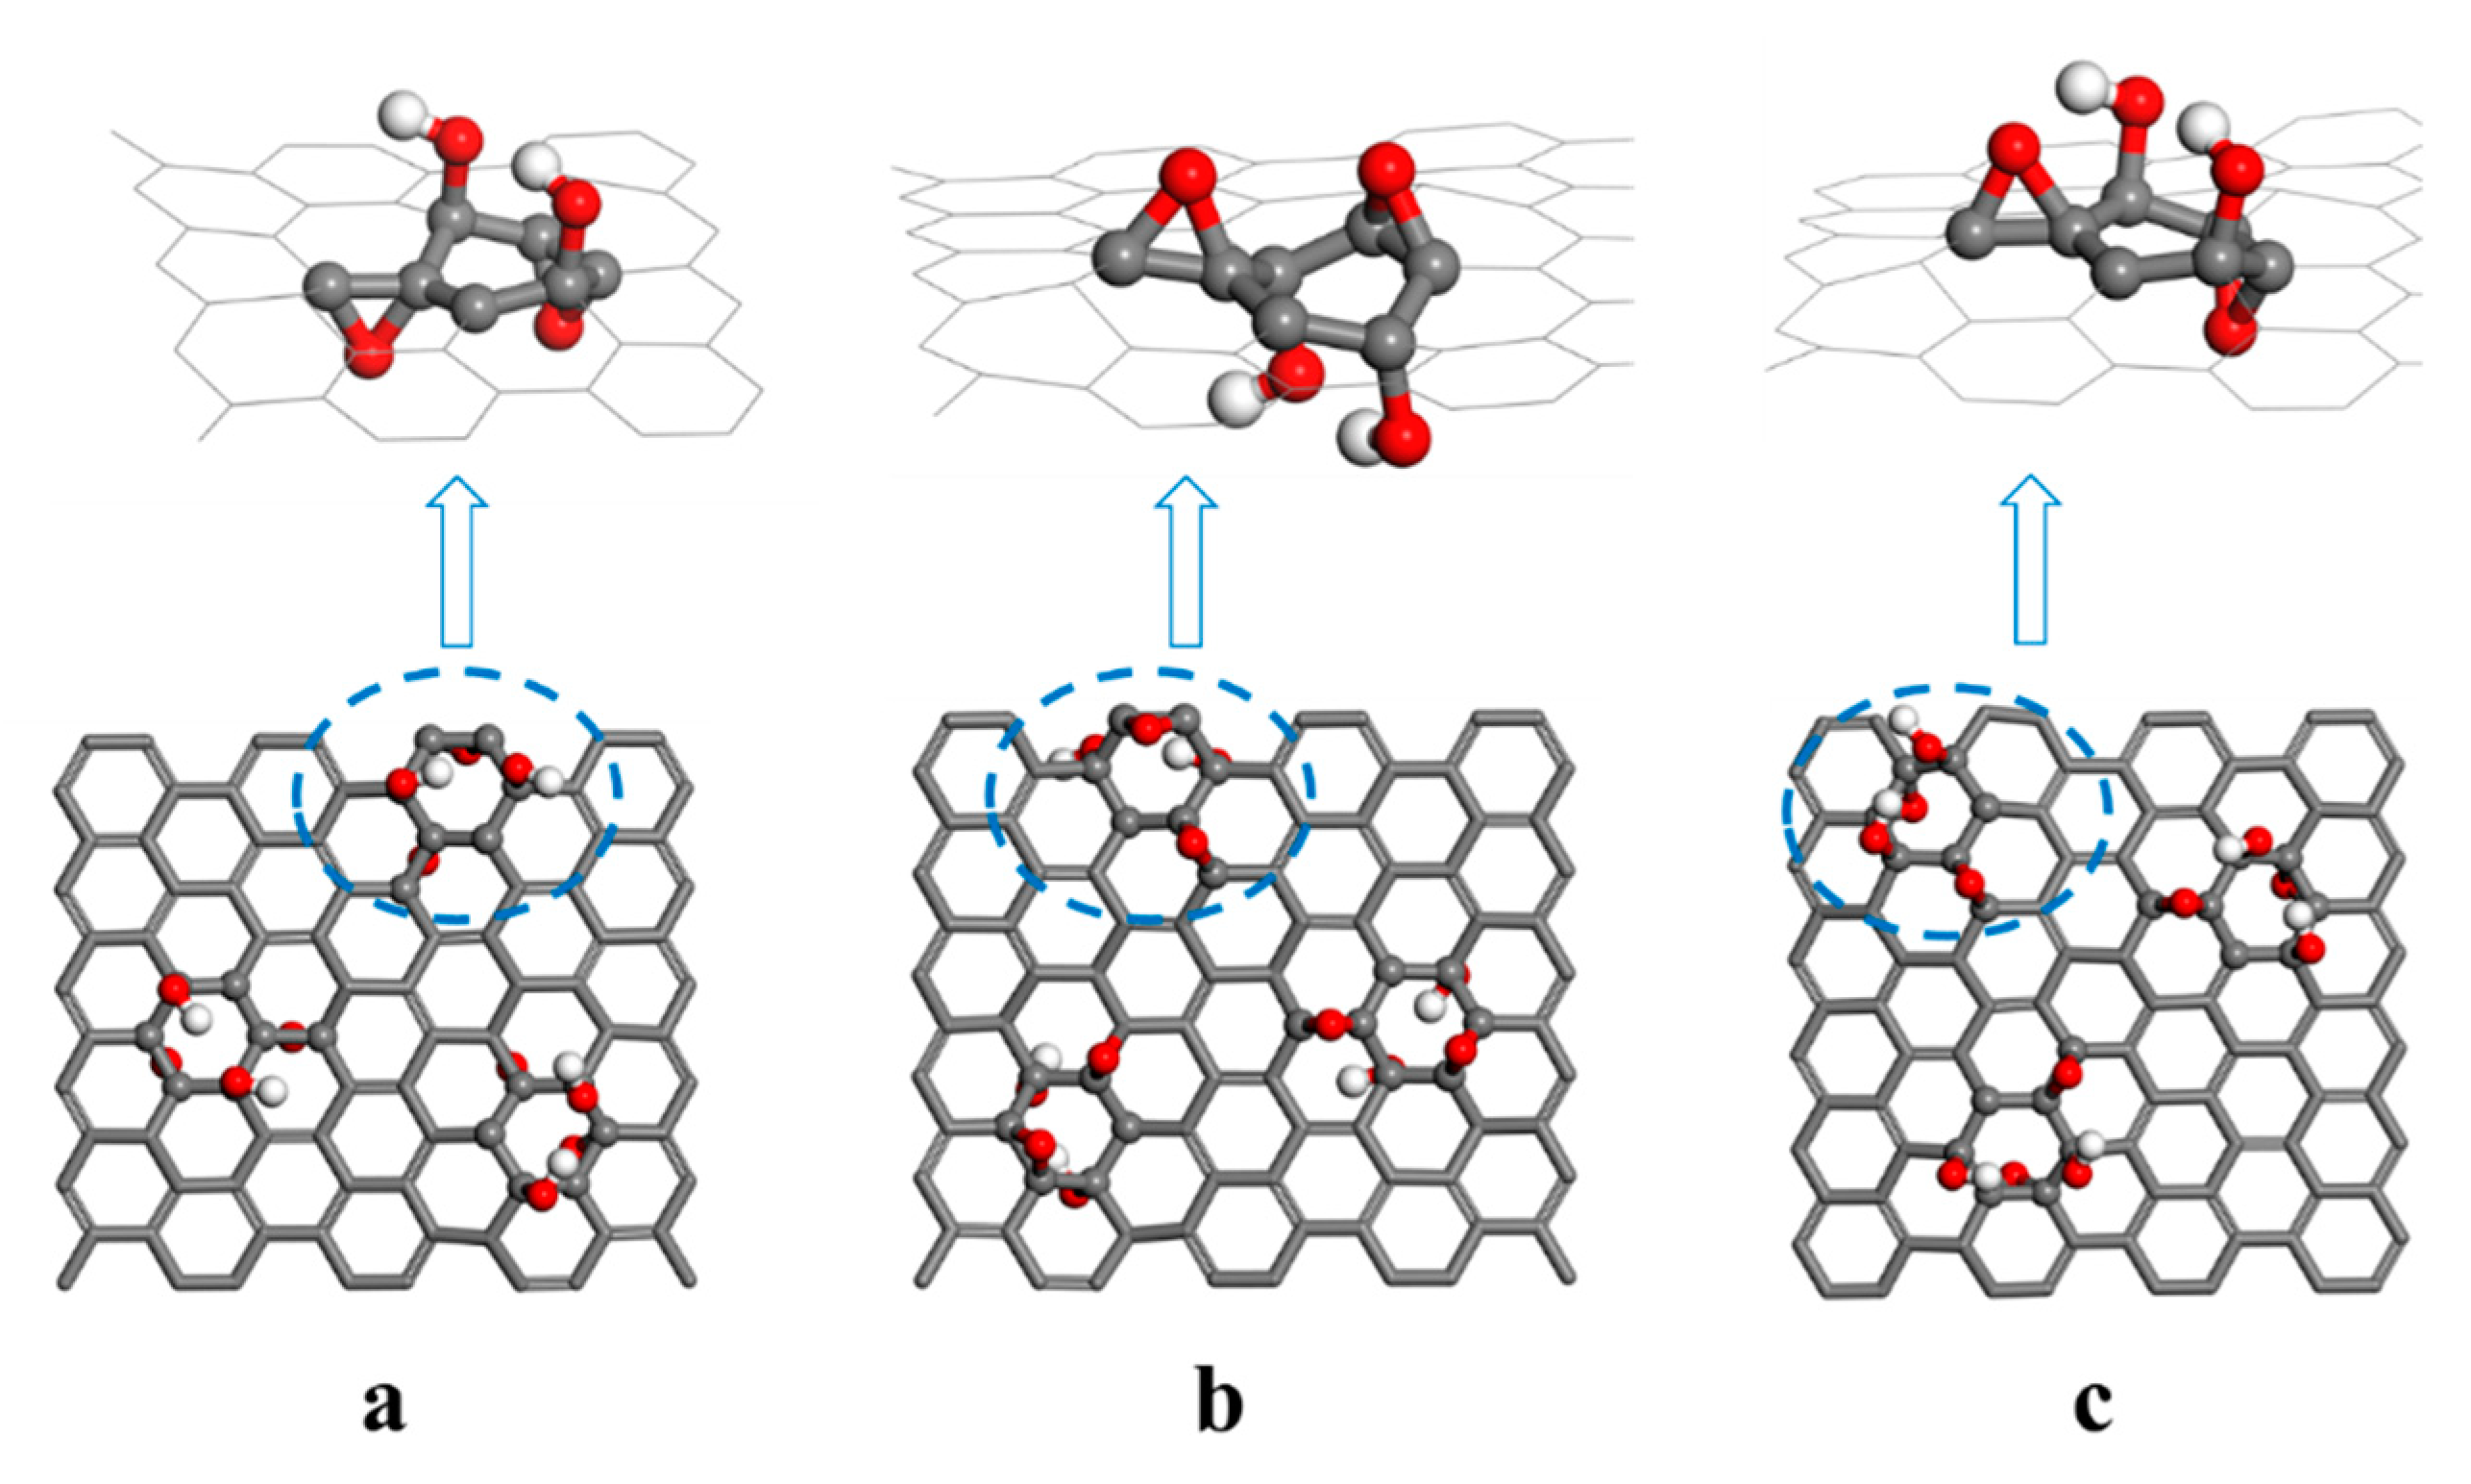
2.1.3. GO
2.2. Molecular Dynamics Simulation
2.3. Structure Optimization
2.4. Adsorption Energy
2.5. Reduced Density Gradient (RDG) Analysis
2.6. Charge Density Difference Analysis
3. Results and Discussion
3.1. Structure and Energy Analysis
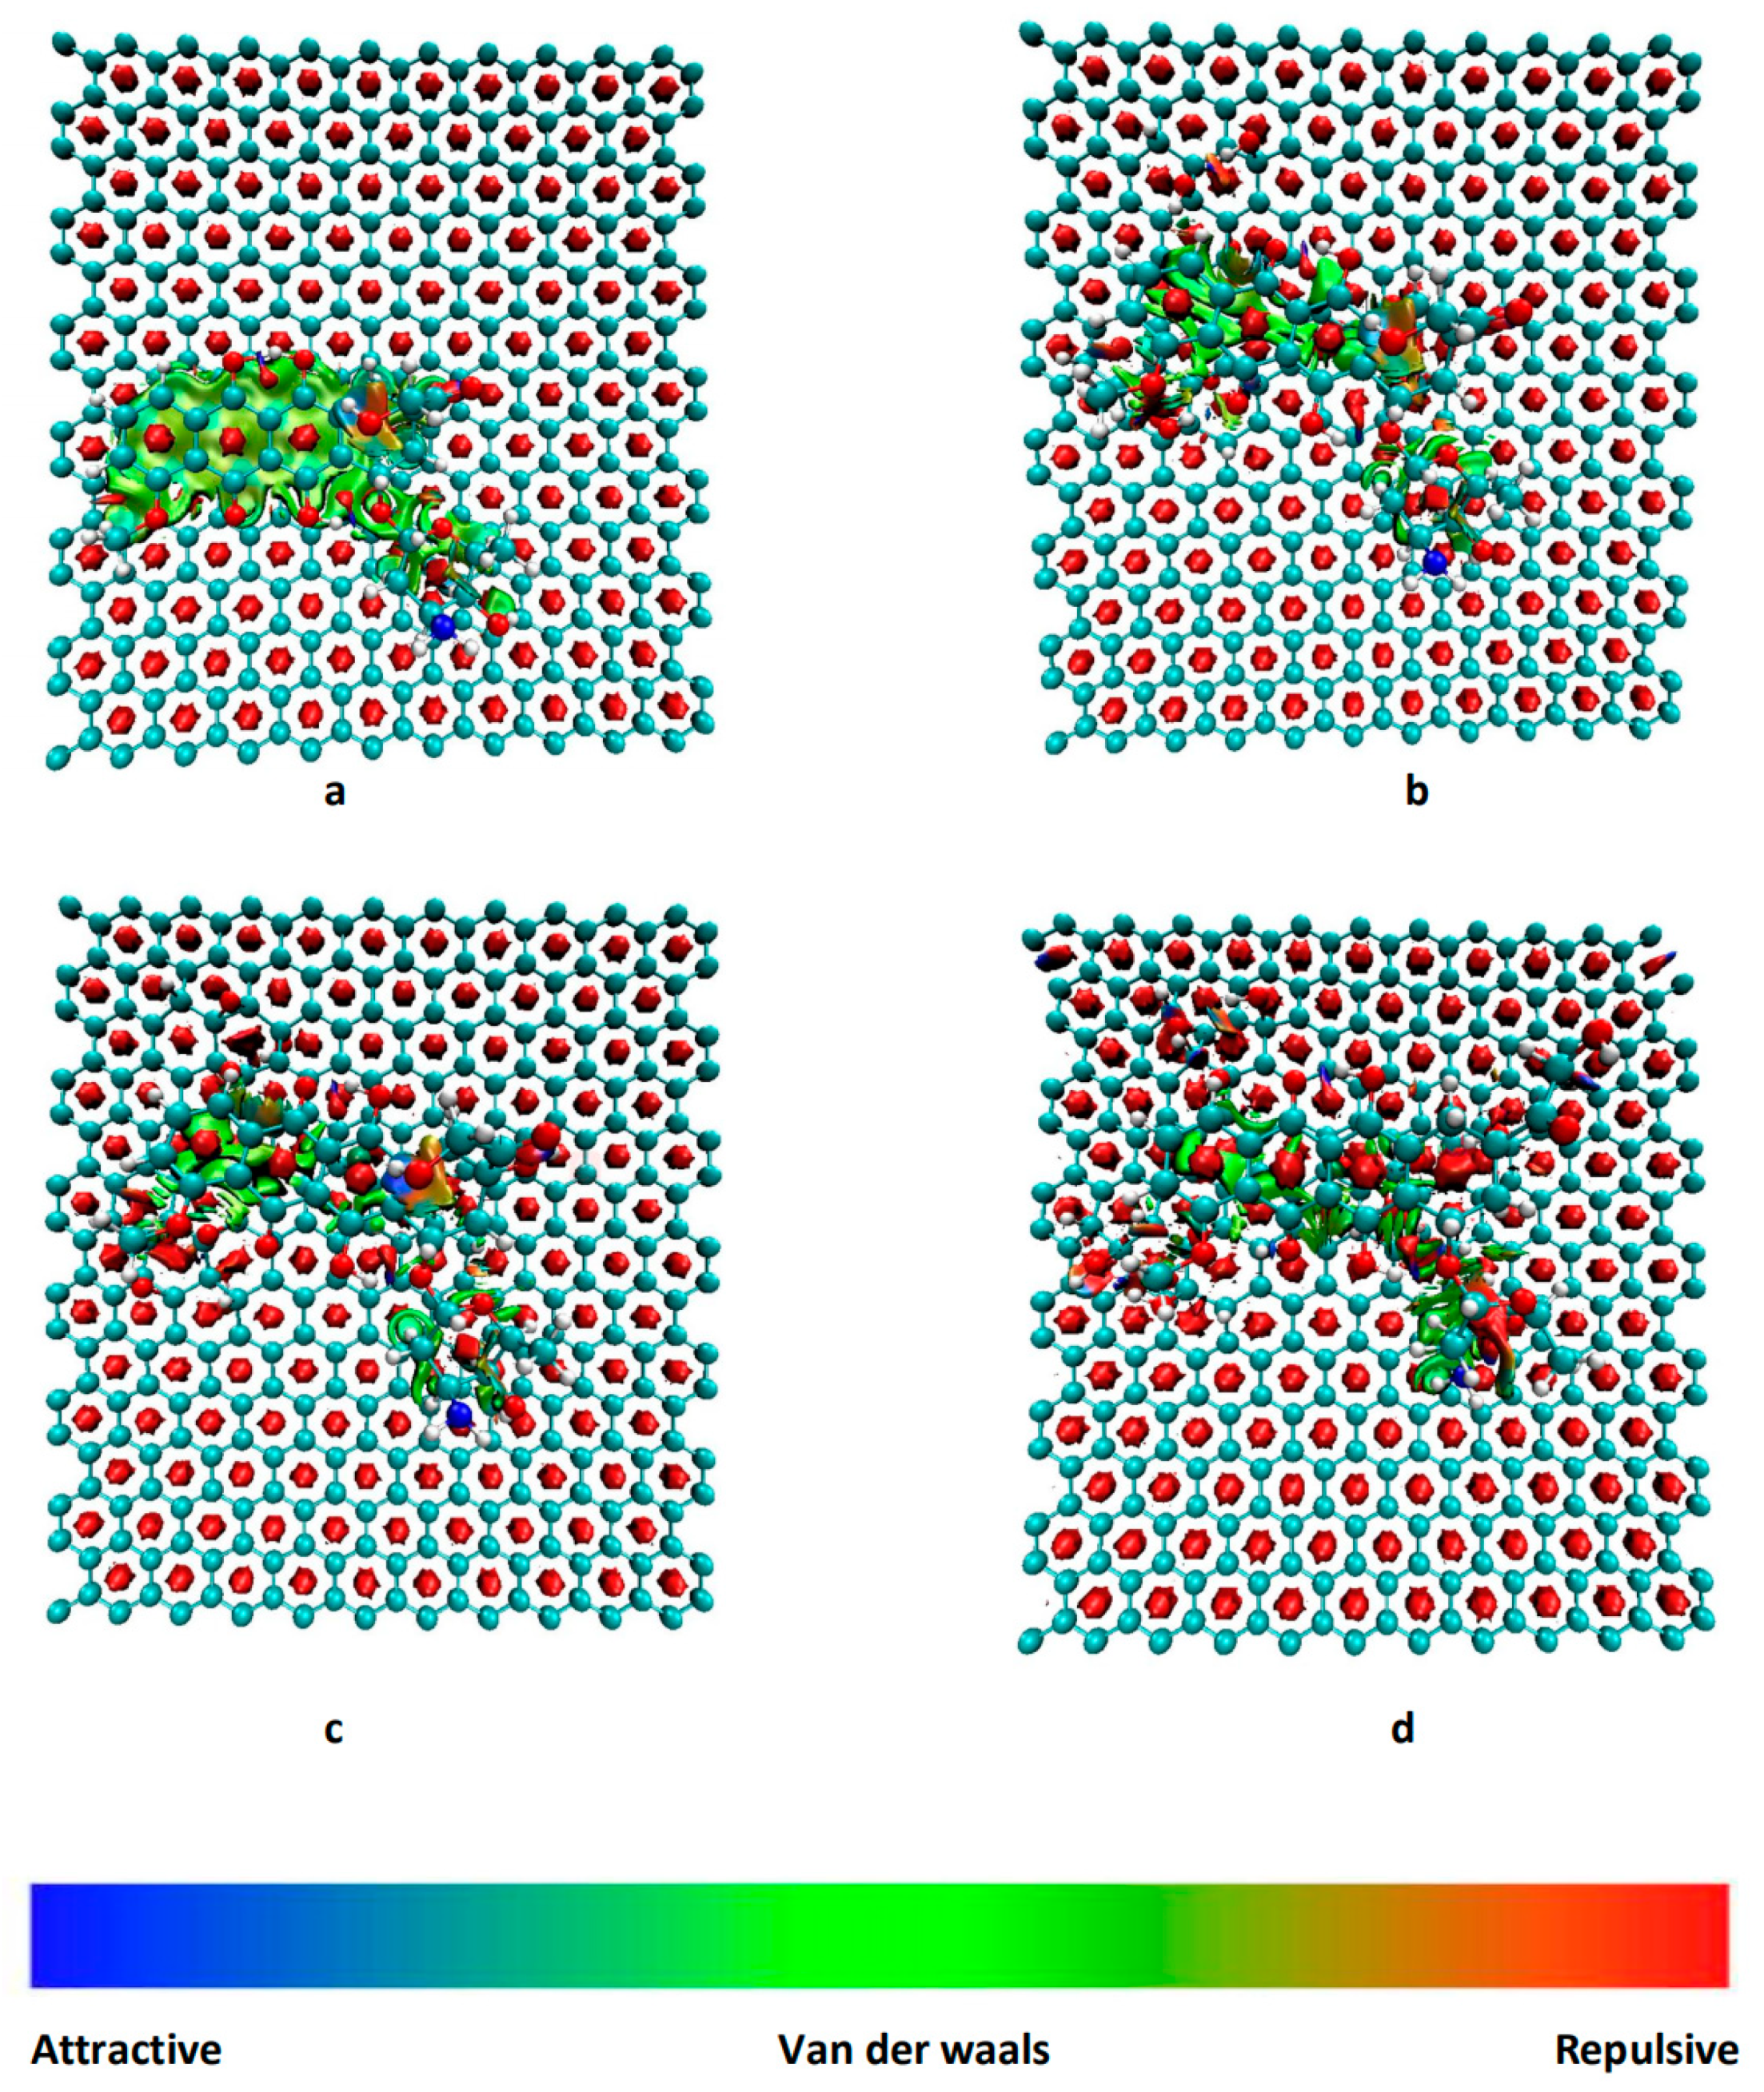
3.2. RDG Analysis
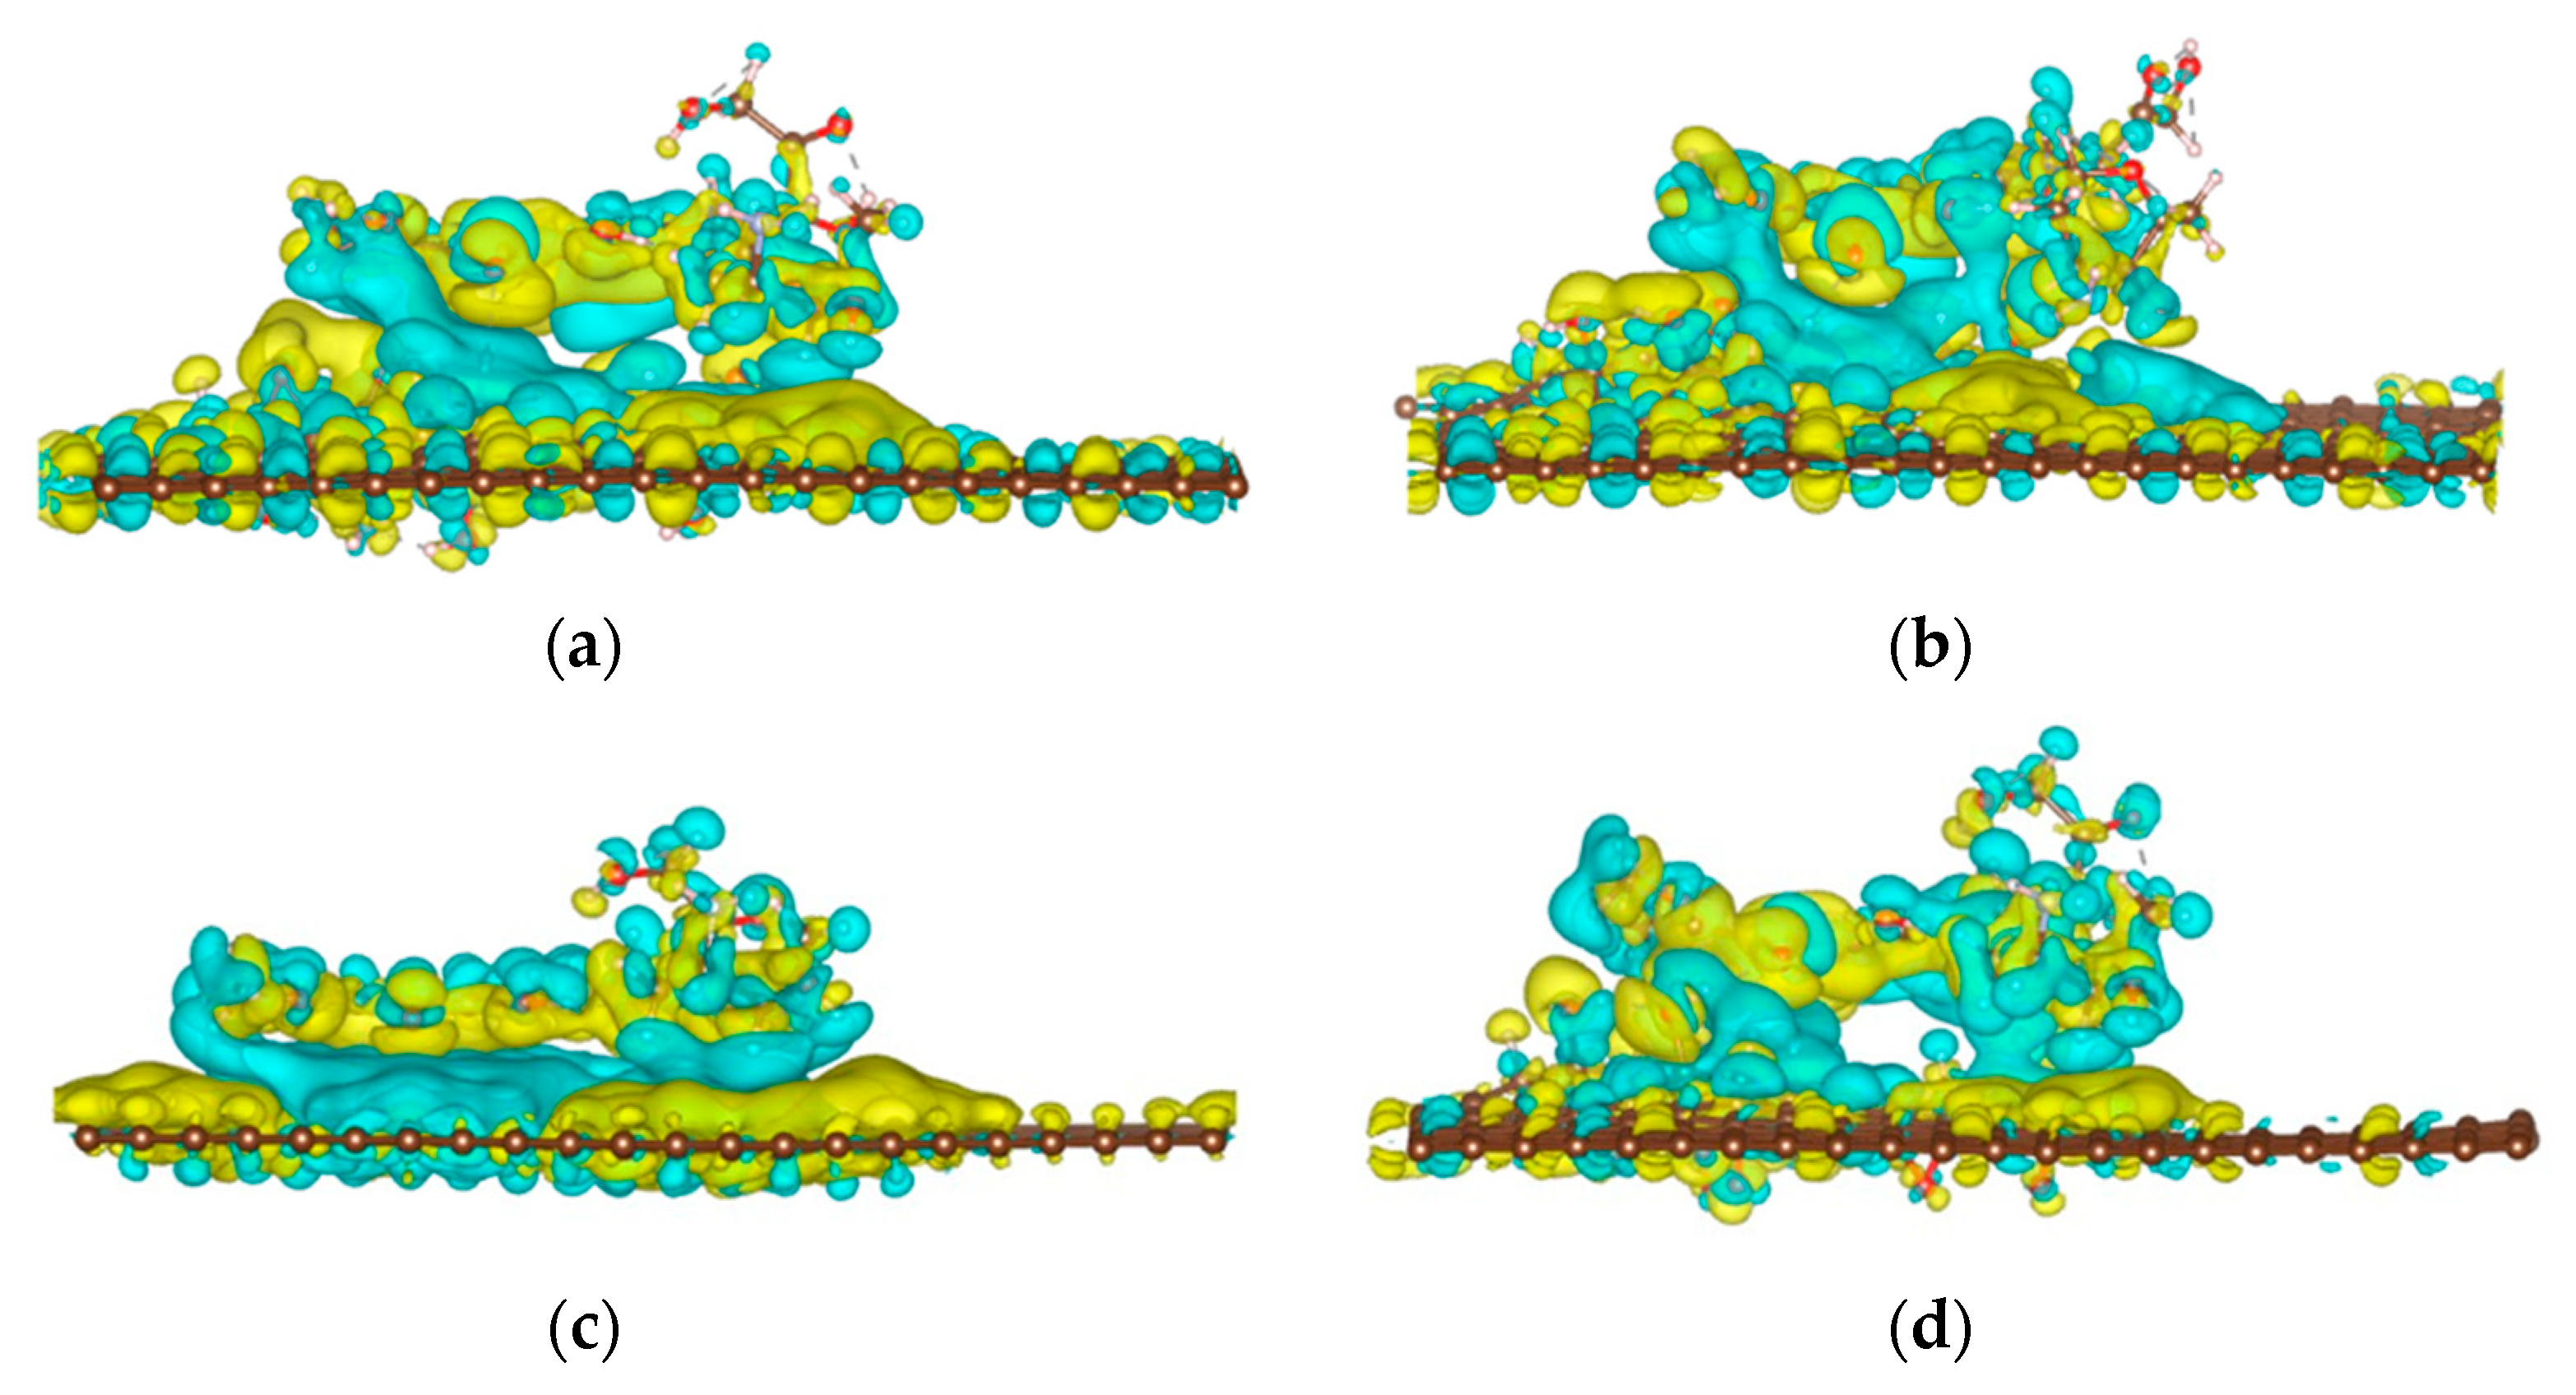
3.3. Charge Density Difference
4. Conclusions
Author Contributions
Funding
Institutional Review Board Statement
Informed Consent Statement
Data Availability Statement
Conflicts of Interest
References
- Xie, L.; Wang, H.; Jin, C.; Wang, X.; Jiao, L.; Suenaga, K.; Dai, H. Graphene nanoribbons from unzipped carbon nanotubes: Atomic structures, Raman spectroscopy, and electrical properties. J. Am. Chem. Soc. 2011, 133, 10394–10397. [Google Scholar] [CrossRef] [PubMed] [Green Version]
- Tonel, M.Z.; Martins, M.O.; Zanella, I.; Pontes, R.B.; Fagan, S.B. A first-principles study of the interaction of doxorubicin with graphene. Comput. Theor. Chem. 2017, 1115, 270–275. [Google Scholar] [CrossRef]
- Feng, L.; Liu, Z. Graphene in biomedicine: Opportunities and challenges. Nanomedicine 2011, 6, 317–324. [Google Scholar] [CrossRef] [PubMed]
- Geim, A.K.; Novoselov, K.S. The rise of graphene. Nat. Mater. 2007, 6, 183–191. [Google Scholar] [CrossRef]
- Vovusha, H.; Banerjee, D.; Yadav, M.K.; Perrozzi, F.; Ottaviano, L.; Sanyal, S.; Sanyal, B. Binding characteristics of anticancer drug doxorubicin with two-dimensional graphene and graphene oxide: Insights from density functional theory calculations and fluorescence spectroscopy. J. Phys. Chem. C 2018, 122, 21031–21038. [Google Scholar] [CrossRef]
- Seabra, A.B.; Paula, A.J.; de Lima, R.; Alves, O.L.; Durán, N. Nanotoxicity of graphene and graphene oxide. Chem. Res. Toxicol. 2014, 27, 159–168. [Google Scholar] [CrossRef]
- Yu, W.; Sisi, L.; Haiyan, Y.; Jie, L. Progress in the functional modification of graphene/graphene oxide: A review. RSC Adv. 2020, 10, 15328–15345. [Google Scholar] [CrossRef]
- Trusek, A.; Kijak, E.; Granicka, L. Graphene Oxide as a Potential Drug Carrier—Chemical Carrier Activation, Drug Attachment and Its Enzymatic Controlled Release. Mater. Sci. Eng. C 2020, 116, 111240. [Google Scholar] [CrossRef]
- Guo, Y.-N.; Lu, X.; Weng, J.; Leng, Y. Density Functional Theory Study of the Interaction of Arginine-Glycine-Aspartic Acid with Graphene, Defective Graphene, and Graphene Oxide. J. Phys. Chem. C 2013, 117, 5708–5717. [Google Scholar] [CrossRef]
- Mu, S.; Li, G.; Liang, Y.; Wu, T.; Ma, D. Hyperbranched Polyglycerol-Modified Graphene Oxide as an Efficient Drug Carrier with Good Biocompatibility. Mater. Sci. Eng. C 2017, 78, 639–646. [Google Scholar] [CrossRef]
- Sun, S.; Song, J.; Cui, N.; Kwon, M.Z.; Cai, H.; Lee, E.S.; Jiang, H.B. Research of Weak Interaction between Water and Different Monolayer Graphene Systems. J. Mol. Graph. Model. 2021, 104, 107835. [Google Scholar] [CrossRef] [PubMed]
- Liu, Z.; Robinson, J.T.; Sun, X.; Dai, H. Pegylated Nanographene Oxide for Delivery of Water-Insoluble Cancer Drugs. J. Am. Chem. Soc. 2008, 130, 10876–10877. [Google Scholar] [CrossRef] [PubMed] [Green Version]
- Yang, X.; Zhang, X.; Liu, Z.; Ma, Y.; Huang, Y.; Chen, Y. High-Efficiency Loading and Controlled Release of Doxorubicin Hydrochloride on Graphene Oxide. J. Phys. Chem. C 2008, 112, 17554–17558. [Google Scholar] [CrossRef]
- Karimzadeh, S.; Safaei, B.; Jen, T. Theorical Investigation of Adsorption Mechanism of Doxorubicin Anticancer Drug on the Pris-tine and Functionalized Single-Walled Carbon Nanotube Surface as a Drug Delivery Vehicle: A DFT Study. J. Mol. Liq. 2021, 322, 114890. [Google Scholar] [CrossRef]
- Etrych, T.; Daumová, L.; Pokorná, E.; Tušková, D.; Lidický, O.; Kolářová, V.; Pankrác, J.; Šefc, L.; Chytil, P.; Klener, P. Effective Doxorubicin-Based Nano-Therapeutics for Simultaneous Malignant Lymphoma Treatment and Lymphoma Growth Imaging. J. Control. Release 2018, 289, 44–55. [Google Scholar] [CrossRef]
- O’Shaughnessy, J.A. Pegylated Liposomal Doxorubicin in the Treatment of Breast Cancer. Clin. Breast Cancer 2003, 4, 318–328. [Google Scholar] [CrossRef]
- Ragab, A.H.; Sutow, W.W.; Komp, D.M.; Starling, K.A.; Lyon, G.M., Jr.; George, S. Adriamycin in the treatment of childhood acute leukemia a southwest oncology group study. Cancer 1975, 36, 1223–1226. [Google Scholar] [CrossRef]
- Kiyomiya, K.; Matsuo, S.; Kurebe, M. Differences in intracellular sites of action of Adriamycin in neoplastic and normal differentiated cells. Cancer Chemother. Pharmacol. 2001, 47, 51–56. [Google Scholar] [CrossRef]
- Deline, A.R.; Frank, B.P.; Smith, C.L.; Sigmon, L.R.; Wallace, A.N.; Gallagher, M.J.; Goodwin, D.G.; Durkin, D.P.; Fairbrother, D.H. Influence of Oxygen-Containing Functional Groups on the Environmental Properties, Transformations, and Toxicity of Carbon Nanotubes. Chem. Rev. 2020, 120, 11651–11697. [Google Scholar] [CrossRef]
- Majeed, W.; Bourdo, S.; Petibone, D.M.; Saini, V.; Vang, K.B.; Nima, Z.A.; Alghazali, K.M.; Darrigues, E.; Ghosh, A.; Watanabe, F.; et al. The role of surface chemistry in the cytotoxicity profile of graphene. J. Appl. Toxicol. 2017, 37, 462–470. [Google Scholar] [CrossRef]
- Lerf, A.; He, H.; Forster, M.; Klinowski, J. Structure of Graphite Oxide Revisited. J. Phys. Chem. B 1998, 102, 4477–4482. [Google Scholar] [CrossRef]
- Gao, W.; Alemany, L.B.; Ci, L.; Ajayan, P.M. New insights into the structure and reduction of graphite oxide. Nat. Chem. 2009, 1, 403–408. [Google Scholar] [CrossRef] [PubMed]
- Ghaderi, N.; Peressi, M. First-Principle Study of Hydroxyl Functional Groups on Pristine, Defected Graphene, and Graphene Epoxide. J. Phys. Chem. C 2010, 114, 21625–21630. [Google Scholar] [CrossRef]
- Tang, S.; Cao, Z. Adsorption of nitrogen oxides on graphene and graphene oxides: Insights from density functional calculations. J. Chem. Phys. 2011, 134, 044710. [Google Scholar] [CrossRef] [PubMed]
- Lippert, G.; Hutter, J.; Parrinello, M. A hybrid Gaussian and plane wave density functional scheme. Mol. Phys. 2010, 92, 477–487. [Google Scholar] [CrossRef]
- Krack, M. Pseudopotentials for H to Kr for gradient-corrected exchange-correlation functionals. Theor. Chem. Acc. 2005, 114, 145–152. [Google Scholar] [CrossRef] [Green Version]
- Hartwigsen, C.; Goedecker, S.; Hutter, J. Relativistic separable dual-space Gaussian Pseudopotentials from H to Rn. Phys. Rev. B 1998, 58, 3641–3662. [Google Scholar] [CrossRef] [Green Version]
- Perdew, J.P.; Burke, K.; Ernzerhof, M. Generalized gradient approximation made simple. Phys. Rev. Lett. 1996, 77, 3865–3868. [Google Scholar] [CrossRef] [Green Version]
- Grimme, S.; Antony, J.; Ehrlich, S.; Krieg, H. A consistent and accurate ab initio parametrization of density functional dispersion correction (DFT-D) for the 94 elements H-Pu. J. Chem. Phys. 2010, 132, 154104. [Google Scholar] [CrossRef] [Green Version]
- Johnson, E.R.; Keinan, S.; Mori-Sánchez, P.; Contreras-García, J.; Cohen, A.J.; Yang, W. Revealing noncovalent interactions. J. Am. Chem. Soc. 2010, 132, 6498–6506. [Google Scholar] [CrossRef] [Green Version]
- Lu, T.; Chen, F. Multiwfn: A multifunctional wavefunction analyzer. J. Comput. Chem. 2012, 33, 580–592. [Google Scholar] [CrossRef] [PubMed]
- Safdari, F.; Raissi, H.; Shahabi, M.; Zaboli, M. DFT calculations and molecular dynamics simulation study on the adsorption of 5-fluorouracil anticancer drug on graphene oxide nanosheet as a drug delivery vehicle. J. Inorg. Organomet. Polym. Mater. 2017, 27, 805–817. [Google Scholar] [CrossRef]
- Vovusha, H.; Sanyal, S.; Sanyal, B. Interaction of nucleobases and aromatic amino acids with graphene oxide and graphene flakes. J. Phys. Chem. Lett. 2013, 4, 3710–3718. [Google Scholar] [CrossRef]


| Models | ||||
|---|---|---|---|---|
| G-DOX * | −57,483.232 | −57,480.219 | −47,764.498 | −3.013 |
| GO-OH-DOX | −62,918.418 | −62,915.918 | −53,199.578 | −2.501 |
| GO-O-DOX | −62,918.477 | −62,915.652 | −53,199.578 | −2.825 |
| GO-OH-O-DOX | −62,916.538 | −62,913.910 | −53,198.480 | −2.628 |
| Models | O1·········· ·H | O2··· ···H | O3··· ···H | O4······ ···H | N··· ···H |
|---|---|---|---|---|---|
| DOX | 1.812 | 1.986 | 1.738 | 2.305 | - |
| G-DOX | 1.501 | 1.906 | 1.648 | 2.426 | - |
| GO-OH-DOX | 1.598 | 1.869 | 1.753 | 2.370 | - |
| GO-O-DOX | 1.515 | 1.826 | 1.682 | 2.373 | - |
| GO-OH-O-DOX | 1.551 | 2.039 | 1.626 | - | 1.903 |
Publisher’s Note: MDPI stays neutral with regard to jurisdictional claims in published maps and institutional affiliations. |
© 2022 by the authors. Licensee MDPI, Basel, Switzerland. This article is an open access article distributed under the terms and conditions of the Creative Commons Attribution (CC BY) license (https://creativecommons.org/licenses/by/4.0/).
Share and Cite
Song, J.; Cui, N.; Sun, S.; Lu, X.; Wang, Y.; Shi, H.; Lee, E.-S.; Jiang, H.-B. Controllability of Graphene Oxide Doxorubicin Loading Capacity Based on Density Functional Theory. Nanomaterials 2022, 12, 479. https://0-doi-org.brum.beds.ac.uk/10.3390/nano12030479
Song J, Cui N, Sun S, Lu X, Wang Y, Shi H, Lee E-S, Jiang H-B. Controllability of Graphene Oxide Doxorubicin Loading Capacity Based on Density Functional Theory. Nanomaterials. 2022; 12(3):479. https://0-doi-org.brum.beds.ac.uk/10.3390/nano12030479
Chicago/Turabian StyleSong, Jiaming, Naiyu Cui, Shixun Sun, Xinyue Lu, Yuxuan Wang, Haoyu Shi, Eui-Seok Lee, and Heng-Bo Jiang. 2022. "Controllability of Graphene Oxide Doxorubicin Loading Capacity Based on Density Functional Theory" Nanomaterials 12, no. 3: 479. https://0-doi-org.brum.beds.ac.uk/10.3390/nano12030479