Article

Hydrogenated Amorphous Titania with Engineered Surface Oxygen Vacancy for Efficient Formaldehyde and Dye Removals under Visible-Light Irradiation

1
School of Optical-Electrical and Computer Engineering, University of Shanghai for Science and Technology, Shanghai 200093, China
2
Chongqing Key Laboratory of Precision Optics, Chongqing Institute of East China Normal University, Chongqing 401120, China
3
State Key Laboratory of Precision Spectroscopy, East China Normal University, Shanghai 200062, China
*
Author to whom correspondence should be addressed.
Submission received: 5 January 2022 / Revised: 11 February 2022 / Accepted: 16 February 2022 / Published: 22 February 2022
(This article belongs to the Special Issue State-of-the-Art Nanophotonic and Optical Nanomaterials in China)

Abstract

:
Hydrogenated crystalized TiO2−x with oxygen vacant (OV) doping has attracted considerable attraction, owing to its impressive photoactivity. However, amorphous TiO2, as a common allotrope of titania, is ignored as a hydrogenated templet. In this work, hydrogenated amorphous TiO2−x (HAm-TiO2−x) with engineered surface OV and high surface area (176.7 cm2 g−1) was first prepared using a unique liquid plasma hydrogenation strategy. In HAm-TiO2−x, we found that OV was energetically retained in the subsurface region; in particular, the subsurface OV-induced energy level preferred to remain under the conduction band (0.5 eV) to form a conduction band tail and deep trap states, resulting in a narrow bandgap (2.36 eV). With the benefits of abundant light absorption and efficient photocarrier transportation, HAm-TiO2−x coated glass has demonstrated superior visible-light-driven self-cleaning performances. To investigate its formaldehyde photodegradation under harsh indoor conditions, HAm-TiO2−x was used to decompose low-concentration formaldehyde (~0.6 ppm) with weak-visible light (λ = 600 nm, power density = 0.136 mW/cm2). Thus, HAm-TiO2−x achieved high quantum efficiency of 3 × 10⁻⁶ molecules/photon and photoactivity of 92.6%. The adsorption capabilities of O2 (−1.42 eV) and HCHO (−1.58 eV) in HAm-TiO2−x are both largely promoted in the presence of subsurface OV. The surface reaction pathway and formaldehyde decomposition mechanism over HAm-TiO2−x were finally clarified. This work opened a promising way to fabricate hydrogenated amorphous photocatalysts, which could contribute to visible-light-driven photocatalytic environmental applications.

Graphical Abstract

1. Introduction

As a promising and environmentally-friend photocatalyst, titanium dioxide (TiO2) has gained widespread traction in the past few decades [1,2,3,4,5]. In order to pursue the best performance in solar energy conversion and utilization, one of the most effective approaches in tuning the band structure and maximizing solar energy capture is OV defect engineering of TiO2 [6,7,8,9]. Among considerable strategies in OV defect engineering, the most representative and effective one is thermal hydrogenation of crystallized TiO2, which promotes the generation of OV-doped disordered surface at crystalline TiO2, i.e., a disordered surface at the crystalline core [9,10,11,12]. This unique configuration not only provides additional OV-induced states to absorb long-wavelength light, thereby enabling colorful TiO2−x, but also encourages photoinduced charge separation to achieve superior visible-light photoactivity [13,14,15]. To obtain photocatalysts with superior efficiency, the polymorph modifications of crystalline titanium dioxide also attracted much attention [16,17]. Alternatively, compared with crystalline TiO2, amorphous TiO2, which also exhibits an intrinsic narrow bandgap, thermodynamic metastability, and a large surface area, should be a great promising templet for surface hydrogenation [18,19,20]. Nevertheless, inherent drawbacks, including large quantities of bulk defects and inferior solar energy conversion eliminate this possibility. Theoretically, hydrogenated amorphous TiO2−x (HAm-TiO2−x) ought to have a narrower bandgap and more surface-OV-induced active sites, which are the crucial factors for high-visible photoactivity. However, in practice, thermal hydrogenation using amorphous TiO2 is ineluctable to require a long annealing process, which completely transforms the product into hydrogenated crystalline TiO2−x and easily erases the surface OV. Given the above challenges in the synthesis theory and technology, hydrogenation of pure amorphous phase TiO2 has so far scarcely succeeded. Considering these aspects, the goal of this work is to prepare HAm-TiO2−x with an OV-doped disordered surface (disordered surface at the amorphous core) and, particularly, to reveal the fundamental mechanism of the correlation between OV concentration and distribution, electrical structure, optical response, reactive oxygen species (ROS) generation, and its photoactivity, which can discover uncommon electrical and optical properties of HAm-TiO2−x better than traditional hydrogenated crystalline TiO2−x.
Formaldehyde, one of the most common indoor air pollutions, is highly poisonous and carcinogenic and is an immense threat to human health [21,22]. Photocatalytic formaldehyde purification is an efficient and safe method that can completely decompose formaldehyde into carbon dioxide and water [23,24,25,26,27]. Current studies on photocatalytic formaldehyde photodegradation are mainly focused on reaction mechanisms, such as peculiar formaldehyde physicochemical adsorption models and complex reaction pathways. In particular, they are focused on the synthesis of advanced photocatalysts with superior formaldehyde degradation performance under standard and ideal experimental conditions, including high power density of UV light source, high concentration formaldehyde, as well as high reaction temperature and pressure. However, in a practical indoor environment the situation is completely inverse: a practical indoor environment provides low-concentration formaldehyde (0.2–0.5 ppm), a weak-visible-light illumination (0.1–0.3 mW/cm2), and indoor temperature (25 °C). Photocatalysts with inferior visible-light response and photocarrier transferring cannot actively work under these conditions. More importantly, the ambient durability of photocatalysts should be stressed because of surface fouling/deactivation induced by dust and aerosol particles [28,29]. Herein, a photocatalyst must possess strong visible-light-driven photoactivity, a straightforward reaction pathway, and a self-cleaning surface with long-term stability. With the advantages of narrow bandgap, large specific surface area, and abundant surface OV-induced active sites, HAm-TiO2−x could be well suited for realistic formaldehyde purification.
In this work, we first reported the preparation of hydrogenated amorphous TiO2−x nanoparticles and systematically expounded the effects of surface OV on its optical bandgap, surface dynamics of photocarriers, and visible-light photoactivity. After functionalized surface hydrogenation by a liquid plasma strategy, the distribution and concentration of OV in HAm-TiO2−x can be designed well via manipulating the output power of liquid plasma discharge. According to density function theory simulations, one important finding was that the OV concentration determined the existence of deep states in the bandgap, while the accurate energy level for these deep states was decided by the OV distribution. Surface OV-induced deep states were formed close to the valence band, whereas subsurface OV-induced deep states were mainly generated under the conduction band. With the benefits of narrow bandgap and efficient charge carrier migration, HAm-TiO2−x and its coating exhibited excellent visible-light dye degradation and stability. More importantly, low-concentration formaldehyde (0.6 ppm) was completely decomposed in an ambient environment using HAm-TiO2−x. The durability test and apparent quantum efficiency of formaldehyde removal under visible light (λ = 600 nm, power density = 0.136 mW/cm2) were explored. In addition, ROS generation, formaldehyde photodegradation pathway, chemical adsorption energy, and photocatalytic mechanism of HAm-TiO2−x were investigated.

2. Experimental Section

2.1. Reagents and Materials

Titanium foam (99%, 100 mesh) and titanium rods (99%, 3-mm diameter) were acquired from Baoji Hong Xinyuan Metal Material Co., Ltd. (Baoji, China) P25 TiO2 was purchased from Degussa (Evonik, Essen, Germany).

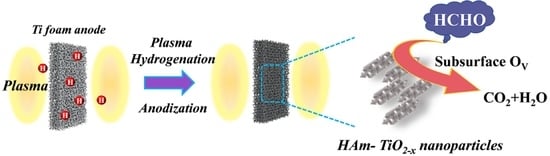
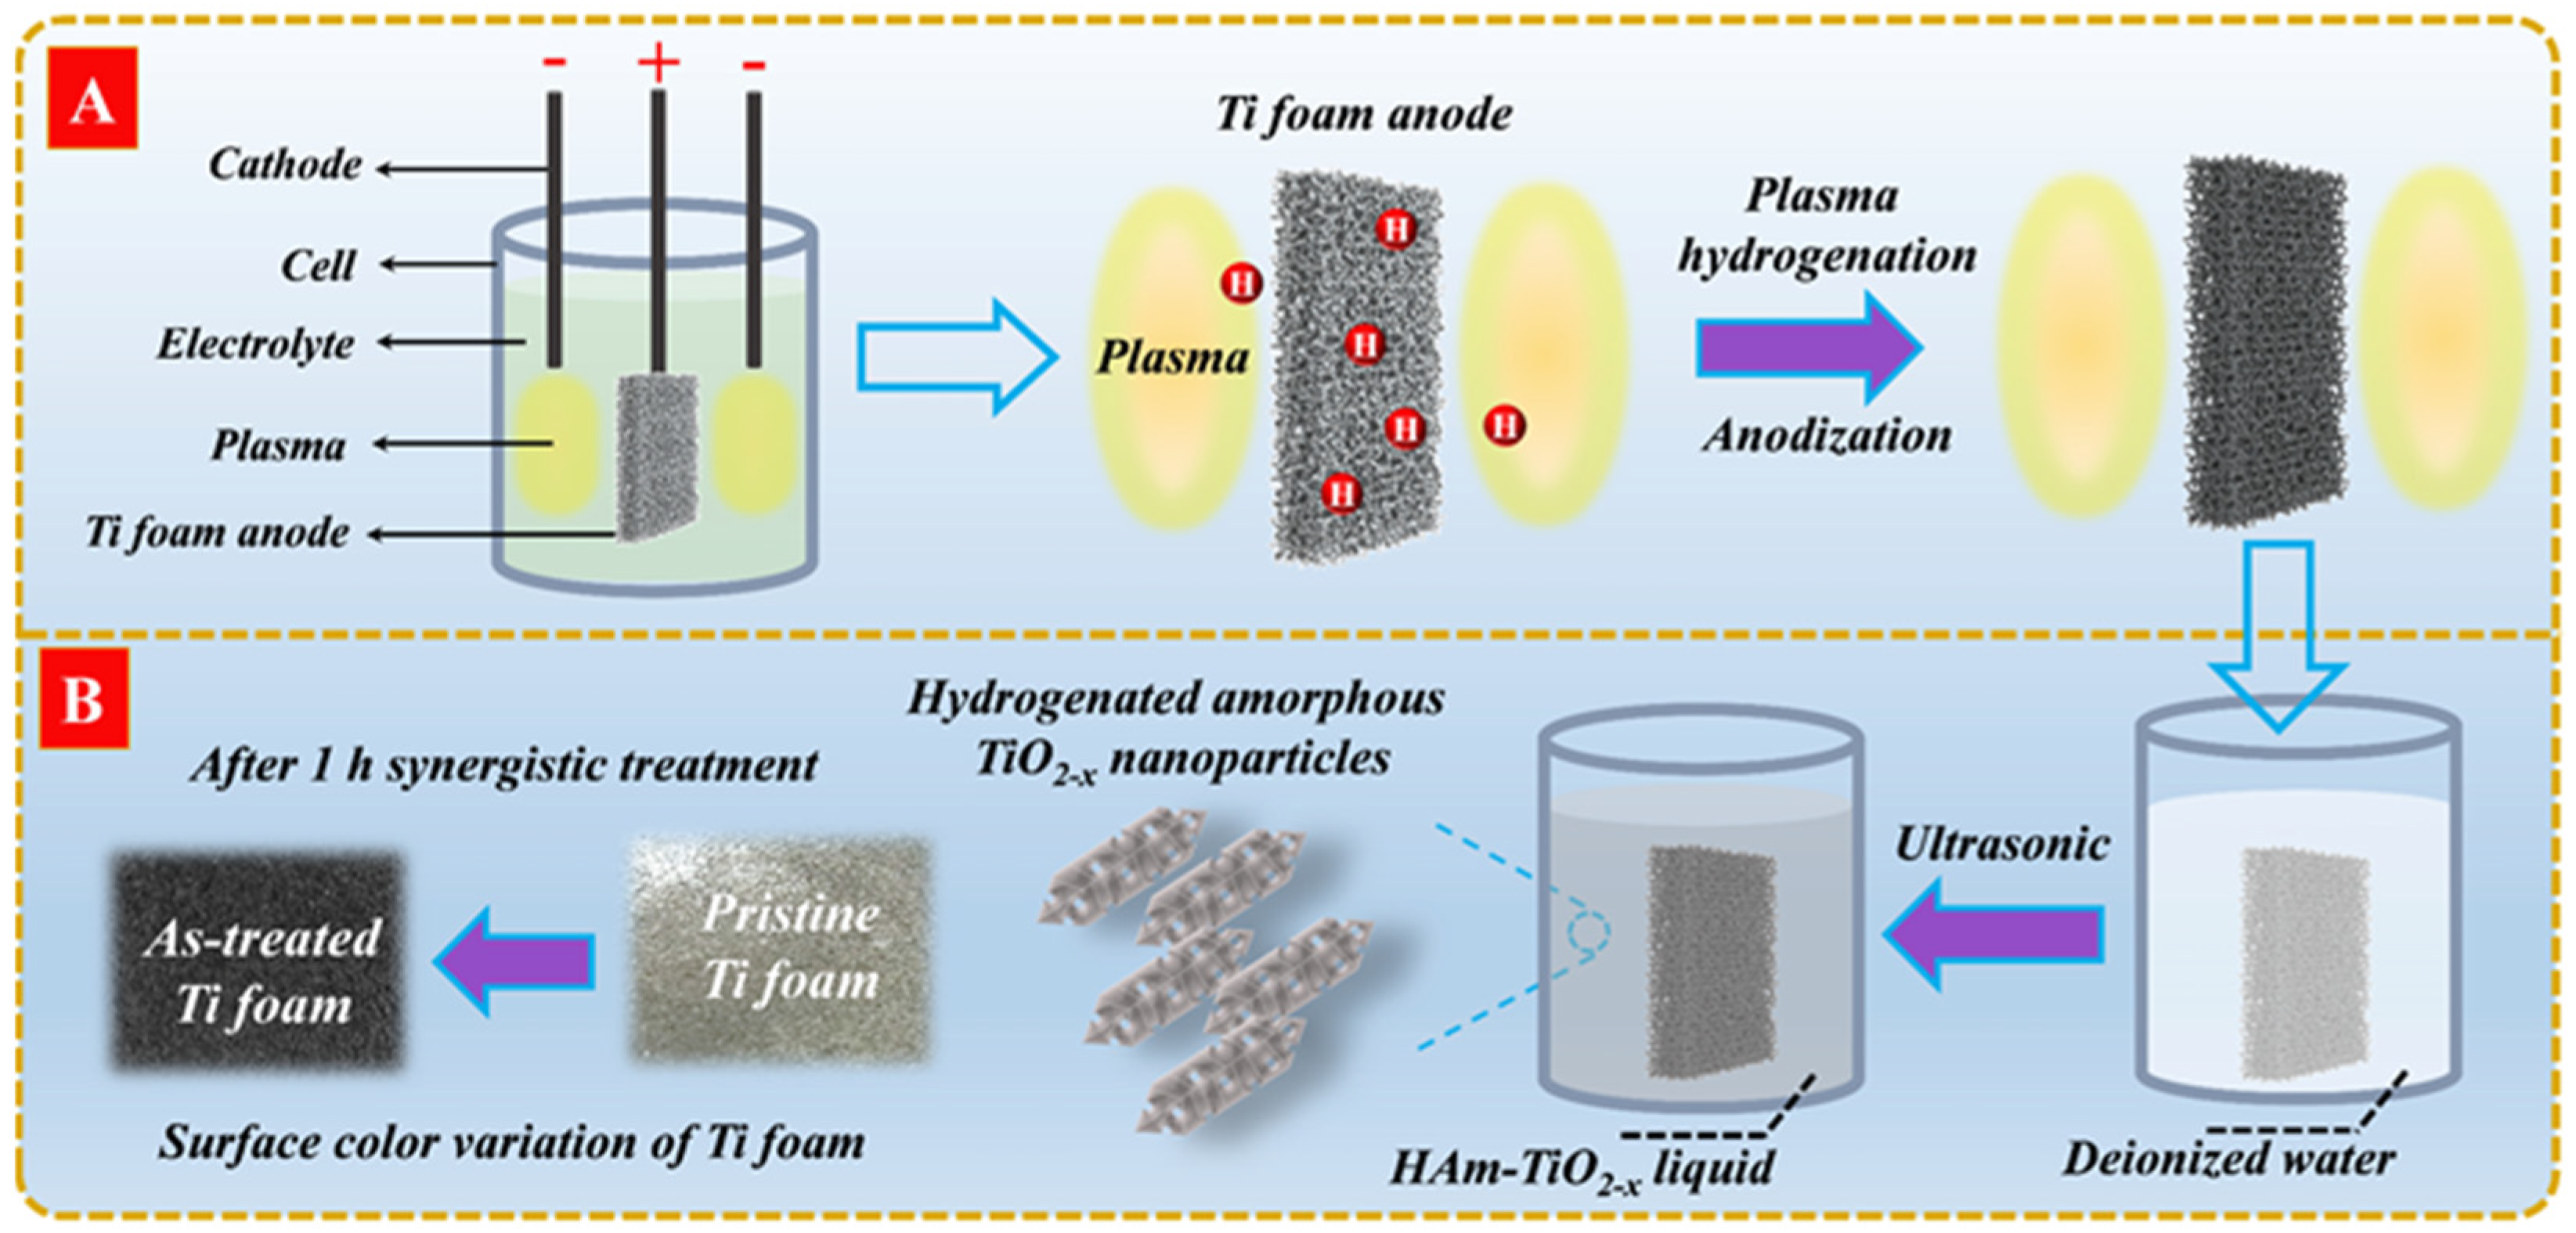
2.2. Preparation of HAm-TiO2−x

One piece of anodic titanium foam (20 × 20 × 2 mm3) and two cathodic titanium rods (3-mm diameter) were placed in an electrical cell that filled with 300-mL nitric acid electrolyte (HNO3), as shown in Figure 1A. Two cathodes were used to generate liquid plasma discharges and to avoid unbalanced flow, as well as to ensure sufficient hydrogenation effects at the double side of the Ti foam. The strong plasma on cathode surfaces was generated by supplying square wave impulse voltages between anodes and cathodes. A water-cooling machine was used to avoid electrolyte evaporation. The surface color of Ti foam varied from pale gray to charcoal gray after 1 h of liquid plasma treatment. Afterward, the gray titanium foam was put into a beaker filled with 20-mL deionized water and treated with an ultrasonic cleaner for 15 min to obtain a gray liquid, which was then dried with a microwave to obtain gray nanopowders, as shown in Figure 1B. All samples were obtained with the same treatment time (1 h), output voltage (700 V), and frequency (1 kHz) but with different output power. The radiation spectra of liquid plasma from 350 to 560 W were recorded in Figure S1. The resulting sample name was denoted by the output power of the liquid plasma, for example, AT-350 referred to HAm-TiO2−x prepared by applying 350-W output power, AT-420 prepared with 420 W, AT-490 prepared with 490 W, and AT-560 prepared with 560 W.

2.3. Preparation of HAm-TiO2−x-Coated Glass

HAm-TiO2−x coated glass was prepared by impregnation method. First, to promote the surface hydrophilicity of the glass substrate, a corona discharger (Zhejiang Ruian Zhilin Corona Equipment Co., Ltd., Ruian, China) was used to make surface superhydrophilicity. Second, the treated glass substrate was put into a well-dispersed HAm-TiO2−x liquid (AT-420, 0.1 mg/mL) for 1 min and was then taken out and dried with a microwave oven to deposit a thin HAm-TiO2−x film on the glass.

2.4. Characterization

An X-ray powder diffraction instrument (XRD, Rigaku Smartlab, Rigaku, Tokyo, Japan) was used to analyze the crystallinity of HAm-TiO2−x. The high-resolution morphology images were acquired by transmission electron microscopy (TEM, JEOL JEM-2100F, JEOL, Tokyo, Japan) with a 200-kV accelerating voltage. A scanning electron microscope (SEM, ZEISS MERLIN, ZEISS, Jena, Germany) was used to characterize the morphology and energy dispersive spectroscopy mapping using 5-kV acceleration voltage. Shimadzu UV-2700 (Shimadzu, Kyoto, Japan) was carried out to measure UV-Vis-diffused reflectance spectroscopy (DRS) at room temperature. A Micromeritics BET analyser (Micromeritics, Norcross, GA, USA) was used to characterize N2 Brunauer, Emmett and Teller (BET) surface area and pore volume of HAm-TiO2−x. X-ray photoelectron spectrum (XPS, Thermos Escalab 250Xi, Thermo Scientific, Waltham, MA, USA) was used to identify the valence state of surface elements. X-band electron paramagnetic resonance (EPR) was implemented to verify the lattice defects. The surface wetting ability of HAm-TiO2−x-coated glass was measured using a contact angle meter (KINO SL200KB, KINO Scientific Instrument Inc., Boston, MA, USA). A fluorescence spectrophotometer (F-7100, Hitachi, Tokyo, Japan) was employed to record the photoluminescence spectra (PL) of HAm-TiO2−x with 365-nm excitation wavelength. Electrochemical workstation (CHI660E, CH Instruments, Inc., Austin, TX, USA) was applied for measurement of photocurrent density. A Thermo Scientific DXR Raman microscope equipped with a 532-nm laser excitation was used to record Raman spectra at room temperature. X-band EPR spectra for active species trapping experiments were applied by using a Bruker EMX PLUS (Bruker, Billerica, MA, USA). In-situ diffused Fourier transform infrared spectroscopy (In-situ DRIFTS, PerkinElmer Spotlight 400, Waltham, MA, USA) was applied during formaldehyde photodegradation. The emitted spectra of liquid plasma discharge were recorded by a spectrometer (Ocean Optics Maya 2000 pro, Ocean Insight, Orlando, FL, USA).
The positron annihilation lifetime spectrum owns a 22Na positron emission source and its activity is approximately 2 × 10⁶ Bq. The positrons with a kinetic energy of 0–540 keV are produced when the source undergoes β+ decay and, almost simultaneously, emits γ photons (1.28 MeV). Therefore, the appearance of this gamma photon can be regarded as the starting time for generating positrons; the appearance of 0.511 MeV annihilation gamma photons is the end of the positron annihilation event; this interval is the positron lifetime. The radioactive source is sandwiched between the sample to form a sandwich structure with a total of 2 million counts and, herein, the positron annihilation lifetime spectrum is already recorded. The time resolution of the system is approximately 190 ps, with a track width of 12.5 ps.

2.5. Photodegradation Experiments of HA-TiO2−x

2.5.1. The Dyes Photodegradation of HAm-TiO2−x Nanoparticles and Their Coatings

The photoactivity of HAm-TiO2−x was assessed by photodegradation of rhodamine B (RhB) under visible light (420−800 nm). First, HAm-TiO2−x nano-powders (50 mg) and RhB solution (20 mg/L, 50 mL) were put into a beaker with 60-min magnetic stirring for adsorption–desorption equilibrium. During photodegradation, 1-mL of solution was taken out from the beaker to test its absorbance at 554-nm wavelength via spectrophotometer. To evaluate the stability of HAm-TiO2−x, AT-420 was preserved in water for 7 days for the subsequent use under the same experimental conditions. Furthermore, HAm-TiO2−x coating was applied to decompose RhB and methyl blue (MB). For the RhB photodegradation experiment, a 2-mL RhB solution (20 mg/L) was dropped on the HAm-TiO2−x coating (10 × 5 × 0.3 cm3), which was then dried in an oven for 10 min; afterward, the treated HAm-TiO2−x coating was irradiated with visible light for 1 h. During the decomposition of MB, HAm-TiO2−x coating (2 × 2 × 0.3 cm3) was immersed in a 10-mL MB solution (20 mg/L) to test its visible-light photoactivity.
The in-situ trap of spin-reactive species under visible-light illumination was recorded by the EPR signals of ·O2 and ·OH using 5,5-dimethyl-1-pyrroline-N-oxide (DMPO). In addition, in reactive species trapping experiments, the concentration of all sacrifice agents was 0.2 mM/mL, including ammonium oxalate (AO), Fe (II)-EDTA, potassium iodide (KI), p-benzoquinone (BQ), and isopropanol (IPA).

2.5.2. Formaldehyde (HCHO) Photodecomposition Test over HAm-TiO2−x

Photocatalytic elimination of HCHO was performed in a sealed box (1 × 1 × 1 m3) at room temperature (25 °C, relative humidity = 52%) under visible-light irradiation. The xenon lamp was placed inside the box as the visible-light source, which was equipped with a bandpass filter glass centered at 600 nm (full width at half maximum (FWHM) = 15 nm). The HAm-TiO2−x coating was deposited on a stainless-steel plate (3036 cm2) with a loading of 1 mg/cm2; afterward, this stainless-steel plate was placed below the xenon lamp. The power density of irradiated light on the stainless-steel plate was 0.136 mW/cm2. A certain amount of 38% HCHO was injected into the sealed box; a 7-W fan was used to ensure proper HCHO diffusion. After dark adsorption–desorption equilibrium, the preliminary concentration of HCHO was approximately 0.6 ppm. During photodegradation, an HCHO tester (PPM-HTV, UK) was used to record the real-time HCHO concentrations. The HCHO photocatalytic formaldehyde mineralization efficiency (η) was measured by the equation: η (%) = (C0 − Ct)/C0 × 100%, where C0 and Ct describe instant HCHO concentrations at 0 and t h, respectively. In addition, 365-nm UV light-mediated HCHO photodegradation was performed under the same conditions except for the light source.
Apparent quantum efficiency (AQY) of HCHO photodegradation was defined as Equations (1)–(3) [30]:
AQY = number   of   degraded   pollutant   molecules number   of   photons   entering   the   reactor   ×   100 %
NM = NA × nHCHO = NA × ((C0 − Ct) × V)/(30 × 1000)
number of photons entering the reactor = I × S/(hc/λ) × t
where NM, NA, nHCHO, C0, Ct, and V represent the number of degraded pollutant molecules, Avogadro’s constant, moles of degraded HCHO, initial HCHO concentration, HCHO concentration of t h, and volume of the box, respectively. While I, S, h, c, λ, and t are illumination intensity, area, Planck’s constant, the vacuum speed of light, the incident light wavelength, and illumination time, respectively.

2.6. Theoretical Calculation Methods

To complete all spin-polarization density functional theory (DFT) calculations, with the Perdew–Burke–Ernzerhof (PBE) formulation, the first-principles were employed within the generalized gradient approximation (GGA) [31,32,33]. The projected augmented wave (PAW) potentials were selected to illustrate the ionic cores and took valence electrons into account [34,35]. Through the Gaussian smearing method, partial occupancies of the Kohn–Sham orbitals were used with 0.05-eV width. When the energy change was lower than 10−4 eV, the electronic energy was regarded as self-consistent. When the energy change was lower than 0.05 eV Å−1, a geometry optimization was identified as convergent; the vacuum spacing from the structural plane was 18 Å. The TiO2 (101) amorphous structure was obtained by ab initio first-principles molecular dynamics (AIMD) simulation calculation with 20 ps using the 300 K. In addition, the TiO2 (101) crystal structure had been optimized using the AIMD simulations with the 1-fs step and 300 K; this crystal structure was then changed into amorphous TiO2 (101). Finally, it was relaxed using DFT calculations in order to obtain the TiO2 (101) stable amorphous structure.

3. Results and Discussion

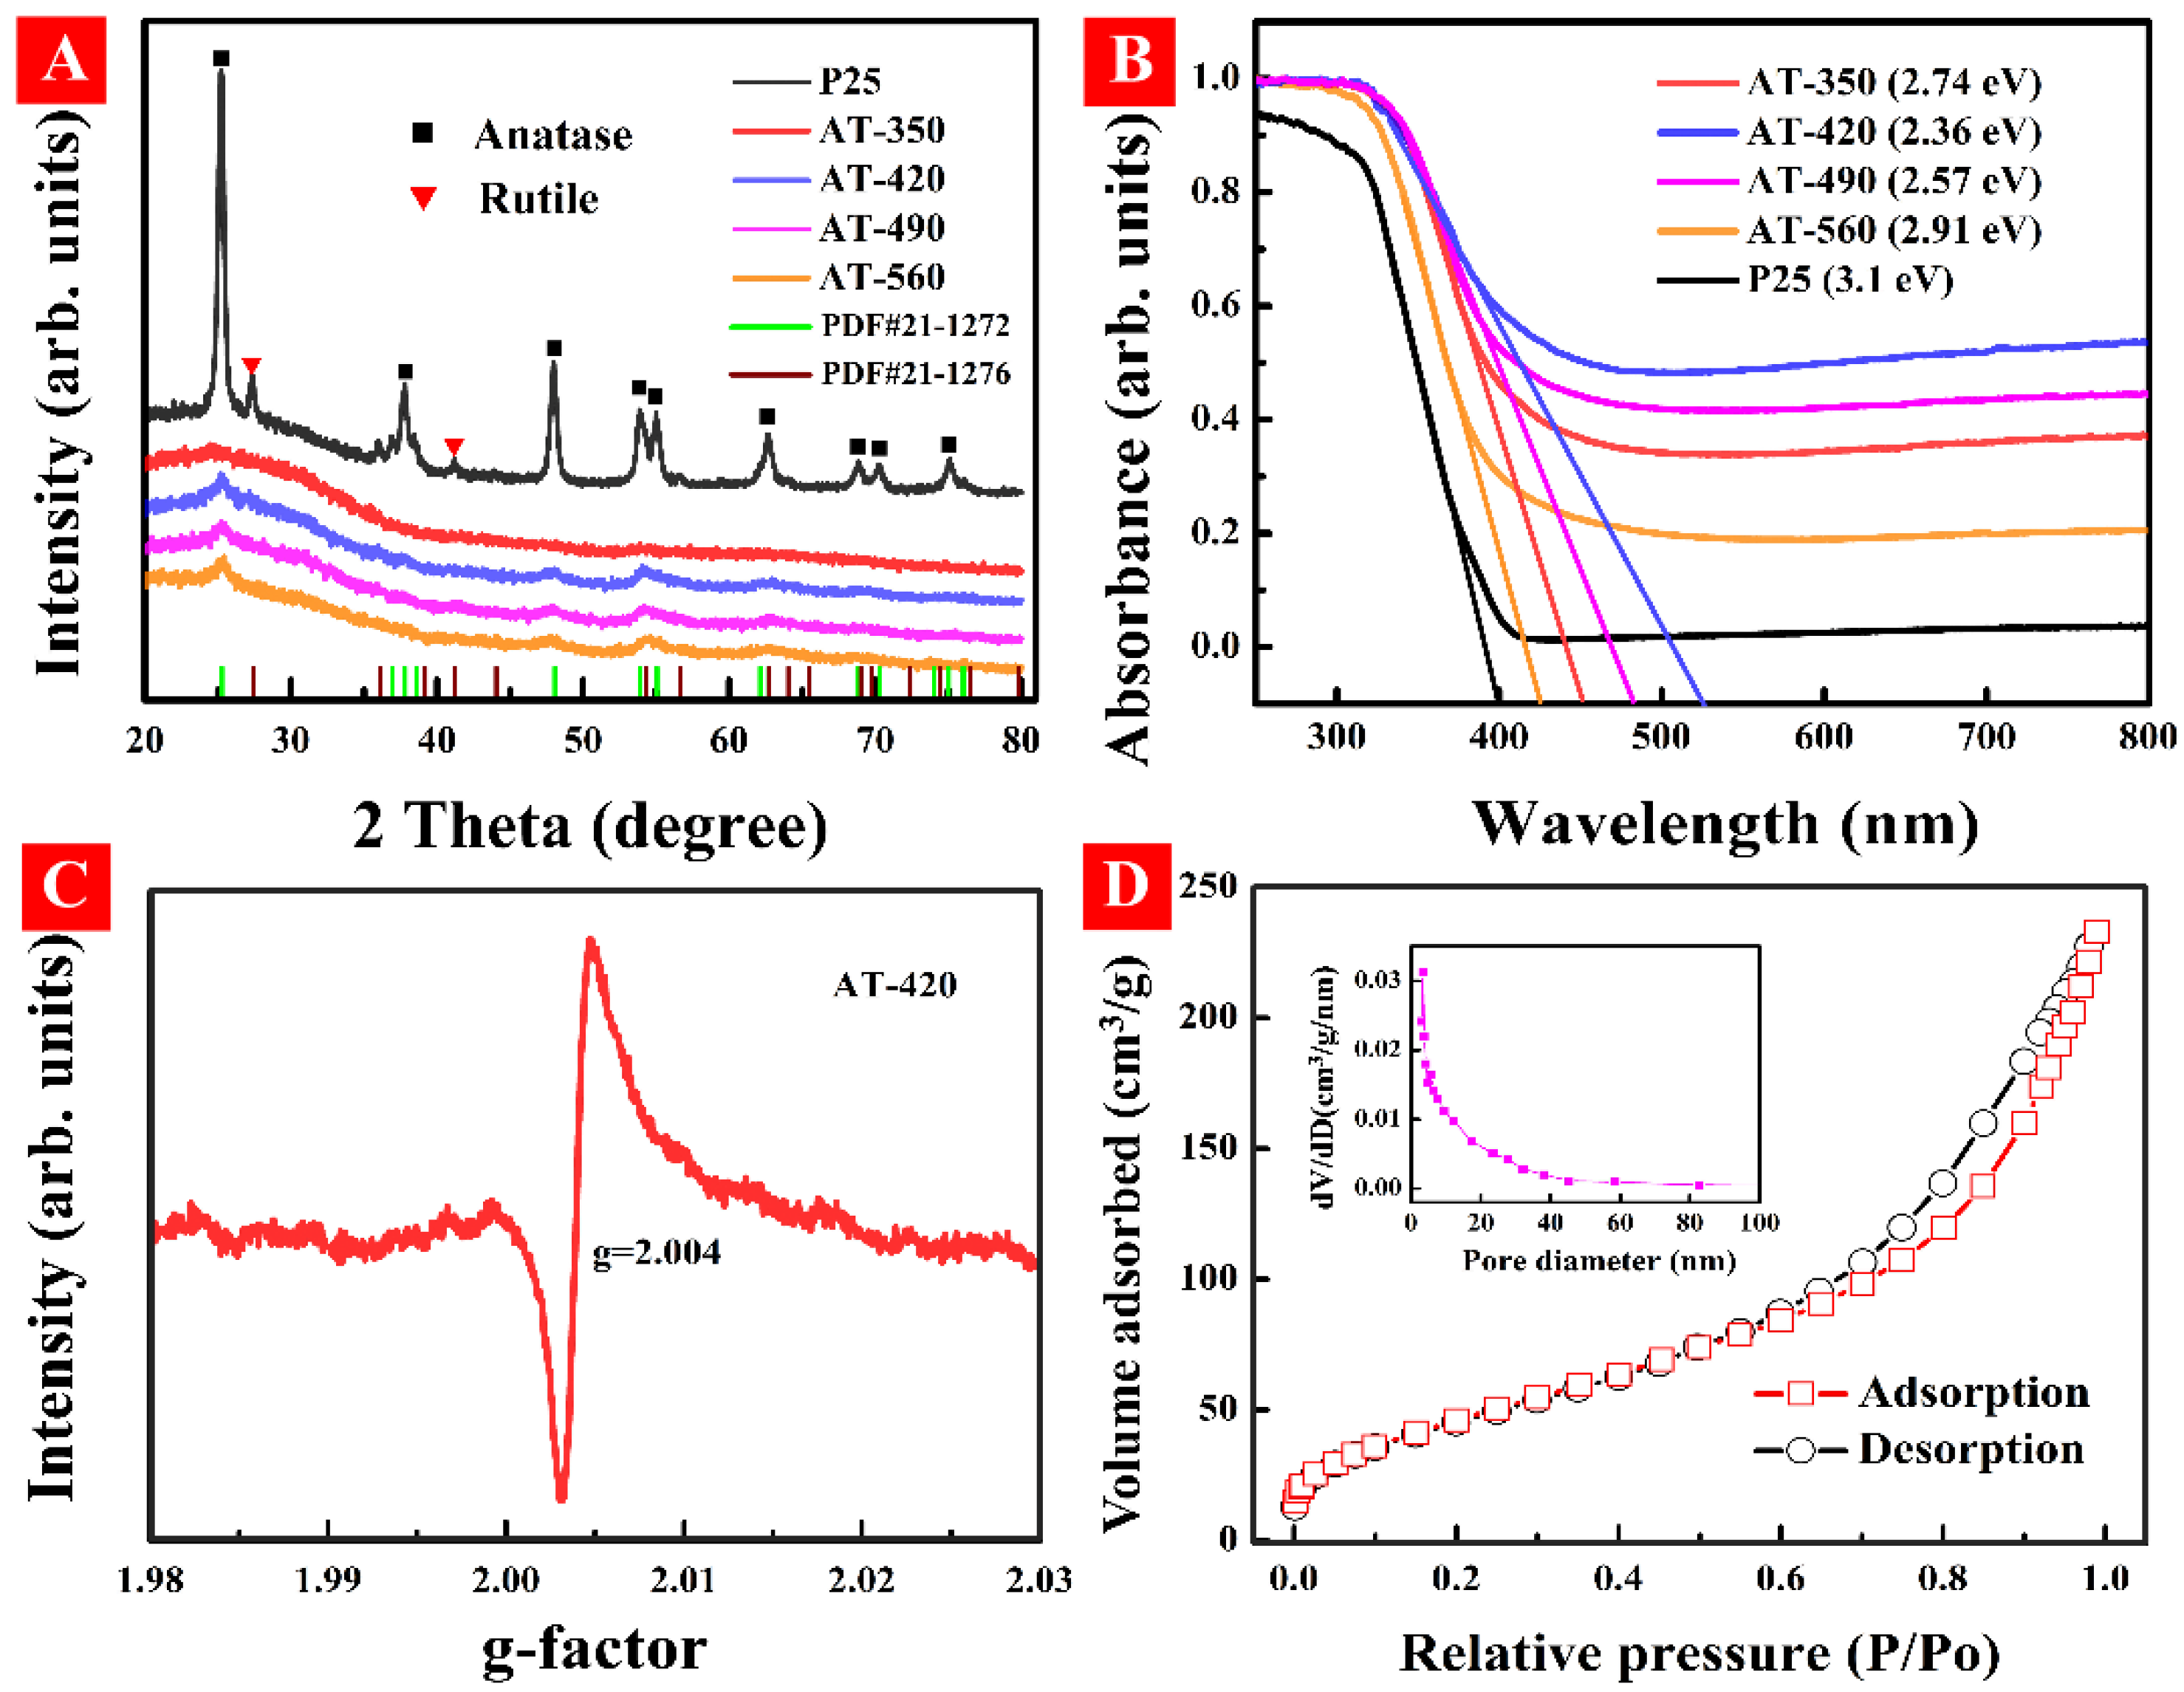
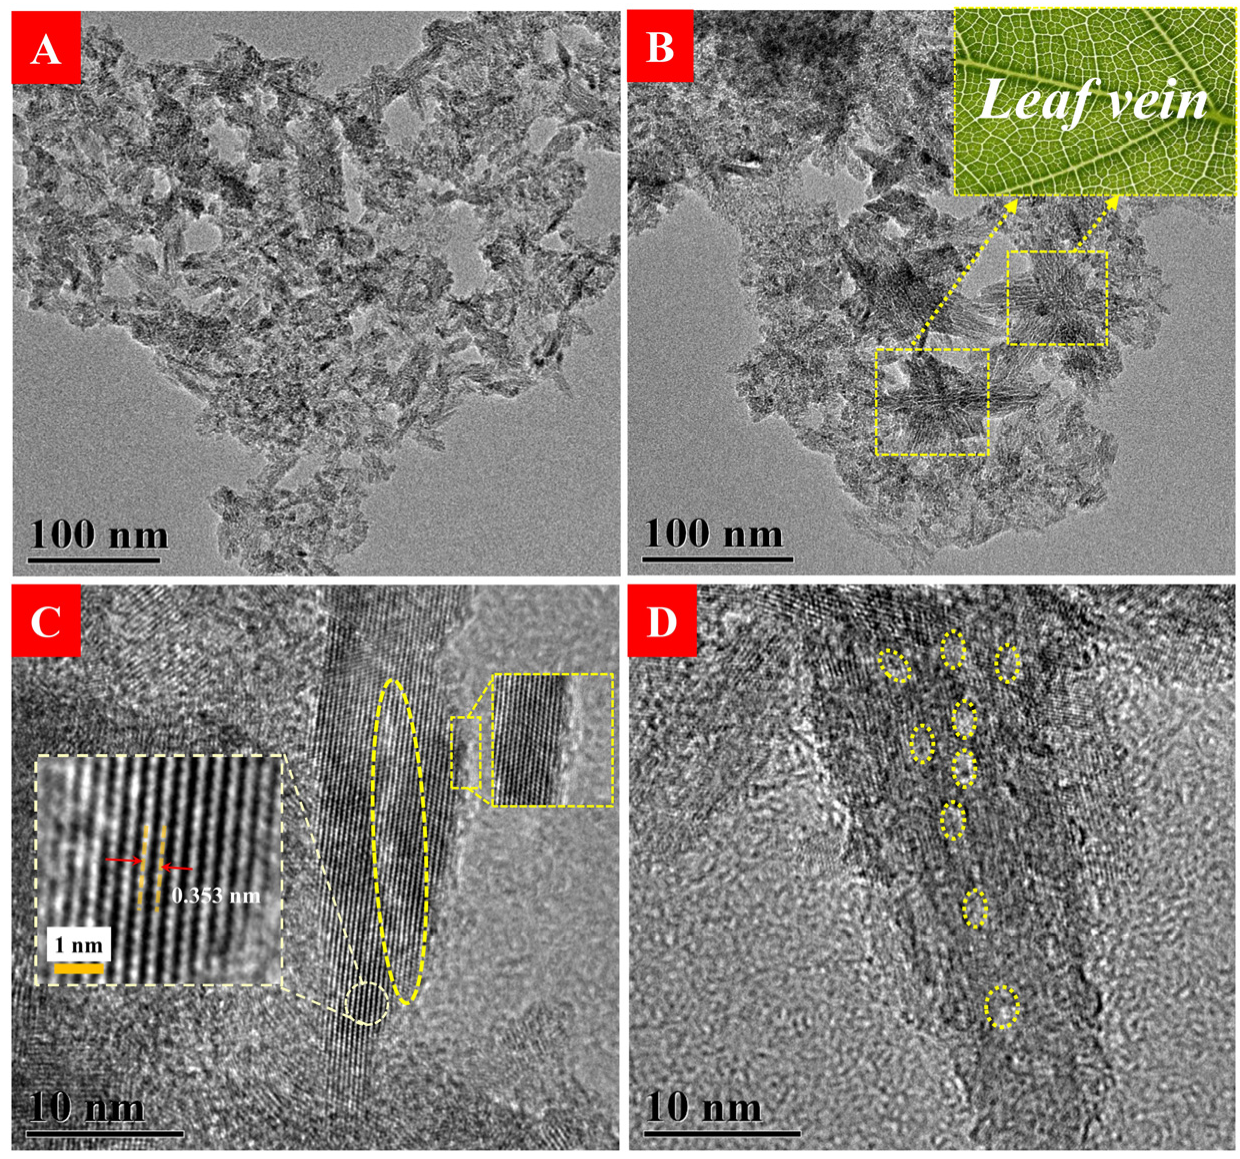
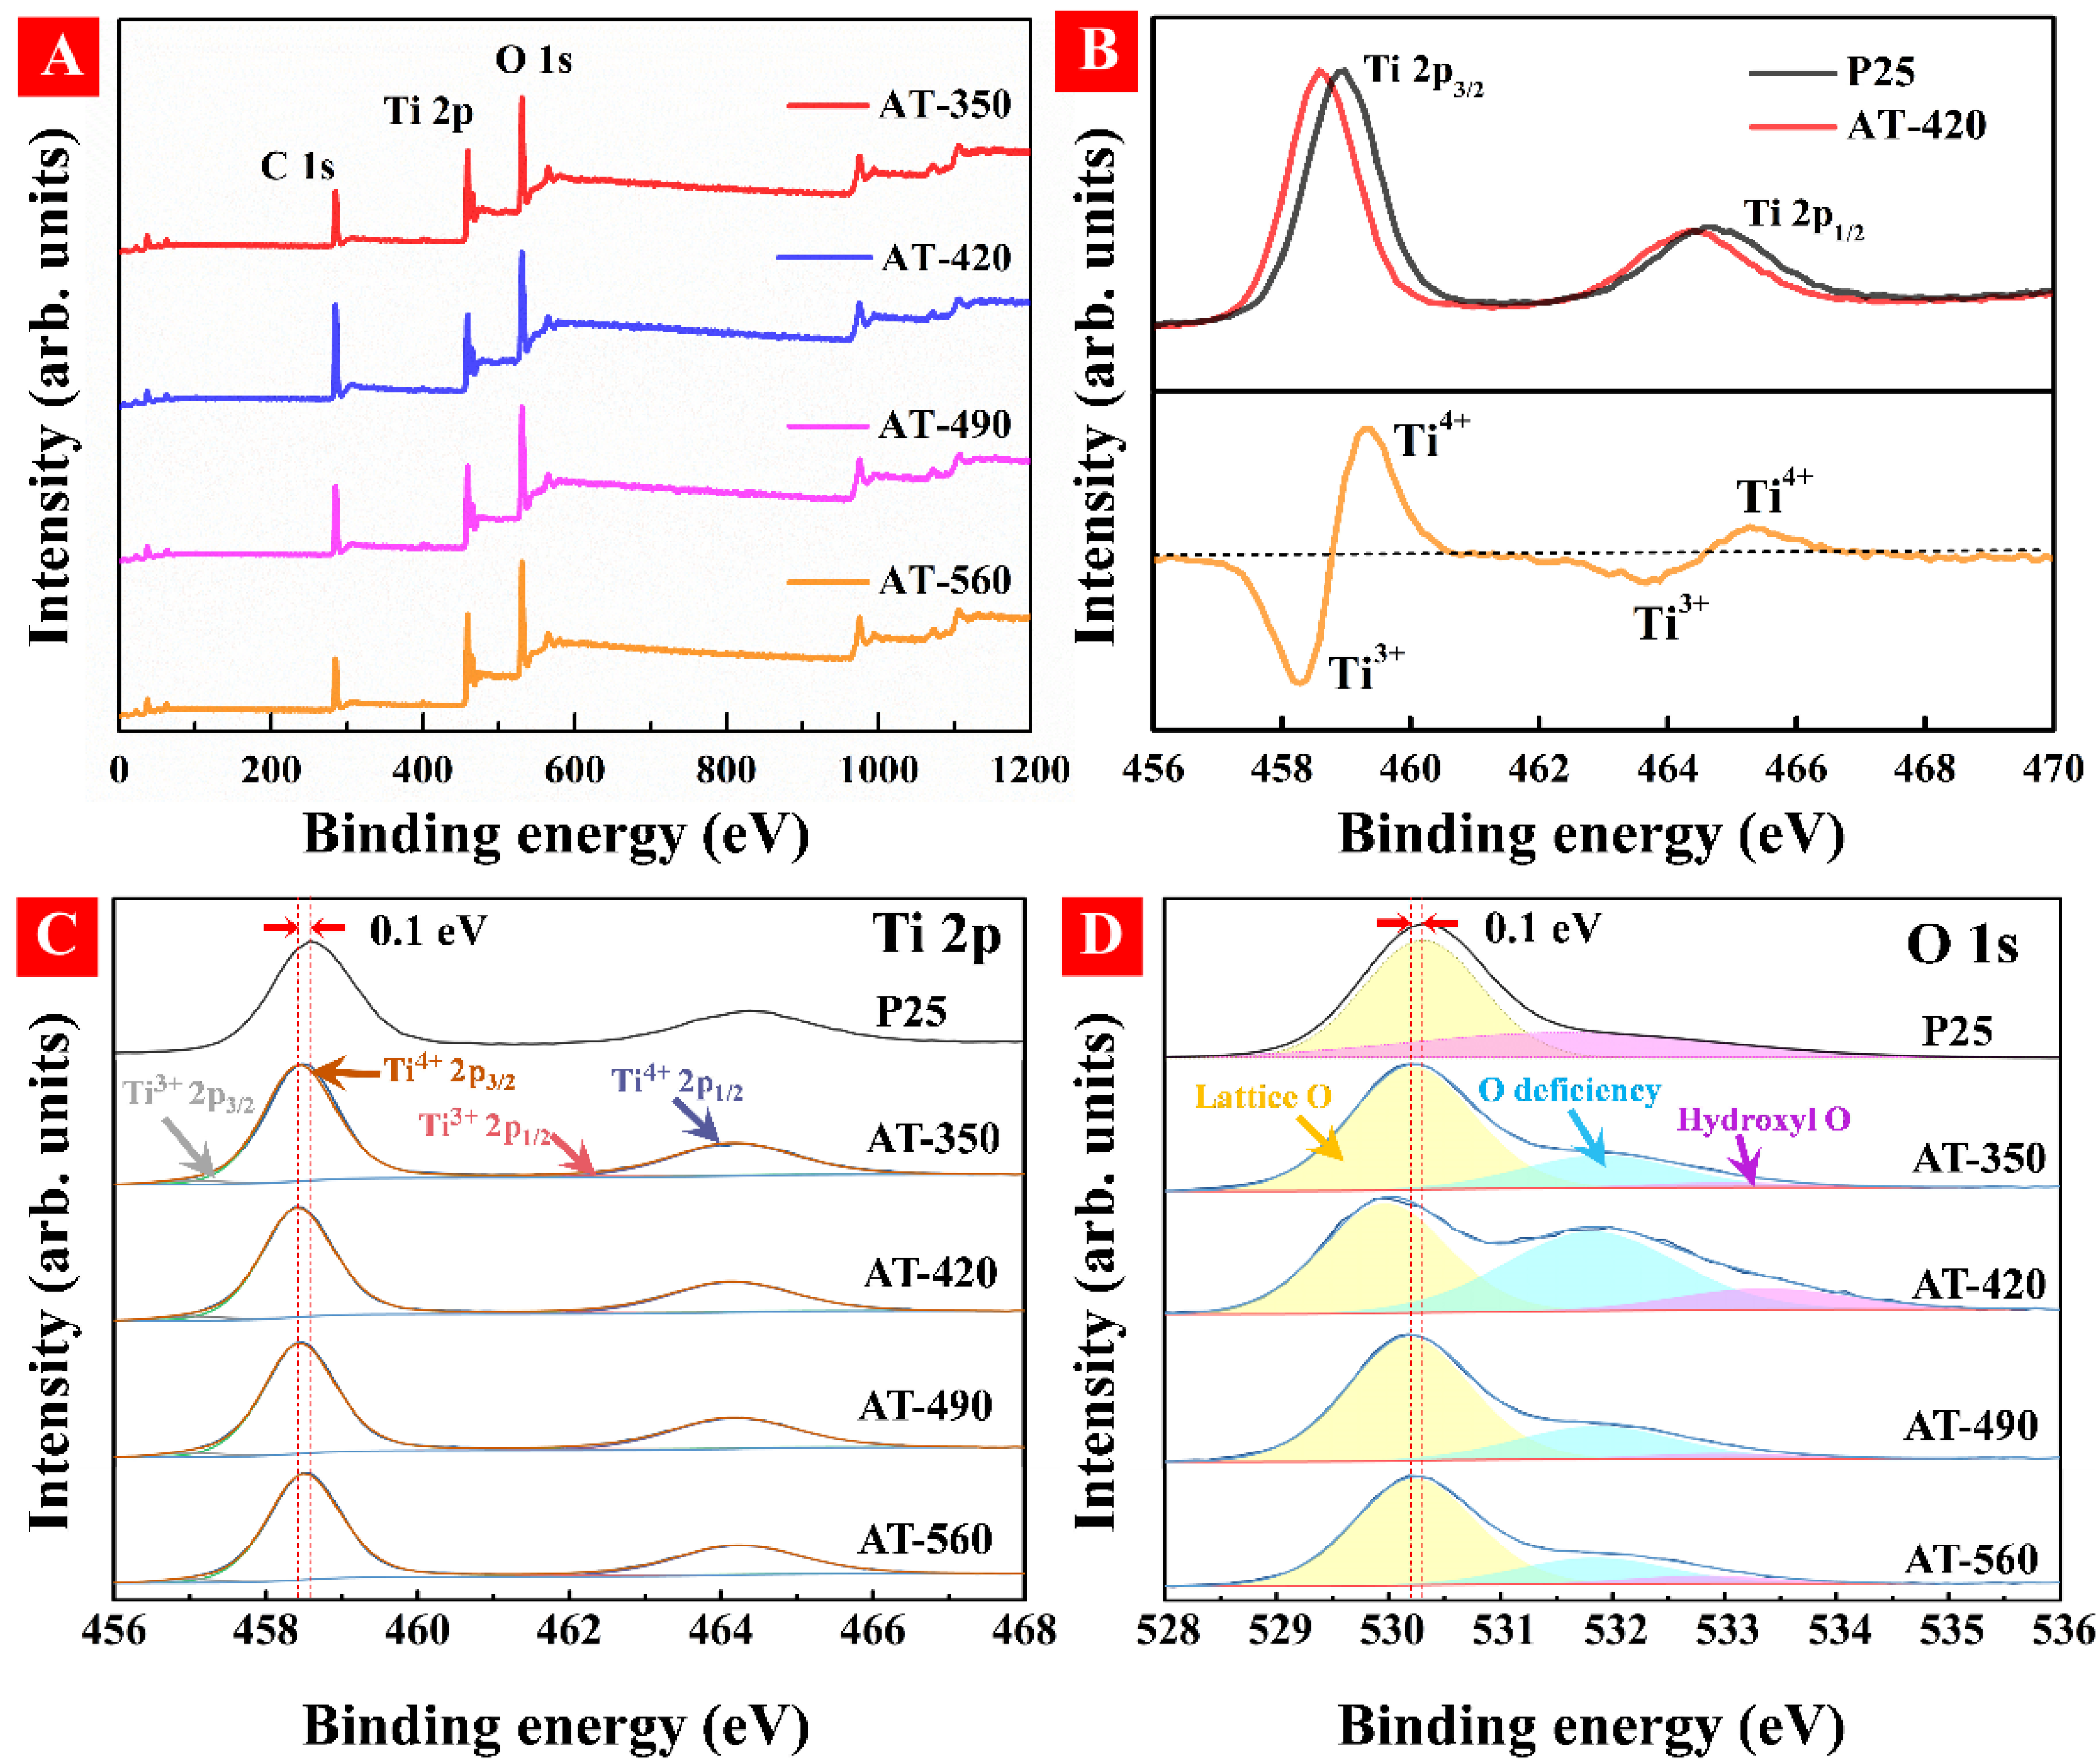
3.1. Characterization of HAm-TiO2−x

Figure 2A exhibits the XRD patterns for all HAm-TiO2−x. Here, we provided two XRD cards of crystalline TiO2-involved anatase (PDF#21-1272) and rutile (PDF#21-1276). No apparent peaks indexed to crystalline phase are detected, but the weak and broad peaks at (101) facet of all samples compared with that of P25 TiO2 indicates that a long-term disordered defect was generated. Figure S2 displays the surface atomic bond environment of all samples by Raman spectra. The observed broad and blue shift of Eg mode in our case could be ascribed to the surface oxygen vacancies in HAm-TiO2−x [36]. Figure 2B shows the light response performance of all HAm-TiO2−x using DRS spectra. All samples display enhanced visible light absorption; the bandgaps of AT-350, AT-420, AT-490, and AT-560 are estimated to be 2.74, 2.36, 2.57, and 2.91 eV, respectively. The plots of (αhν)1/2 versus hν by using the Kubelka–Munk function were seen in Figure S3. Given the above results, some self-doped defects should exist in HAm-TiO2−x. To verify the existence of the surface defect on HAm-TiO2−x, EPR spectrum was implemented, as seen in Figure 2C. A sharp EPR signal of g = 2.004 is evidence that the AT-420 sample possessed oxygen vacancies [37]. In addition, Figure 2D illustrates the size and structure of the nanopore using nitrogen adsorption–desorption isotherms. The pore structure in HAm-TiO2−x was irregular, which was proven by the as-obtained typical IV curves with hysteresis loops. It was indicated that micropores and/or mesoporous were formed, owing to the hysteresis with the P/P0 range of 0.7–0.9; the pore size was nearly 3.4 nm, as displayed in the inset. The large BET (176.7 cm2 g−1) and pore volume (0.33 cm3 g−1) in Ham-TiO2−x both contribute to the large capturing of polluted molecules.
To investigate the morphology characterizations in Ham-TiO2−x, TEM was conducted, as displayed in Figure 3. As shown in Figure 3A, HAm-TiO2−x nanoparticles display irregular strip structure. As shown in Figure 3B, lots of textures marked with yellow rectangles exist in the nanoparticles, which seem similar to the leaf vein; these vein-like morphology features are deemed to be the irregular mesoporous structure. As shown in Figure 3C, a curve-liked bulk defect marked with yellow oval was as roughly 20 nm long; furthermore, the disordered surface marked with yellow rectangle proves that surface amorphization with 1–2 nm thickness is prepared after liquid plasma treatment. No long-term range crystalline structure was observed, but some crystal lattices (d = 0.353 nm) of anatase (101) facet existed in HAm-TiO2−x, which was in good accordance with the XRD results in Figure 2A. Figure 3D exhibits several nanopores marked with yellow circles with lengths of 2–3 nm, which is classified into mesopore and in good consistency with Barrett-Joyner-Halenda (BJH) result. Overall, HAm-TiO2−x not only possesses the typical characteristics of amorphous materials, including long-term disorder lattice and large specific surface area, but also has broad visible-light harvest and disordered surface on the amorphous core.

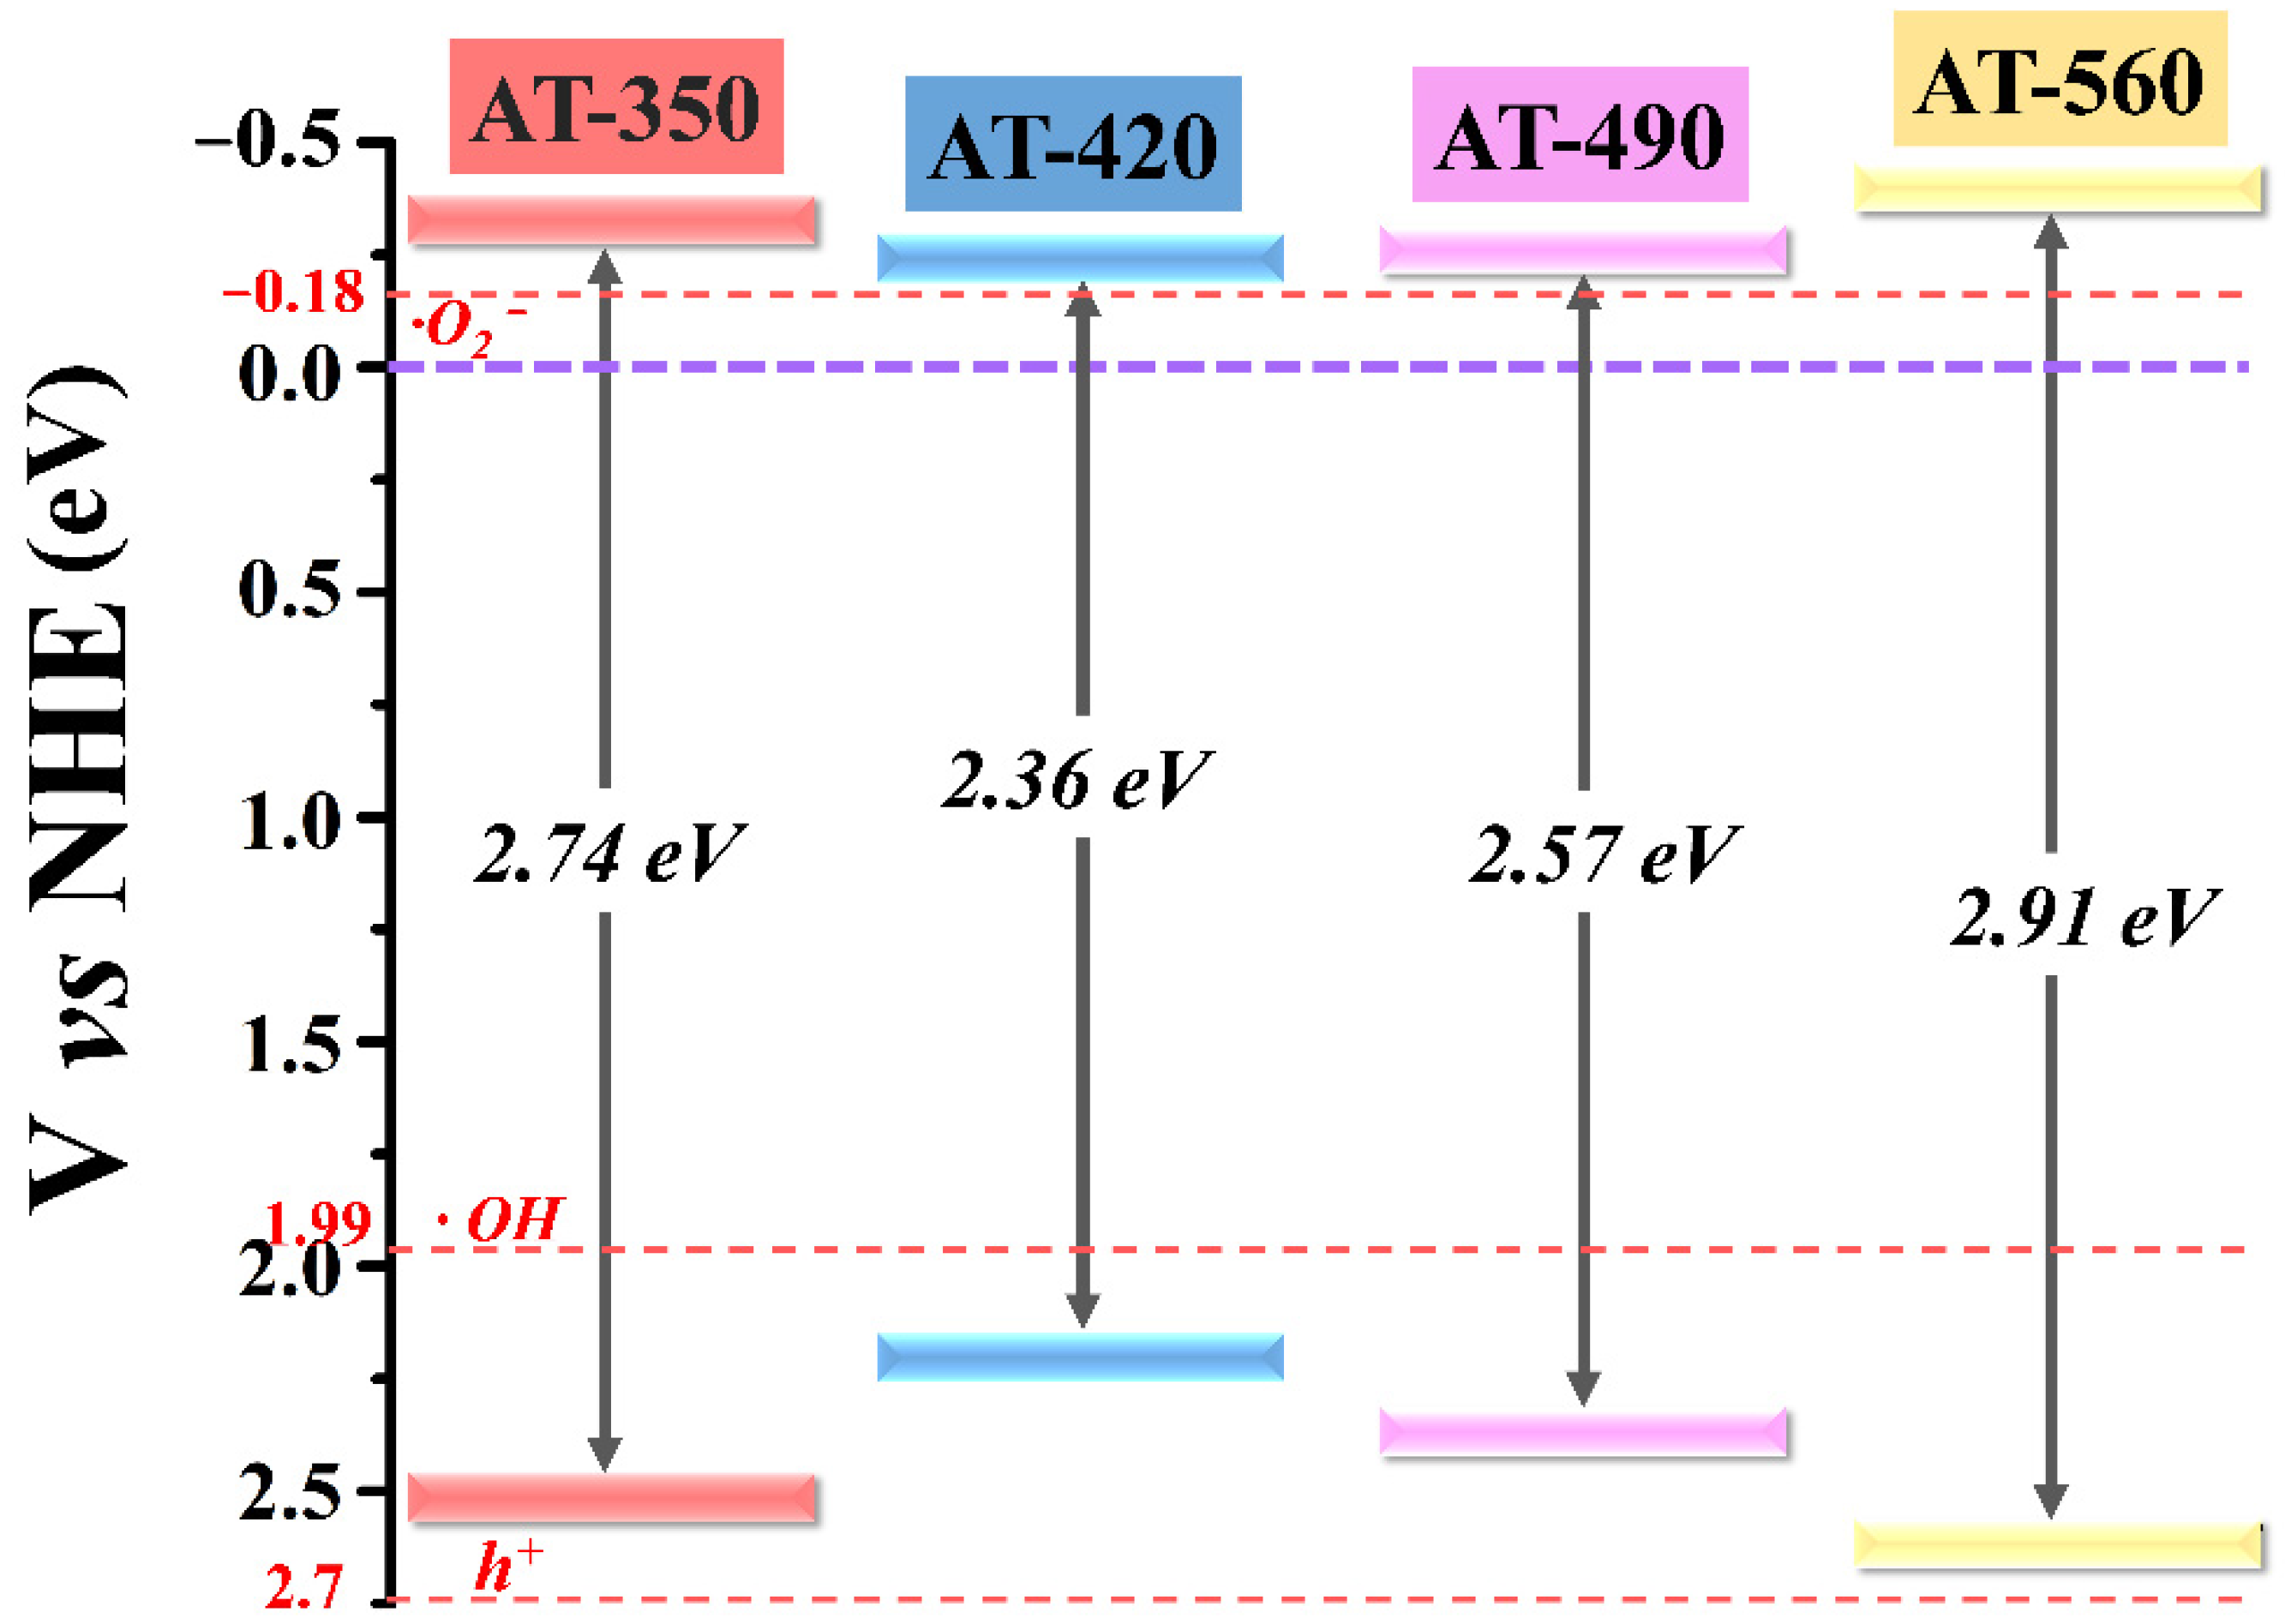
3.2. Regulation of Surface OV and Bandgap Engineering in HAm-TiO2−x

Positron annihilation spectrometry (PAS) is a powerful tool that can be used to characterize the size, type, concentration, and distribution of surface defects in nanomaterials. As listed in Table 1, the relative intensities of three positron lifetime components denoted as τ1, τ2, and τ3 are I1, I2, and I3, respectively. The largest component (τ3) is generally regarded as the signal of large voids [38]. The second-largest lifetime component (τ2) can be attributed to larger size defects, for instance, OV clusters or surface defects [39]. The smallest component (τ1) is responsible for free positrons annihilation with the lattice and at small OV sites on the subsurface [40]. When the output power increased (AT-350 to AT-420), I1 decreased, while I2 increased, and, notably, I3 of AT-420 was too small to detect. This observation indicates that the lattice OV moved to the surface to form surface OV, which was then accumulated on the catalyst surface and, thus, shielded the LV signal. With a further increase in output power (from AT-420 to AT-560), I1 increased but I2 decreased; both the intensities of I3 for AT-420 and AT-490 were not detected, whereas I3 of AT-560 emerged. It was, therefore, concluded that surface OV moved back to the inner lattice to form subsurface OV in sample AT-560. In conclusion, these results confirm that the output-power-regulated OV not only distributed on the surface but also on the subsurface, rather than merely accumulating on the catalyst surface. More importantly, OV in HAm-TiO2−x existed preferentially at the subsurface if it underwent strong liquid plasma treatment. Compared with the surface OV, subsurface and inner-bulk OV are considered quite stable, as the outermost amorphous layer can prevent gradual oxidation by air and water [19,41]. The occurrence of the “roundtrip” path of OV in HAm-TiO2−x, as will be discussed further in what follows, could be a result of the synergistic effect of liquid plasma-induced hydrogenation and anodization.
To inspect the surface chemical states, XPS spectra were performed in HAm-TiO2−x. As seen in full XPS spectra of Figure 4A, the lack of obvious differences between these samples demonstrated that the element components were identical. As shown in Figure 4B, P25 TiO2 had two typical binding energies of Ti 2p3/2 (459.2 eV) and Ti 2p1/2 (465.2 eV) attributed to Ti4+ peaks [42,43]. In comparison, an apparent shift toward lower binding energies was observed for the sample AT-420, which suggested that Ti3+ existed on the disordered surface. We, thus, subtracted the Ti 2p spectra of P25 TiO2 from that of sample AT-420, as seen in the bottom of Figure 4B; the resultant orange spectrum curve received two evident peaks (458.2 and 463.7 eV) ascribed to the Ti3+ (Ti 2p3/2 and Ti 2p1/2) [44,45]. To calculate the ratio of Ti3+/Ti4+, the deconvoluted spectra of Ti 2p are provided in Figure 4C; the ratio was calculated by the areas of Ti3+ and Ti4+ at Ti 2p3/2 [46]. The highest Ti3+/Ti4+ ratio in AT-420 confirmed the highest concentration of Ti3+ in these samples, which is consistent with the PAS results; the detailed data regarding the Ti3+/Ti4+ ratio are displayed in Table 2. As shown in Figure 4D, three kinds of high-resolution O 1s peaks were observed, which were considered as the lattice oxygen (lattice O, 530.1 eV), surface oxygen defects (O deficiency, 531.9 eV), and hydroxyl group oxygen (hydroxyl O, 533.1 eV) [47,48]. As comparison, a much stronger peak intensity of O deficiency in AT-420 demonstrated a higher content of surface OV. Furthermore, the clear shift toward lower binding energy for the lattice O peak observed in sample AT-420 was due to the high-density surface oxygen vacancies [49]. Therefore, as shown in Figure 4B–D, compared with P25 TiO2, an apparent blue shift (0.1 eV) in Ti 2p and O 1s spectra were observed, which confirmed the existence of surface defects of Ti3+ and OV on the disordered surface. To clarify the effect of Ti3+ concentration on bandgap structure modification, the XPS valence band maximum (VBM) spectra of HAm-TiO2−x were investigated, as shown in Figure S4. The estimated VBM value for all samples was recorded in Table 2. Herein, according to Table 2, the band structures for all samples are displayed in Figure 5. It is clear that sample AT-420 exhibited the highest position of the valence band, which could induce a strong redox reaction and higher photoactivity. Notably, the electric potential of h+ was higher than all samples, indicating that it is possible to disable UV-light-induced photoactivity in HAm-TiO2−x. Here, the output-power-controlled bandgap engineering in HAm-TiO2−x was realized, which was obtained via the regulation of the distribution and the concentration of OV.

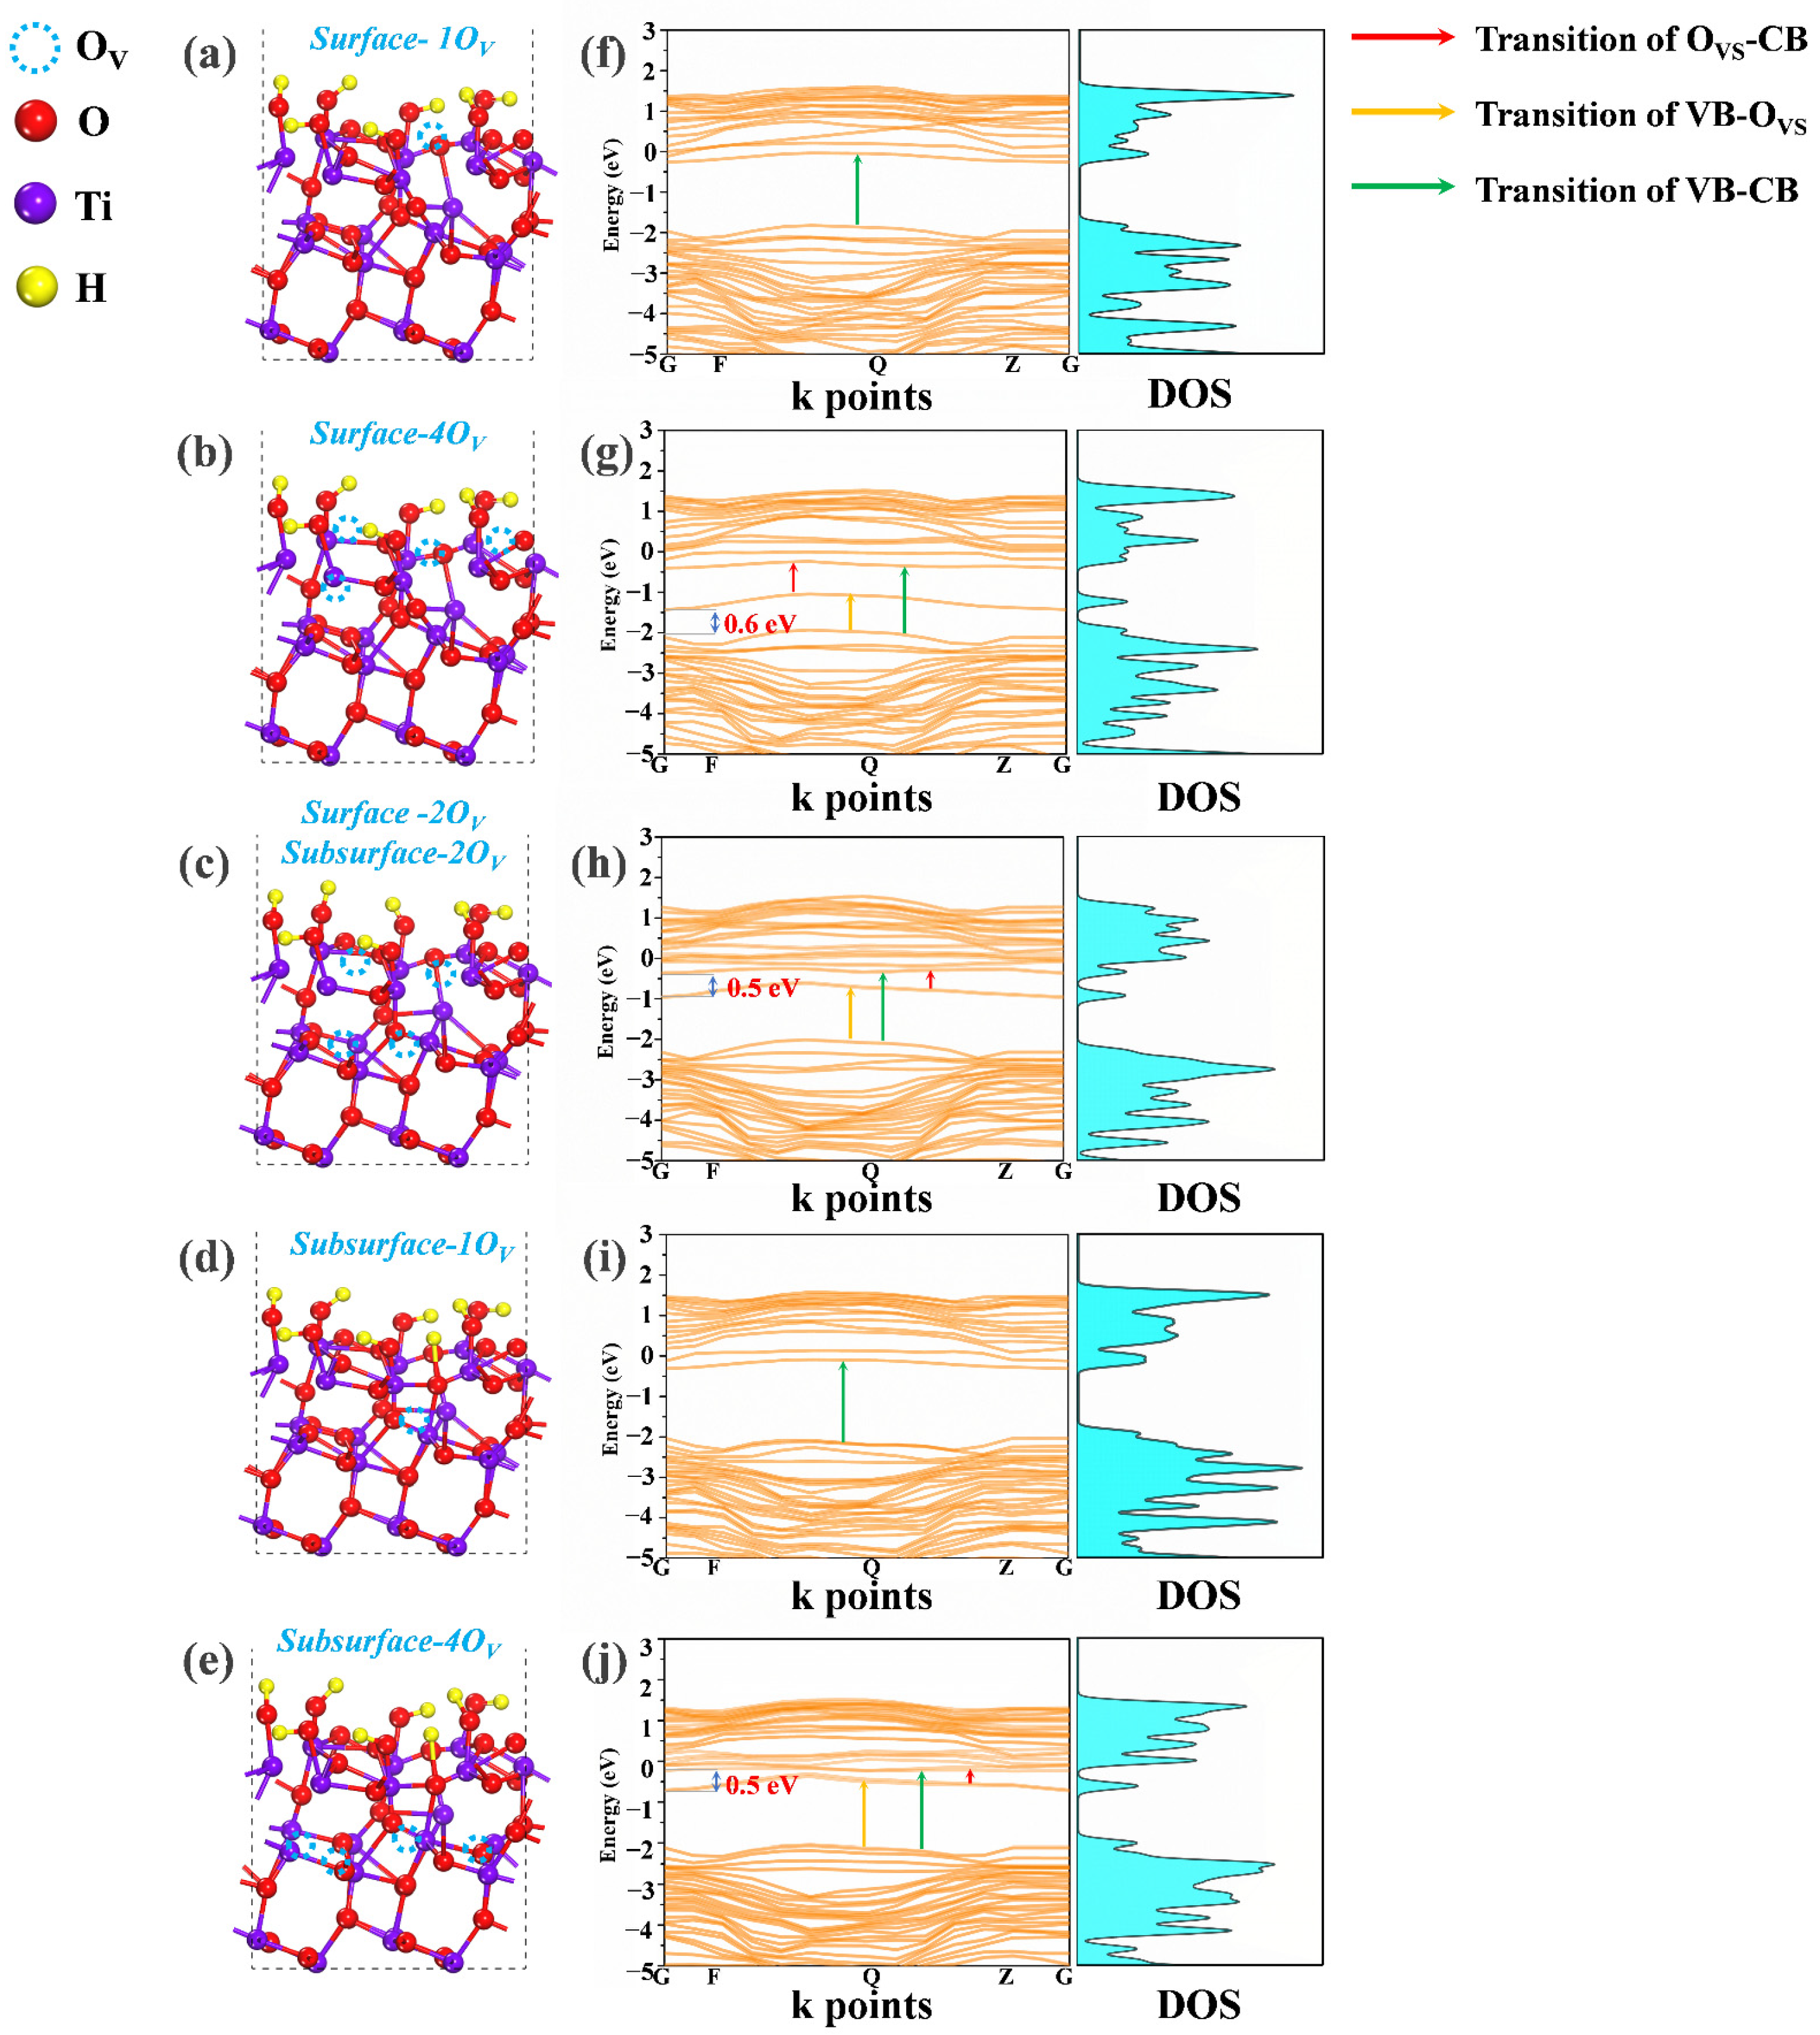
3.3. Effect of Distribution and Concentration of OV on Electrical Structure

The above PAS and XPS results indicated that the bandgap engineering of HAm-TiO2−x could be directly achieved via the regulation of the distribution and concentration of OV. However, an in-depth understanding of the effect of distribution and concentration of OV on the regulation mechanism of the refined bandgap structure was still missing. Thus, DFT calculations regarding the effect of distribution and concentration of OV on the electrical structures of HAm-TiO2−x were carried out here. To balance the distribution and concentration of OV, we used five kinds of atomic models, denoted as: Surface-1OV, Surface-4OV, Surface-2OV and Subsurface-2OV, Subsurface-1OV, and Subsurface-4OV, as depicted in Figure 6a–e, respectively. The naming system used here is such that the model of Surface-1OV represented the case in which one oxygen vacancy is located on the surface, and the model of Surface-2OV and Subsurface-2OV denoted two oxygen vacancies on the surface and two oxygen vacancies at the subsurface. The electronic band structures and density of states (DOS) of all models are displayed in Figure 6f–j. With the increase in the amount of surface OV (Surface-1OV to Surface-4OV), deep trap states were generated above the valence band (~0.6 eV), and the flat deep states indicated large effective mass and restricted charge mobility, which led to photocarrier recombination. Owing to the introduction of deep states, some potential transitions may occur, including valence band to OV-induced deep states (VB–OVS), valence band to conduction band (VB–CB), and OV-induced deep states to the conduction band (OVS–CB), as depicted in Figure 6g. When the surface OV moved to the inner domain to form subsurface OV (Surface-4OV to Surface-2OV and Subsurface-2OV), deep trap states upshifted near the conduction band (~0.5 eV). In comparison with OVS-CB transition in the Surface-4OV model, the transition observed in Surface-2OV and Subsurface-2OV was of much lower energy, which could induce a longer wavelength photoresponse, as shown in Figure 6h. When surface OV moved entirely into the inner region (Subsurface-1OV), as depicted in Figure 6d, deep trap states disappeared, but several conduction band tails emerged, as shown in Figure 6i, which resulted in a much narrower bandgap. By further increasing subsurface OV (Subsurface-4OV), as seen in Figure 6j, deep trap states close to the conduction band (~0.5 eV) reemerged. In summary, the OV concentration determined the existence of deep trap states in the bandgap, and the OV distribution determined their exact location. High concentration of surface OV could introduce the deep trap states, while OV at the subsurface could upshift the deep trap states. On the basis of the PAS results, subsurface OV was a substantial support in HAm-TiO2−x, which suggests that the refined electrical structure of HAm-TiO2−x could follow the model of Subsurface-4OV, generating deep trap states near the conduction band.

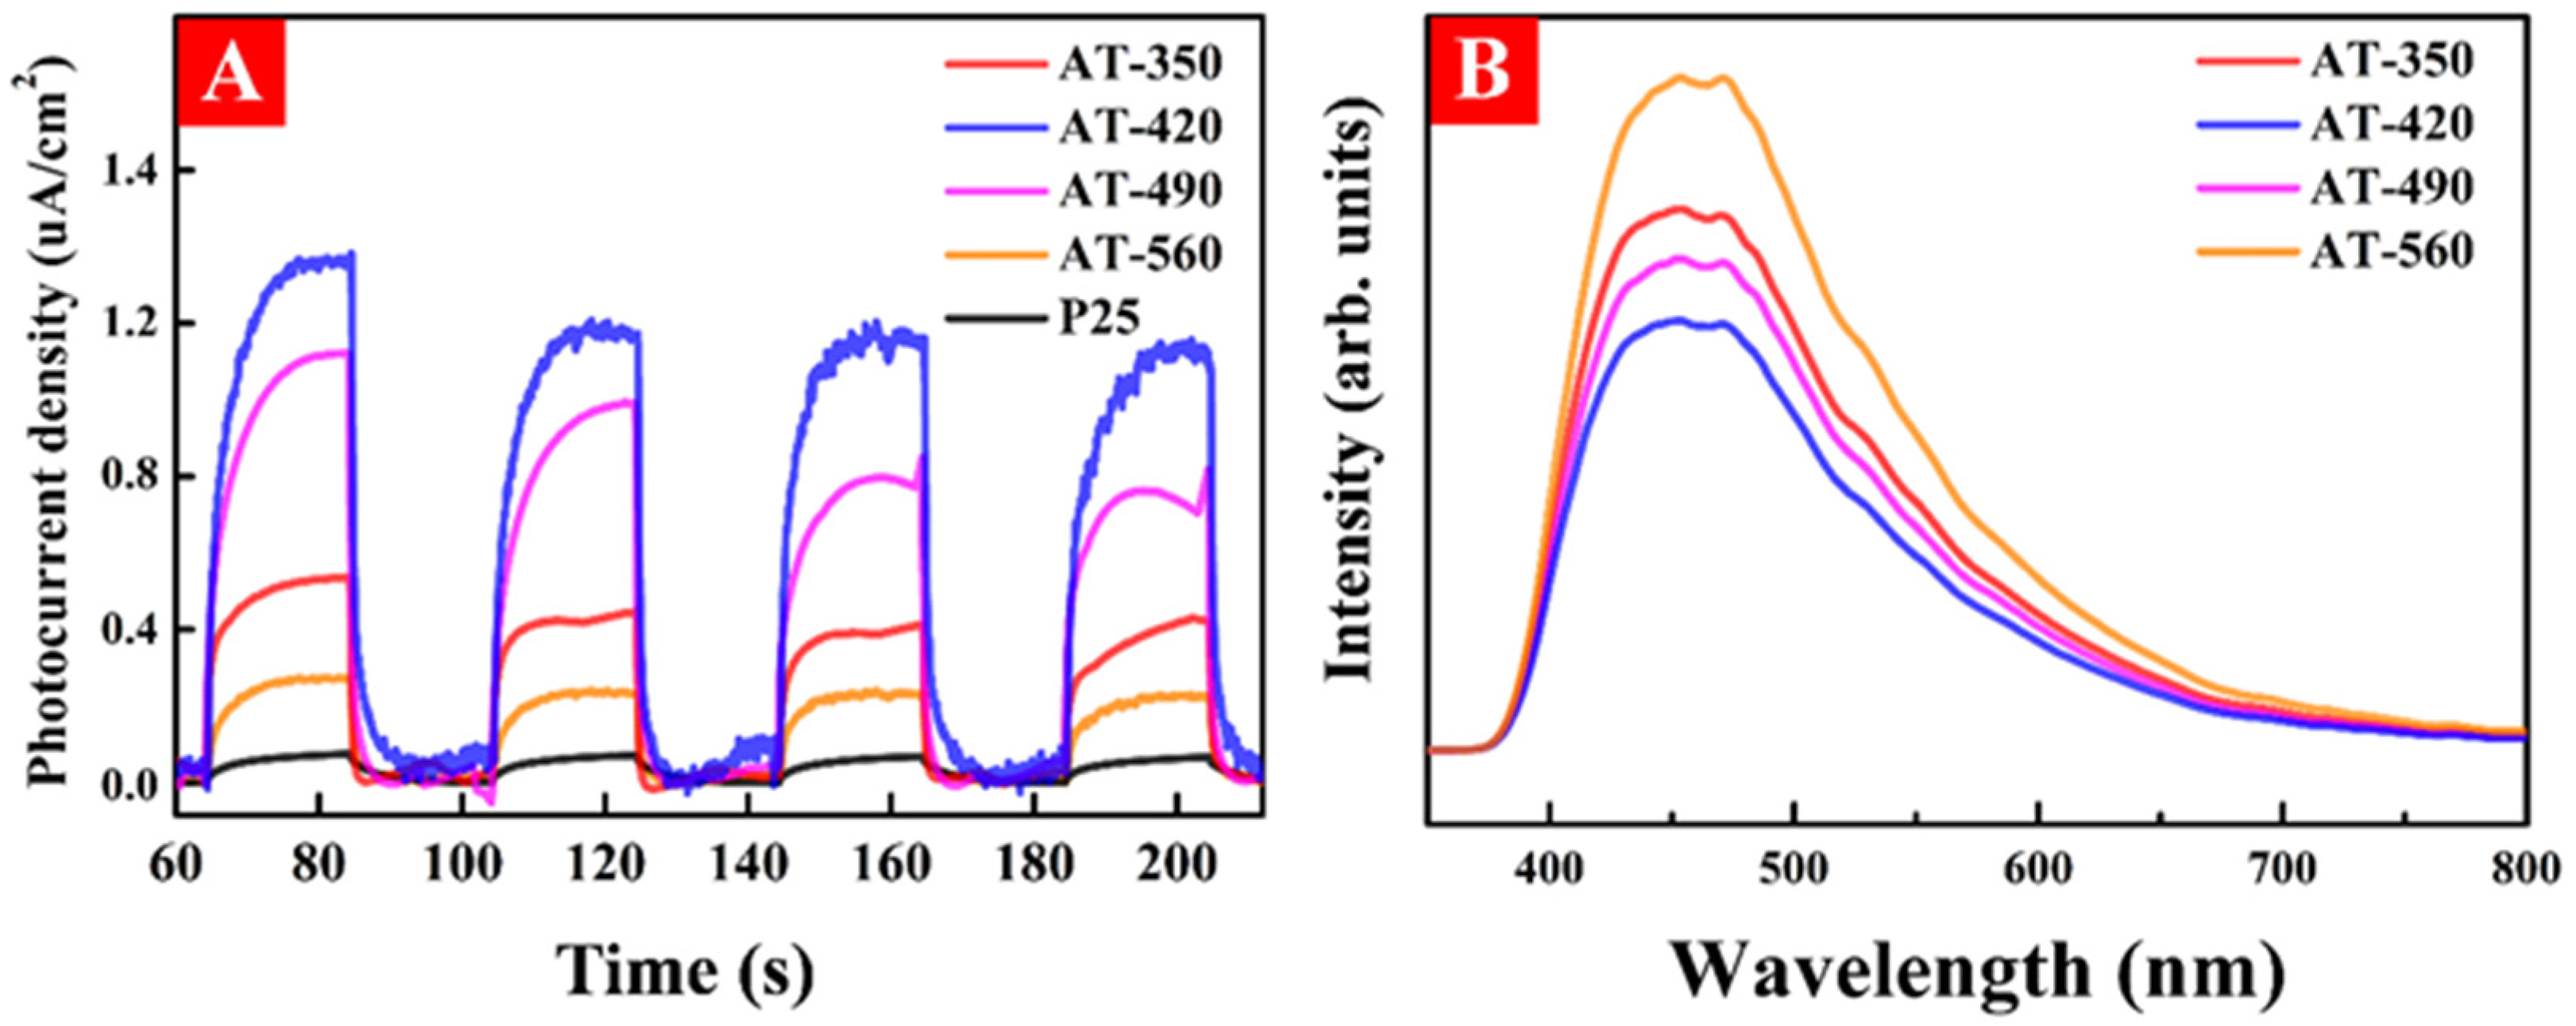
3.4. The Photo-Generated Carrier Activity of HAm-TiO2−x

To explore the influence of subsurface OV on the production and transferability of photogenerated charge carriers, the transient photocurrent density and PL spectra were explored using visible-light irradiation. As shown in Figure 7A, AT-420 displayed the highest photocurrent density among these samples, revealing the largest photoinduced carrier production and more efficient charge carrier separation. As displayed in Figure 7B, the PL spectra were measured to evaluate the photo-generated e–h pairs separation and transfer efficiency. It is clear that sample AT-420 exhibited the lowest intensity of all the samples, suggesting accelerated photoinduced carrier separation and transfer. Therefore, subsurface OV in HAm-TiO2−x contributed to the generation and transferring ability of photocarriers, which could greatly increase its visible-light photoactivity.

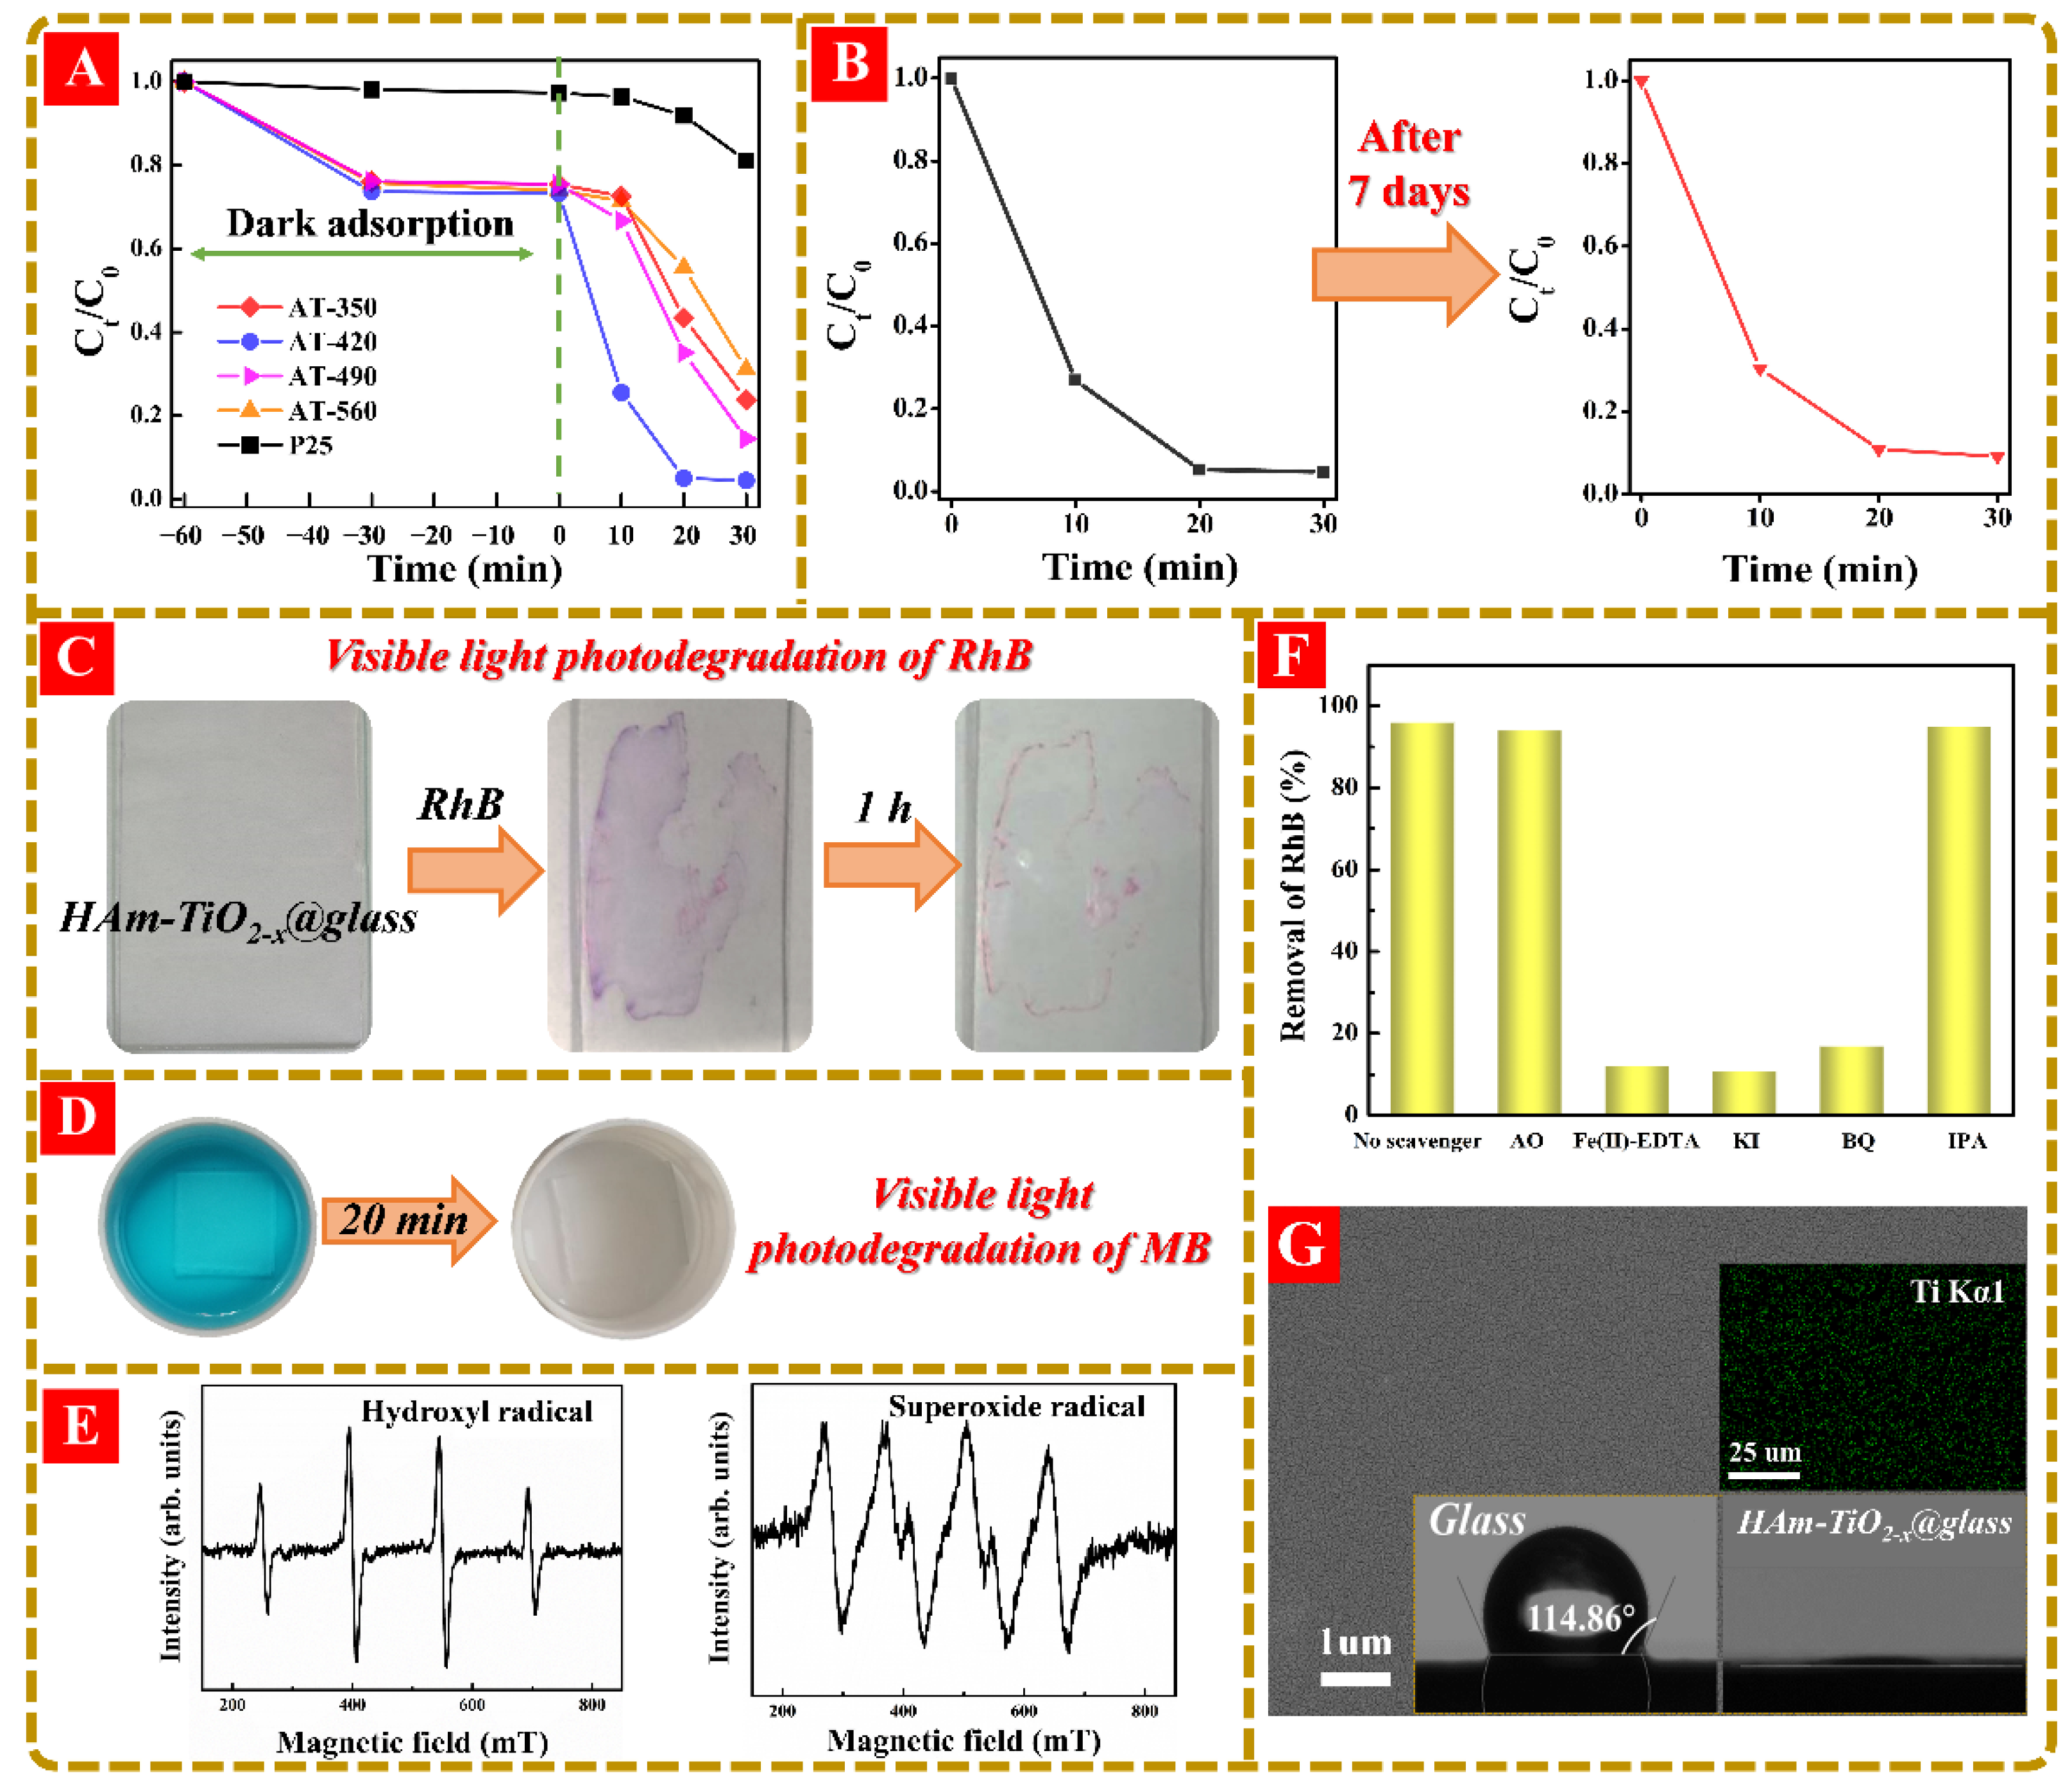
3.5. The Visible-Light-Driven Photodegradation of HAm-TiO2−x and Its Coatings

The visible-light photoactivity of HAm-TiO2−x was evaluated by RhB photodegradation, shown in Figure 8A. During the dark adsorption, nearly 27.3% of RhB was removed by adsorption. AT-420 displayed the best performance among these samples, such that RhB photodegradation was accomplished within 20 min, owing to the fact that surface/subsurface OV is generally considered unstable in air and water by the ambient oxidation, leading to faded photoactivity. Herein, to check the stability, AT-420 was put into deionized water for 7 days under ambient conditions for the aging test. Obviously, there was no clear difference between each round when using the aged AT-420 shown in Figure 8B, which proves that this surface/subsurface OV in HAm-TiO2−x was rather stable. In order to extend applications under various complicated environments, photocatalyst nanoparticles were usually deposited on diverse substrates, including glass, plastic film, and fiber. Herein, we urged the use of photocatalytic coating that has highly visible-light driven self-cleaning performance. We deposited HAm-TiO2−x nanoparticles on glass (HAm-TiO2−x @ glass, 10 × 5 × 0.3 cm3), which displayed an excellent photocatalytic self-cleaning performance when decomposing the dyes. As shown in Figure 8C, apart from the remaining high concentration “coffee ring” of RhB, most of the area became clean again. In addition, the visible-light photodegradation of methylene blue (MB) was also performed using the coated glass (2 × 2 × 0.3 cm3), as shown in Figure 8D, displaying a complete degradation of MB pollution. Therefore, according to the above polluted water photodegradation experiments, both HAm-TiO2−x nanoparticles and its coatings enjoyed high visible photoactivity. Moreover, to detect ·OH and ·O2, EPR spin trapping experiments were employed over AT-420, with visible-light irradiation. As observed in Figure 8E, obvious signals of DMPO-OH and DMPO-O2 confirmed that ·OH and ·O2 were the dominant active oxygen species during photodegradation. Notably, the quantity of ·O2 was as much as seven times larger than that of ·OH listed in Table S1, which was generated by the surface OV-absorbed electrons and which, simultaneously, verified the large quantities of surface/subsurface OV. Actually, except for ·OH and ·O2, various reactive species, including ·OHads (·OH absorbed on the catalyst surface), photoinduced holes (h+), electrons, as well as H2O2, also participated during the photodegradation process. To explore the contribution from these reactive species, the trapping experiments were carried out over AT-420 using visible-light irradiation. Five kinds of scavengers, including AO, Fe(II)-EDTA, KI, BQ, and IPA were used to probe h+, H2O2, OHads and electron, ·O2, and ·OH in the bulk solution, respectively [50]. As shown in Figure 8F, the visible-light photodegradation rate without scavenger was 95.9%, while, in the presence of AO, Fe(II)-EDTA, KI, BQ, and IPA were 94.1%, 12.2%, 11.3%, 17.8, and 95.3%, respectively. It was, thus, confirmed that ·OHads, ·O2, and H2O2 were the dominated reactive species that contributed to high visible-light photoactivity, which is in good accordance with the EPR spin trapping results. However, h+ and ·OH in the bulk solution had almost no influence on photoactivity, which demonstrated that the generation of h+ was invalidated by preventing the transition of electrons from the valence band to the conduction band or the OV defect band, and was consistent with the band structures results, shown in Figure 5. The recycling experiment using AT-420 under visible light was carried out; the structural changes of the catalyst after usage are seen in Figure S5. Finally, the surface appearance of HAm-TiO2−x @ glass was characterized by SEM, as seen in Figure 8G. According to 1-μm magnification SEM image, HAm-TiO2−x nanoparticles were uniformly coated on the glass surface, and the EDS mapping with 25-μm magnification also proved that Ti element was uniformly distributed on the glass surface. Increasing surface uniformity of HAm-TiO2−x nanoparticles can contribute to its photocatalytic activity. Due to the distribution of HAm-TiO2−x nanoparticles, the HAm-TiO2−x on the glass showed superhydrophilicity, which could increase the contact area between the catalyst and pollutant molecules, and which, thus, improved the photodegradation performance.

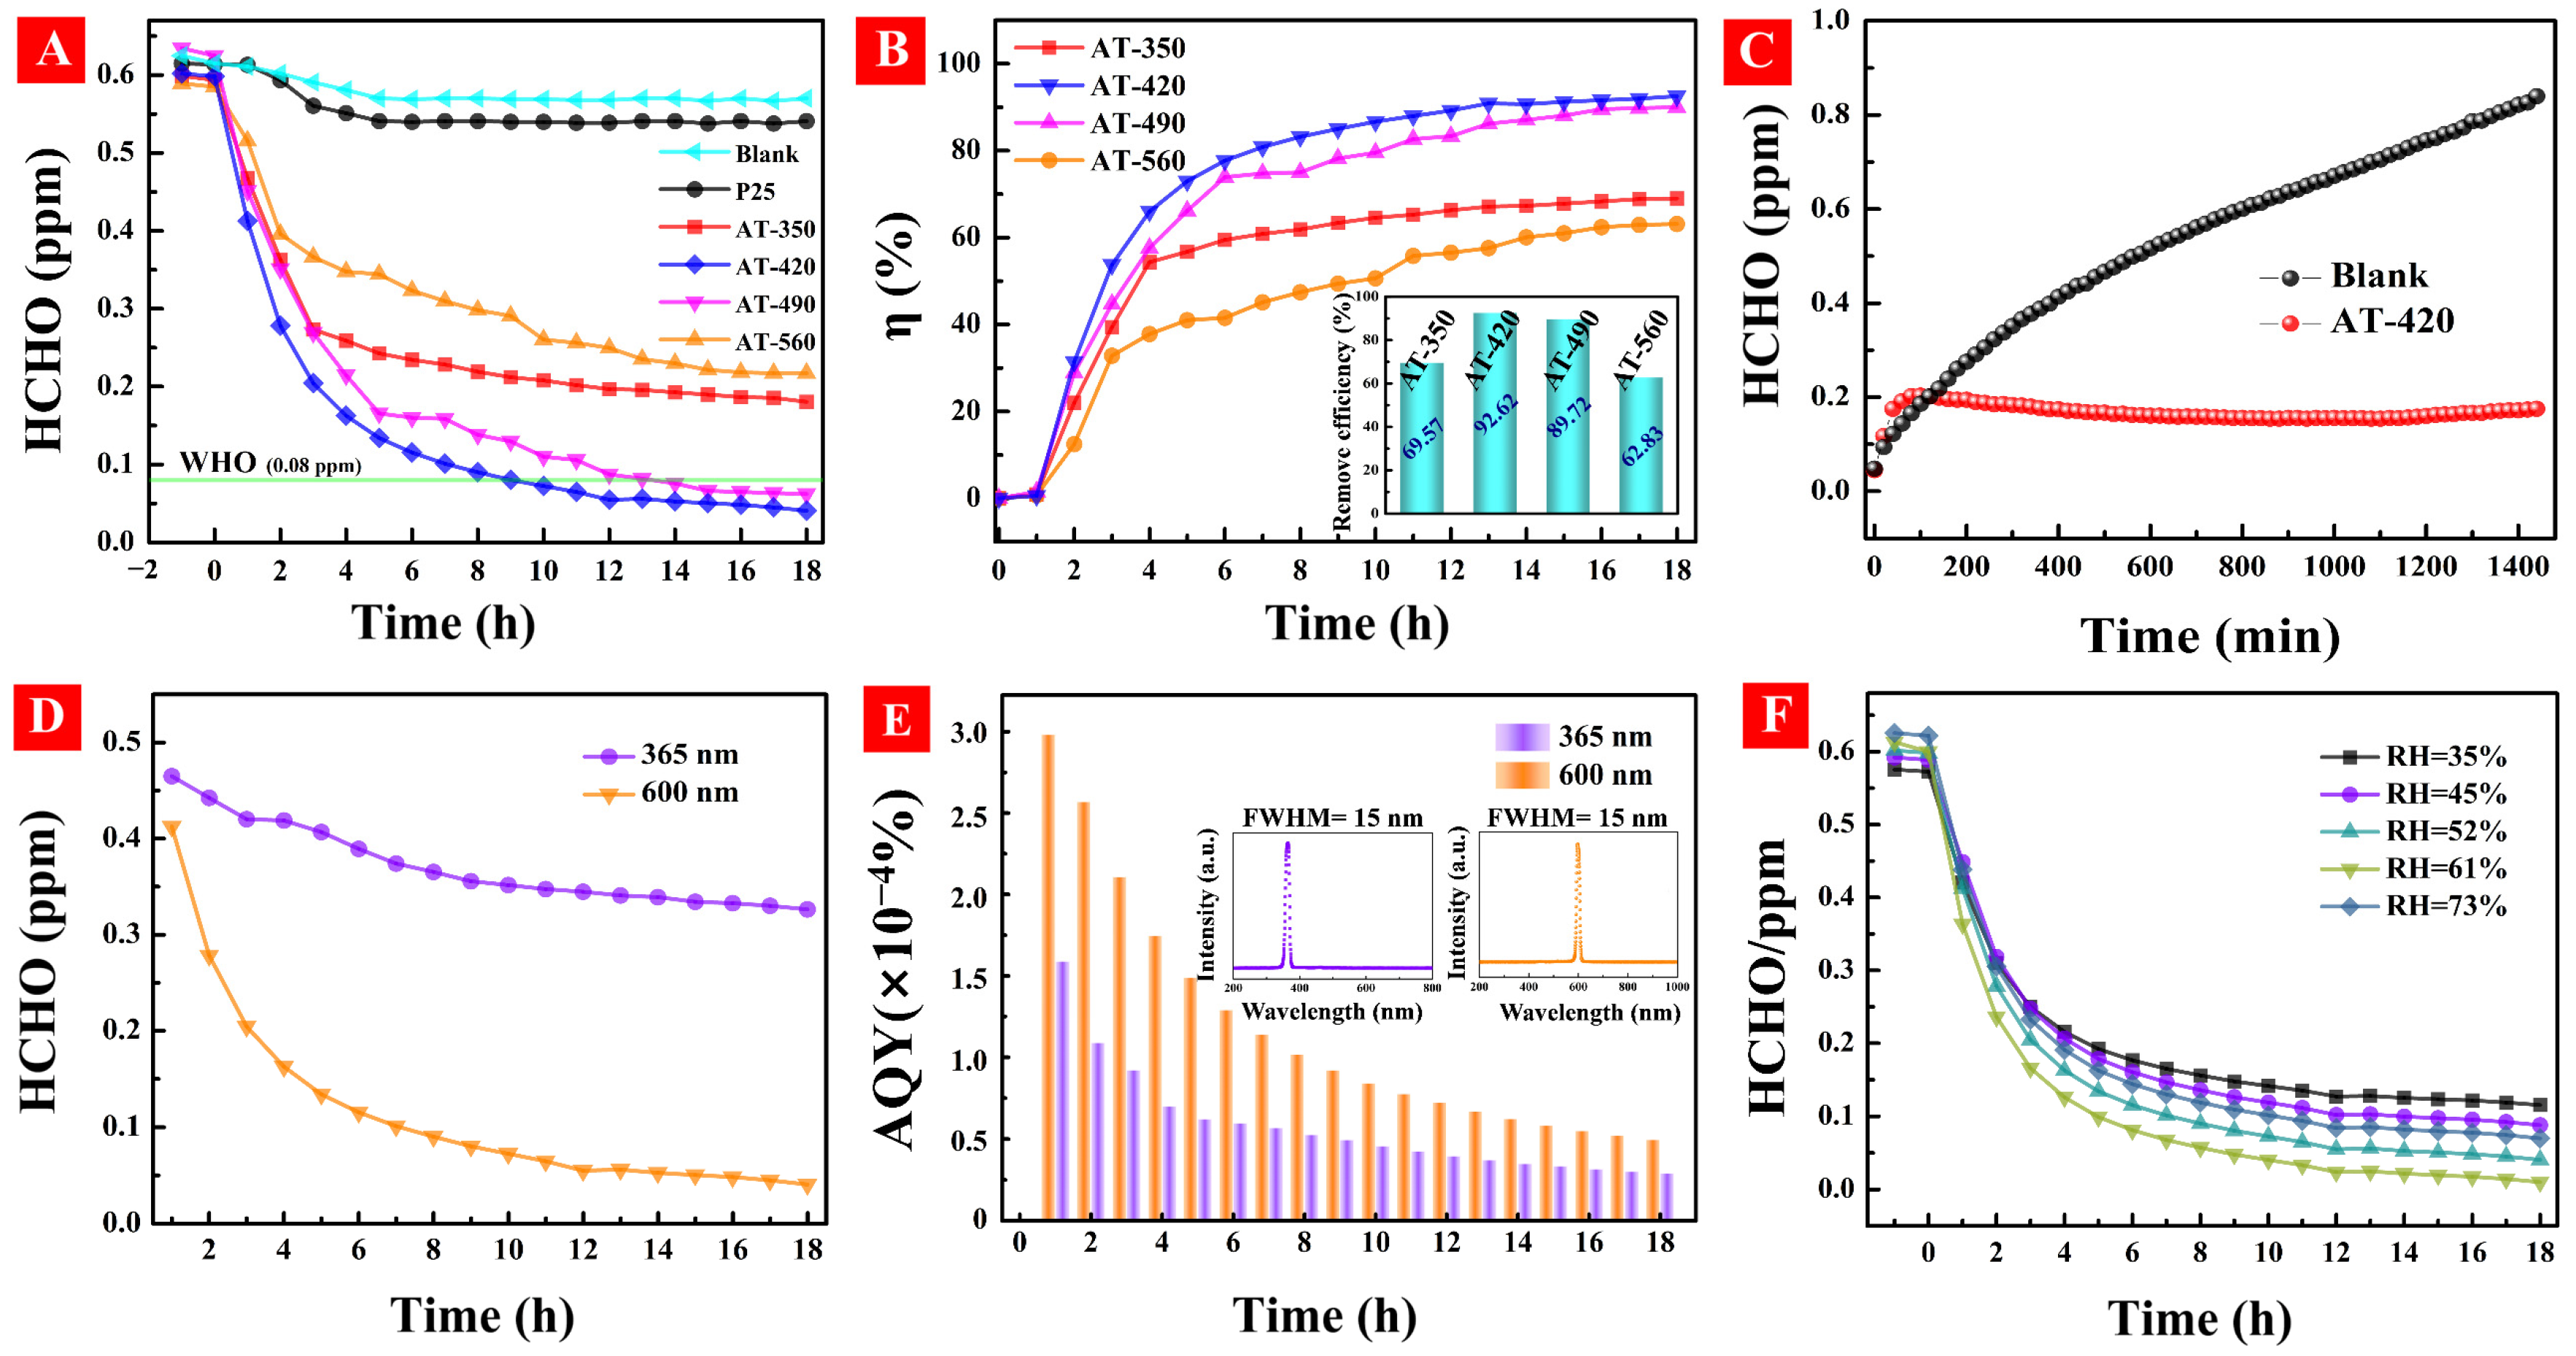
3.6. The HCHO Photodegradation Activity under Ambient Environment

To investigate the formaldehyde (HCHO) photodegradation efficiency under ambient environment, a sealed box (1 × 1 × 1 m3) was used with simulated indoor conditions inside the box, including low HCHO concentration (~0.6 ppm), air atmosphere, indoor temperature (~25 °C), relative humidity (RH = 45%), and low-power-density irradiation (λ = 600 nm, 0.136 mW/cm2). As shown in Figure 9A, HAm-TiO2−x coating was put in the box for 1-h dark adsorption; the HCHO concentrations decreased slightly in the presence of all samples. During the visible light irradiation (0–18 h), gradual HCHO photodegradations were observed and followed a rank: AT-560 < AT-350 < AT-490 < AT-420, which also obeyed the rank of subsurface OV concentration, as shown in PAS results. As an experimental comparison under the same condition, the HCHO concentration only decreased to 0.55 ppm using P25 TiO2, owing to its poor visible light photodegradation. Notably, the final HCHO concentrations with AT-420 and AT-490 were both lower than 0.08 ppm, which is the international standard HCHO level for an indoor environment [51]. As shown in Figure 9B, the HCHO conversion efficiency increased rapidly in the initial stage of 0–4 h but reached saturation during 6–18 h; AT-420 exhibited the highest conversion efficiency of 92.62% (inset) among these samples. To verify the stability of HCHO photodegradation, a sustained release formaldehyde source was put in the box. As displayed in Figure 9C, the HCHO concentration linearly increased and, finally, reached 0.8 ppm in the absence of HAm-TiO2−x. When AT-420 coating was put in the box, the HCHO concentration, as comparation, sharply increased during the 0–100 min, but trended to a steady value of 0.2 ppm with the increasing time, which suggested that a balance between the HCHO release and the photodegradation was achieved. More importantly, there was no upward tendency of HCHO concentration, demonstrating the strong and stubborn photoactivity of HAm-TiO2−x that can erase the accumulation of HCHO and its by-products on catalyst surface. In addition, UV light of 365 nm assisted HCHO photodegradation, which was carried out using AT-420 coating, as shown in Figure 9D, which unexpectedly displayed poor photoactivity. Furthermore, the AQYs of HCHO photodegradation with different wavelengths of light were measured using AT-420 coating, as shown in Figure 9E. With the 600-nm light source, the AQY in the beginning of 0–2 h was nearly 3 × 10⁻⁴% but decreased gradually during 3–18 h and reached 0.6 × 10⁻⁴% eventually. While, with the 365-nm light source, the AQY exhibited a similar change tendency but was much lower than that of the 600-nm light source. Finally, relative humidity, as an important factor that affects HCHO photodegradation, should be explored. As displayed in Figure 9F, when RH during the visible-light photodegradation over AT-420 was 35%, the HCHO elimination efficiency was 80.7%. When increasing RH from 35% to 61%, the elimination efficiency was also enhanced from 80.7% to 98.3%, which could be ascribed to the adsorbed H2O on HAm-TiO2−x that contributed to the generation of ·OH radical. When RH arrived at 73%, the HCHO decomposition efficiency, however, decreased to 88.7%, which should be a result of the competitive adsorption between H2O and HCHO. Given the above results, HAm-TiO2−x showed high and stable performance in HCHO photocatalytic elimination under the simulated indoor environment.

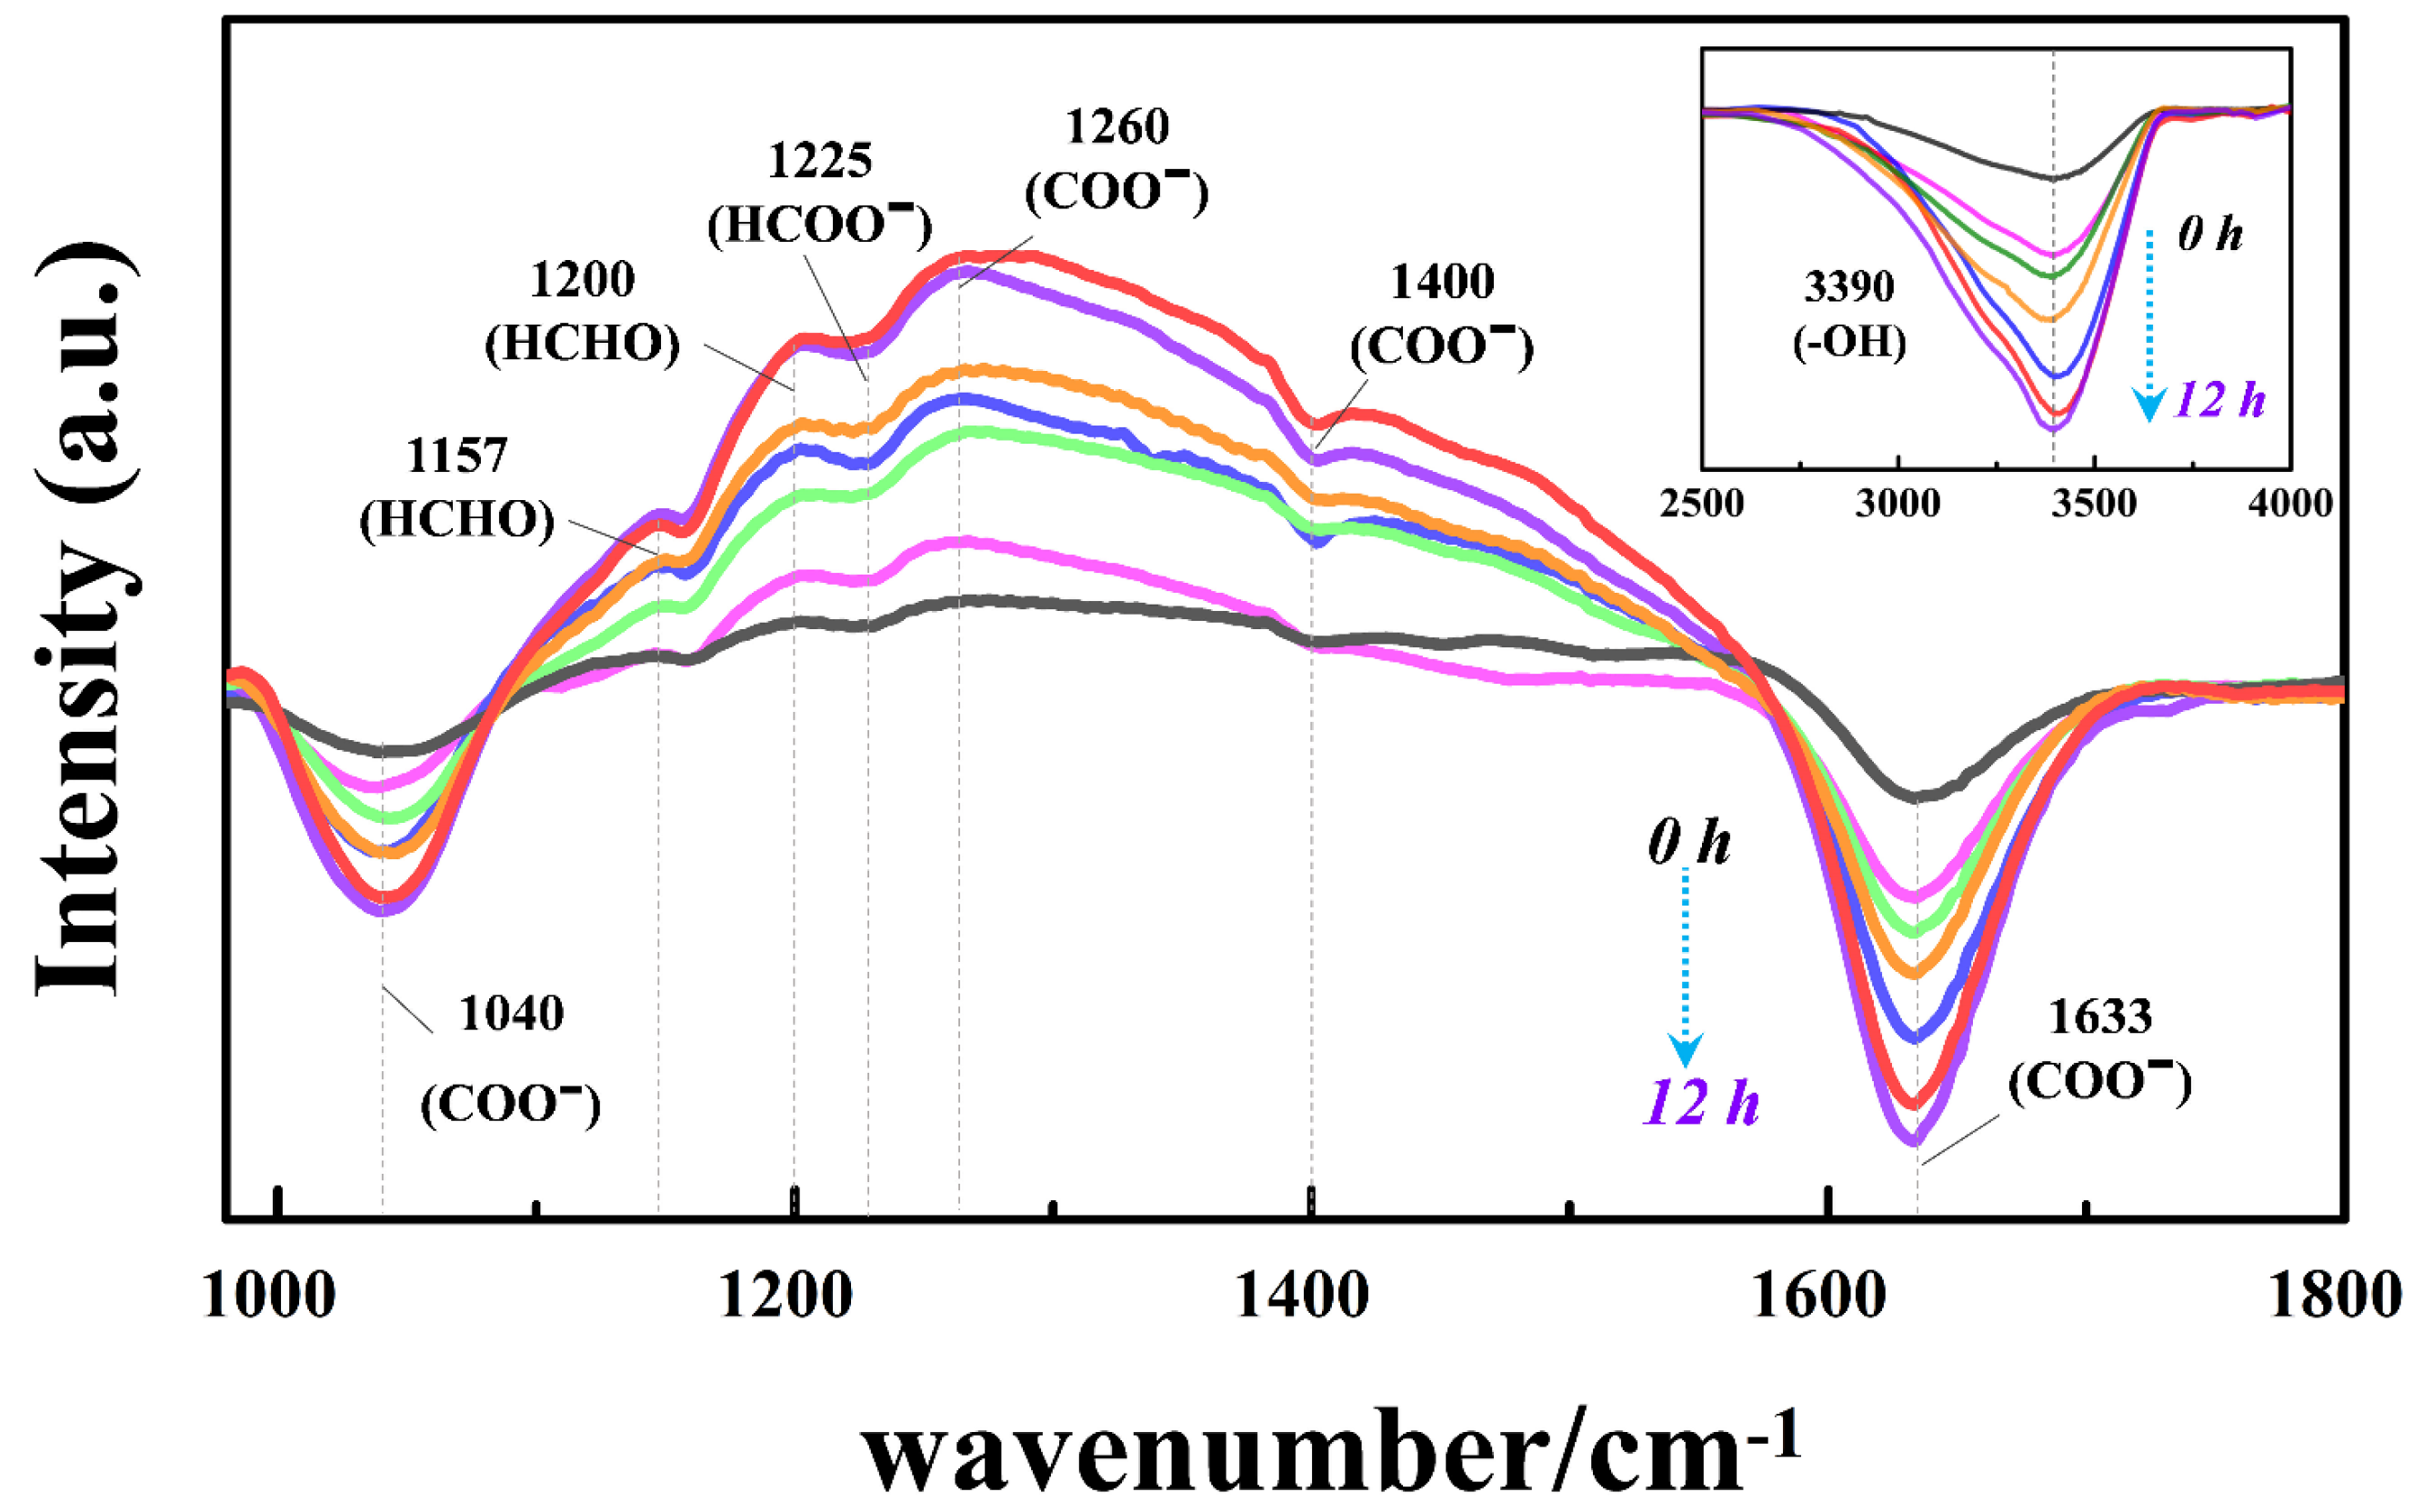
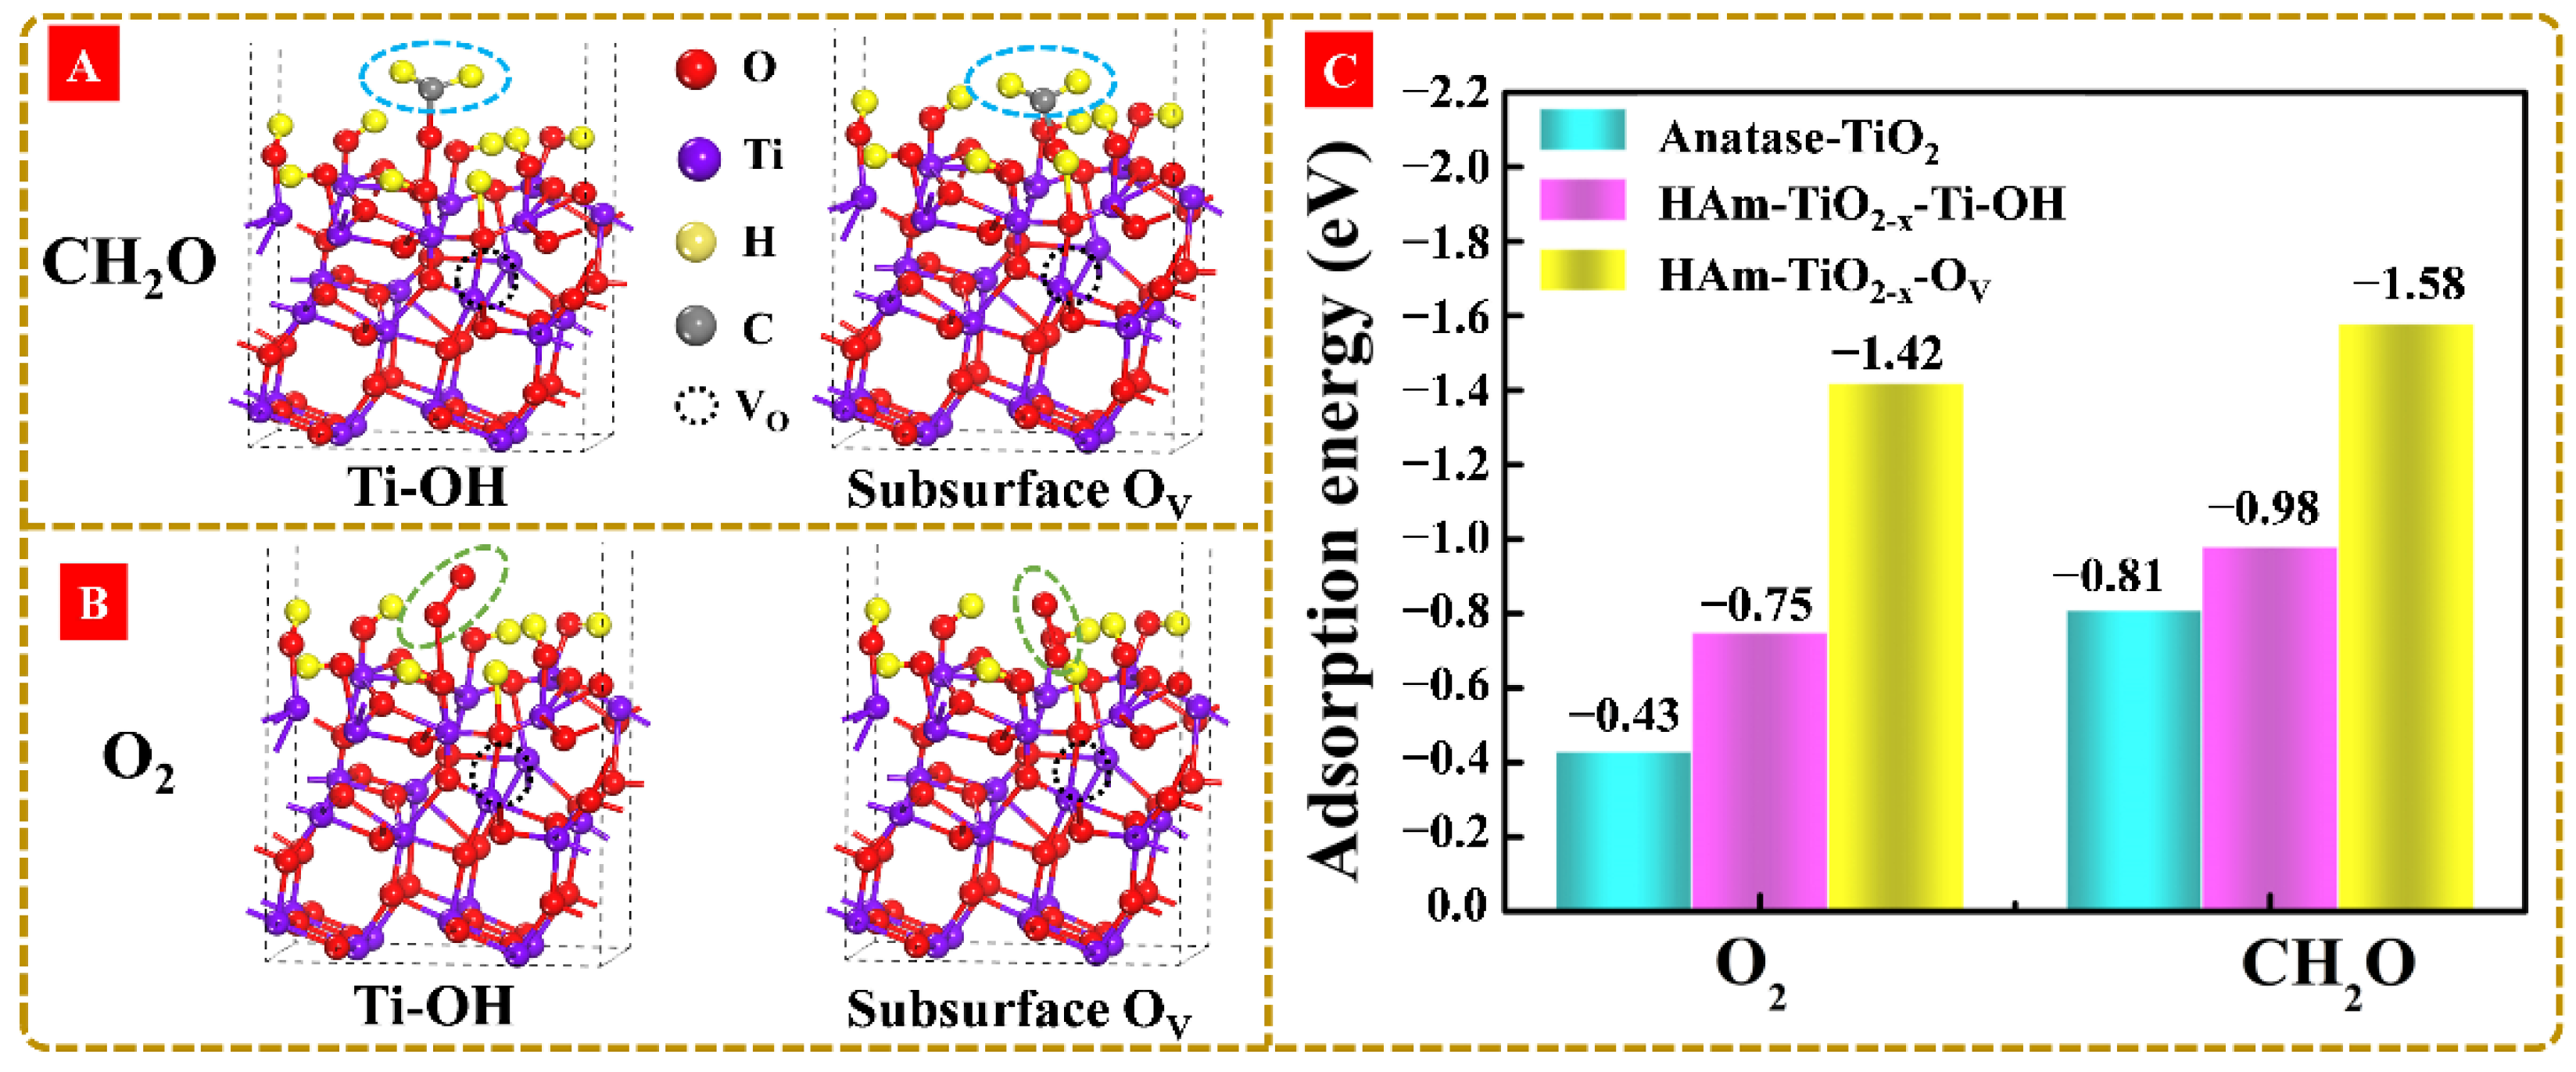
3.7. Investigations on the Surface Reaction Pathway and HCHO Adsorption Mechanism with the Subsurface OV

In-situ DRIFTS analysis was employed to dynamically investigate the reaction pathways of HCHO photodegradation on HAm-TiO2−x surface. As shown in Figure 10, the peaks at 1157 and 1200 cm−1 were identified as HCHO [52,53]; the peaks at 1040, 1260, 1400, and 1633 cm−1 were ascribed to carbonate species [54,55,56,57]; the peak at 1225 cm−1 was considered as a formate species [58], while the peak at 3390 cm−1 was considered as surface Ti-OH [23]. Observably, with the increasing irradiation time, the concentrations of all reactants, including formaldehyde, carbonate species, formate species, and surface hydroxyl groups were increased, suggesting that formaldehyde was absorbed on the HAm-TiO2−x surface and oxidized by hydroxyl radicals into formate species and carbonate species. The main intermediates were carbonate species, which suggested the fast oxidation of HCHO and formate species. Thus, we inferred two potential photo-decompose paths of HCHO → HCOOH → H2CO3 → CO2, and HCHO → HCOOH → CO2. Unexpectedly, photocatalyst inactivation by this accumulated carbonate species and formate species did not occur, which was proven by the enhancement of surface hydroxyl groups with time. In light of these results and discussion, it was, thus, concluded that HAm-TiO2−x possessed a straightforward reaction pathway and relevant strong photoactivity in HCHO photodegradation.
Generally, the photodegradation of HCHO is assumed to be determined by the synergistic effect of light absorption, photocarriers migration, reactants adsorption, and reaction pathway. Based on the aforementioned characterization results and discussion, HAm-TiO2−x exhibited high performances in visible-light absorption, e–h pairs migration, and straightforward reaction pathways. Herein, reactants adsorption and, especially, the effect of surface hydroxyl group and OV on chemisorb capability of HCHO and O2, should be revealed. Here, we constructed two kinds of DFT-simulated adsorption models, including HAm-TiO2−x-OH (the effect of surface hydroxyl group) and HAm-TiO2−x-OV (the effect of subsurface OV) to investigate HCHO adsorption (Figure 11A) and O2 adsorption (Figure 11B). Based on the DFT models, the adsorption energies of O2 and HCHO on the surfaces of anatase TiO2, HAm-TiO2−x-OH, and HAm-TiO2−x-OV are exhibited in Figure 11C. Anatase TiO2 showed the adsorption energies of −0.43 eV (O2) and −0.81 eV (HCHO). When using HAm-TiO2−x-OH, a lower adsorption energy of O2 (−0.75 eV) and HCHO (−0.98 eV) were obtained. As for HAm-TiO2−x-OV, the corresponding adsorption energies were sharply decreased to −1.42 and −1.58 eV. Therefore, adsorption capabilities of O2 and HCHO in HAm-TiO2−x were both largely promoted in the presence of subsurface OV, which could significantly promote the capturing of HCHO on the HAm-TiO2−x photocatalyst and improve the HCHO photodegradation efficiency.

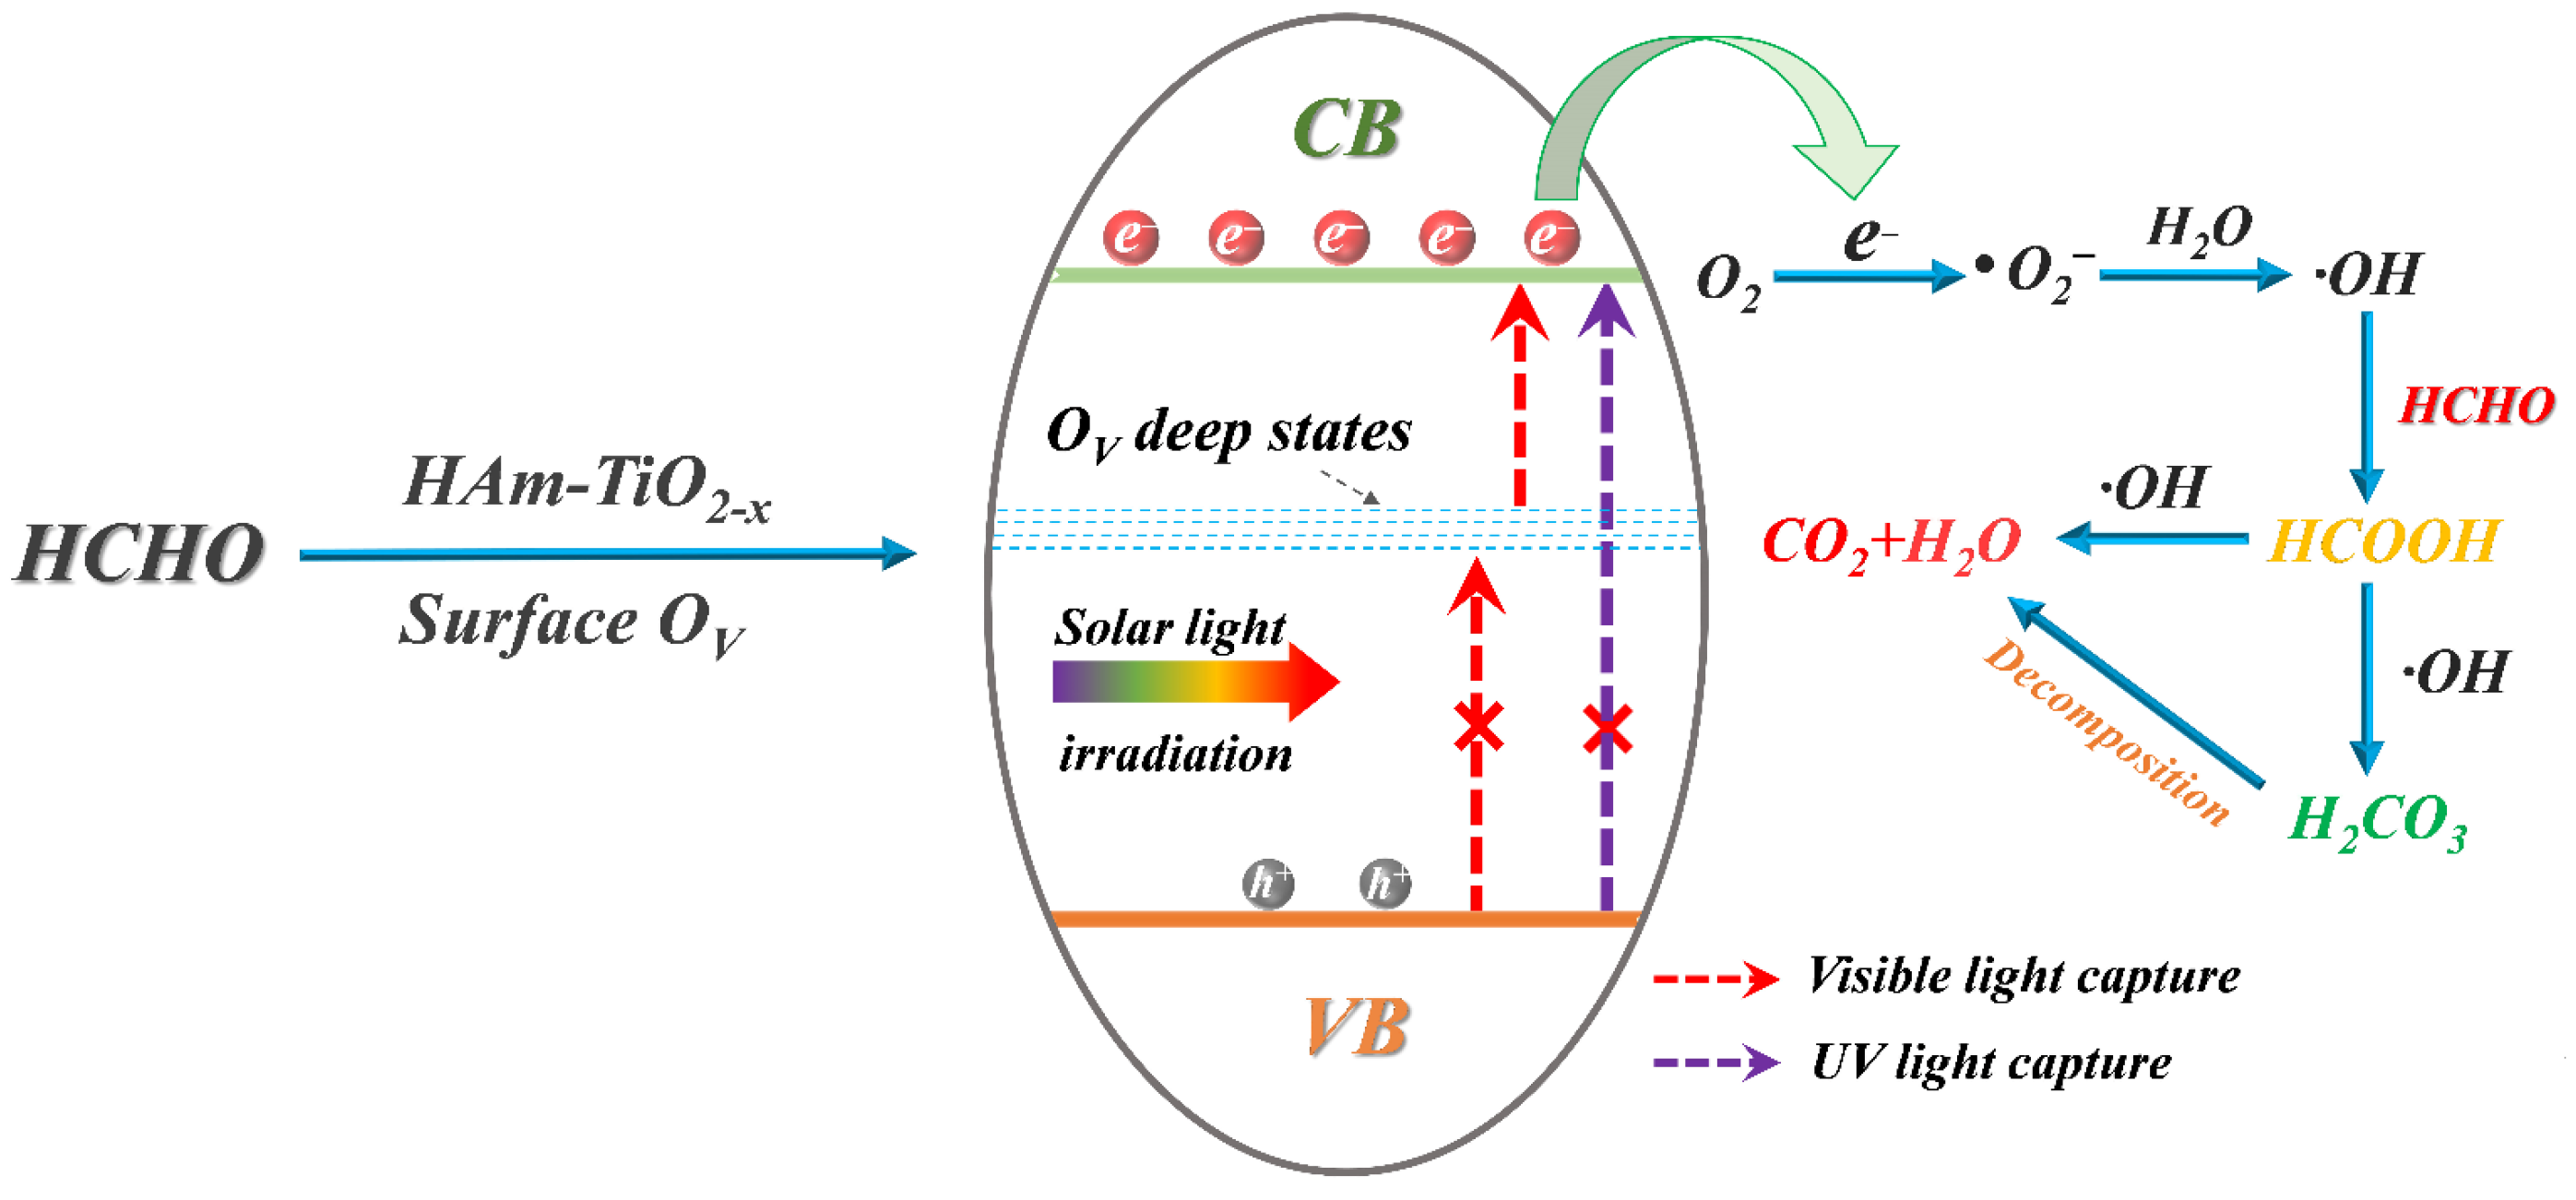
3.8. The Mechanism of HCHO Photocatalysis and OV Generation over HAm-TiO2−x

Based on the above results and discussions, the photocatalysis mechanism of HCHO purification with HAm-TiO2−x was illustrated in Figure 12. The refined electrical structure of HAm-TiO2−x followed the band structures of the Subsurface-4OV model, as mentioned in Figure 6e, which generated deep trap states close to the conduction band. When solar light irradiation—which has large effective mass—owing to the OV-induced midgap trap states, restricts charge mobility, electrons from valence states are hardly transferred from valence band to OV-induced deep states or conduction band, leading to bad photoactivity in the UV region. Visible-light capture in HAm-TiO2−x is mainly originated from OVS-CB transition, as mentioned in Figure 6. To some extent, HAm-TiO2−x, with its self-doped OV defects was, thus, customized for long-wavelength response photocatalysis. On the other hand, with the benefits of abundant surface OV, photoinduced electrons had high separation efficiency and long lifetime, resulting in directional migration from the inner lattice to the top surface. Localized surface OV accumulated a considerable number of electrons to react with O2 and H2O to form·O2 and ·OH, which can rapidly decompose the adsorbed HCHO into CO2, H2O, and intermediates such as HCOOH and H2CO3. Moreover, contributed by subsurface OV and surface hydroxyl radical (·OH), chemisorb energy of HAm-TiO2−x was much lower than that of crystalline anatase TiO2, resulting in the boosted adsorption capability of HCHO.
Finally, the formation mechanism of HAm-TiO2−x nanoparticles should be clarified. In fact, apart from the generation of hydrogen atoms, liquid plasma discharge also produces many kinds of oxidative species including superoxide anion radicals, electrons, hydroxyl radical, hydrogen peroxide, and ultraviolet radiation, which enables strong oxygenation in electrolyte [59,60]. Herein, liquid plasma discharge involved two contrasting effects: liquid plasma hydrogenation and oxidation. Whether hydrogenation or oxidation dominates the whole reaction depends on the output power. Typically, hydrogenation plays a major role at a lower output power. With a proper increase of output power, hydrogenation is simultaneously enhanced and governs the reaction, but, when output power further increases and reaches a threshold, oxidation beyond hydrogenation dominates the whole reaction. In our case, compared with AT-350, a stronger hydrogenation effect was achieved with AT-420 (Figure S1), which resulted in a much higher OV concentration. By further increasing output power (AT-420 to AT-560), surface OV concentration declined, which could be due to the leading role of liquid plasma oxidation over the process. As a result, this alternate effect of hydrogenation and oxidation could also account for the “round-trip” occurrence of OV in HAm-TiO2−x, as well as the rank of subsurface OV concentration, listed as AT-560 < AT-350 < AT-490 < AT-420 (as seen in PAS and XPS data).

4. Conclusions

In this work, hydrogenated amorphous TiO2−x with high surface area (176.7 cm2 g−1) was successfully prepared using a liquid plasma-induced hydrogenation strategy. The effect of surface OV engineering on the physico-chemical properties of amorphous TiO2 photocatalyst and, in particular, the manipulation of OV concentration and distribution on its electrical structure, was revealed. The optical and electrical properties of HAm-TiO2−x were affected by the surface OV engineering, which could be directly regulated by controlling the output power of liquid plasma. Subsurface OV, rather than surface OV, induced a disordered surface, which accounted for the narrow bandgap (2.36 eV) by introducing deep trap states under a conduction band (0.5 eV). With the advantages of strong visible-light capture and efficient photocarriers transferring, HAm-TiO2−x and its coatings exhibited strong visible-light photodegradation of polluted water. Furthermore, HAm-TiO2−x was employed to decompose low-concentration formaldehyde under severe indoor environments. Investigations on the surface reaction pathway and formaldehyde adsorption mechanism with the subsurface OV were also carried out. We found that subsurface OV in HAm-TiO2−x could significantly enhance the adsorption energy of HCHO (−1.58 eV) and O2 (−1.42 eV), compared with anatase TiO2. Based on large amounts of ·OH radicals and strong chemiadsorption capability, HAm-TiO2−x showed high quantum efficiency of 3 × 10⁻⁶ molecules/photon and photoactivity of 92.6% under visible light (λ = 600 nm). Sustaining growth of surface ·OH radicals guaranteed long-term photocatalytical stability and disabled the surface deactivation of HAm-TiO2−x. Owing to its superior photoactivity, extremely low cost, and simple preparation technology, hydrogenated amorphous TiO2−x could be suitable for large production to apply in some practical photocatalytic environment purifications in the future.

Supplementary Materials

The following supporting information can be downloaded at: https://0-www-mdpi-com.brum.beds.ac.uk/article/10.3390/nano12050742/s1, Figure S1: The emission spectrum of liquid plasma with different output power, (A–D) are obtained by applying the output power of 350, 420, 490, and 560 W, respectively, Figure S2: Raman spectra of all HAm-TiO2−x samples, Figure S3: (A–D) were the Kubelka Munk graphs of AT-350 (2.64 eV), AT-420 (2.24 eV), AT-490 (2.51 eV), and AT-560 (2.89 eV), respectively, Figure S4: X-ray photoelectron spectroscopy valence band spectra of all samples, Figure S5: (A) The recycling experimental of RhB using AT-420 under visible light. (B,C) were EPR and XRD data for AT-420 and catalyst after recycling reaction, respectively. (D) High resolution TEM image of AT-420 after recycling reaction, and the disordered surface was marked with yellow dashed line, Table S1: The amount of ·O2 and ·OH by employing of 5,5-dimethyl-1-pyrroline-N-oxide (DMPO) to in-situ trap the spin-reactive species.

Author Contributions

G.F.: experimental measurements, material fabrication, manuscript preparation. B.W.: theoretical simulation, and manuscript reviewing. M.H., S.Y., Y.L. and S.S.: experiments and project discussions. H.Z.: photocatalyst design and experiments, project supervision, manuscript writing and reviewing. All authors have read and agreed to the published version of the manuscript.

Funding

This work was granted by National Key Research and Development Program of China (2018YFB0504400), National Natural Science Fund of China (11621404, 11727812, and 62035005), and Shanghai Science and Technology Commission (2019SHZDZX01-ZX06).

Institutional Review Board Statement

Not applicable.

Informed Consent Statement

Not applicable.

Data Availability Statement

The data presented in this study are available on request from the corresponding author. The data are not publicly available due to the reason that the data also forms part of an ongoing study.

Acknowledgments

This work was granted by National Key Research and Development Program of China (2018YFB0504400), National Natural Science Fund of China (11621404, 11727812, and 62035005), and Shanghai Science and Technology Commission (2019SHZDZX01-ZX06).

Conflicts of Interest

The authors declare no conflict of interest.

References

  1. Fujishima, A.; Rao, T.N.; Tryk, D.A. Titanium dioxide photocatalysis. J. Photoch. Photobiol. C 2000, 1, 1–21. [Google Scholar] [CrossRef]
  2. Rao, Z.; Lu, G.; Mahmood, A.; Shi, G.; Xie, X.; Sun, J. Deactivation and activation mechanism of TiO2 and rGO/Er3+-TiO2 during flowing gaseous VOCs photodegradation. Appl. Catal. B Environ. 2021, 284, 119813. [Google Scholar] [CrossRef]
  3. Daghrir, R.; Drogui, P.; Robert, D. Modified TiO2 for environmental photocatalytic applications: A review. Ind. Eng. Chem. Res. 2013, 52, 3581–3599. [Google Scholar] [CrossRef]
  4. Luciani, G.; Imparato, C.; Vitiello, G. Photosensitive hybrid nanostructured materials: The big challenges for sunlight capture. Catalysts 2020, 10, 103. [Google Scholar] [CrossRef] [Green Version]
  5. Janczarek, M.; Endo-Kimura, M.; Raja-Mogan, T.; Kowalska, E. The role of oxygen vacancy and other defects for activity enhancement. In Green Photocatalytic Semiconductors: Recent Advances and Applications; Garg, S., Chandra, A., Eds.; Springer International Publishing: Cham, Switzerland, 2022; pp. 337–355. [Google Scholar]
  6. Hao, L.; Huang, H.; Zhang, Y.; Ma, T. Oxygen vacant semiconductor photocatalysts. Adv. Funct. Mater. 2021, 31, 2100919. [Google Scholar] [CrossRef]
  7. Zhang, Y.; Xu, Z.; Li, G.; Huang, X.; Hao, W.; Bi, Y. Direct observation of oxygen vacancy self-healing on TiO2 photocatalysts for solar water splitting. Angew. Chem. Int. Edit. 2019, 58, 14229–14233. [Google Scholar] [CrossRef] [Green Version]
  8. Li, J.; Zhang, M.; Guan, Z.; Li, Q.; He, C.; Yang, J. Synergistic effect of surface and bulk single-electron-trapped oxygen vacancy of TiO2 in the photocatalytic reduction of CO2. Appl. Catal. B Environ. 2017, 206, 300–307. [Google Scholar] [CrossRef]
  9. Lin, L.; Ma, Y.; Wu, J.; Pang, F.; Ge, J.; Sui, S.; Yao, Y.; Qi, R.; Cheng, Y.; Duan, C.; et al. Origin of photocatalytic activity in Ti4+/Ti3+ core–shell titanium oxide nanocrystals. J. Phys. Chem. C 2019, 123, 20949–20959. [Google Scholar] [CrossRef]
  10. Mao, J.; An, X.; Gu, Z.; Zhou, J.; Liu, H.; Qu, J. Visualizing the interfacial charge transfer between photoactive microcystis aeruginosa and hydrogenated TiO2. Environ. Sci. Technol. 2020, 54, 10323–10332. [Google Scholar] [CrossRef]
  11. Li, J.; Weng, B.; Cai, S.; Chen, J.; Jia, H.; Xu, Y. Efficient promotion of charge transfer and separation in hydrogenated TiO2/WO3 with rich surface-oxygen-vacancies for photodecomposition of gaseous toluene. J. Hazard. Mater. 2018, 342, 661–669. [Google Scholar] [CrossRef]
  12. Yan, Y.; Cheng, X.; Zhang, W.; Chen, G.; Li, H.; Konkin, A.; Sun, Z.; Sun, S.; Wang, D.; Schaaf, P. Plasma hydrogenated TiO2/Nickel foam as an efficient bifunctional electrocatalyst for overall water splitting. ACS Sustain. Chem. Eng. 2019, 7, 885–894. [Google Scholar] [CrossRef]
  13. Zhang, K.; Park, J.H. Surface localization of defects in black TiO2: Enhancing photoactivity or reactivity. J. Phys. Chem. Lett. 2017, 8, 199–207. [Google Scholar] [CrossRef]
  14. Chen, X.; Liu, L.; Huang, F. Black titanium dioxide (TiO2) nanomaterials. Chem. Soc. Rev. 2015, 44, 1861–1885. [Google Scholar] [CrossRef]
  15. Wang, G.; Wang, H.; Ling, Y.; Tang, Y.; Yang, X.; Fitzmorris, R.C.; Wang, C.; Zhang, J.Z.; Li, Y. Hydrogen-treated TiO2 nanowire arrays for photoelectrochemical water splitting. Nano Lett. 2011, 11, 3026–3033. [Google Scholar] [CrossRef] [PubMed]
  16. Danyliuk, N.; Tatarchuk, T.; Kannan, K.; Shyichuk, A. Optimization of TiO2-P25 photocatalyst dose and H2O2 concentration for advanced photo-oxidation using smartphone-based colorimetry. Water Sci. Technol. 2021, 84, 469–483. [Google Scholar] [CrossRef] [PubMed]
  17. Tatarchuk, T.; Danyliuk, N.; Shyichuk, A.; Macyk, W.; Naushad, M. Photocatalytic degradation of dyes using rutile TiO2 synthesized by reverse micelle and low temperature methods: Real-time monitoring of the degradation kinetics. J. Mol. Liq. 2021, 342, 117407. [Google Scholar] [CrossRef]
  18. Kang, J.; Zhang, Y.; Chai, Z.; Qiu, X.; Cao, X.; Zhang, P.; Teobaldi, G.; Liu, L.; Guo, L. Amorphous domains in black titanium dioxide. Adv. Mater. 2021, 33, 2100407. [Google Scholar] [CrossRef]
  19. Wang, B.; Biesold, G.M.; Zhang, M.; Lin, Z. Amorphous inorganic semiconductors for the development of solar cell, photoelectrocatalytic and photocatalytic applications. Chem. Soc. Rev. 2021, 50, 6914–6949. [Google Scholar] [CrossRef]
  20. Sun, S.; Song, P.; Cui, J.; Liang, S. Amorphous TiO2 nanostructures: Synthesis, fundamental properties and photocatalytic applications. Catal. Sci. Technol. 2019, 9, 4198–4215. [Google Scholar] [CrossRef]
  21. Cheng, L.; Li, B.; Cheng, Q.; Baldwin, A.N.; Shang, Y. Investigations of indoor air quality of large department store buildings in China based on field measurements. Build. Environ. 2017, 118, 128–143. [Google Scholar] [CrossRef]
  22. Chang, T.; Wang, J.; Lu, J.; Shen, Z.; Huang, Y.; Sun, J.; Xu, H.; Wang, X.; Ren, D.; Cao, J. Evaluation of indoor air pollution during decorating process and inhalation health risks in Xi’an, China: A case study. Aerosol Air Qual. Res. 2019, 19, 854–864. [Google Scholar] [CrossRef] [Green Version]
  23. He, M.; Ji, J.; Liu, B.; Huang, H. Reduced TiO2 with tunable oxygen vacancies for catalytic oxidation of formaldehyde at room temperature. Appl. Surf. Sci. 2019, 473, 934–942. [Google Scholar] [CrossRef]
  24. Zhu, M.; Muhammad, Y.; Hu, P.; Wang, B.; Wu, Y.; Sun, X.; Tong, Z.; Zhao, Z. Enhanced interfacial contact of dopamine bridged melamine-graphene/TiO2 nano-capsules for efficient photocatalytic degradation of gaseous formaldehyde. Appl. Catal. B Environ. 2018, 232, 182–193. [Google Scholar] [CrossRef]
  25. Huang, Q.; Hu, Y.; Pei, Y.; Zhang, J.; Fu, M. In situ synthesis of TiO2@NH2-MIL-125 composites for use in combined adsorption and photocatalytic degradation of formaldehyde. Appl. Catal. B Environ. 2019, 259, 118106. [Google Scholar] [CrossRef]
  26. Li, Y.; Chen, X.; Wang, C.; Zhang, C.; He, H. Sodium Enhances Ir/TiO2 activity for catalytic oxidation of formaldehyde at ambient temperature. ACS Catal. 2018, 8, 11377–11385. [Google Scholar] [CrossRef]
  27. Li, X.; Li, H.; Huang, Y.; Cao, J.; Huang, T.; Li, R.; Zhang, Q.; Lee, S.-c.; Ho, W. Exploring the photocatalytic conversion mechanism of gaseous formaldehyde degradation on TiO2–x-OV surface. J. Hazard. Mater. 2022, 424, 127217. [Google Scholar] [CrossRef]
  28. He, F.; Jeon, W.; Choi, W. Photocatalytic air purification mimicking the self-cleaning process of the atmosphere. Nature Commun. 2021, 12, 2528. [Google Scholar] [CrossRef]
  29. Wang, X.; Hong, S.; Lian, H.; Zhan, X.; Cheng, M.; Huang, Z.; Manzo, M.; Cai, L.; Nadda, A.; Le, Q.V.; et al. Photocatalytic degradation of surface-coated tourmaline-titanium dioxide for self-cleaning of formaldehyde emitted from furniture. J. Hazard. Mater. 2021, 420, 126565. [Google Scholar] [CrossRef]
  30. Deng, X.-Q.; Zhu, X.; Sun, Z.-G.; Li, X.-S.; Liu, J.-L.; Shi, C.; Zhu, A.-M. Exceptional activity for photocatalytic mineralization of formaldehyde over amorphous titania nanofilms. Chem. Eng. J. 2016, 306, 1001–1009. [Google Scholar] [CrossRef]
  31. Kresse, G.; Furthmüller, J. Efficiency of ab-initio total energy calculations for metals and semiconductors using a plane-wave basis set. Comp. Mater. Sci. 1996, 6, 15–50. [Google Scholar] [CrossRef]
  32. Kresse, G.; Furthmüller, J. Efficient iterative schemes for ab initio total-energy calculations using a plane-wave basis set. Phys. Rev. B 1996, 54, 11169–11186. [Google Scholar] [CrossRef]
  33. Perdew, J.P.; Burke, K.; Ernzerhof, M. Generalized gradient approximation made simple. Phys. Rev. Lett. 1996, 77, 3865–3868. [Google Scholar] [CrossRef] [Green Version]
  34. Kresse, G.; Joubert, D. From ultrasoft pseudopotentials to the projector augmented-wave method. Phys. Rev. B 1999, 59, 1758–1775. [Google Scholar] [CrossRef]
  35. Blöchl, P.E. Projector augmented-wave method. Phys. Rev. B 1994, 50, 17953–17979. [Google Scholar] [CrossRef] [PubMed] [Green Version]
  36. Choudhury, B.; Choudhury, A. Oxygen vacancy and dopant concentration dependent magnetic properties of Mn doped TiO2 nanoparticle. Curr. Appl. Phys. 2013, 13, 1025–1031. [Google Scholar] [CrossRef]
  37. Huang, H.; Hou, X.; Xiao, J.; Zhao, L.; Huang, Q.; Chen, H.; Li, Y. Effect of annealing atmosphere on the performance of TiO2 nanorod arrays in photoelectrochemical water splitting. Catal. Today 2019, 330, 189–194. [Google Scholar] [CrossRef]
  38. Dutta, S.; Chattopadhyay, S.; Jana, D.; Banerjee, A.; Manik, S.; Pradhan, S.K.; Sutradhar, M.; Sarkar, A. Annealing effect on nano-ZnO powder studied from positron lifetime and optical absorption spectroscopy. J. Appl. Phys. 2006, 100, 114328. [Google Scholar] [CrossRef]
  39. He, Y.; Dulub, O.; Cheng, H.; Selloni, A.; Diebold, U. Evidence for the predominance of subsurface defects on reduced anatase TiO2 (101). Phys. Rev. Lett. 2009, 102, 106105. [Google Scholar] [CrossRef]
  40. Sun, W.; Li, Y.; Shi, W.; Zhao, X.; Fang, P. Formation of AgI/TiO2 nanocomposite leads to excellent thermochromic reversibility and photostability. J. Mater. Chem. 2011, 21, 9263–9270. [Google Scholar] [CrossRef]
  41. Liu, Y.; Chen, P.; Fan, Y.; Fan, Y.; Shi, X.; Cui, G.; Tang, B. Grey rutile TiO2 with long-term photocatalytic activity synthesized via two-step calcination. Nanomaterials 2020, 10, 920. [Google Scholar] [CrossRef]
  42. Huang, J.; Yang, K.; Zhang, Z.; Yang, L.; Hirano, S. Layered perovskite LiEuTiO4 as a 0.8 V lithium intercalation electrode. Chem. Commun. 2017, 53, 7800–7803. [Google Scholar] [CrossRef] [PubMed]
  43. Lee, J.W.; Moon, B.M.; Lee, K.M.; Kim, Y.H.; Park, H.G.; Lim, J.H.; Oh, B.Y.; Kim, B.Y.; Hwang, J.Y.; Ok, C.H.; et al. Homogeneous liquid crystal orientation on ion beam exposure TiO2 surfaces depending on an anisotropic dipole field. Liq. Cryst. 2010, 37, 279–284. [Google Scholar] [CrossRef]
  44. Shi, C.; Qi, H.; Sun, Z.; Qu, K.; Huang, Z.; Li, J.; Dong, M.; Guo, Z. Carbon dot-sensitized urchin-like Ti3+ self-doped TiO2 photocatalysts with enhanced photoredox ability for highly efficient removal of Cr6+ and RhB. J. Mater. Chem. C 2020, 8, 2238–2247. [Google Scholar] [CrossRef]
  45. Li, G.; Lian, Z.; Li, X.; Xu, Y.; Wang, W.; Zhang, D.; Tian, F.; Li, H. Ionothermal synthesis of black Ti3+-doped single-crystal TiO2 as an active photocatalyst for pollutant degradation and H2 generation. J. Mater. Chem. A 2015, 3, 3748–3756. [Google Scholar] [CrossRef]
  46. Guillemot, F.; Porté, M.C.; Labrugère, C.; Baquey, C. Ti4+ to Ti3+ conversion of TiO2 uppermost layer by low-temperature vacuum annealing: Interest for titanium biomedical applications. J. Colloid Interf. Sci. 2002, 255, 75–78. [Google Scholar] [CrossRef] [PubMed]
  47. Hu, Z.; Yu, J.C.; Ming, T.; Wang, J. A wide-spectrum-responsive TiO2 photoanode for photoelectrochemical cells. Appl. Catal. B Environ. 2015, 168–169, 483–489. [Google Scholar] [CrossRef]
  48. Qian, A.; Hyeon, S.E.; Seo, J.Y.; Chung, C.-H. Capacitance changes associated with cation-transport in free-standing flexible Ti3C2Tx (T=O, F, OH) MXene film electrodes. Electrochim. Acta 2018, 266, 86–93. [Google Scholar] [CrossRef]
  49. Qiu, H.; Ma, X.; Sun, C.; Zhao, B.; Chen, F. Surface oxygen vacancies enriched Pt/TiO2 synthesized with a defect migration strategy for superior photocatalytic activity. Appl. Surf. Sci. 2020, 506, 145021. [Google Scholar] [CrossRef]
  50. Xu, K.; Yang, X.; Sun, D.; Yang, X.; Zhou, Y.; Li, W.; Yang, Q.; Yang, X.; Li, R.; Feng, J. Enhanced visible-light driven photocatalytic performances over LaFeO3/NiO modified porous g-C3N4 nanosheets. Nano 2019, 15, 2050010. [Google Scholar] [CrossRef]
  51. Gu, Y.H.; Fujimiya, Y.; Kunugita, N. Long-term exposure to gaseous formaldehyde promotes allergen-specific IgE-mediated immune responses in a murine model. Hum. Exp. Toxicol. 2008, 27, 37–43. [Google Scholar] [CrossRef]
  52. Alminshid, A.H.; Abbas, M.N.; Alalwan, H.A.; Sultan, A.J.; Kadhom, M.A. Aldol condensation reaction of acetone on MgO nanoparticles surface: An in-situ drift investigation. Mol. Catal. 2021, 501, 111333. [Google Scholar] [CrossRef]
  53. Li, J.; Cui, W.; Chen, P.; Dong, X.A.; Chu, Y.; Sheng, J.; Zhang, Y.; Wang, Z.; Dong, F. Unraveling the mechanism of binary channel reactions in photocatalytic formaldehyde decomposition for promoted mineralization. Appl. Catal. B Environ. 2020, 260, 118130. [Google Scholar] [CrossRef]
  54. Jodłowski, P.J.; Jędrzejczyk, R.J.; Chlebda, D.; Gierada, M.; Łojewska, J. In situ spectroscopic studies of methane catalytic combustion over Co, Ce, and Pd mixed oxides deposited on a steel surface. J. Catal. 2017, 350, 1–12. [Google Scholar] [CrossRef]
  55. Song, S.; Lu, C.; Wu, X.; Jiang, S.; Sun, C.; Le, Z. Strong base g-C3N4 with perfect structure for photocatalytically eliminating formaldehyde under visible-light irradiation. Appl. Catal. B Environ. 2018, 227, 145–152. [Google Scholar] [CrossRef]
  56. Lu, J.; Zhong, J.; Ren, Q.; Li, J.; Song, L.; Mo, S.; Zhang, M.; Chen, P.; Fu, M.; Ye, D. Construction of Cu-Ce interface for boosting toluene oxidation: Study of Cu-Ce interaction and intermediates identified by in situ DRIFTS. Chin. Chem. Lett. 2021, 32, 3435–3439. [Google Scholar] [CrossRef]
  57. Xu, P.; Xu, T.; Yu, H.; Zheng, D.; Li, X. MOF (metal-organic framework) nanomaterial for 400 ppb-concentration detectable xylene gas sensors. In Proceedings of the 2017 IEEE 30th International Conference on Micro Electro Mechanical Systems (MEMS), Las Vegas, NV, USA, 22–26 January 2017; pp. 1075–1078. [Google Scholar]
  58. Hu, Z.; Yang, C.; Lv, K.; Li, X.; Li, Q.; Fan, J. Single atomic Au induced dramatic promotion of the photocatalytic activity of TiO2 hollow microspheres. Chem. Commun. 2020, 56, 1745–1748. [Google Scholar] [CrossRef] [PubMed]
  59. Jiang, B.; Zheng, J.; Qiu, S.; Wu, M.; Zhang, Q.; Yan, Z.; Xue, Q. Review on electrical discharge plasma technology for wastewater remediation. Chem. Eng. J. 2014, 236, 348–368. [Google Scholar] [CrossRef]
  60. Oinuma, G.; Nayak, G.; Du, Y.; Bruggeman, P.J. Controlled plasma—Droplet interactions: A quantitative study of OH transfer in plasma–liquid interaction. Plasma Sources Sci. Technol. 2020, 29, 095002. [Google Scholar] [CrossRef]
Figure 1. (A) Synthesis setup of producing HAm-TiO2−x, and (B) the generation process of HAm-TiO2−x nanoparticles.
Nanomaterials 12 00742 g001
Figure 2. (A) The X-ray diffraction (XRD) patterns and (B) UV-vis diffuse-reflectance spectra for all as-prepared samples. (C) EPR spectrum and (D) nitrogen adsorption-desorption isotherms of AT-420 sample, inset is the pore diameter distribution calculated by the BJH method.
Nanomaterials 12 00742 g002
Figure 3. (A) Low magnification TEM images of HAm-TiO2−x. (B) The leaf-vein-shaped nanoparticles in HAm-TiO2−x, the inset was a photograph of the leaf vein. (C) The curve-like bulk defect marked with yellow oval and the disordered surface marked with yellow rectangle; the crystal plane spacing (d-spacing) was calculated to be 0.353 nm as shown in the left dotted box. (D) Some mesoporous structures marked with yellow circles in HAm-TiO2−x.
Nanomaterials 12 00742 g003
Figure 4. (A) Full XPS spectra for all samples, (B) Ti 2p spectra of AT-420 and P25 TiO2. The deconvoluted Ti 2p (C) and O 1s (D) spectra for all samples.
Nanomaterials 12 00742 g004
Figure 5. The bandgap structures of all samples.
Nanomaterials 12 00742 g005
Figure 6. Five kinds of atomic models are shown in (ae), respectively, and the corresponding band structure and DOS are shown in (fj).
Nanomaterials 12 00742 g006
Figure 7. (A) The transient photocurrent density and (B) photoluminescence spectra for all samples.
Nanomaterials 12 00742 g007
Figure 8. (A) The visible-light photodegradation of RhB for all samples and (B) the visible-light photodegradation stability test for AT-420. The visible-light photodegradations of (C) RhB and (D) MB using HAm-TiO2−x coated glass. (E) The EPR detection of ·O2 and ·OH over AT-420 under visible-light illumination. (F) The removal rates of AT-420 in the presence of different scavenging species. (G) Large-view SEM picture of HAm-TiO2−x coated glass, the EDS mapping of Ti element and the hydrophilicity test in HAm-TiO2−x coated glass were shown in the inset.
Nanomaterials 12 00742 g008
Figure 9. (A) Visible-light formaldehyde photodegradation and (B) the conversion efficiency with different samples, and the inset was the remove efficiency for all samples. (C) Durable test of AT-420 under simulated indoor conditions. (D) The HCHO photodegradations under 365-nm and 600-nm light sources using AT-420 sample. (E) The AQY of formaldehyde photodegradation with different wavelength light using AT-420 coating, and the inset were the spectra of UV (365 nm, FWHM = 15 nm) and visible (600 nm, FWHM = 15 nm) light. (F) The effect of relative humidity for AT-420 coating using 600-nm light source.
Nanomaterials 12 00742 g009
Figure 10. In-situ DRIFTS of AT-420 during the visible-light photodegradation of HCHO.
Nanomaterials 12 00742 g010
Figure 11. The adsorption models of (A) formaldehyde and (B) oxygen in the presence of surface hydroxyl groups and subsurface OV, respectively. (C) The adsorption energies of O2 and HCHO over anatase TiO2, HAm-TiO2−x-OH, and HAm-TiO2−x-OV.
Nanomaterials 12 00742 g011
Figure 12. The proposed mechanism for photocatalytic elimination of HCHO with HAm-TiO2−x.
Nanomaterials 12 00742 g012
Table 1. Positron lifetime and relative intensities of HAm-TiO2−x, where the OVL, OVS, and LV are attributed to lattice OV, surface OV, and large voids, respectively.
Sampleτ1 (ns)OVL-I1-%τ2 (ns)OVS-I2-%τ3 (ns)LV-I3-%
AT-3500.32377.10.45322.65.1420.3
AT-4200.22410.80.36389.2//
AT-4900.24715.40.36984.6//
AT-5600.32987.80.52611.83.7970.4
Table 2. Bandgap, valence band maximum, and Ti3+/Ti4+ ratio of the HAm-TiO2−x samples.
SampleAT-350AT-420AT-490AT-560
Output power (W)350420490560
Bandgap (eV)2.742.362.572.91
VBM (eV)2.482.162.332.58
Ratio of Ti3+/Ti4+2.81%3.01%2.91%2.69%
Publisher’s Note: MDPI stays neutral with regard to jurisdictional claims in published maps and institutional affiliations.

