
All-Atom Molecular Dynamics Simulations of the Temperature Response of Poly(glycidyl ether)s with Oligooxyethylene Side Chains Terminated with Alkyl Groups
 ,
,  , , and
Abstract
:1. Introduction
2. Computational Method
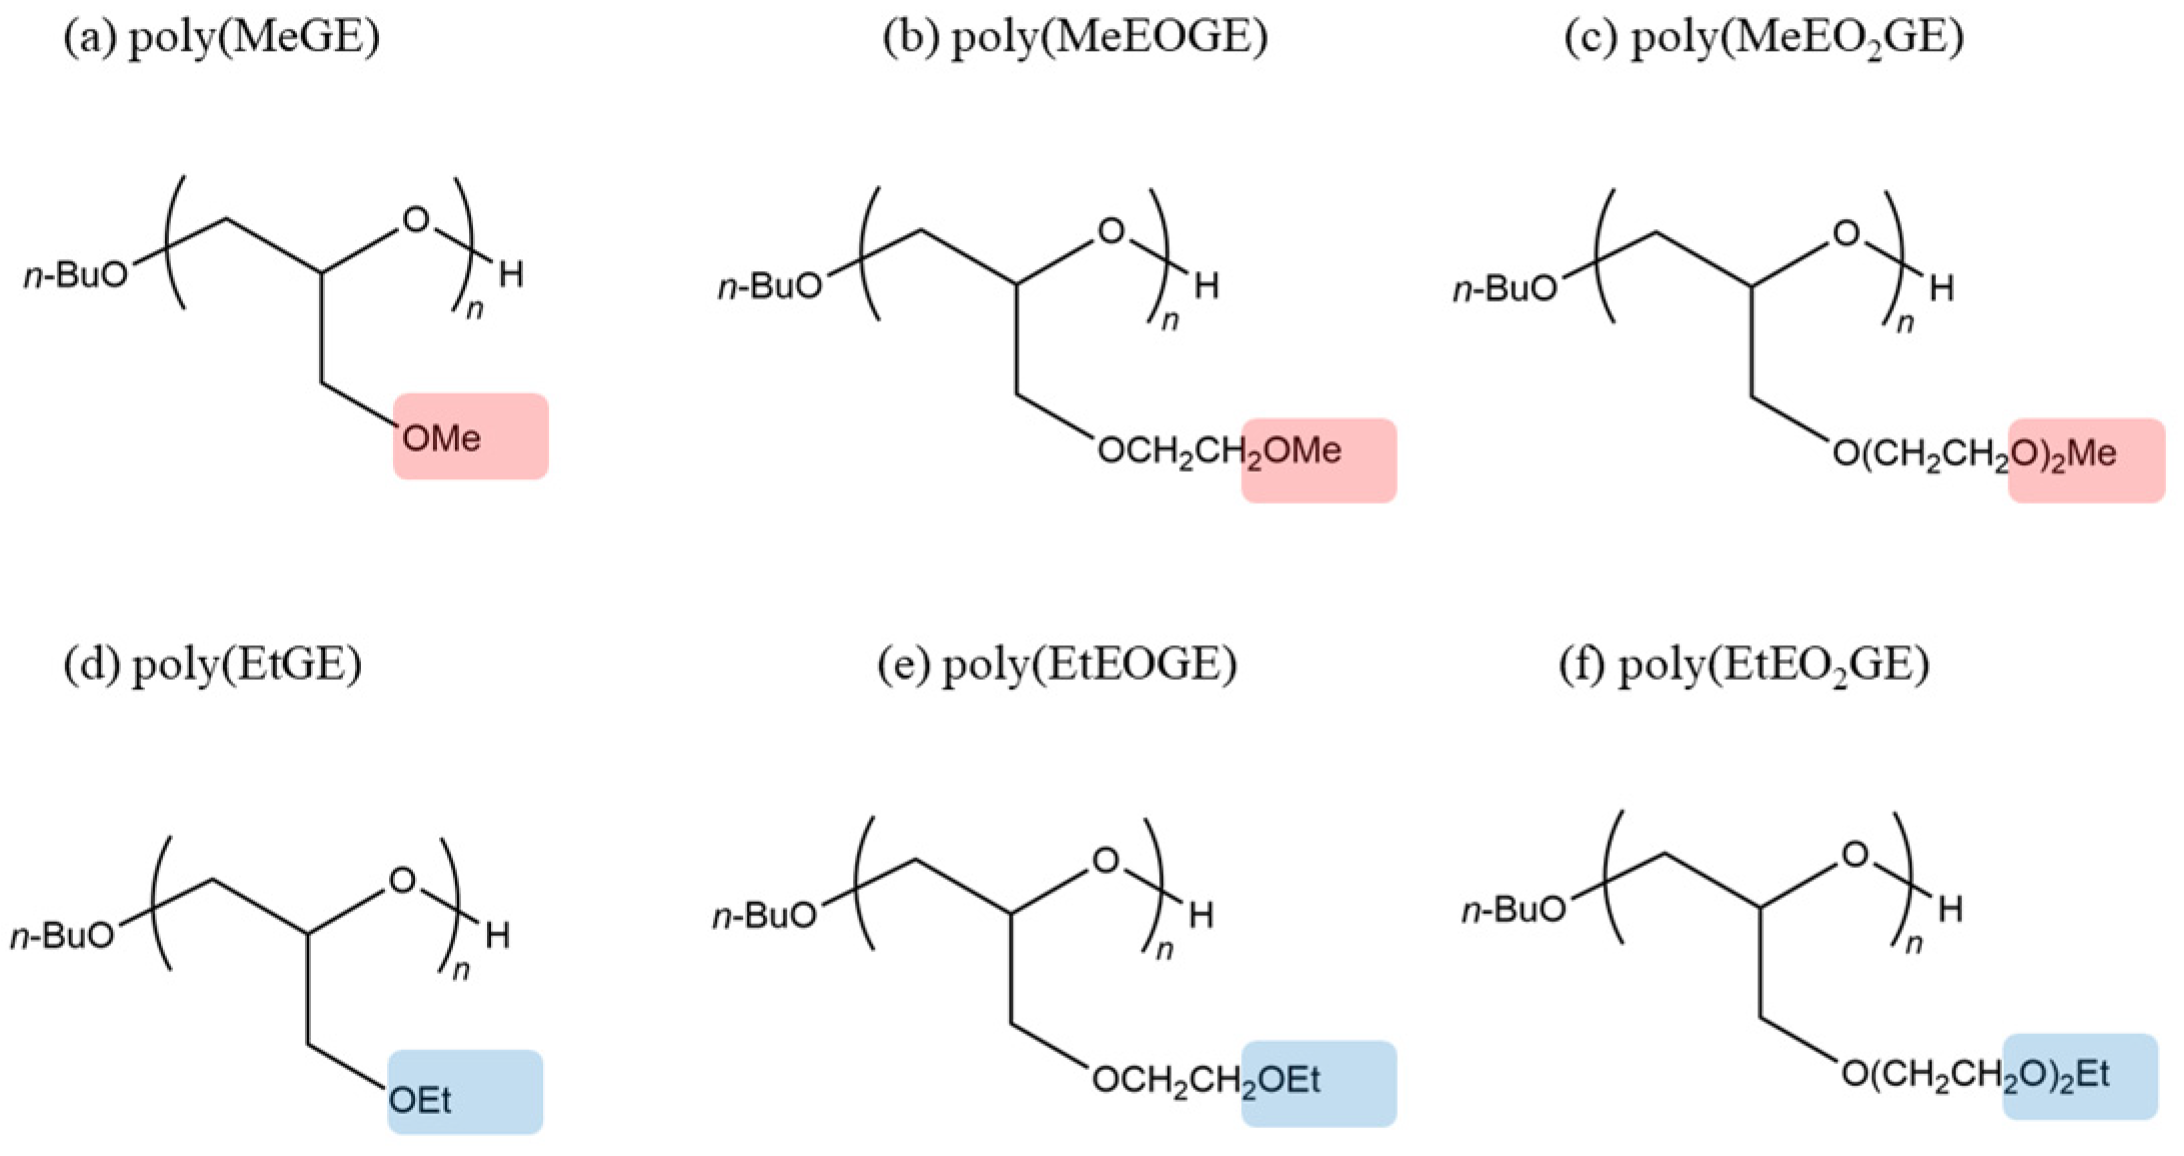
2.1. Initial Structure of the Polymers
2.2. Atomic Charges and Force Fields
2.3. Solvent Water Addition into a Simulation Box
2.4. Energy Minimization and Temperature Equilibration
2.5. MD Simulation
3. Analysis Method
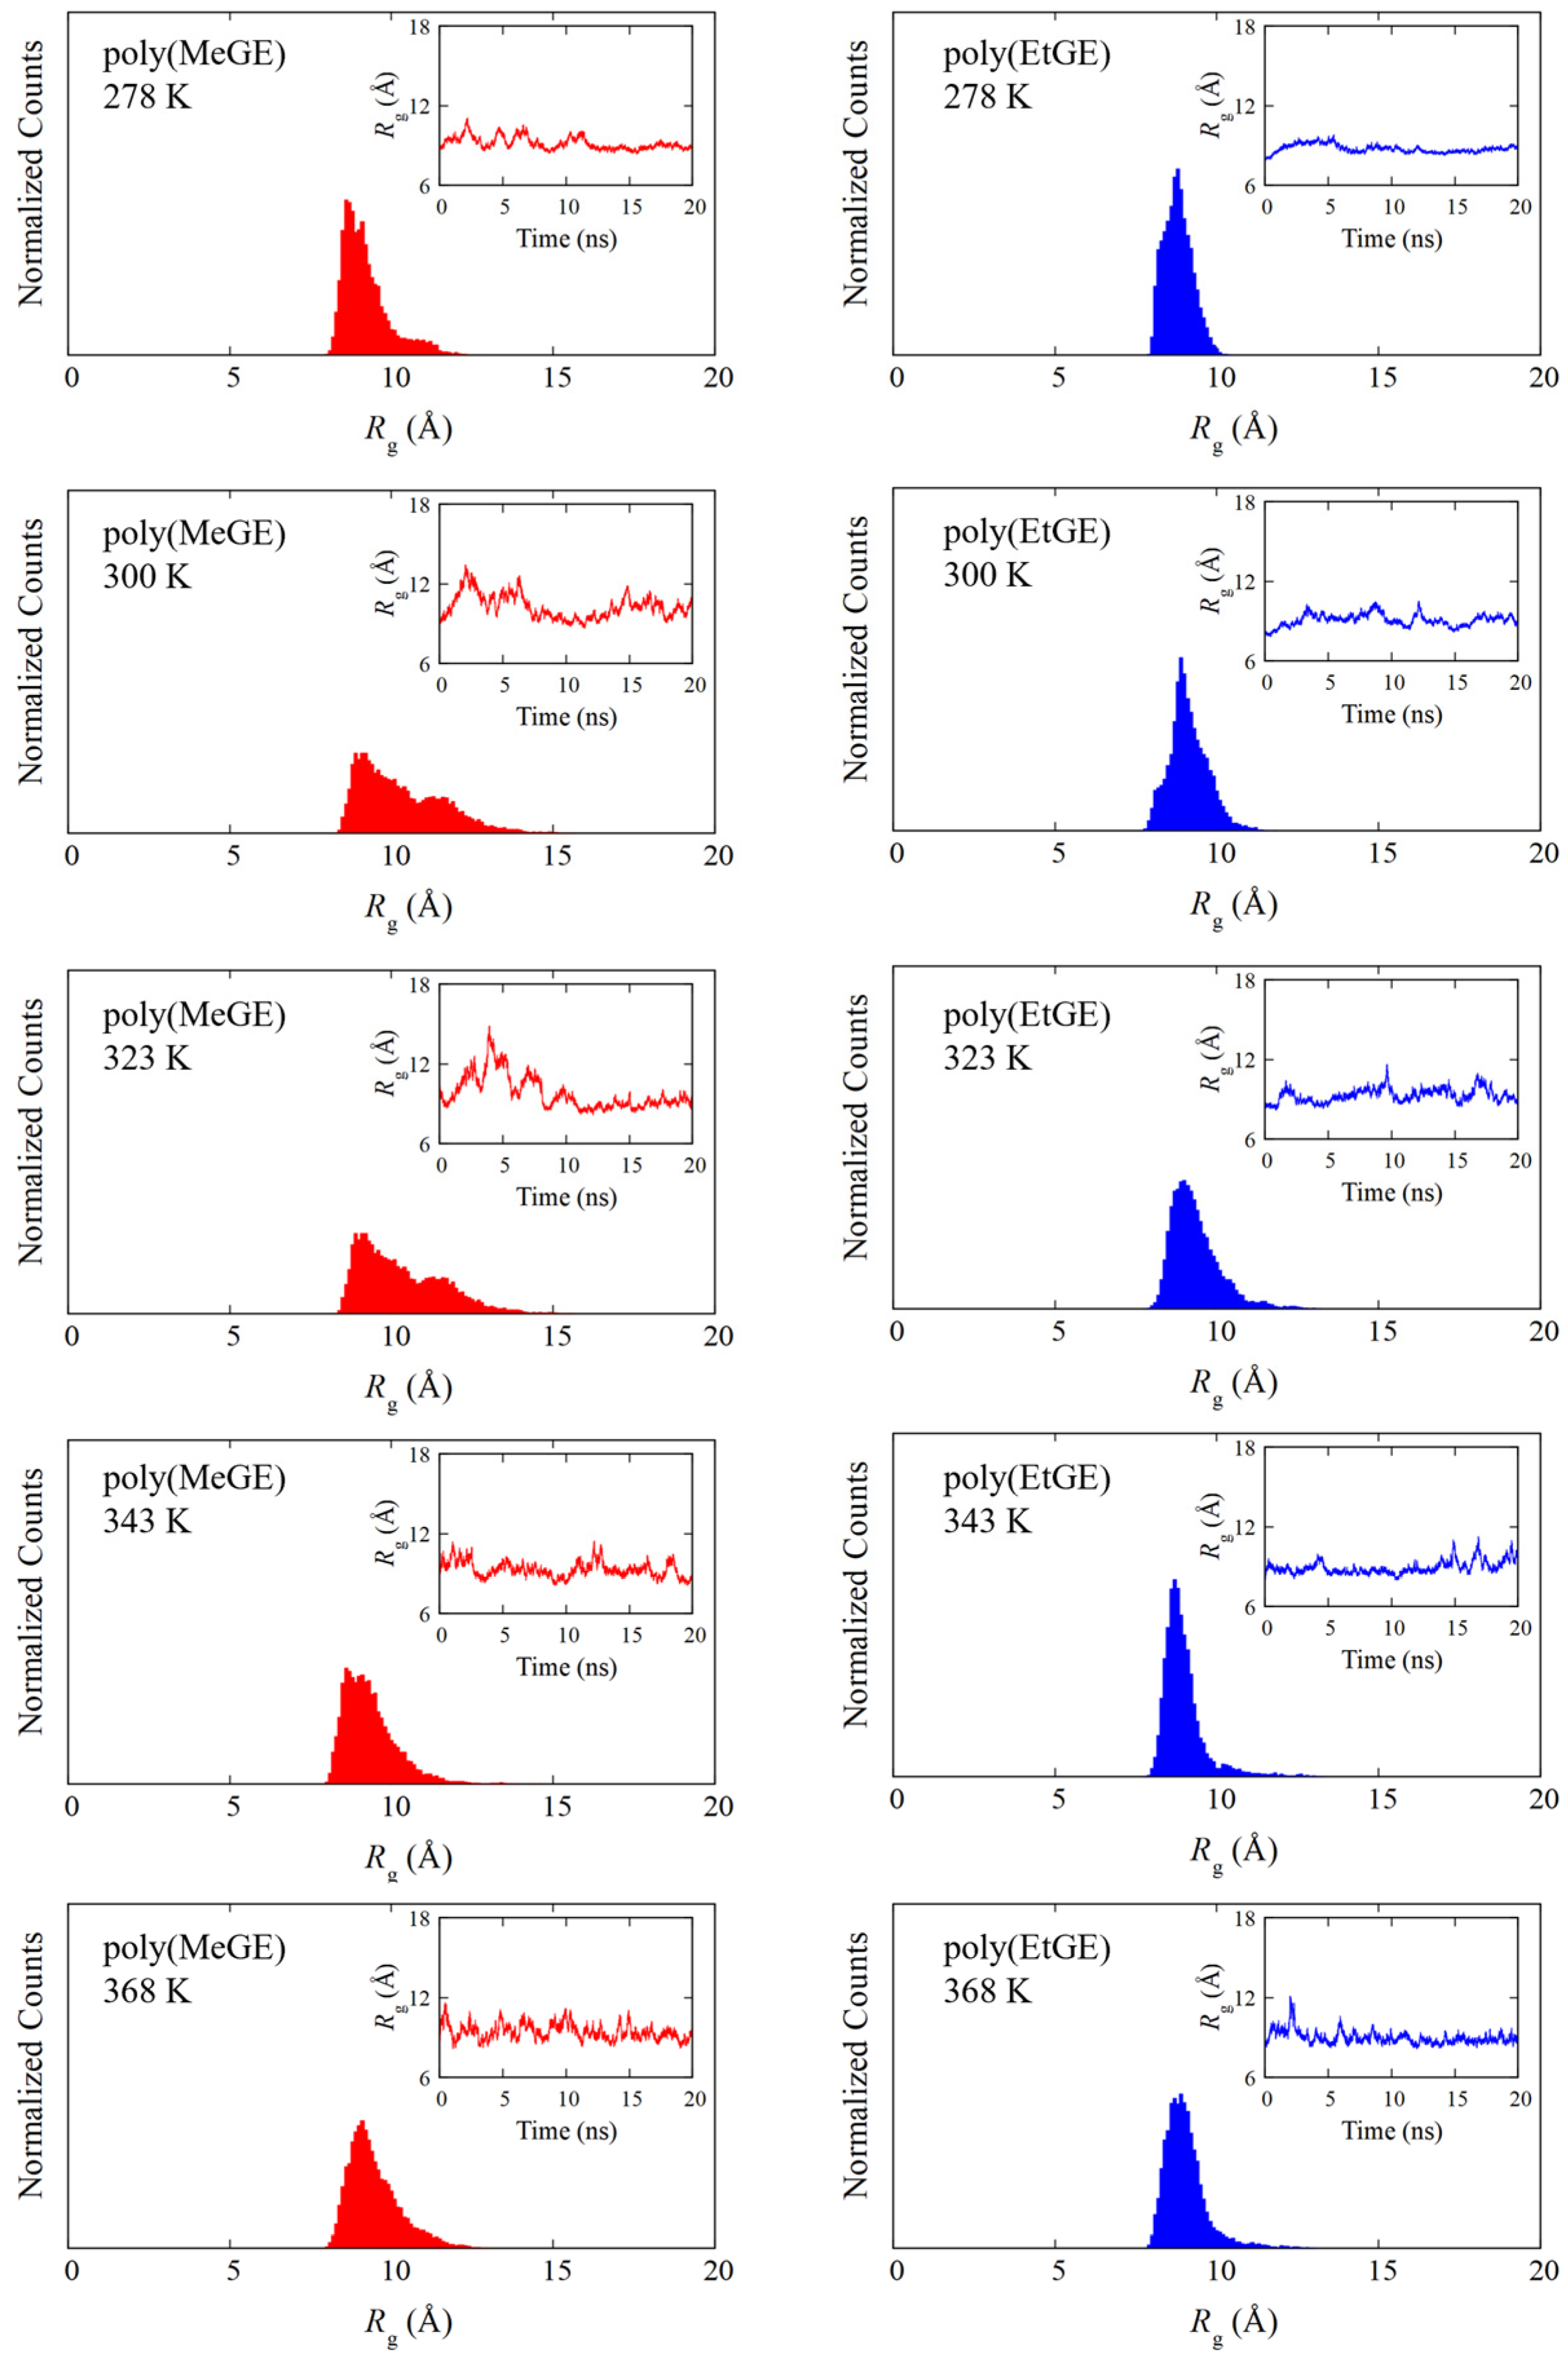
3.1. Radius of Gyration
3.2. Radial Distribution Function
4. Results and Discussion
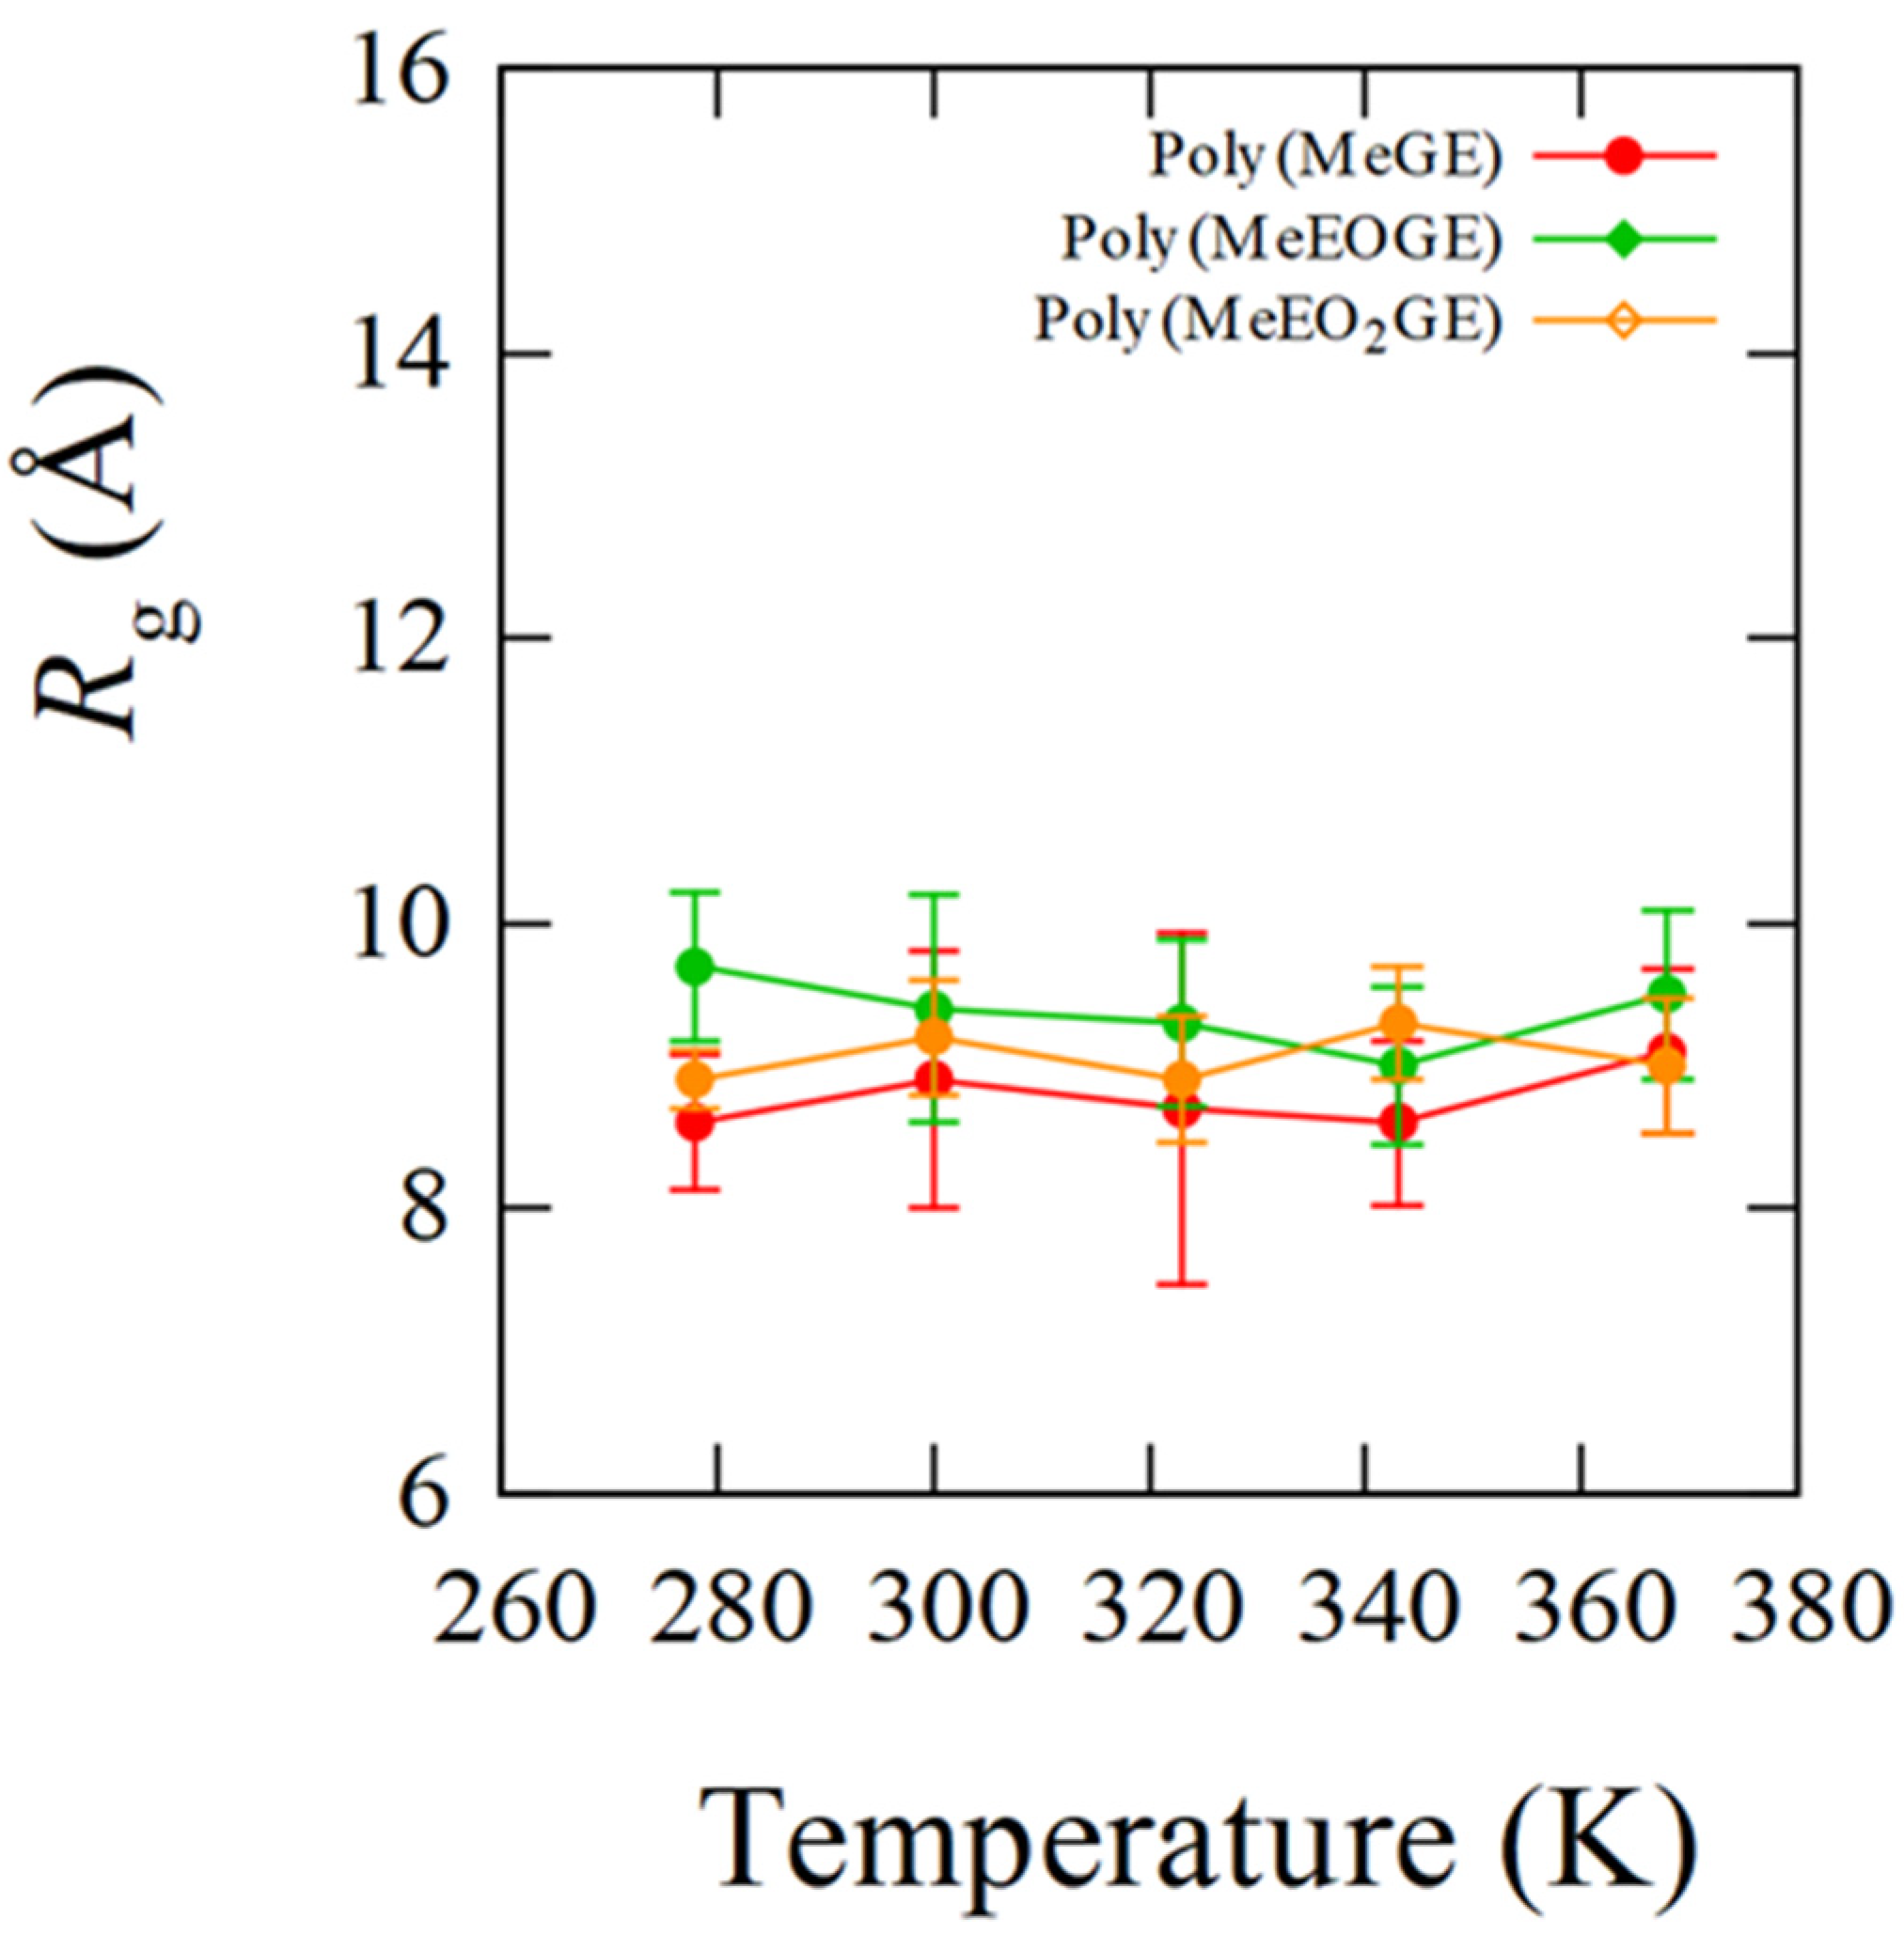
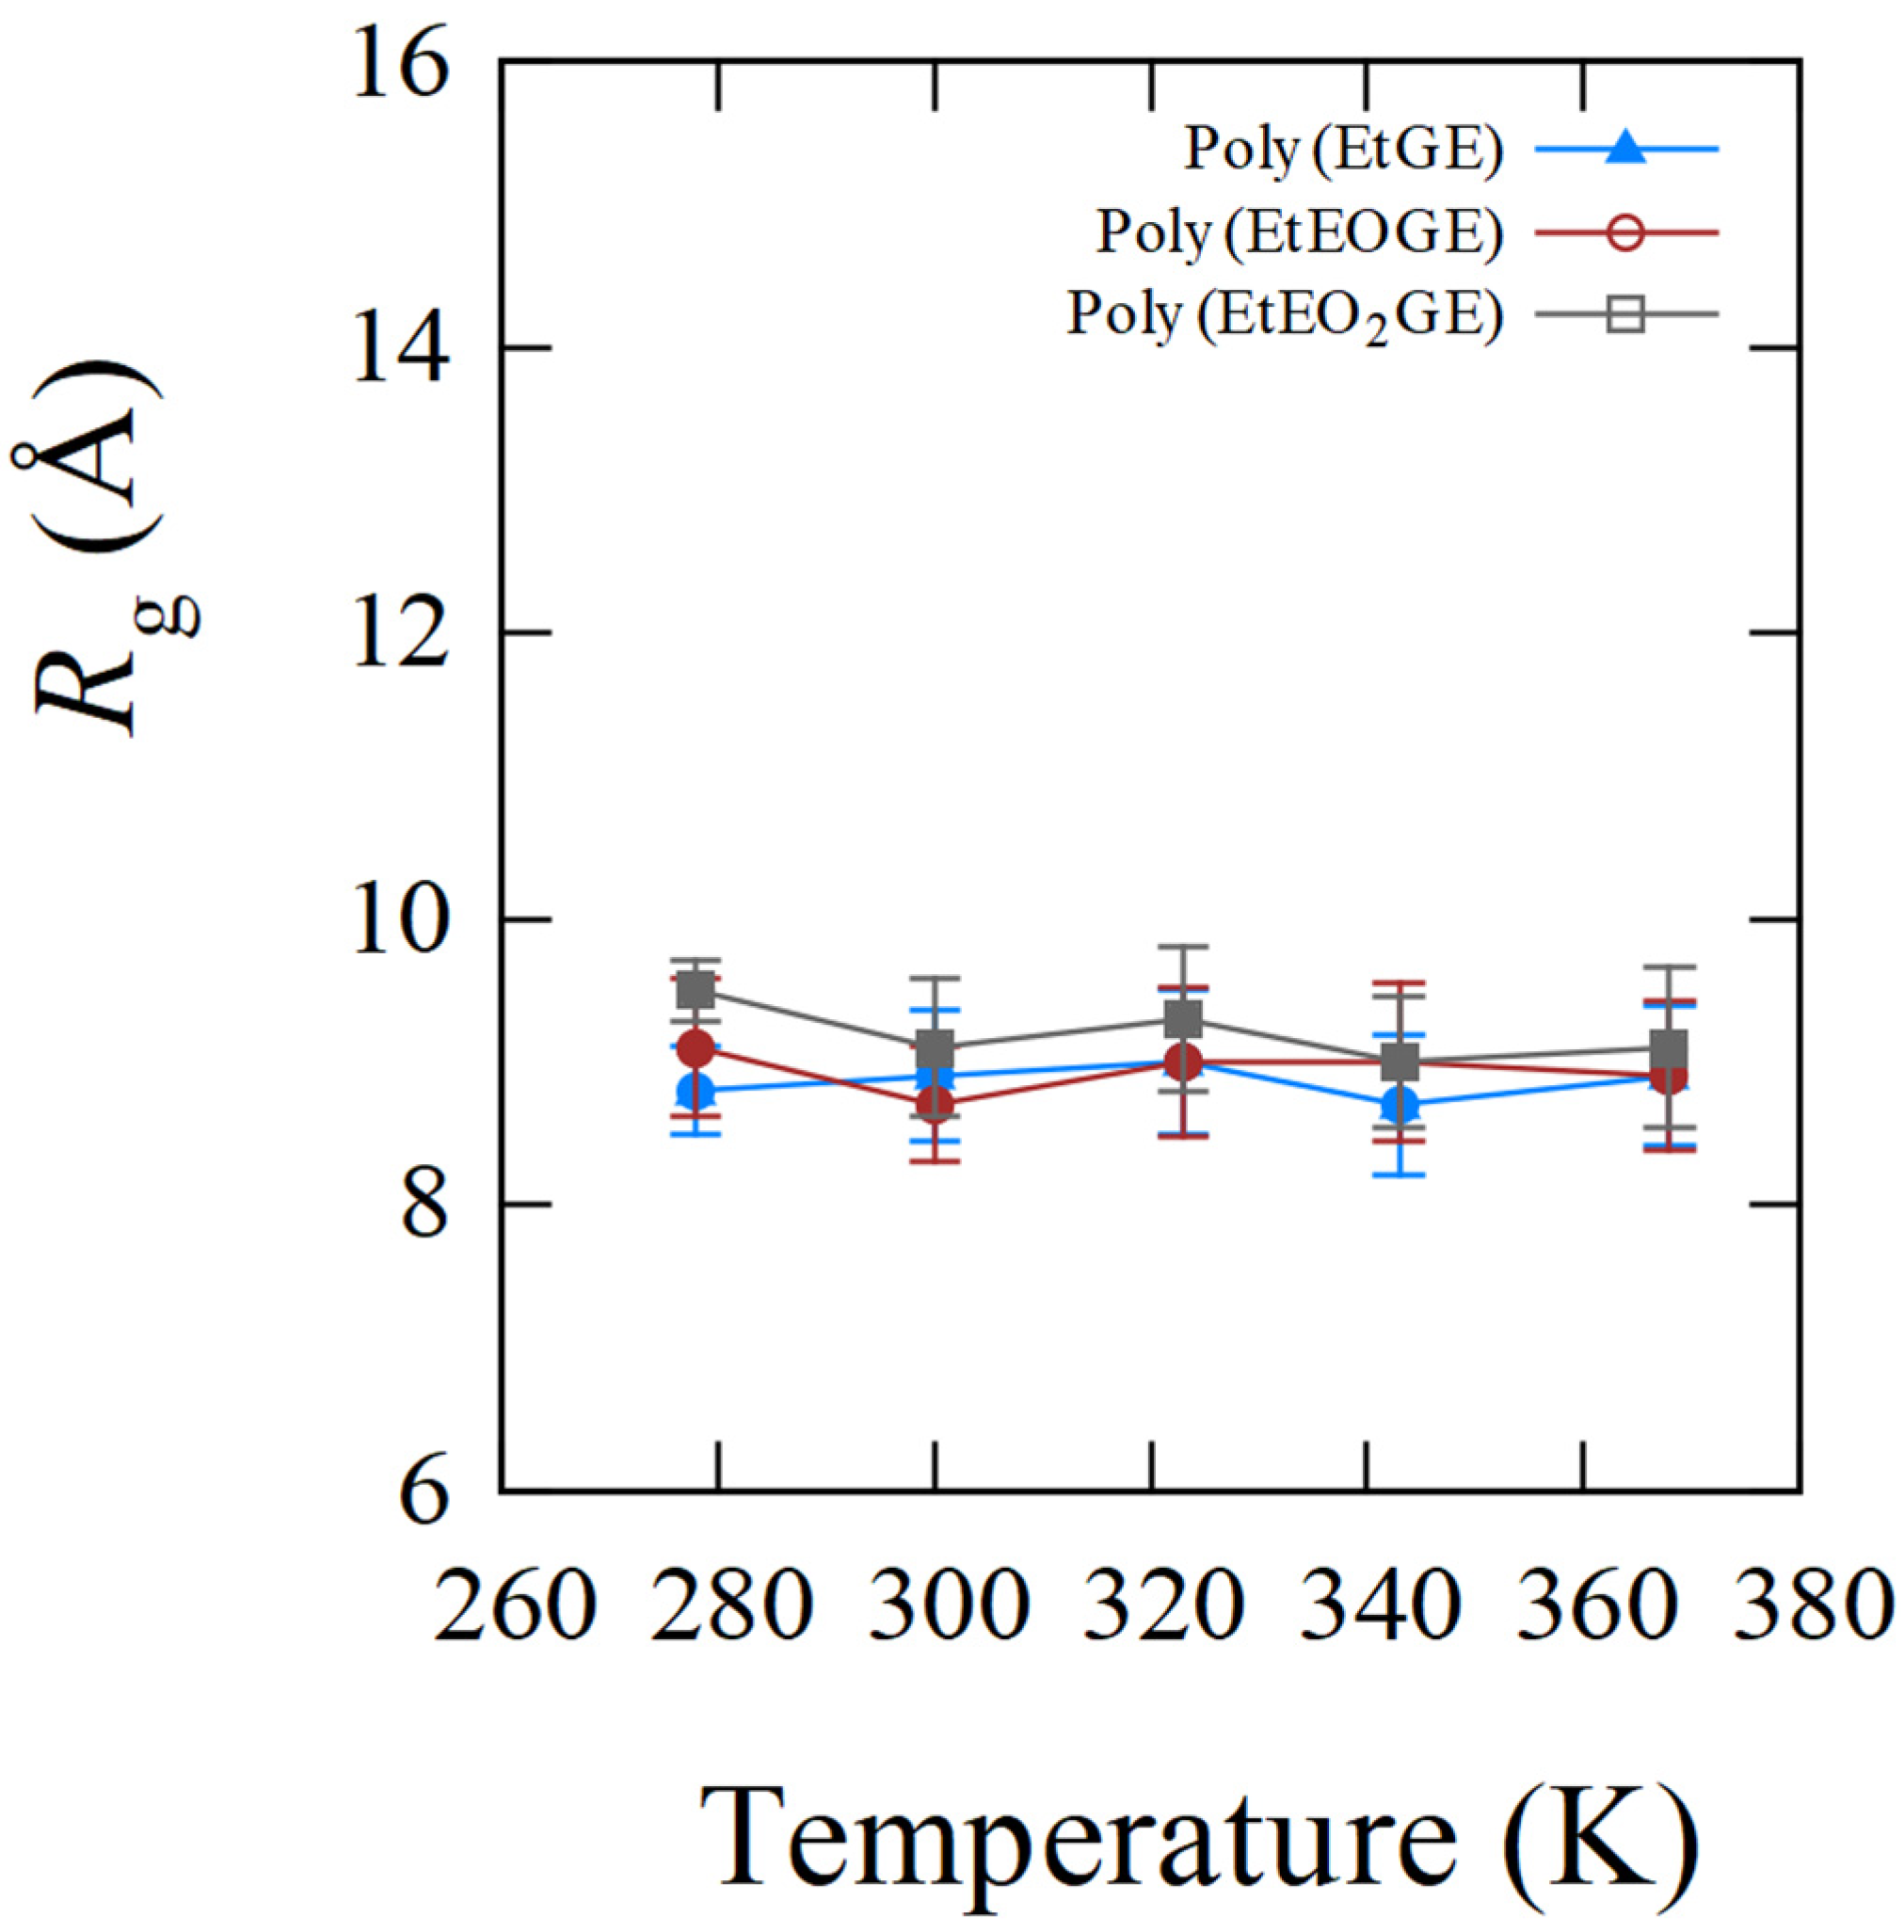
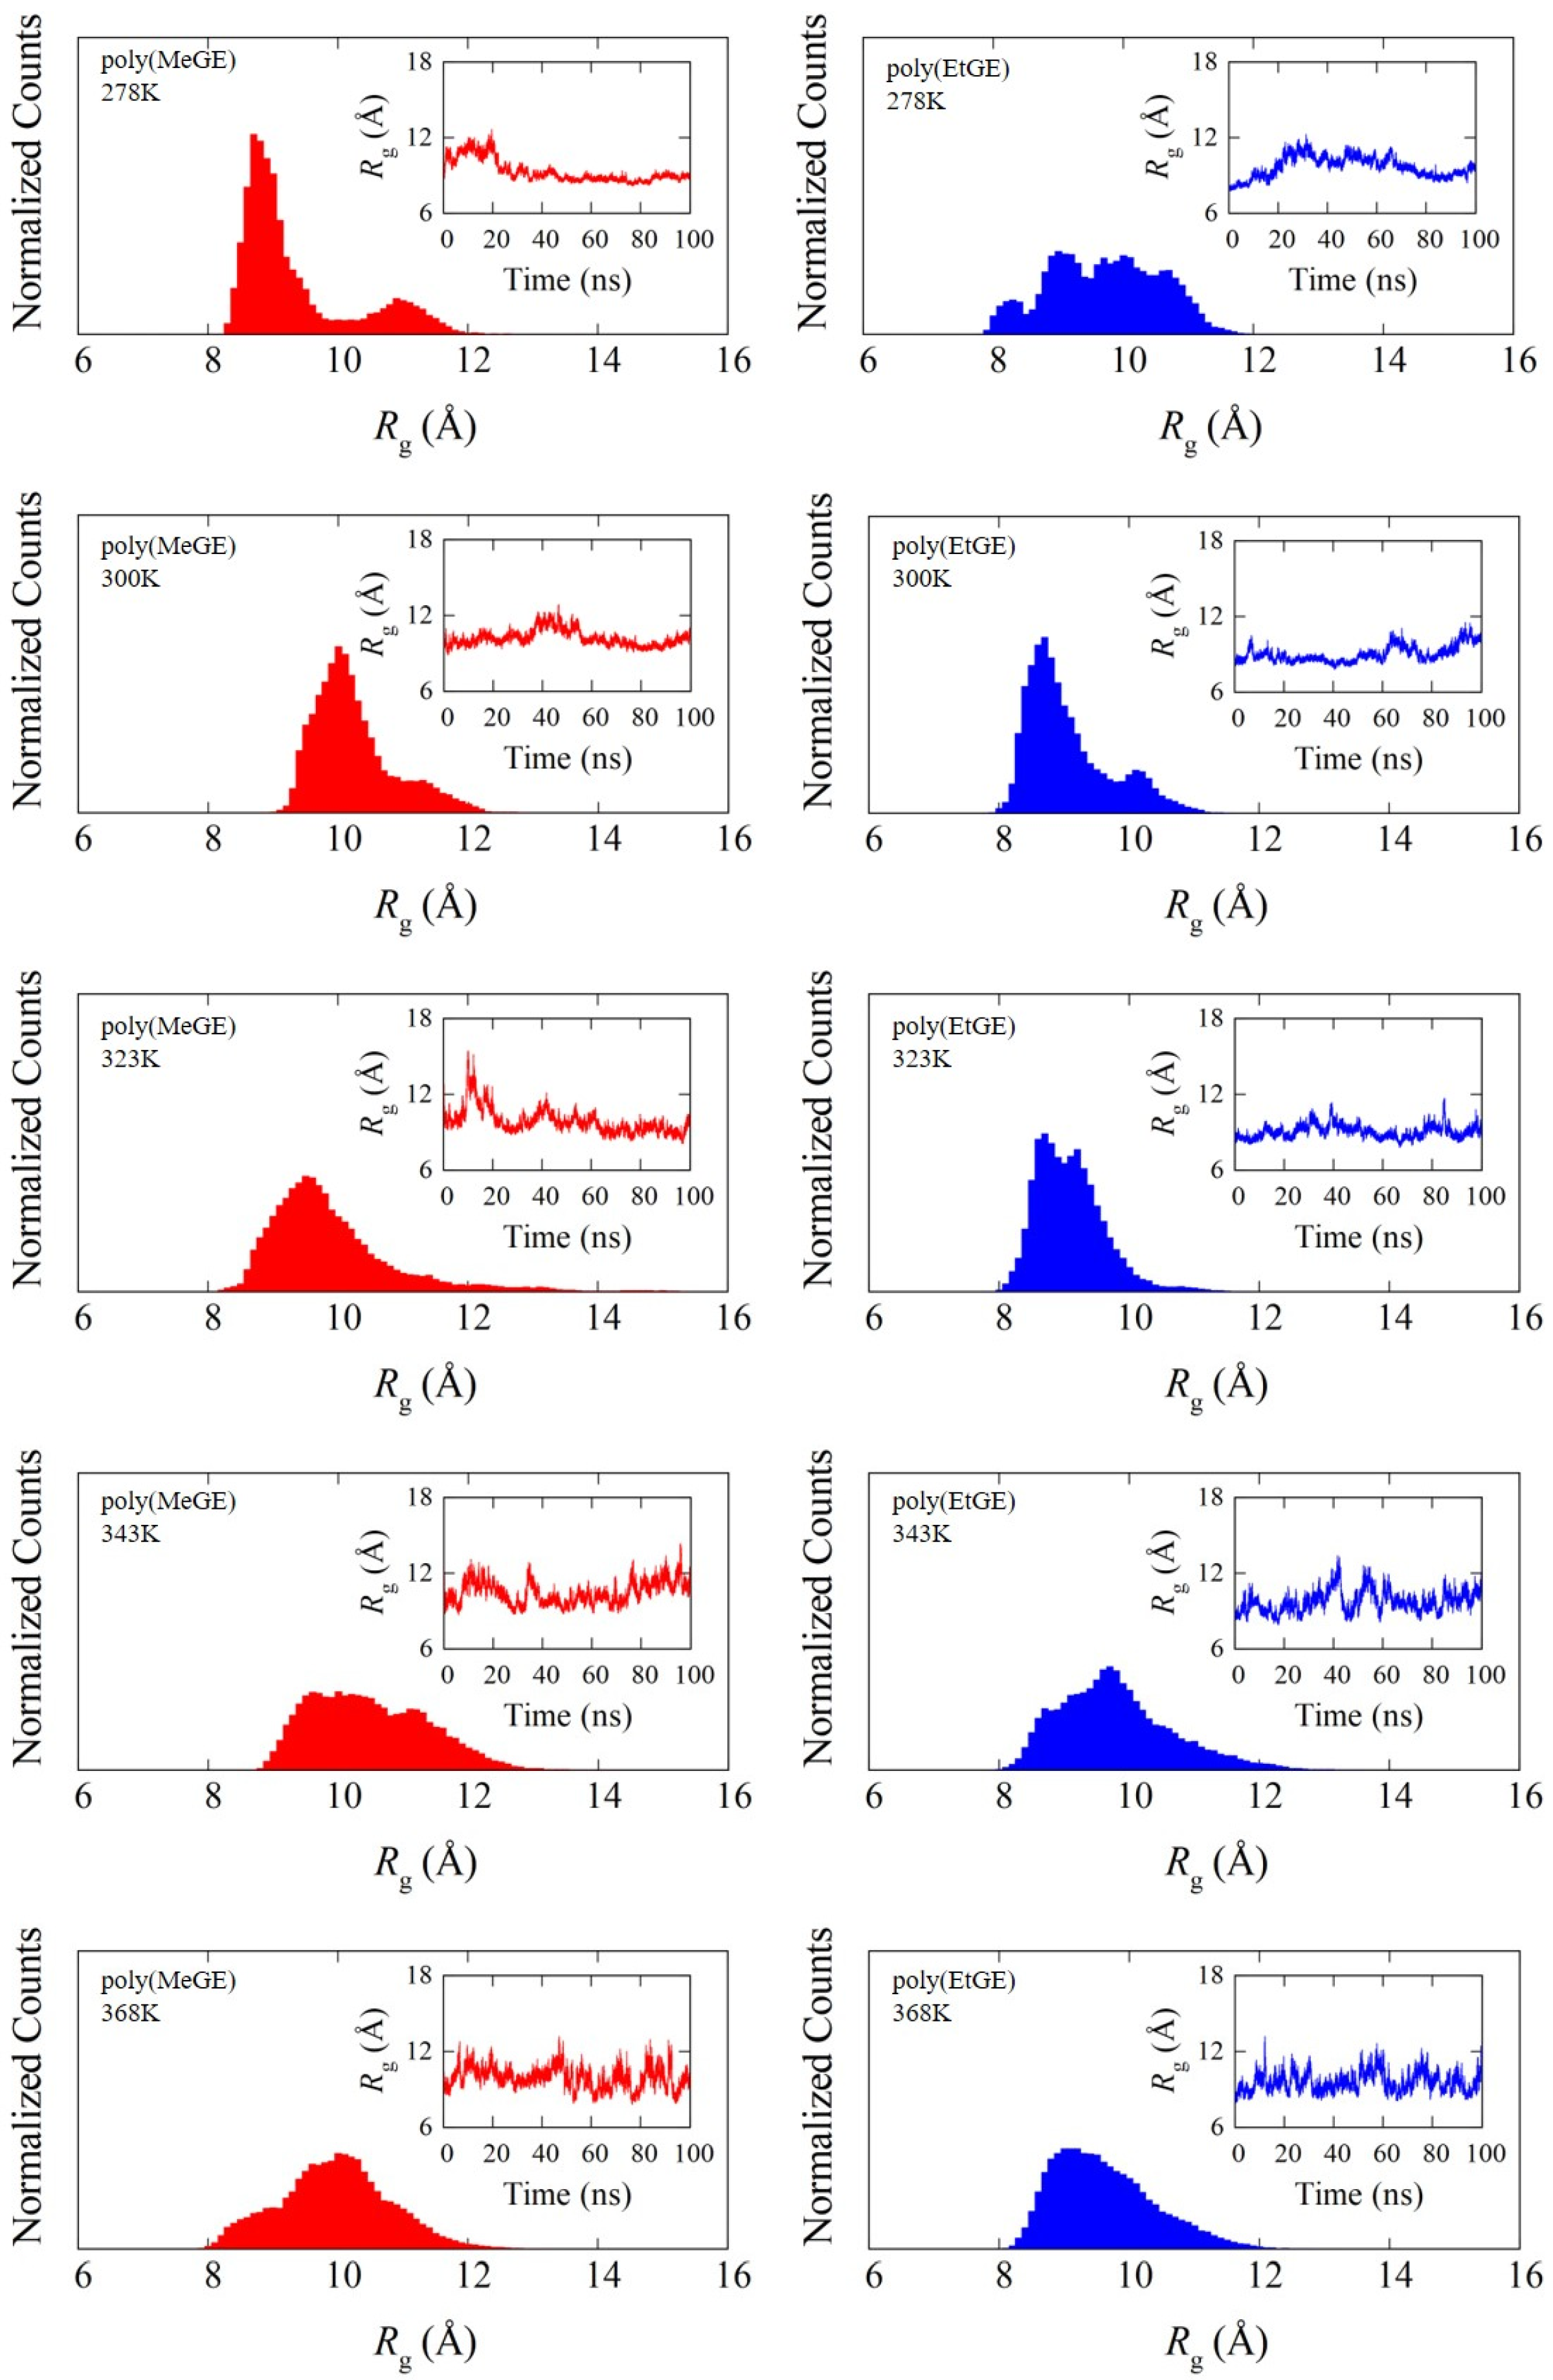
4.1. Temperature Dependence of Rg
4.2. Degree of Chain Extensions and Their Fluctuations
4.3. The Side-Chain Lengths and Their Fluctuations
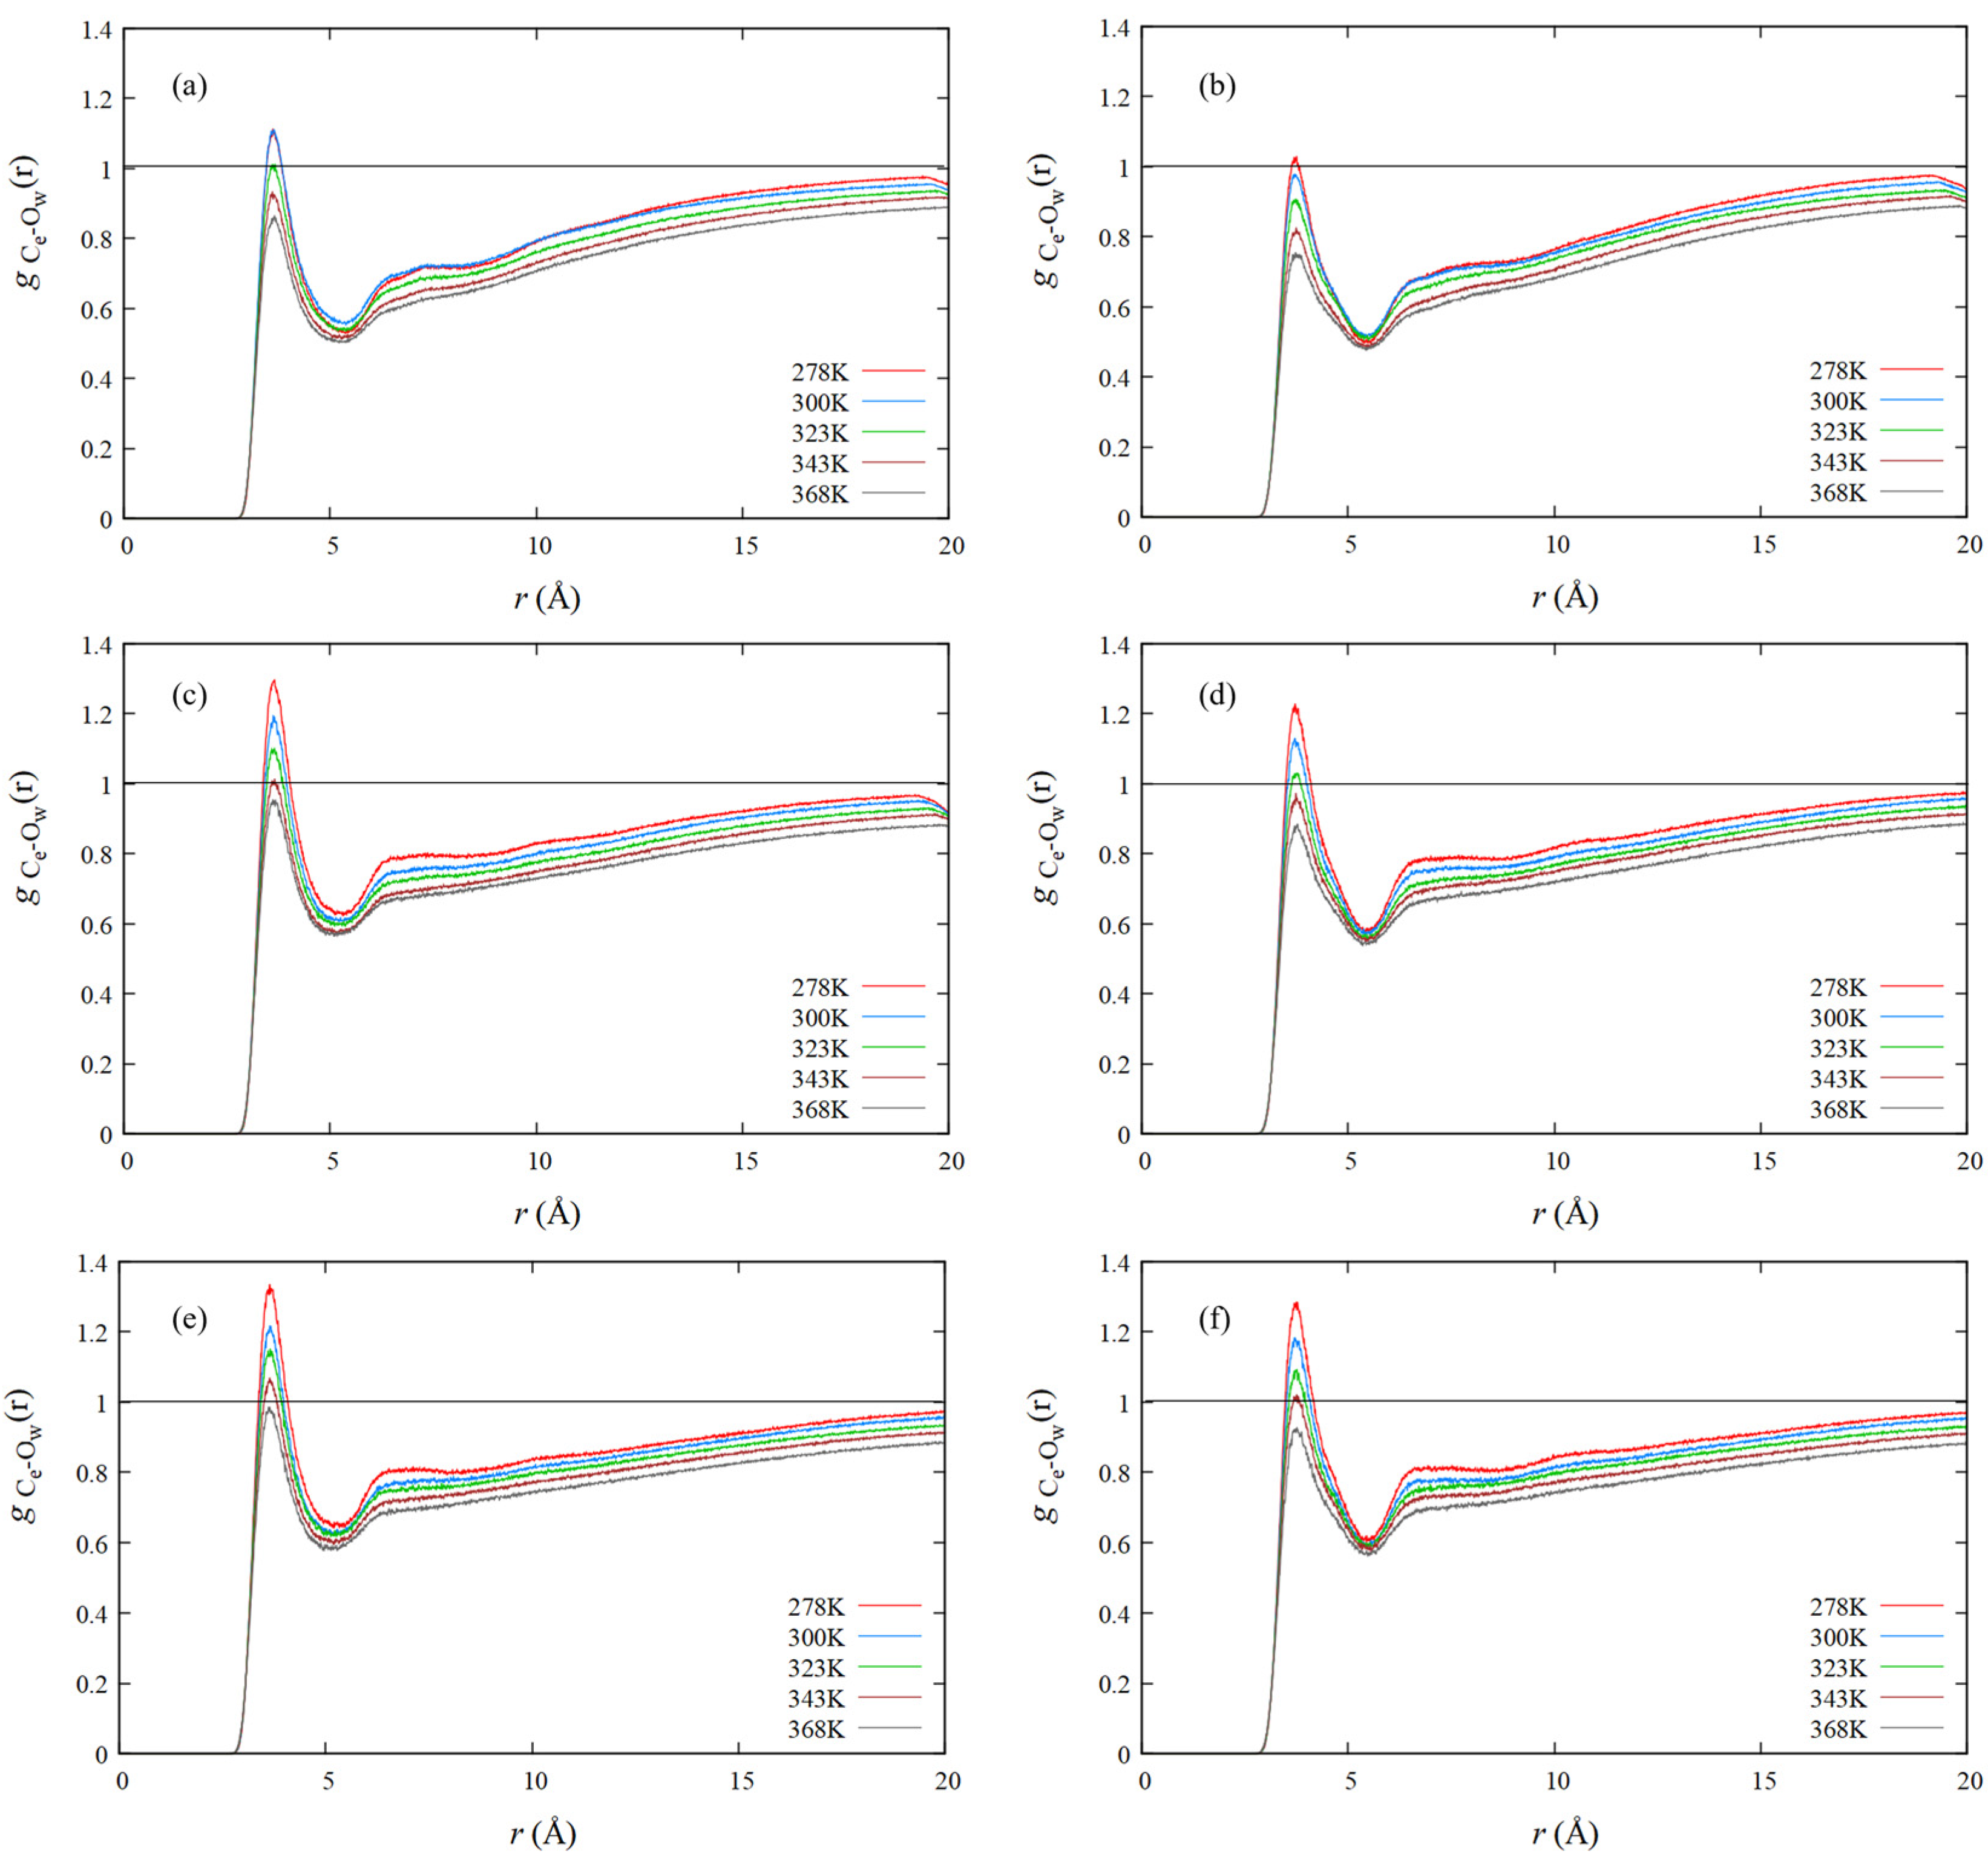
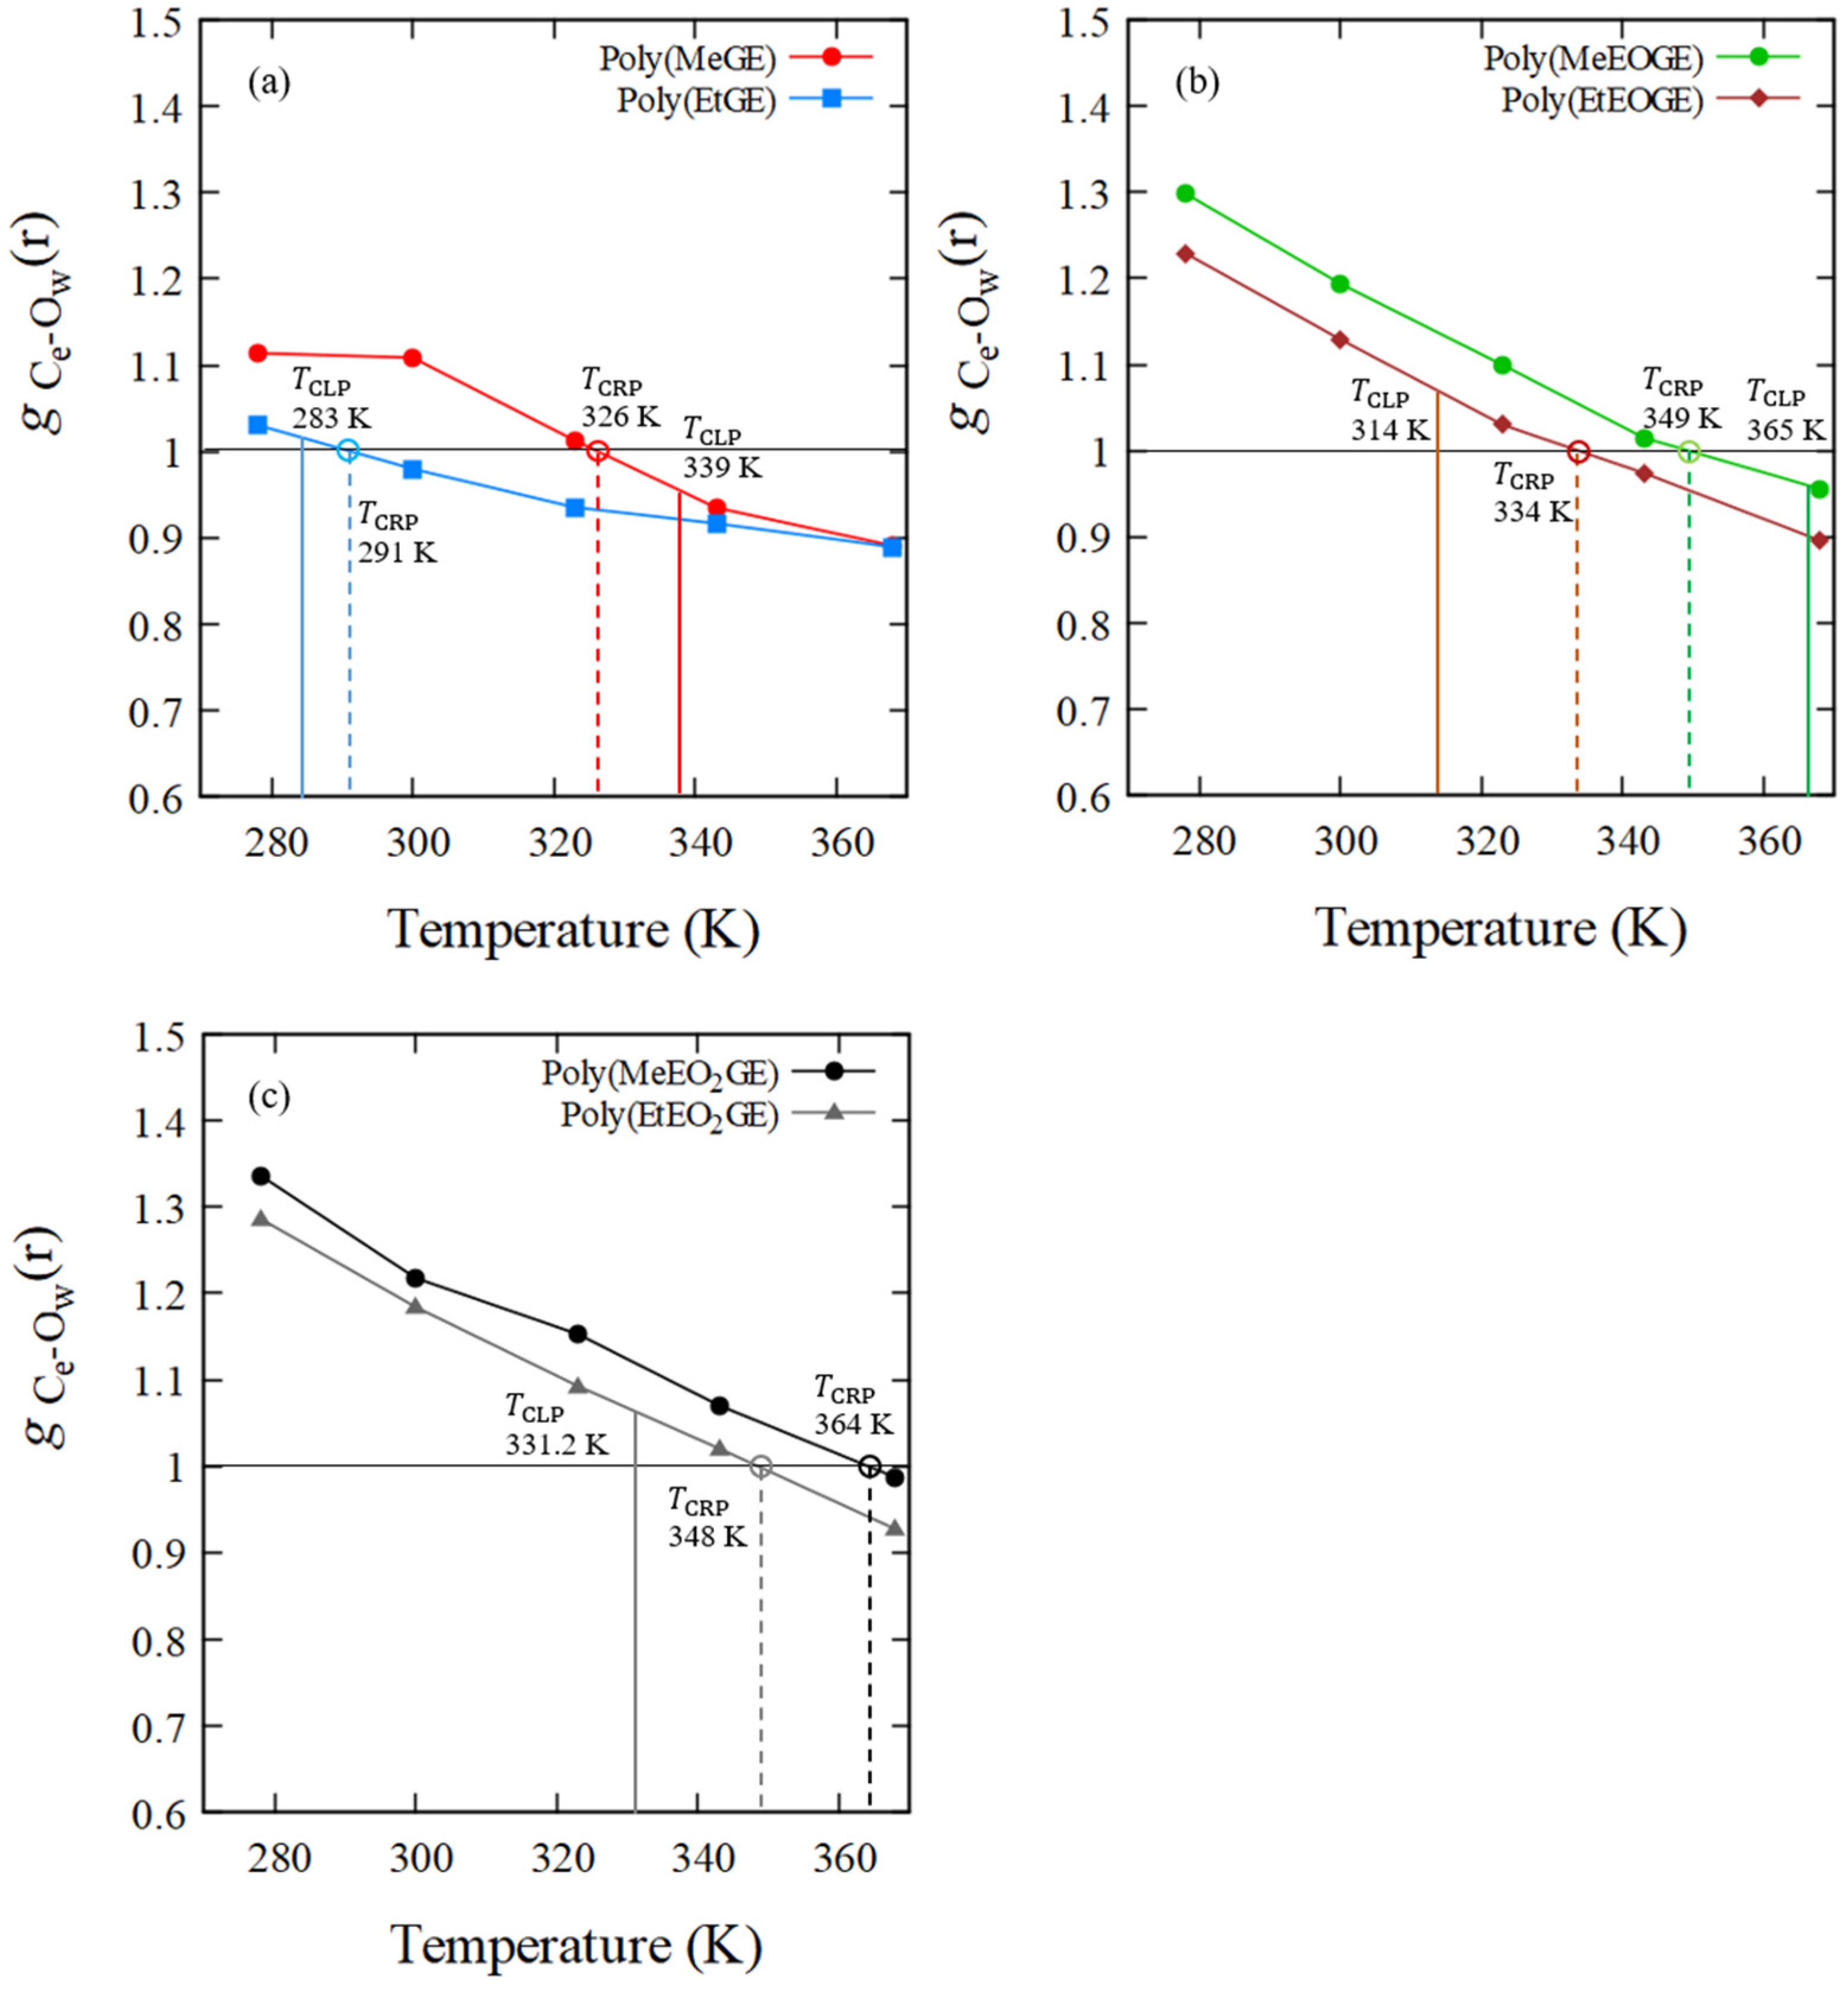
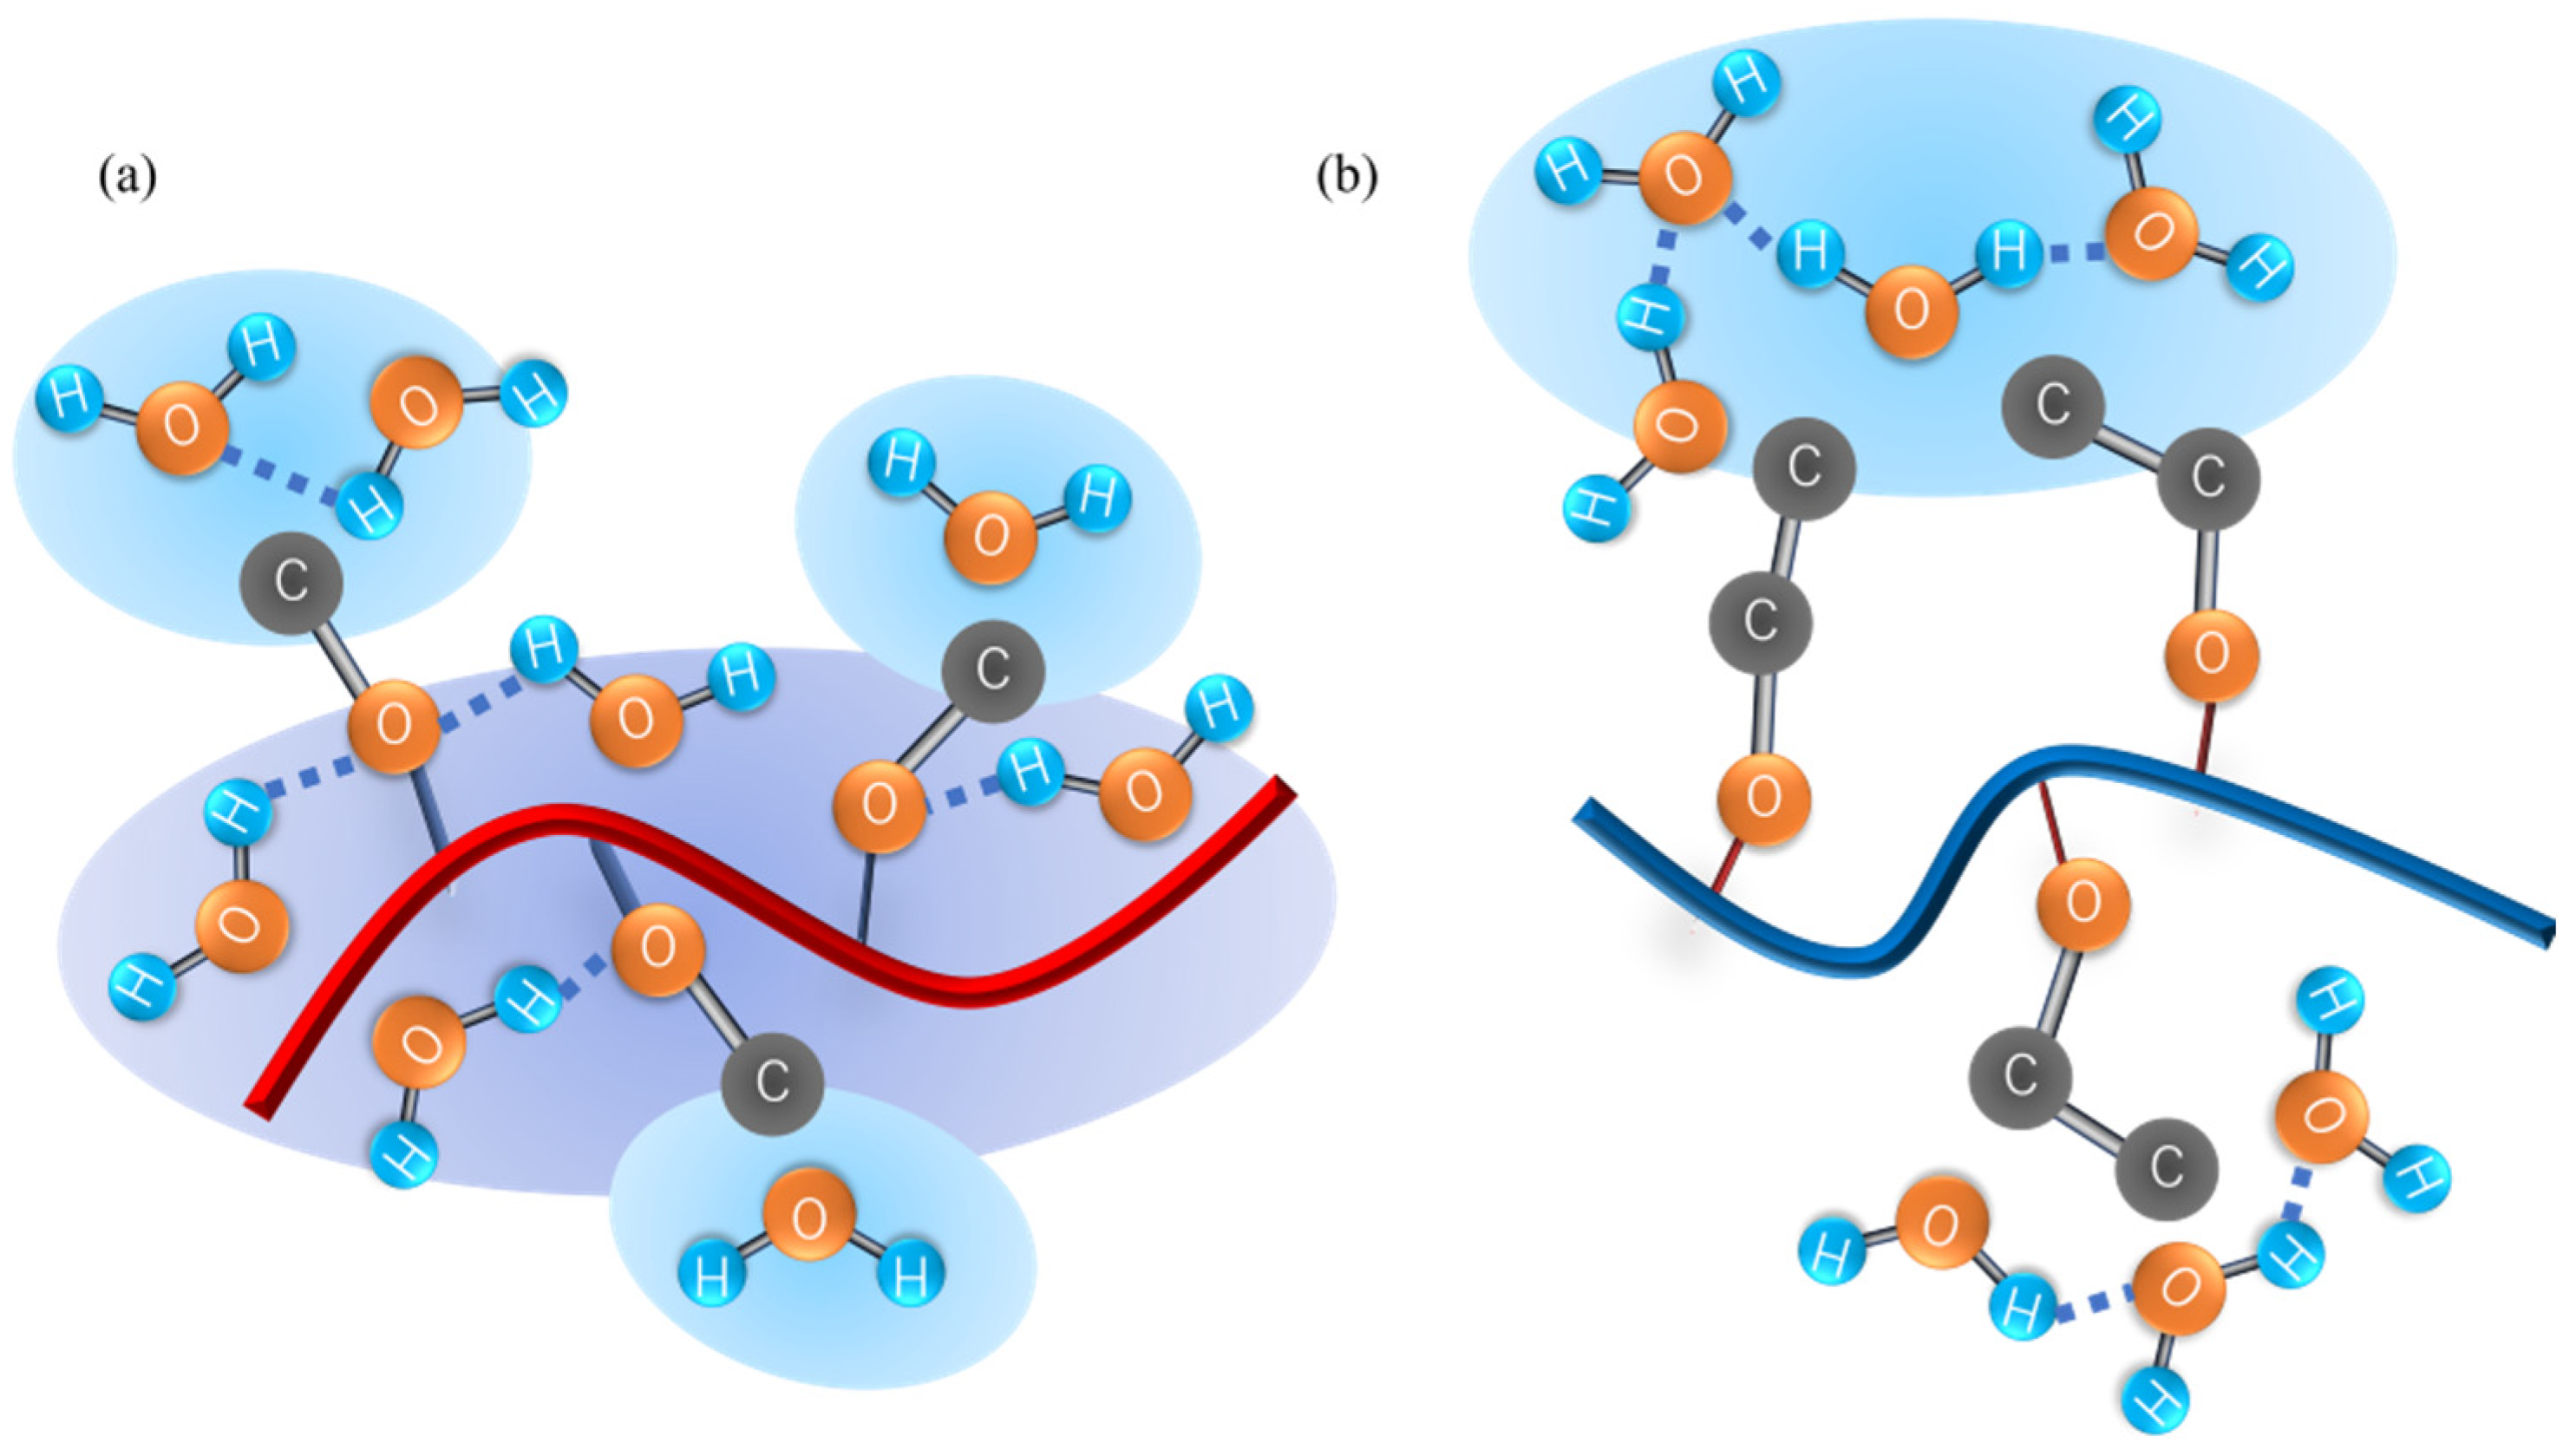
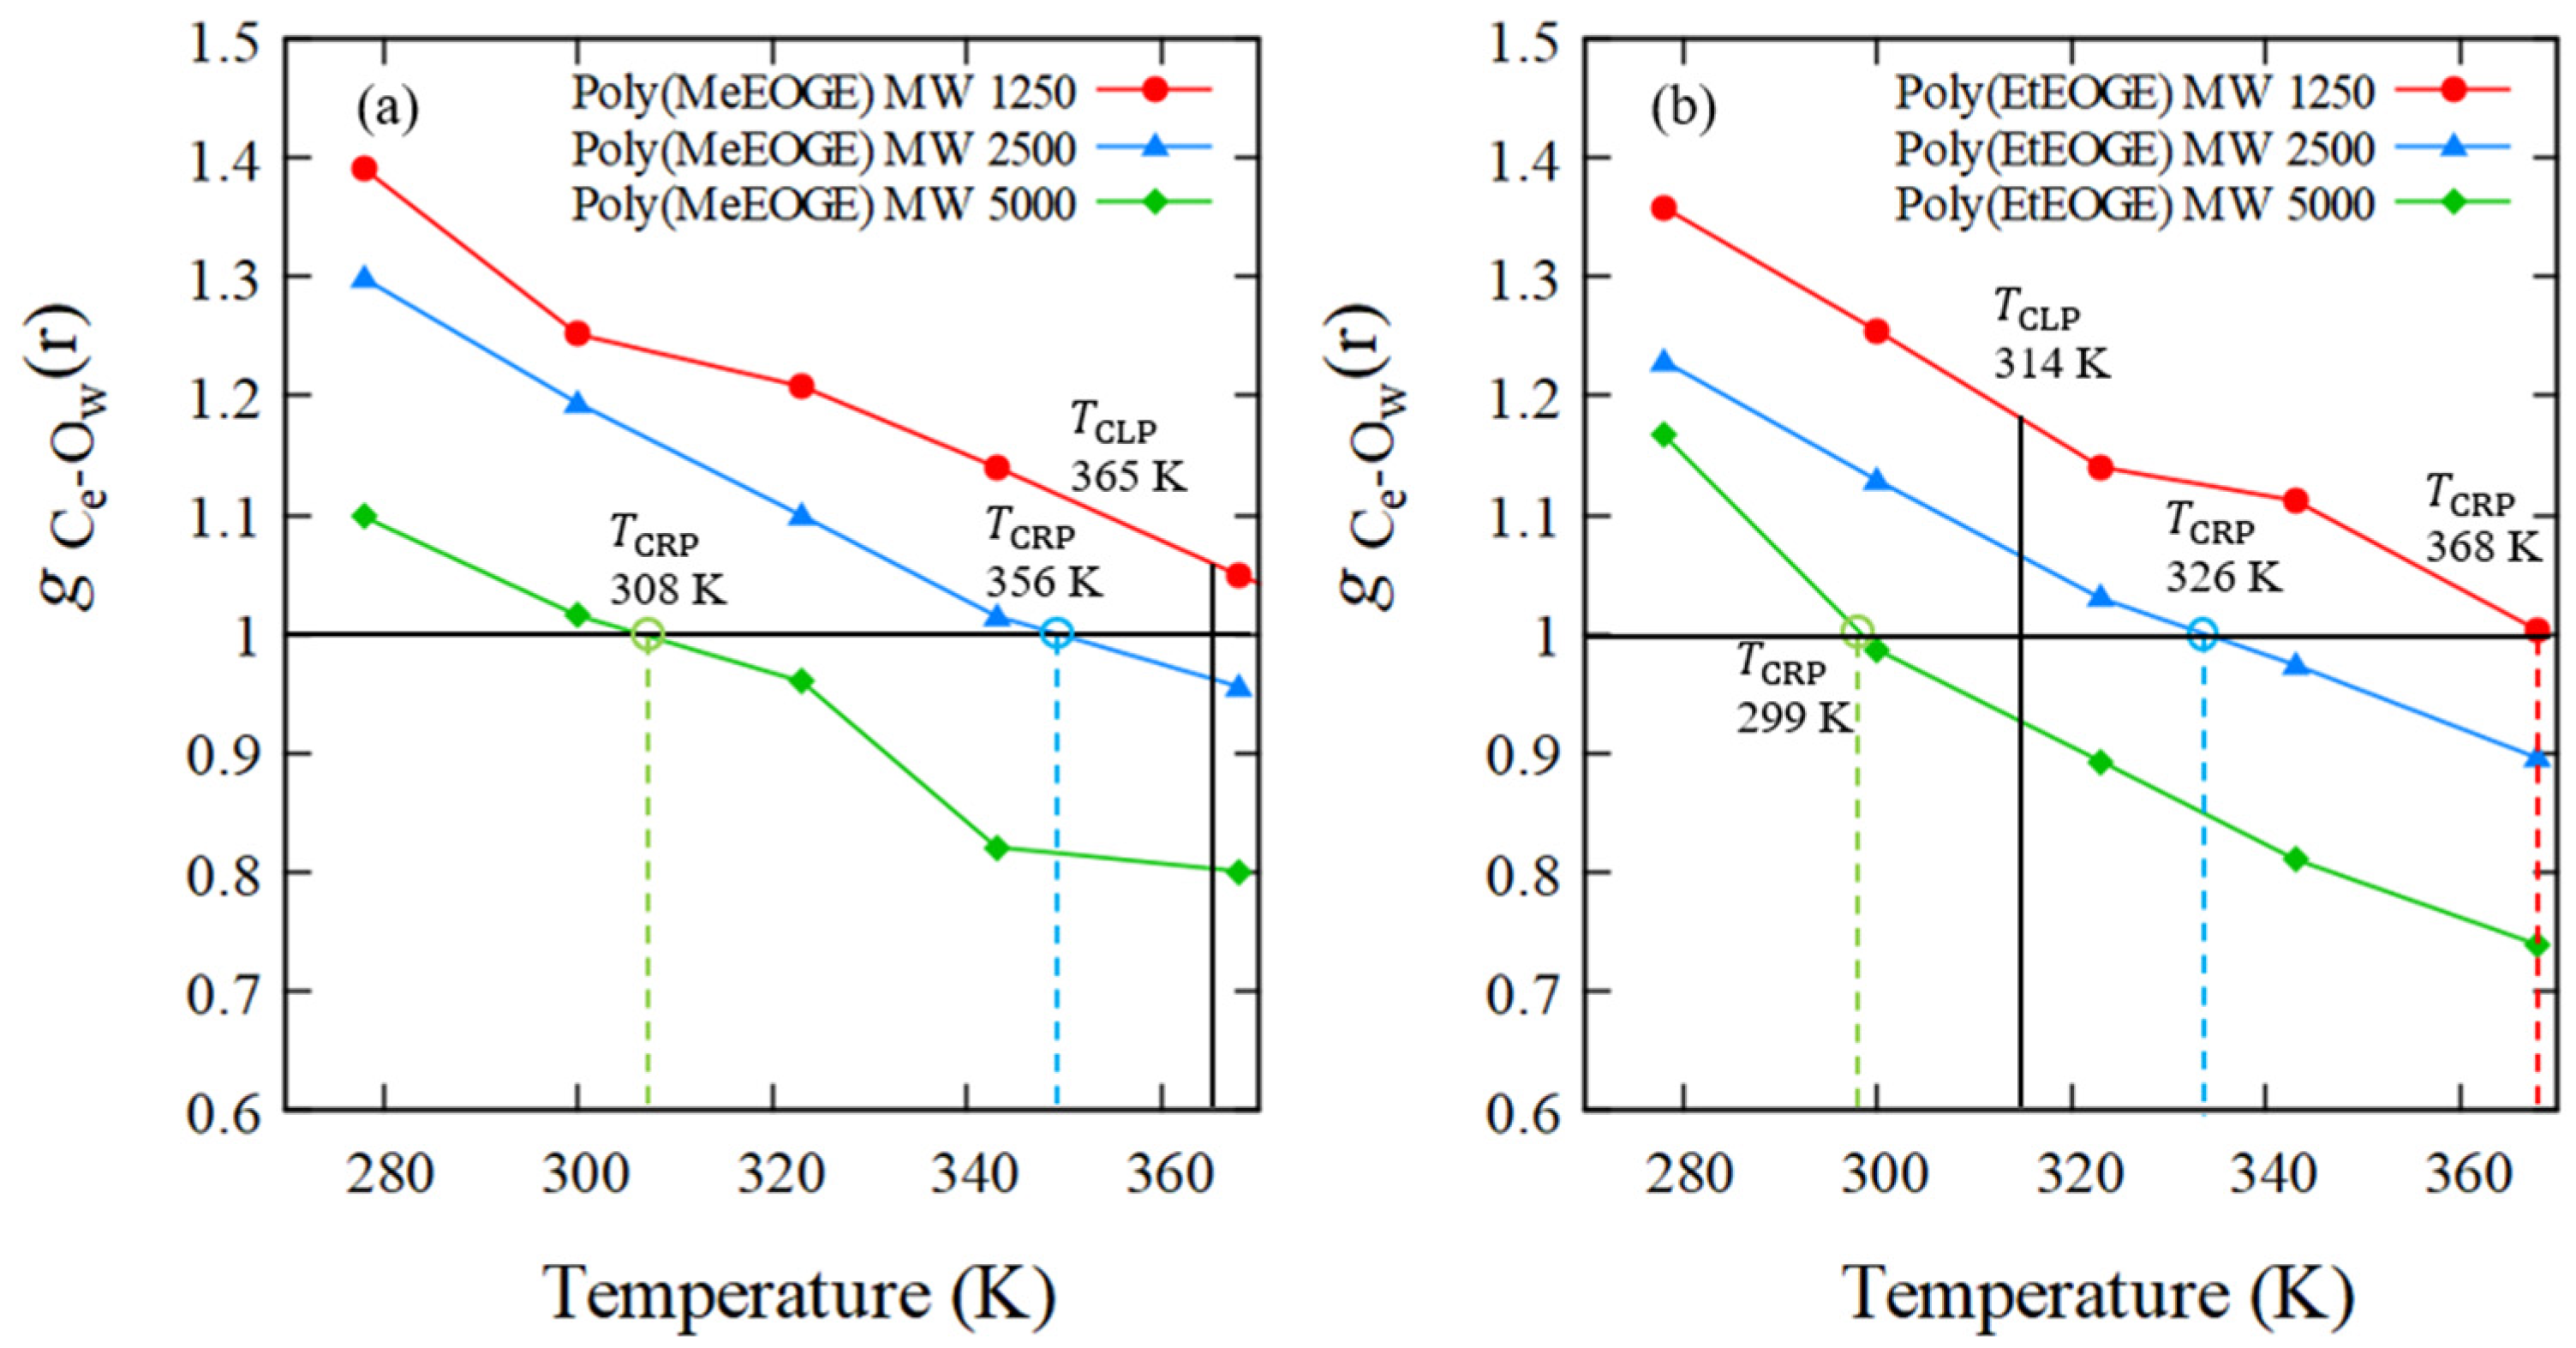
4.4. RDF of Hydrophobic Solvation
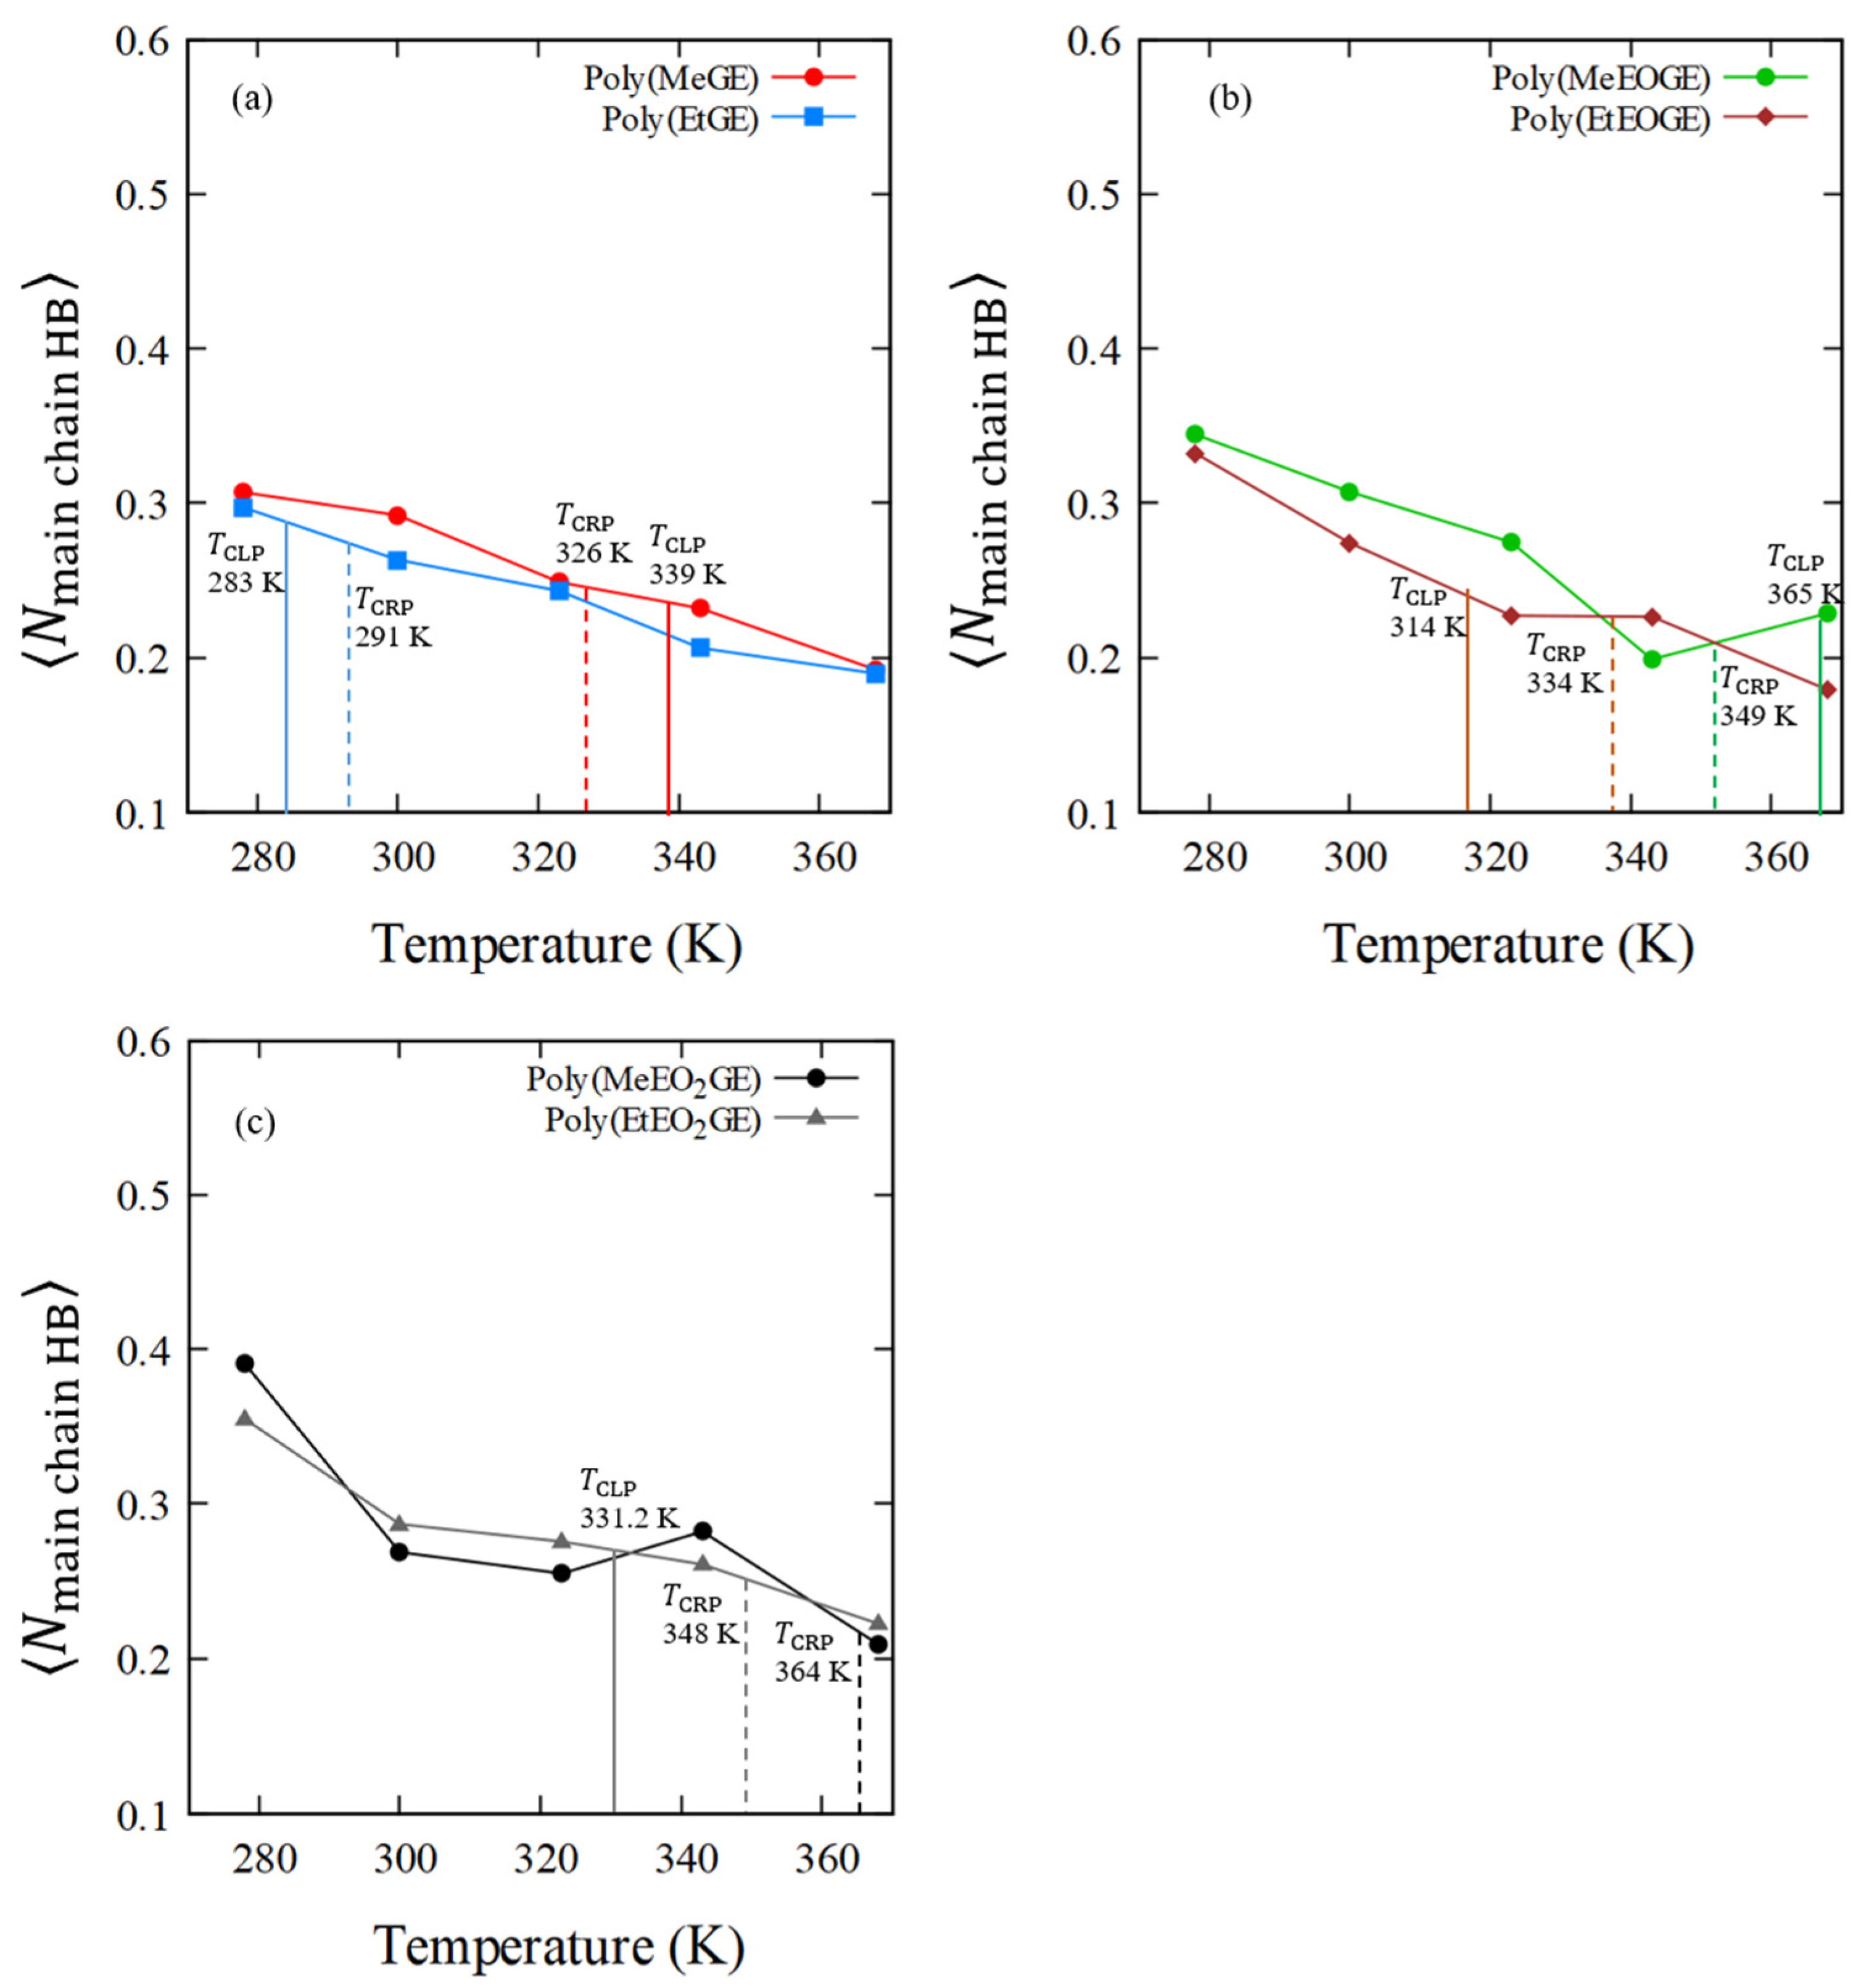
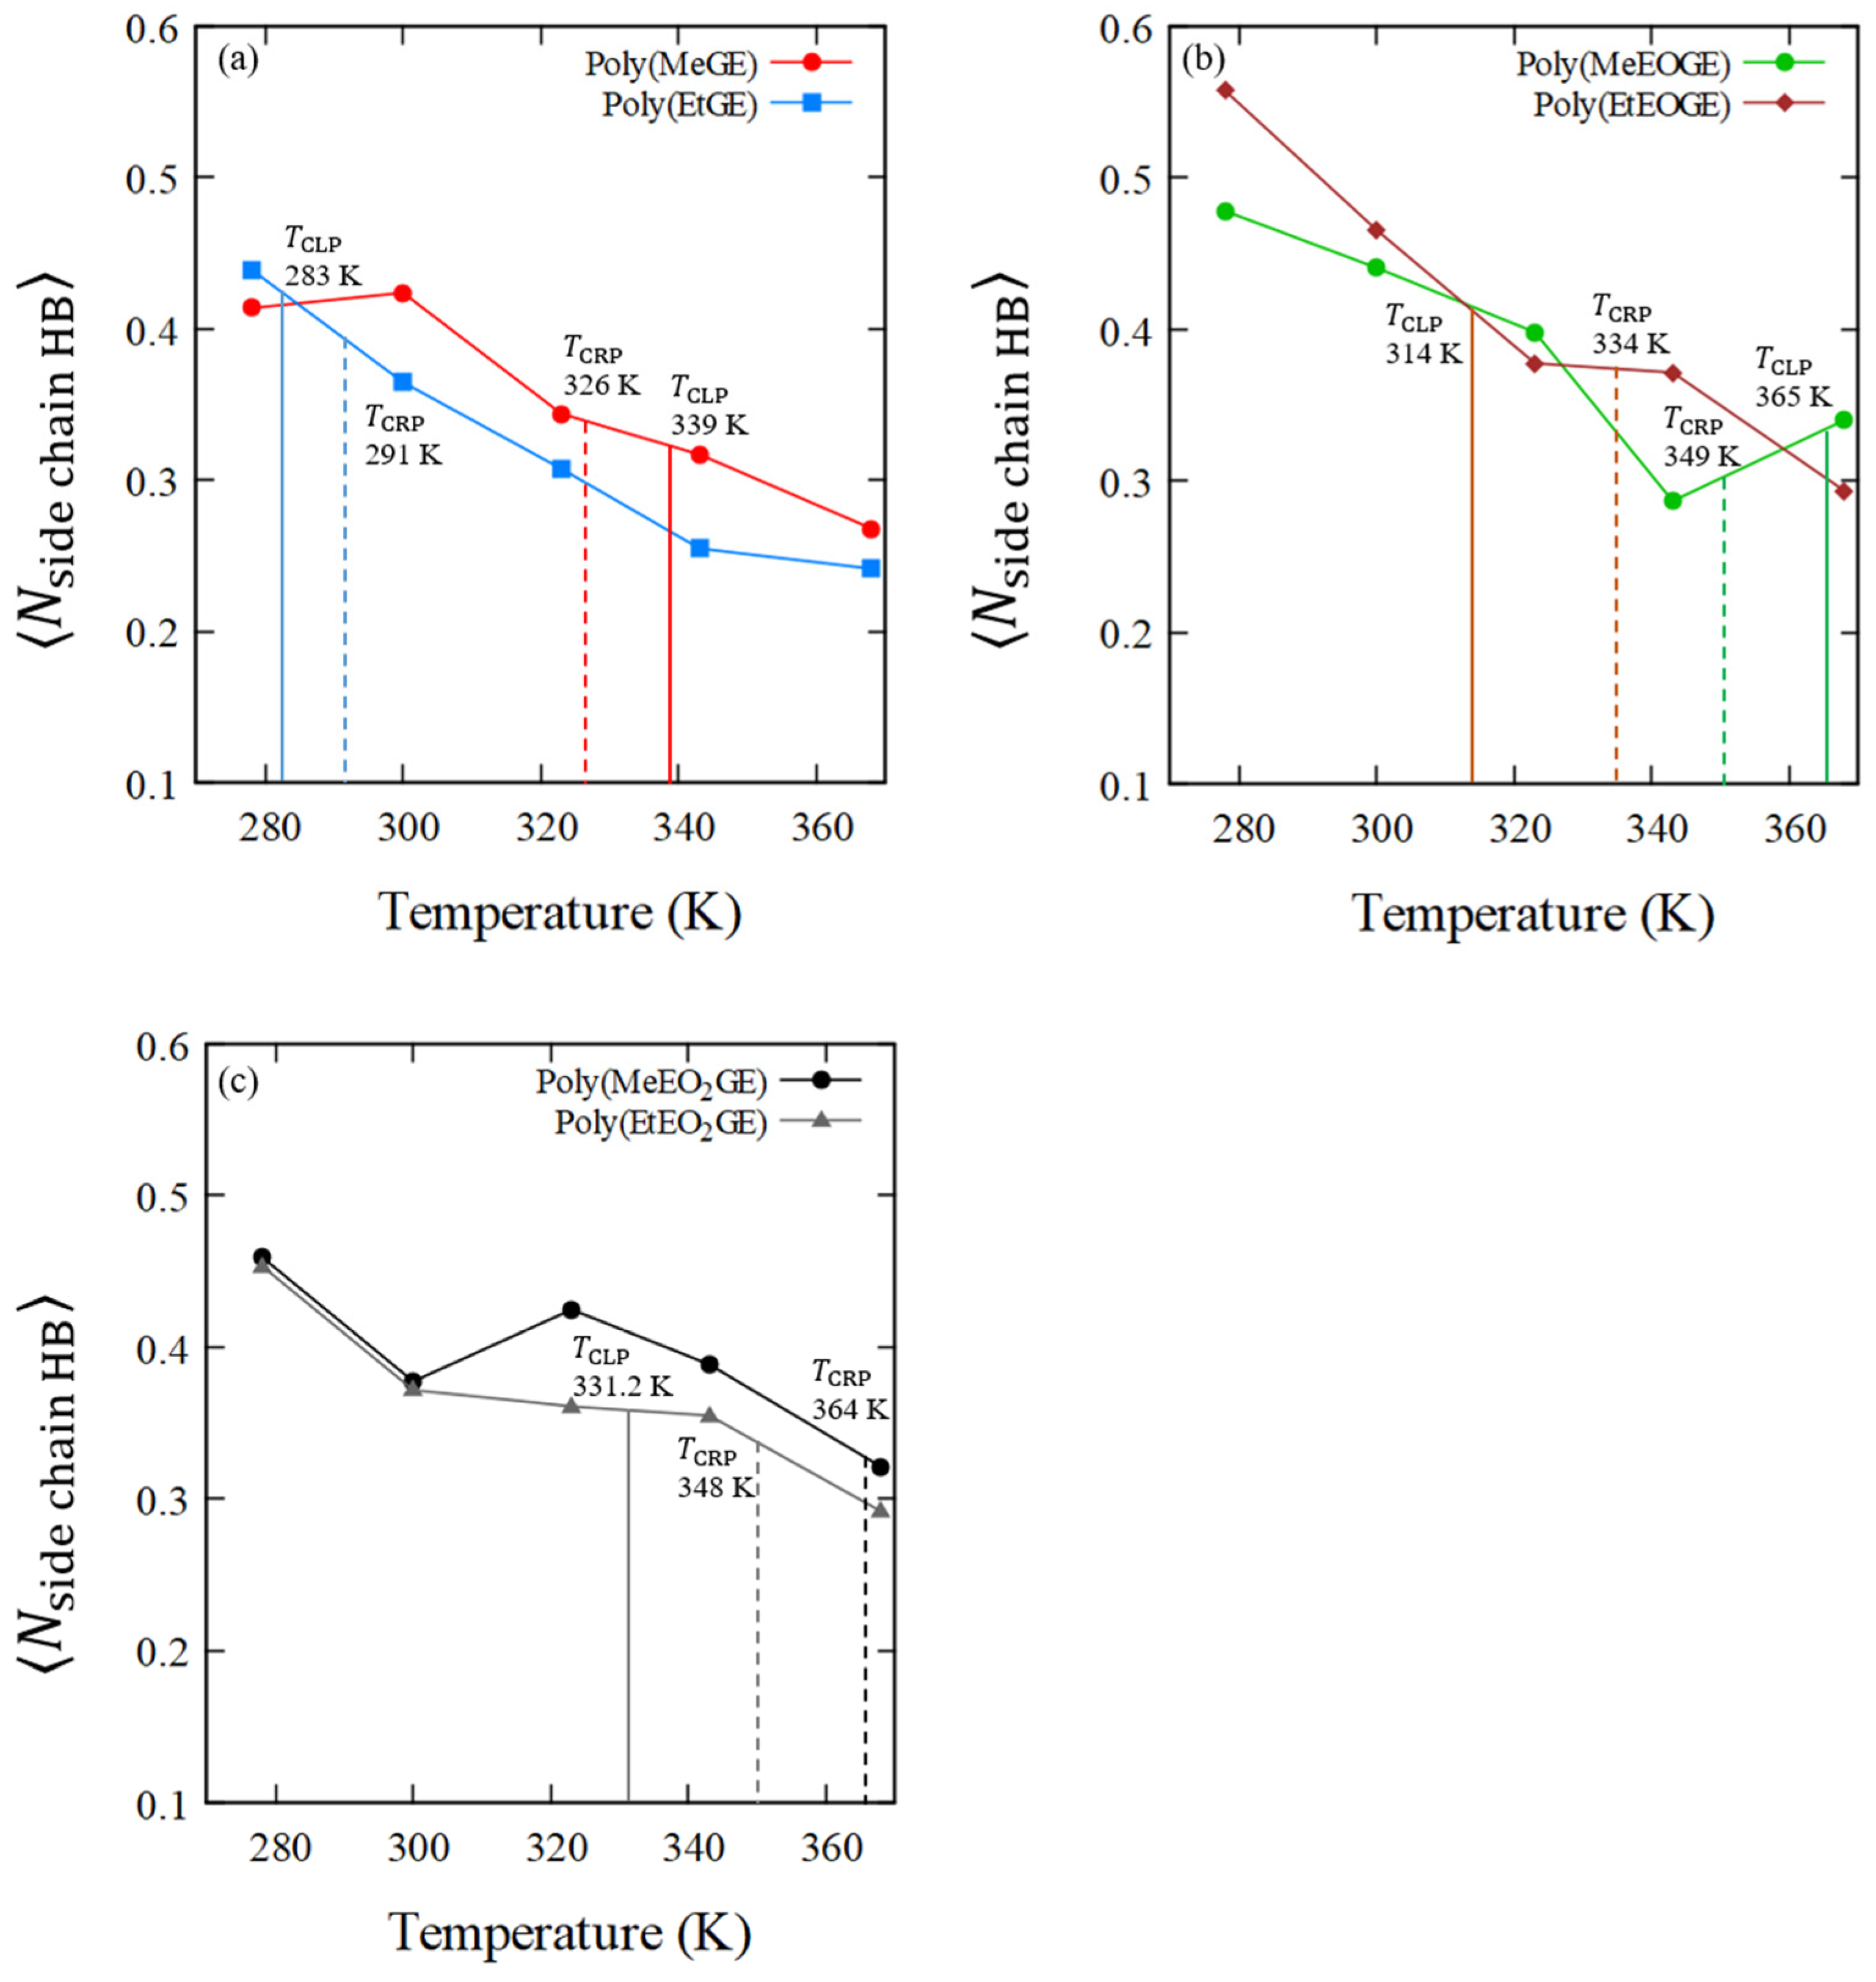
4.5. Numbers of Hydrogen Bonds between the Polymer and Water Molecules
5. Conclusions
Supplementary Materials
Author Contributions
Funding
Institutional Review Board Statement
Data Availability Statement
Conflicts of Interest
References
- Boutris, C.; Chatzi, E.G.; Kiparissides, C. Characterization of the LCST Behaviour of Aqueous Poly(N-Isopropylacrylamide) Solutions by Thermal and Cloud Point Techniques. Polymer 1997, 38, 2567–2570. [Google Scholar] [CrossRef]
- Schild, H.G. Poly(N-Isopropylacrylamide): Experiment, Theory and Application. Prog. Polym. Sci 1992, 17, 163–249. [Google Scholar] [CrossRef]
- Saeki, S.; Kuwahara, N.; Nakata, M.; Kaneko, M. Upper and Lower Critical Solution Temperatures in Poly (Ethylene Glycol) Solutions. Polymer 1976, 17, 685–689. [Google Scholar] [CrossRef]
- Lutz, J.F. Polymerization of Oligo(Ethylene Glycol) (Meth)Acrylates: Toward New Generations of Smart Biocompatible Materials. J. Polym. Sci. A Polym. Chem. 2008, 46, 3459–3470. [Google Scholar] [CrossRef]
- Hu, Z.; Cai, T.; Chi, C. Thermoresponsive Oligo(Ethylene Glycol)-Methacrylate- Based Polymers and Microgels. Soft Matter 2010, 6, 2115–2123. [Google Scholar] [CrossRef]
- Koda, Y.; Terashima, T.; Sawamoto, M. LCST-Type Phase Separation of Poly[Poly(Ethylene Glycol) Methyl Ether Methacrylate]s in Hydrofluorocarbon. ACS Macro Lett. 2015, 4, 1366–1369. [Google Scholar] [CrossRef]
- Inoue, S.; Kakikawa, H.; Nakadan, N.; Imabayashi, S.I.; Watanabe, M. Thermal Response of Poly(Ethoxyethyl Glycidyl Ether) Grafted on Gold Surfaces Probed on the Basis of Temperature-Dependent Water Wettability. Langmuir 2009, 25, 2837–2841. [Google Scholar] [CrossRef]
- Reinicke, S.; Schmelz, J.; Lapp, A.; Karg, M.; Hellweg, T.; Schmalz, H. Smart Hydrogels Based on Double Responsive Triblock Terpolymers. Soft Matter 2009, 5, 2648–2657. [Google Scholar] [CrossRef]
- Labbé, A.; Carlotti, S.; Deffieux, A.; Hirao, A. Controlled Polymerization of Glycidyl Methyl Ether Initiated by Onium Salt/Triisobutylaluminum and Investigation of the Polymer LCST. Macromol. Symp. 2007, 249–250, 392–397. [Google Scholar] [CrossRef]
- Isono, T.; Miyachi, K.; Satoh, Y.; Sato, S.I.; Kakuchi, T.; Satoh, T. Design and Synthesis of Thermoresponsive Aliphatic Polyethers with a Tunable Phase Transition Temperature. Polym. Chem. 2017, 8, 5698–5707. [Google Scholar] [CrossRef]
- Sakai, N.; Jin, M.; Sato, S.I.; Satoh, T.; Kakuchi, T. Synthesis of Water-Soluble Polyisocyanates with the Oligo(Ethylene Glycol) Side-Chain as New Thermoresponsive Polymers. Polym. Chem. 2014, 5, 1057–1062. [Google Scholar] [CrossRef]
- Idziak, I.; Avoce, D.; Lessard, D.; Gravel, D.; Zhu, X.X. Thermosensitivity of Aqueous Solutions of Poly(N,N-Diethylacrylamide). Macromolecules 1999, 32, 1260–1263. [Google Scholar] [CrossRef]
- Vihola, H.; Laukkanen, A.; Valtola, L.; Tenhu, H.; Hirvonen, J. Cytotoxicity of Thermosensitive Polymers Poly(N-Isopropylacrylamide), Poly(N-Vinylcaprolactam) and Amphiphilically Modified Poly(N-Vinylcaprolactam). Biomaterials 2005, 26, 3055–3064. [Google Scholar] [CrossRef] [PubMed]
- Maeda, Y.; Nakamura, T.; Ikeda, I. Hydration and Phase Behavior of Poly(N-Vinylcaprolactam) and Poly(N-Vinylpyrrolidone) in Water. Macromolecules 2002, 35, 217–222. [Google Scholar] [CrossRef]
- Han, X.; Zhang, X.; Zhu, H.; Yin, Q.; Liu, H.; Hu, Y. Effect of Composition of PDMAEMA-b-PAA Block Copolymers on Their PH- and Temperature-Responsive Behaviors. Langmuir 2013, 29, 1024–1034. [Google Scholar] [CrossRef]
- Hrubý, M.; Koňák, Č.; Ulbrich, K. Poly(Allyl Glycidyl Ether)-Block-Poly(Ethylene Oxide): A Novel Promising Polymeric Intermediate for the Preparation of Micellar Drug Delivery Systems. J. Appl. Polym. Sci. 2005, 95, 201–211. [Google Scholar] [CrossRef]
- Gerecke, C.; Edlich, A.; Giulbudagian, M.; Schumacher, F.; Zhang, N.; Said, A.; Yealland, G.; Lohan, S.B.; Neumann, F.; Meinke, M.C.; et al. Biocompatibility and Characterization of Polyglycerol-Based Thermoresponsive Nanogels Designed as Novel Drug-Delivery Systems and Their Intracellular Localization in Keratinocytes. Nanotoxicology 2017, 11, 267–277. [Google Scholar] [CrossRef]
- Heinen, S.; Cuéllar-Camacho, J.L.; Weinhart, M. Thermoresponsive Poly(Glycidyl Ether) Brushes on Gold: Surface Engineering Parameters and Their Implication for Cell Sheet Fabrication. Acta Biomater. 2017, 59, 117–128. [Google Scholar] [CrossRef]
- Stöbener, D.D.; Donath, D.; Weinhart, M. Fast and Solvent-Free Microwave-Assisted Synthesis of Thermoresponsive Oligo(Glycidyl Ether)s. J. Polym. Sci. A Polym. Chem. 2018, 56, 2496–2504. [Google Scholar] [CrossRef]
- Aoki, S.; Koide, A.; Imabayashi, S.I.; Watanabe, M. Novel Thermosensitive Polyethers Prepared by Anionic Ring-Opening Polymerization of Glycidyl Ether Derivatives. Chem. Lett. 2002, 31, 1128–1129. [Google Scholar] [CrossRef]
- Deshmukh, S.A.; Sankaranarayanan, S.K.R.S.; Suthar, K.; Mancini, D.C. Role of Solvation Dynamics and Local Ordering of Water in Inducing Conformational Transitions in Poly(N-Isopropylacrylamide) Oligomers through the LCST. J. Phys. Chem. B 2012, 116, 2651–2663. [Google Scholar] [CrossRef] [PubMed]
- De Oliveira, T.E.; Marques, C.M.; Netz, P.A. Molecular Dynamics Study of the LCST Transition in Aqueous Poly(N-n-Propylacrylamide). Phys. Chem. Chem. Phys. 2018, 20, 10100–10107. [Google Scholar] [CrossRef] [PubMed]
- Consiglio, G.; Forte, G. Molecular Dynamics Study of Coil-to-Globule Transition in a Thermo-Responsive Oligomer Bound to Various Surfaces: Hydrophilic Surfaces Stabilize the Coil Form. Phys. Chem. Chem. Phys. 2018, 20, 29754–29763. [Google Scholar] [CrossRef] [PubMed]
- Bentley, C.L.; Chwatko, M.; Wheatle, B.K.; Burkey, A.A.; Helenic, A.; Morales-Collazo, O.; Ganesan, V.; Lynd, N.A.; Brennecke, J.F. Modes of Interaction in Binary Blends of Hydrophobic Polyethers and Imidazolium Bis(Trifluoromethylsulfonyl)Imide Ionic Liquids. Macromolecules 2020, 53, 6519–6528. [Google Scholar] [CrossRef]
- Sun, S.; Wu, P. On the Thermally Reversible Dynamic Hydration Behavior of Oligo(Ethylene Glycol) Methacrylate-Based Polymers in Water. Macromolecules 2013, 46, 236–246. [Google Scholar] [CrossRef]
- Zhelavskyi, O.S.; Kyrychenko, A. Atomistic Molecular Dynamics Simulations of the LCST Conformational Transition in Poly(N-Vinylcaprolactam) in Water. J. Mol. Graph. Model. 2019, 90, 51–58. [Google Scholar] [CrossRef]
- Sun, X.; Qian, X. Atomistic Molecular Dynamics Simulations of the Lower Critical Solution Temperature Transition of Poly(N-Vinylcaprolactam) in Aqueous Solutions. J. Phys. Chem. B 2019, 123, 4986–4995. [Google Scholar] [CrossRef]
- Koochaki, A.; Moghbeli, M.R.; Javan Nikkhah, S. Coil-to-Globule Transition of Thermo-Responsive γ-Substituted Poly (ε-Caprolactone) in Water: A Molecular Dynamics Simulation Study. Curr. Appl. Phys. 2018, 18, 1313–1319. [Google Scholar] [CrossRef]
- Karataraki, G.; Sapalidis, A.; Tocci, E.; Gotzias, A. Molecular Dynamics of Water Embedded Carbon Nanocones: Surface Waves Observation. Computation 2019, 7, 50. [Google Scholar] [CrossRef]
- Pica, A.; Graziano, G. On the Effect of Sodium Salts on the Coil-to-Globule Transition of Poly(N-Isopropylacrylamide). Phys. Chem. Chem. Phys. 2015, 17, 27750–27757. [Google Scholar] [CrossRef]
- Pica, A.; Graziano, G. Effect of Sodium Thiocyanate and Sodium Perchlorate on Poly(N-Isopropylacrylamide) Collapse. Phys. Chem. Chem. Phys. 2019, 22, 189–195. [Google Scholar] [CrossRef] [PubMed]
- Jakalian, A.; Bush, B.L.; Jack, D.B.; Bayly, C.I. Fast, Efficient Generation of High-Quality Atomic Charges. AM1-BCC Model: I. Method. J. Comput. Chem. 2000, 21, 132–146. [Google Scholar] [CrossRef]
- Jakalian, A.; Jack, D.B.; Bayly, C.I. Fast, Efficient Generation of High-Quality Atomic Charges. AM1-BCC Model: II. Parameterization and Validation. J. Comput. Chem. 2002, 23, 1623–1641. [Google Scholar] [CrossRef] [PubMed]
- Wang, J.; Wolf, R.M.; Caldwell, J.W.; Kollman, P.A.; Case, D.A. Development and Testing of a General Amber Force Field. J. Comput. Chem. 2004, 25, 1157–1174. [Google Scholar] [CrossRef]
- Doi, M. Introduction to Polymer Physics; See, H., Translator; Oxford University Press: Cary, NC, USA, 1996. [Google Scholar]
- Maeda, Y.; Higuchi, T.; Ikeda, I. Change in Hydration State during the Coil-Globule Transition of Aqueous Solutions of Poly(Af-Isopropylacrylamide) as Evidenced by FTIR Spectroscopyi. Langmuir 2000, 16, 7503–7509. [Google Scholar] [CrossRef]
- Tavagnacco, L.; Zaccarelli, E.; Chiessi, E. On the Molecular Origin of the Cooperative Coil-to-Globule Transition of Poly(N-Isopropylacrylamide) in Water. Phys. Chem. Chem. Phys. 2018, 20, 9997–10010. [Google Scholar] [CrossRef]
- Dalgakiran, E.; Tatlipinar, H. The Role of Hydrophobic Hydration in the LCST Behaviour of POEGMA300 by All-Atom Molecular Dynamics Simulations. Phys. Chem. Chem. Phys. 2018, 20, 15389–15399. [Google Scholar] [CrossRef]


| Sample ID | Rg/Å (SD/Å) | |||||
|---|---|---|---|---|---|---|
| 278 K | 300 K | 323 K | 343 K | 368 K | ||
| poly(MeGE)2.5k | 338.5 | 8.6 (0.5) | 8.9 (0.9) | 8.7 (1.2) | 8.6 (0.6) | 9.1 (0.6) |
| poly(EtGE)2.5k | 283.3 | 8.8 (0.3) | 8.9 (0.5) | 9.0 (0.5) | 8.7 (0.5) | 8.9 (0.5) |
| poly(MeEOGE)2.5k | 364.6 | 9.7 (0.5) | 9.4 (0.8) | 9.3 (0.6) | 9.0 (0.6) | 9.5 (0.6) |
| poly(EtEOGE)2.5k | 314.3 | 9.1 (0.5) | 8.7 (0.4) | 9.0 (0.5) | 9.0 (0.6) | 8.9 (0.5) |
| poly(MeEO2GE)2.5k | Not observed ** | 8.9 (0.2) | 9.2 (0.4) | 8.9 (0.4) | 9.3 (0.4) | 9.0 (0.5) |
| poly(EtEO2GE)2.5k | 331.2 | 9.5 (0.2) | 9.1 (0.5) | 9.3 (0.5) | 9.0 (0.5) | 9.1 (0.6) |
| Polymer ID | Temperature (K) | SD | CV | ||
|---|---|---|---|---|---|
| poly(MeGE)2.5k | 278 | 0.14 | 0.19 | 0.04 | 0.32 |
| 300 | 0.17 | 0.19 | 0.07 | 0.43 | |
| 323 | 0.21 | 0.19 | 0.07 | 0.34 | |
| 343 | 0.16 | 0.19 | 0.05 | 0.33 | |
| 368 | 0.15 | 0.19 | 0.07 | 0.44 | |
| poly(EtGE)2.5k | 278 | 0.17 | 0.20 | 0.03 | 0.17 |
| 300 | 0.20 | 0.20 | 0.06 | 0.31 | |
| 323 | 0.14 | 0.20 | 0.06 | 0.44 | |
| 343 | 0.15 | 0.20 | 0.05 | 0.35 | |
| 368 | 0.17 | 0.20 | 0.06 | 0.33 | |
| poly(MeEOGE)2.5k | 278 | 0.28 | 0.23 | 0.10 | 0.37 |
| 300 | 0.34 | 0.23 | 0.10 | 0.30 | |
| 323 | 0.25 | 0.23 | 0.10 | 0.39 | |
| 343 | 0.24 | 0.23 | 0.09 | 0.36 | |
| 368 | 0.25 | 0.23 | 0.10 | 0.39 | |
| poly(EtEOGE)2.5k | 278 | 0.25 | 0.24 | 0.05 | 0.20 |
| 300 | 0.23 | 0.24 | 0.08 | 0.35 | |
| 323 | 0.20 | 0.24 | 0.07 | 0.34 | |
| 343 | 0.23 | 0.24 | 0.08 | 0.35 | |
| 368 | 0.24 | 0.24 | 0.09 | 0.35 | |
| poly(MeEO2GE)2.5k | 278 | 0.28 | 0.27 | 0.07 | 0.24 |
| 300 | 0.27 | 0.27 | 0.09 | 0.33 | |
| 323 | 0.32 | 0.27 | 0.08 | 0.24 | |
| 343 | 0.27 | 0.27 | 0.11 | 0.40 | |
| 368 | 0.30 | 0.27 | 0.10 | 0.32 | |
| poly(EtEO2GE)2.5k | 278 | 0.34 | 0.26 | 0.05 | 0.14 |
| 300 | 0.30 | 0.26 | 0.11 | 0.37 | |
| 323 | 0.29 | 0.26 | 0.07 | 0.25 | |
| 343 | 0.28 | 0.26 | 0.11 | 0.38 | |
| 368 | 0.33 | 0.26 | 0.12 | 0.35 |
| Polymer ID | SD | CV | |
|---|---|---|---|
| poly(MeGE)2.5k | 0.17 | 0.027 | 0.159 |
| poly(EtGE)2.5k | 0.16 | 0.023 | 0.140 |
| poly(MeEOGE)2.5k | 0.27 | 0.043 | 0.158 |
| poly(EtEOGE)2.5k | 0.23 | 0.020 | 0.085 |
| poly(MeEO2GE)2.5k | 0.29 | 0.024 | 0.082 |
| poly(EtEO2GE)2.5k | 0.31 | 0.026 | 0.084 |
| Polymer ID | Temperature (K) | SD | CV | ||
|---|---|---|---|---|---|
| poly(MeEOGE)1.25k | 278 | 0.30 | 0.33 | 0.11 | 0.36 |
| 300 | 0.43 | 0.33 | 0.05 | 0.12 | |
| 323 | 0.35 | 0.33 | 0.14 | 0.40 | |
| 343 | 0.37 | 0.33 | 0.12 | 0.32 | |
| 368 | 0.38 | 0.33 | 0.13 | 0.34 | |
| poly(MeEOGE)2.5k | 278 | 0.28 | 0.23 | 0.10 | 0.37 |
| 300 | 0.34 | 0.23 | 0.10 | 0.30 | |
| 323 | 0.25 | 0.23 | 0.10 | 0.39 | |
| 343 | 0.24 | 0.23 | 0.09 | 0.36 | |
| 368 | 0.25 | 0.23 | 0.10 | 0.39 | |
| poly(MeEOGE)5k | 278 | 0.07 | 0.16 | 0.02 | 0.31 |
| 300 | 0.11 | 0.16 | 0.01 | 0.12 | |
| 323 | 0.08 | 0.16 | 0.02 | 0.27 | |
| 343 | 0.15 | 0.16 | 0.03 | 0.20 | |
| 368 | 0.11 | 0.16 | 0.04 | 0.37 |
| Sample ID | Time-Averaged Side Chain Length (Å) | Temperature-Averaged Side Chain Length (Å) | SD (Å) | CV | ||||
|---|---|---|---|---|---|---|---|---|
| 278 K | 300 K | 323 K | 343 K | 368 K | ||||
| poly(MeGE)2.5k | 3.70 | 3.70 | 3.69 | 3.67 | 3.66 | 3.68 | 0.017 | 0.005 |
| poly(EtGE)2.5k | 4.74 | 4.72 | 4.70 | 4.69 | 4.68 | 4.71 | 0.023 | 0.005 |
| poly(MeEOGE)2.5k | 6.30 | 6.24 | 6.20 | 6.16 | 6.13 | 6.21 | 0.068 | 0.011 |
| poly(EtEOGE)2.5k | 7.06 | 7.01 | 7.08 | 7.11 | 7.00 | 7.05 | 0.047 | 0.007 |
| poly(MeEO2GE)2.5k | 8.08 | 8.00 | 8.08 | 8.01 | 7.97 | 8.03 | 0.048 | 0.006 |
| poly(EtEO2GE)2.5k | 8.54 | 8.54 | 8.49 | 8.56 | 8.55 | 8.54 | 0.024 | 0.003 |
| Sample ID | |||
|---|---|---|---|
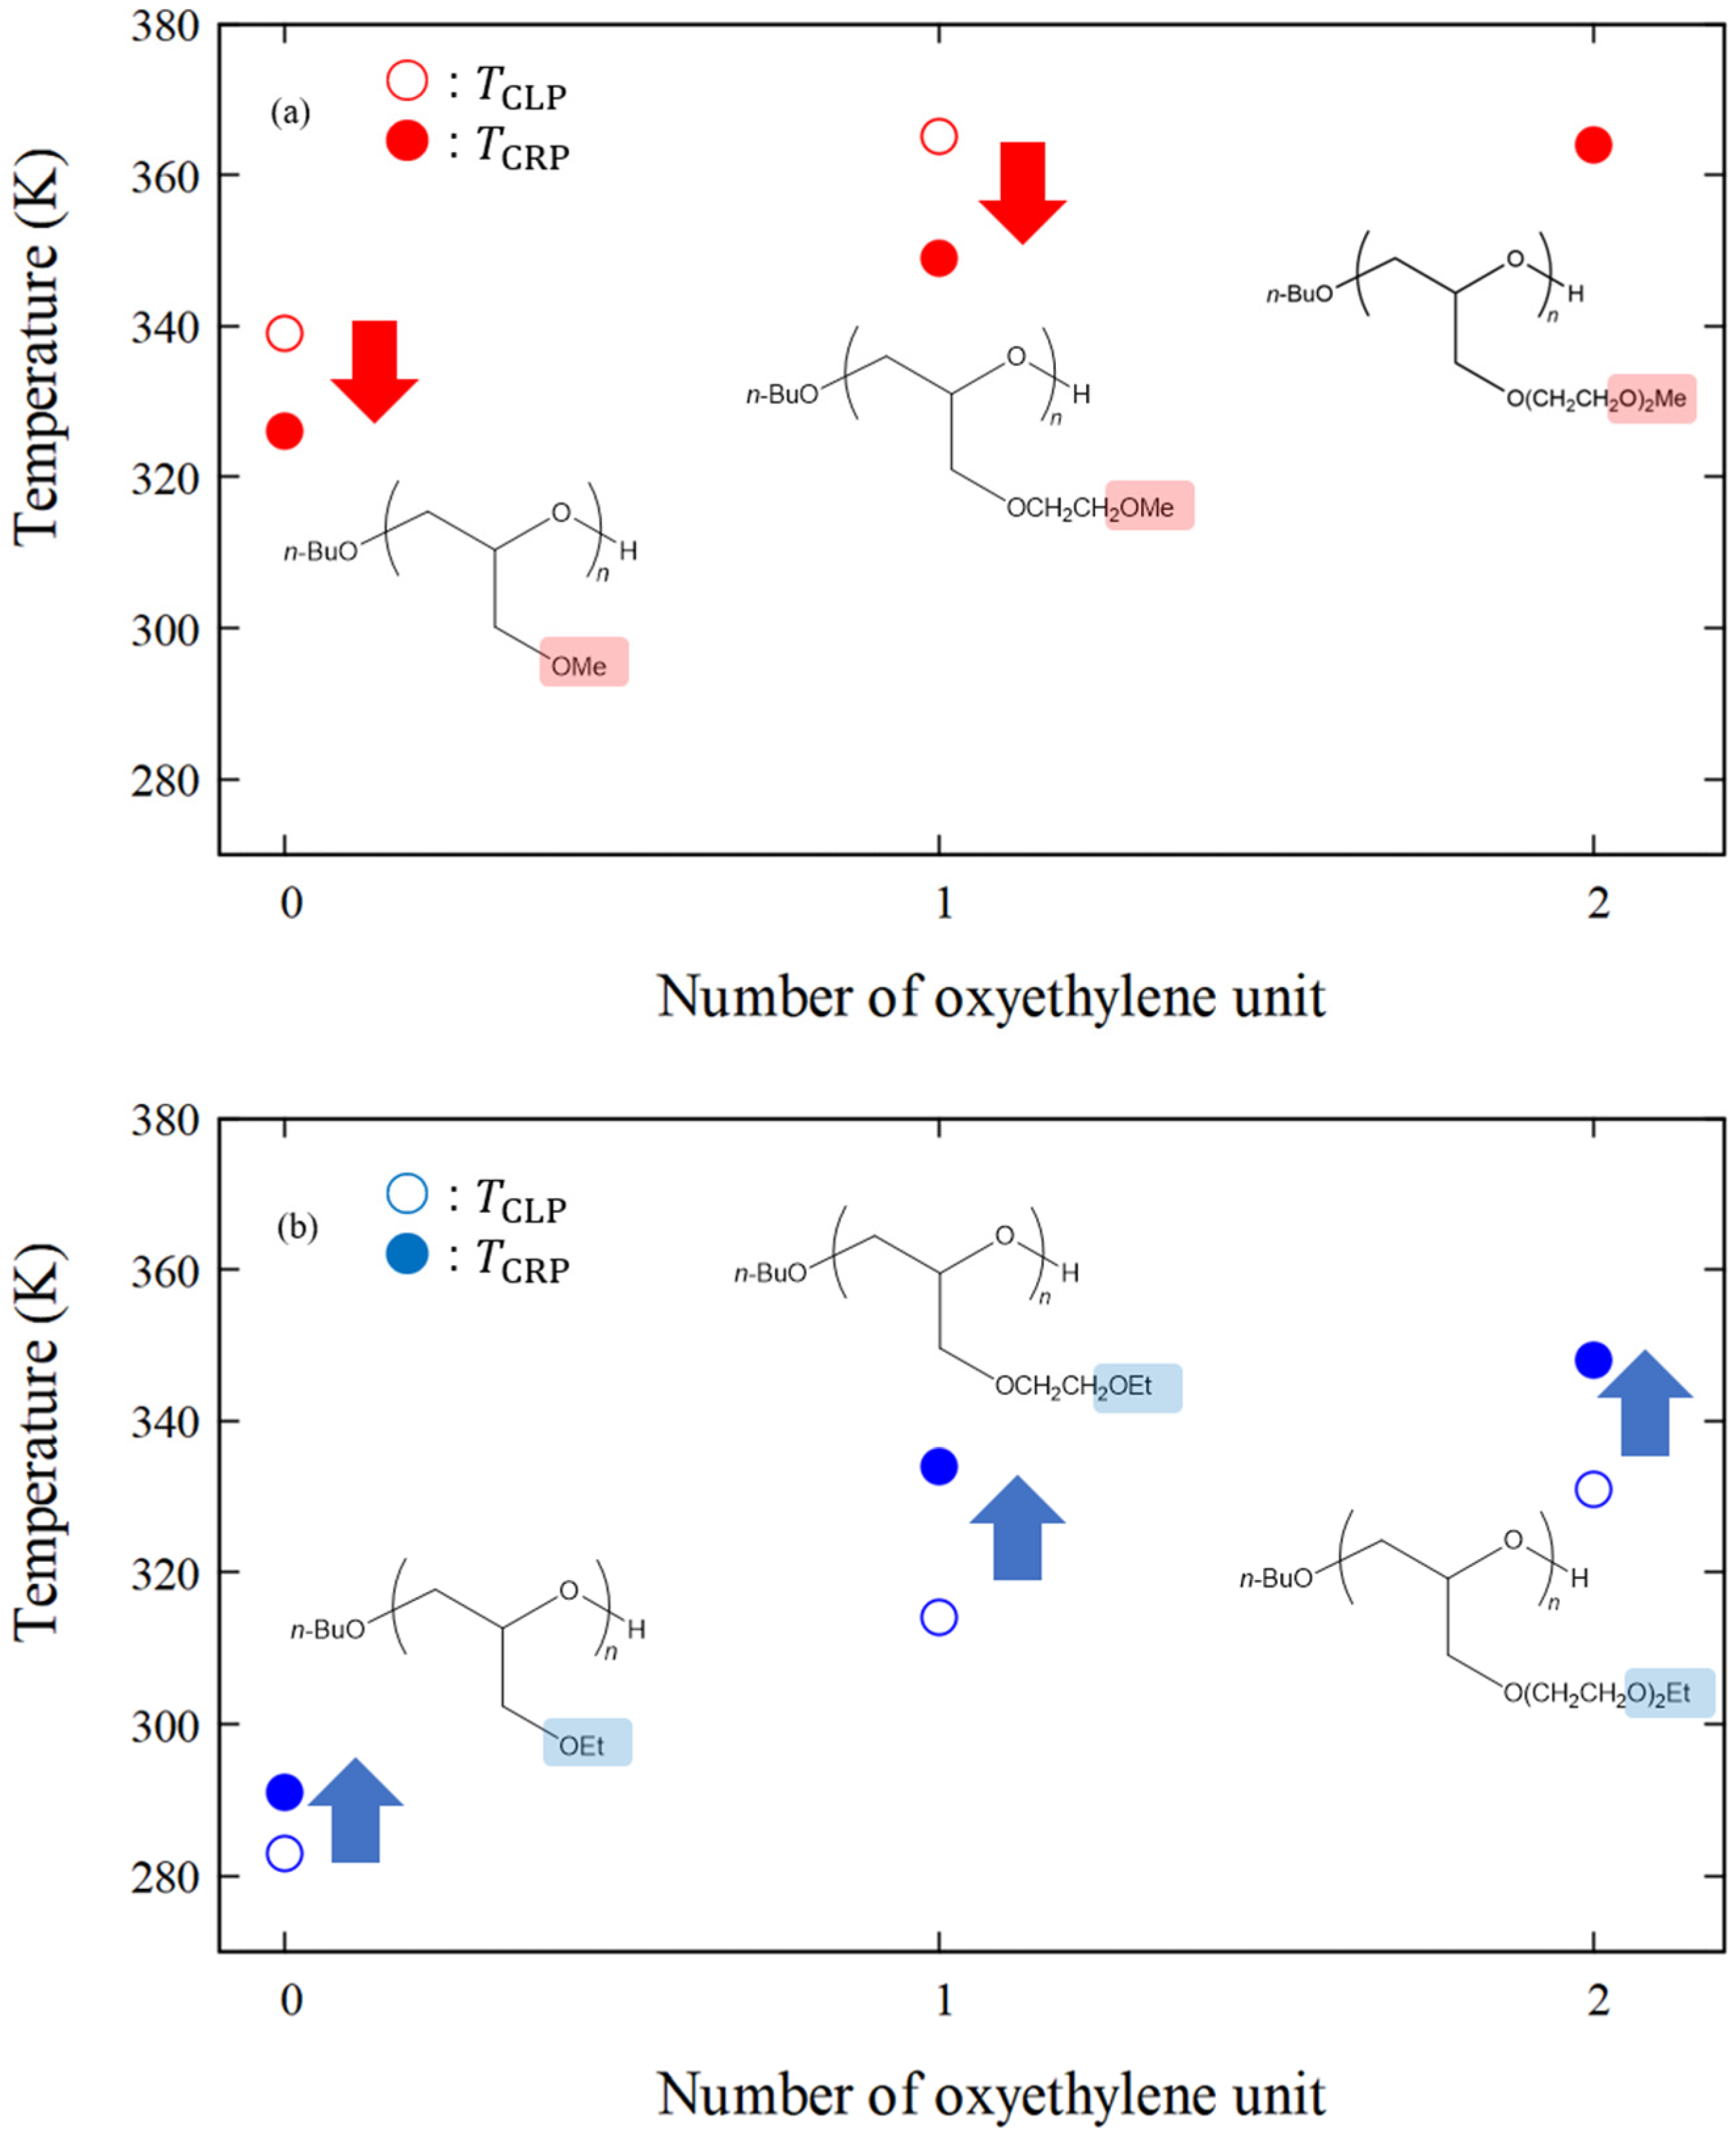
| poly(MeGE)2.5k | 326 | 339 | −13 |
| poly(EtGE)2.5k | 291 | 283 | +8 |
| poly(MeEOGE)2.5k | 349 | 365 | −16 |
| poly(EtEOGE)2.5k | 334 | 314 | +20 |
| poly(MeEO2GE)2.5k | 364 | N.D. * | |
| poly(EtEO2GE)2.5k | 348 | 331 | +17 |
| Sample ID | Average Number of Polymer–Water HBs in Main-Chain O Atoms, (Per Oxygen in Polymer Residue) | Average Number of Polymer–Water HBs in Side-Chain O Atoms, (Per Oxygen in Polymer Residue) | |||||||||
|---|---|---|---|---|---|---|---|---|---|---|---|
| 278 K | 300 K | 323 K | 343 K | 368 K | 278 K | 300 K | 323 K | 343 K | 368 K | ||
| poly(MeGE)2.5k | 338.5 | 0.31 | 0.29 | 0.25 | 0.23 | 0.19 | 0.41 | 0.42 | 0.34 | 0.32 | 0.27 |
| poly(EtGE)2.5k | 283.3 | 0.30 | 0.26 | 0.24 | 0.21 | 0.19 | 0.44 | 0.36 | 0.31 | 0.25 | 0.24 |
| poly(MeEOGE)2.5k | 364.6 | 0.34 | 0.31 | 0.27 | 0.20 | 0.23 | 0.48 | 0.44 | 0.40 | 0.29 | 0.34 |
| poly(EtEOGE)2.5k | 314.3 | 0.33 | 0.27 | 0.23 | 0.23 | 0.18 | 0.56 | 0.47 | 0.38 | 0.37 | 0.29 |
| poly(MeEO2GE)2.5k | N.D. | 0.39 | 0.27 | 0.25 | 0.28 | 0.21 | 0.46 | 0.38 | 0.42 | 0.39 | 0.32 |
| poly(EtEO2GE)2.5k | 331.2 | 0.35 | 0.29 | 0.28 | 0.26 | 0.22 | 0.45 | 0.37 | 0.36 | 0.35 | 0.29 |
Disclaimer/Publisher’s Note: The statements, opinions and data contained in all publications are solely those of the individual author(s) and contributor(s) and not of MDPI and/or the editor(s). MDPI and/or the editor(s) disclaim responsibility for any injury to people or property resulting from any ideas, methods, instructions or products referred to in the content. |
© 2023 by the authors. Licensee MDPI, Basel, Switzerland. This article is an open access article distributed under the terms and conditions of the Creative Commons Attribution (CC BY) license (https://creativecommons.org/licenses/by/4.0/).
Share and Cite
Terada, E.; Isono, T.; Satoh, T.; Yamamoto, T.; Kakuchi, T.; Sato, S. All-Atom Molecular Dynamics Simulations of the Temperature Response of Poly(glycidyl ether)s with Oligooxyethylene Side Chains Terminated with Alkyl Groups. Nanomaterials 2023, 13, 1628. https://0-doi-org.brum.beds.ac.uk/10.3390/nano13101628
Terada E, Isono T, Satoh T, Yamamoto T, Kakuchi T, Sato S. All-Atom Molecular Dynamics Simulations of the Temperature Response of Poly(glycidyl ether)s with Oligooxyethylene Side Chains Terminated with Alkyl Groups. Nanomaterials. 2023; 13(10):1628. https://0-doi-org.brum.beds.ac.uk/10.3390/nano13101628
Chicago/Turabian StyleTerada, Erika, Takuya Isono, Toshifumi Satoh, Takuya Yamamoto, Toyoji Kakuchi, and Shinichiro Sato. 2023. "All-Atom Molecular Dynamics Simulations of the Temperature Response of Poly(glycidyl ether)s with Oligooxyethylene Side Chains Terminated with Alkyl Groups" Nanomaterials 13, no. 10: 1628. https://0-doi-org.brum.beds.ac.uk/10.3390/nano13101628