
Energetic Electron-Assisted Synthesis of Tailored Magnetite (Fe3O4) and Maghemite (γ−Fe2O3) Nanoparticles: Structure and Magnetic Properties

 , , , and
Abstract
:1. Introduction
2. Materials and Methods
2.1. Preparation of the Samples
2.2. Irradiation
2.3. Sample Characterization
2.4. Framework for Evaluating Magnetization Data
3. Results
4. Discussion
5. Conclusions and Outlook
Supplementary Materials
Author Contributions
Funding
Data Availability Statement
Acknowledgments
Conflicts of Interest
Abbreviations
| SEM | Scanning electron microscopy |
| VSM | Vibrating sample magnetometer |
| TEM | Transmission electron microscopy |
| HRTEM | High-resolution transmission electron microscopy |
| SAED | Selective area electron diffraction |
| FFT | Fast Fourier transformations |
| RAM | Random anisotropy model |
| ZFC | Zero-field cooling |
| FC | Field cooling |
References
- Arora, V.; Sood, A.; Shah, J.; Kotnala, R.K.; Jain, T.K. Synthesis and characterization of pectin-6-aminohexanoic acid-magnetite nanoparticles for drug delivery. Mater. Sci. Eng. C 2017, 80, 243–251. [Google Scholar] [CrossRef] [PubMed]
- Hachani, R.; Birchall, M.A.; Lowdell, M.W.; Kasparis, G.; Tung, L.D.; Manshian, B.B.; Soenen, S.J.; Gsell, W.; Himmelreich, U.; Gharagouzloo, C.A.; et al. Assessing cell-nanoparticle interactions by high content imaging of biocompatible iron oxide nanoparticles as potential contrast agents for magnetic resonance imaging. Sci. Rep. 2017, 7, 7850. [Google Scholar] [CrossRef] [PubMed] [Green Version]
- Horst, M.F.; Coral, D.F.; Fernández van Raap, M.B.; Alvarez, M.; Lassalle, V. Hybrid nanomaterials based on gum Arabic and magnetite for hyperthermia treatments. Mater. Sci. Eng. C 2017, 74, 443–450. [Google Scholar] [CrossRef] [PubMed]
- Zrínyi, M.; Barsi, L.; Büki, A. Ferrogel: A new magneto-controlled elastic medium. Polym. Gels Netw. 1997, 5, 415–427. [Google Scholar] [CrossRef]
- Hu, S.; Zhou, Y.; Zhao, Y.; Xu, Y.; Zhang, F.; Gu, N.; Ma, J.; Reynolds, M.A.; Xia, Y.; Xu, H.H. Enhanced bone regeneration and visual monitoring via superparamagnetic iron oxide nanoparticle scaffold in rats. J. Tissue Eng. Regen. Med. 2018, 12, e2085–e2098. [Google Scholar] [CrossRef]
- Blyakhman, F.A.; Makarova, E.B.; Fadeyev, F.A.; Lugovets, D.V.; Safronov, A.P.; Shabadrov, P.A.; Shklyar, T.F.; Melnikov, G.Y.; Orue, I.; Kurlyandskaya, G.V. The Contribution of Magnetic Nanoparticles to Ferrogel Biophysical Properties. Nanomaterials 2019, 9, 232. [Google Scholar] [CrossRef] [Green Version]
- Roduner, E. Size matters: Why nanomaterials are different. Chem. Soc. Rev. 2006, 35, 583–592. [Google Scholar] [CrossRef]
- Burda, C.; Chen, X.; Narayanan, R.; El-Sayed, M.A. Chemistry and Properties of Nanocrystals of Different Shapes. Chem. Rev. 2005, 105, 1025–1102. [Google Scholar] [CrossRef]
- Cornell, R.M.; Schwertmann, U. The Iron Oxides: Structure, Properties, Reactions, Occurrences and Uses; John Wiley & Sons: New York, NY, USA, 2003. [Google Scholar]
- Laurent, S.; Forge, D.; Port, M.; Roch, A.; Robic, C.; Vander Elst, L.; Muller, R.N. Magnetic Iron Oxide Nanoparticles: Synthesis, Stabilization, Vectorization, Physicochemical Characterizations, and Biological Applications. Chem. Rev. 2008, 108, 2064–2110. [Google Scholar] [CrossRef]
- Dunlop, D.J.; Özdemir, Ö. Rock Magnetism: Fundamentals and Frontiers; Cambridge University Press: Cambridge, UK, 2001. [Google Scholar]
- Berry, C.C.; Curtis, A.S.G. Functionalisation of magnetic nanoparticles for applications in biomedicine. J. Phys. D Appl. Phys. 2003, 36, R198–R206. [Google Scholar] [CrossRef]
- Roca, A.G.; Marco, J.F.; Morales, M.d.P.; Serna, C.J. Effect of Nature and Particle Size on Properties of Uniform Magnetite and Maghemite Nanoparticles. J. Phys. Chem. C 2007, 111, 18577–18584. [Google Scholar] [CrossRef]
- Teja, A.S.; Koh, P.Y. Synthesis, properties, and applications of magnetic iron oxide nanoparticles. Prog. Cryst. Growth Charact. Mater. 2009, 55, 22–45. [Google Scholar] [CrossRef]
- Gotić, M.; Jurkin, T.; Musić, S. Factors that may influence the micro-emulsion synthesis of nanosize magnetite particles. Colloid Polym. Sci. 2007, 285, 793–800. [Google Scholar] [CrossRef]
- Gotić, M.; Jurkin, T.; Musić, S. From iron(III) precursor to magnetite and vice versa. Mater. Res. Bull. 2009, 44, 2014–2021. [Google Scholar] [CrossRef]
- Flores-Rojas, G.; López-Saucedo, F.; Bucio, E. Gamma-irradiation applied in the synthesis of metallic and organic nanoparticles: A short review. Radiat. Phys. Chem. 2018, 169, 107962. [Google Scholar] [CrossRef]
- Bellon, P. Nonequilibrium Roughening and Faceting of Interfaces in Driven Alloys. Phys. Rev. Lett. 1998, 81, 4176–4179. [Google Scholar] [CrossRef]
- Belloni, J. Nucleation, growth and properties of nanoclusters studied by radiation chemistry. Catal. Today 2006, 113, 141–156. [Google Scholar] [CrossRef]
- Wisotzki, E.I.; Hennes, M.; Schuldt, C.; Engert, F.; Knolle, W.; Decker, U.; Käs, J.A.; Zink, M.; Mayr, S.G. Tailoring the material properties of gelatin hydrogels by high energy electron irradiation. J. Mater. Chem. B 2014, 2, 4297–4309. [Google Scholar] [CrossRef]
- Jurkin, T.; Pucić, I. Irradiation effects in poly(ethylene oxide)/silica nanocomposite films and gels. Polym. Eng. Sci. 2013, 53, 2318–2327. [Google Scholar] [CrossRef]
- Marinović-Cincović, M.T.; Radosavljević, A.N.; Krstić, J.I.; Spasojević, J.P.; Bibić, N.M.; Mitrić, M.N.; Kačarević-Popović, Z.M. Physico-chemical characteristics of gamma irradiation crosslinked poly(vinyl alcohol)/magnetite ferrogel composite. Hem. Ind. 2014, 68, 743–753. [Google Scholar] [CrossRef] [Green Version]
- Riedel, S.; Hietschold, P.; Krömmelbein, C.; Kunschmann, T.; Konieczny, R.; Knolle, W.; Mierke, C.T.; Zink, M.; Mayr, S.G. Design of biomimetic collagen matrices by reagent-free electron beam induced crosslinking: Structure-property relationships and cellular response. Mater. Des. 2019, 168, 107606. [Google Scholar] [CrossRef]
- Deuflhard, M.; Eberbeck, D.; Hietschold, P.; Wilharm, N.; Mühlberger, M.; Friedrich, R.P.; Alexiou, C.; Mayr, S.G. Magnetically responsive composites: Electron beam assisted magnetic nanoparticle arrest in gelatin hydrogels for bioactuation. Phys. Chem. Chem. Phys. 2019, 21, 14654–14662. [Google Scholar] [CrossRef] [PubMed] [Green Version]
- Jauch, P.; Weidner, A.; Riedel, S.; Wilharm, N.; Dutz, S.; Mayr, S.G. Collagen–iron oxide nanoparticle based ferrogel: Large reversible magnetostrains with potential for bioactuation. Multifunct. Mater. 2020, 3, 035001. [Google Scholar] [CrossRef]
- Marić, I.; Šijaković Vujičić, N.; Pustak, A.; Gotić, M.; Štefanić, G.; Grenèche, J.M.; Dražić, G.; Jurkin, T. Rheological, Microstructural and Thermal Properties of Magnetic Poly(Ethylene Oxide)/Iron Oxide Nanocomposite Hydrogels Synthesized Using a One-Step Gamma-Irradiation Method. Nanomaterials 2020, 10, 1823. [Google Scholar] [CrossRef] [PubMed]
- Yang, X.H.; Wu, Q.S.; Li, L.; Ding, Y.P.; Zhang, G.X. Controlled synthesis of the semiconductor CdS quasi-nanospheres, nanoshuttles, nanowires and nanotubes by the reverse micelle systems with different surfactants. Colloids Surf. A Physicochem. Eng. Asp. 2005, 264, 172–178. [Google Scholar] [CrossRef]
- Bean, C.P.; Livingston, J.D. Superparamagnetism. J. Appl. Phys. 1959, 30, S120–S129. [Google Scholar] [CrossRef]
- Chen, D.X.; Sanchez, A.; Taboada, E.; Roig, A.; Sun, N.; Gu, H.C. Size determination of superparamagnetic nanoparticles from magnetization curve. J. Appl. Phys. 2009, 105, 083924. [Google Scholar] [CrossRef]
- El-Hilo, M. Nano-particle magnetism with a dispersion of particle sizes. J. Appl. Phys. 2012, 112, 103915. [Google Scholar] [CrossRef]
- Livesey, K.L.; Ruta, S.; Anderson, N.R.; Baldomir, D.; Chantrell, R.W.; Serantes, D. Beyond the blocking model to fit nanoparticle ZFC/FC magnetisation curves. Sci. Rep. 2018, 8, 11166. [Google Scholar] [CrossRef] [Green Version]
- Shtrikman, S.; Wohlfarth, E. The theory of the Vogel-Fulcher law of spin glasses. Phys. Lett. A 1981, 85, 467–470. [Google Scholar] [CrossRef]
- Knobel, M.; Nunes, W.C.; Winnischofer, H.; Rocha, T.C.R.; Socolovsky, L.M.; Mayorga, C.L.; Zanchet, D. Effects of magnetic interparticle coupling on the blocking temperature of ferromagnetic nanoparticle arrays. J. Non-Cryst. Solids 2007, 353, 743–747. [Google Scholar] [CrossRef]
- Muscas, G.; Concas, G.; Laureti, S.; Testa, A.M.; Mathieu, R.; Toro, J.A.D.; Cannas, C.; Musinu, A.; Novak, M.A.; Sangregorio, C.; et al. The interplay between single particle anisotropy and interparticle interactions in ensembles of magnetic nanoparticles. Phys. Chem. Chem. Phys. 2018, 20, 28634–28643. [Google Scholar] [CrossRef] [PubMed] [Green Version]
- Victora, R.H. Predicted time dependence of the switching field for magnetic materials. Phys. Rev. Lett. 1989, 63, 457–460. [Google Scholar] [CrossRef] [PubMed]
- Löffler, J.F.; Braun, H.B.; Wagner, W. Magnetic Correlations in Nanostructured Ferromagnets. Phys. Rev. Lett. 2000, 85, 1990–1993. [Google Scholar] [CrossRef] [PubMed]
- Nunes, W.C.; Socolovsky, L.M.; Denardin, J.C.; Cebollada, F.; Brandl, A.L.; Knobel, M. Role of magnetic interparticle coupling on the field dependence of the superparamagnetic relaxation time. Phys. Rev. B 2005, 72, 212413. [Google Scholar] [CrossRef] [Green Version]
- Mamiya, H.; Fukumoto, H.; Cuya Huaman, J.L.; Suzuki, K.; Miyamura, H.; Balachandran, J. Estimation of Magnetic Anisotropy of Individual Magnetite Nanoparticles for Magnetic Hyperthermia. ACS Nano 2020, 14, 8421–8432. [Google Scholar] [CrossRef]
- Micha, J.; Dieny, B.; Régnard, J.; Jacquot, J.; Sort, J. Estimation of the Co nanoparticles size by magnetic measurements in Co/SiO2 discontinuous multilayers. J. Magn. Magn. Mater. 2004, 272, E967–E968. [Google Scholar] [CrossRef]
- Bruvera, I.J.; Mendoza Zélis, P.; Pilar Calatayud, M.; Goya, G.F.; Sánchez, F.H. Determination of the blocking temperature of magnetic nanoparticles: The good, the bad, and the ugly. J. Appl. Phys. 2015, 118, 184304. [Google Scholar] [CrossRef]
- Downs, R.T.; Hall-Wallace, M. The American Mineralogist crystal structure database. Am. Mineral. 2003, 88, 247–250. [Google Scholar]
- Allan, J.E.M.; Coey, J.M.D.; Resende, M.; Fabris, J.D. Magnetic properties of iron-rich oxisols. Phys. Chem. Miner. 1988, 15, 470–475. [Google Scholar] [CrossRef]
- Rosensweig, R. Heating magnetic fluid with alternating magnetic field. J. Magn. Magn. Mater. 2002, 252, 370–374. [Google Scholar] [CrossRef]
- Ferguson, R.M.; Minard, K.R.; Khandhar, A.P.; Krishnan, K.M. Optimizing magnetite nanoparticles for mass sensitivity in magnetic particle imaging. Med. Phys. 2011, 38, 1619–1626. [Google Scholar] [CrossRef] [PubMed] [Green Version]
- Jolivet, J.P. Influence of Fe(II) on the Formation of the Spinel Iron Oxide in Alkaline Medium. Clays Clay Miner. 1992, 40, 531–539. [Google Scholar] [CrossRef]
- Babes, L.; Denizot, B.; Tanguy, G.; Le Jeune, J.J.; Jallet, P. Synthesis of Iron Oxide Nanoparticles Used as MRI Contrast Agents: A Parametric Study. J. Colloid Interface Sci. 1999, 212, 474–482. [Google Scholar] [CrossRef] [PubMed]
- Usman, M.; Abdelmoula, M.; Faure, P.; Ruby, C.; Hanna, K. Transformation of various kinds of goethite into magnetite: Effect of chemical and surface properties. Geoderma 2013, 197, 9–16. [Google Scholar] [CrossRef]
- Abedini, A.; Daud, A.R.; Abdul Hamid, M.A.; Kamil Othman, N. Radiolytic Formation of Fe3O4 Nanoparticles: Influence of Radiation Dose on Structure and Magnetic Properties. PLoS ONE 2014, 9, e90055. [Google Scholar] [CrossRef]
- Guardia, P.; Labarta, A.; Batlle, X. Tuning the Size, the Shape, and the Magnetic Properties of Iron Oxide Nanoparticles. J. Phys. Chem. C 2011, 115, 390–396. [Google Scholar] [CrossRef]
- Dar, M.I.; Shivashankar, S.A. Single crystalline magnetite, maghemite, and hematite nanoparticles with rich coercivity. RSC Adv. 2014, 4, 4105–4113. [Google Scholar] [CrossRef]
- Hufschmid, R.; Arami, H.; Ferguson, R.M.; Gonzales, M.; Teeman, E.; Brush, L.N.; Browning, N.D.; Krishnan, K.M. Synthesis of phase-pure and monodisperse iron oxide nanoparticles by thermal decomposition. Nanoscale 2015, 7, 11142–11154. [Google Scholar] [CrossRef] [Green Version]
- Grau-Crespo, R.; Al-Baitai, A.Y.; Saadoune, I.; Leeuw, N.H.D. Vacancy ordering and electronic structure of γ-Fe2O3(maghemite): A theoretical investigation. J. Phys. Condens. Matter 2010, 22, 255401. [Google Scholar] [CrossRef] [Green Version]
- Ozkaya, T.; Toprak, M.S.; Baykal, A.; Kavas, H.; Köseoğlu, Y.; Aktaş, B. Synthesis of Fe3O4 nanoparticles at 100 °C and its magnetic characterization. J. Alloys Compd. 2009, 472, 18–23. [Google Scholar] [CrossRef]
- Waychunas, G.A. Chapter 2. Crystal Chemistry of Oxides and Oxyhydroxides. In Oxide Minerals; De Gruyter: Berlin, Germany, 2018; pp. 11–68. [Google Scholar] [CrossRef]
- Santoyo Salazar, J.; Perez, L.; de Abril, O.; Truong Phuoc, L.; Ihiawakrim, D.; Vazquez, M.; Greneche, J.M.; Begin-Colin, S.; Pourroy, G. Magnetic Iron Oxide Nanoparticles in 10–40 nm Range: Composition in Terms of Magnetite/Maghemite Ratio and Effect on the Magnetic Properties. Chem. Mater. 2011, 23, 1379–1386. [Google Scholar] [CrossRef]
- Hah, H.; Gray, S.; Johnson, C.; Johnson, J.; Kolesnichenko, V.; Kucheryavy, P.; Goloverda, G. Mössbauer spectroscopy of superparamagnetic Fe3O4 nanoparticles. J. Magn. Magn. Mater. 2021, 539, 168382. [Google Scholar] [CrossRef]
- Frison, R.; Cernuto, G.; Cervellino, A.; Zaharko, O.; Colonna, G.M.; Guagliardi, A.; Masciocchi, N. Magnetite–Maghemite Nanoparticles in the 5–15 nm Range: Correlating the Core–Shell Composition and the Surface Structure to the Magnetic Properties. A Total Scattering Study. Chem. Mater. 2013, 25, 4820–4827. [Google Scholar] [CrossRef]
- Kim, W.; Suh, C.Y.; Cho, S.W.; Roh, K.M.; Kwon, H.; Song, K.; Shon, I.J. A new method for the identification and quantification of magnetite–maghemite mixture using conventional X-ray diffraction technique. Talanta 2012, 94, 348–352. [Google Scholar] [CrossRef]
- Ter-Oganessian, N.V.; Guda, A.A.; Sakhnenko, V.P. Linear magnetoelectric effect in göthite, α-FeOOH. Sci. Rep. 2017, 7, 16410. [Google Scholar] [CrossRef] [Green Version]
- Smolensky, E.D.; Park, H.Y.E.; Zhou, Y.; Rolla, G.A.; Marjańska, M.; Botta, M.; Pierre, V.C. Scaling Laws at the Nano Size: The Effect of Particle Size and Shape on the Magnetism and Relaxivity of Iron Oxide Nanoparticle Contrast Agents. J. Mater. Chem. B Mater. Biol. Med. 2013, 1, 2818–2828. [Google Scholar] [CrossRef] [Green Version]
- Carvell, J.; Ayieta, E.; Gavrin, A.; Cheng, R.; Shah, V.R.; Sokol, P. Magnetic properties of iron nanoparticle. J. Appl. Phys. 2010, 107, 103913. [Google Scholar] [CrossRef]
- Ge, J.; Hu, Y.; Biasini, M.; Beyermann, W.P.; Yin, Y. Superparamagnetic Magnetite Colloidal Nanocrystal Clusters. Angew. Chem. Int. Ed. 2007, 46, 4342–4345. [Google Scholar] [CrossRef]
- Ge, J.; Hu, Y.; Yin, Y. Highly Tunable Superparamagnetic Colloidal Photonic Crystals. Angew. Chem. 2007, 119, 7572–7575. [Google Scholar] [CrossRef]
- Yoon, S. Determination of the Temperature Dependence of the Magnetic Anisotropy Constant in Magnetite Nanoparticles. J. Korean Phys. Soc. 2011, 59, 3069–3073. [Google Scholar] [CrossRef]
- Abedini, A.; Daud, A.R.; Abdul Hamid, M.A.; Kamil Othman, N.; Saion, E. A review on radiation-induced nucleation and growth of colloidal metallic nanoparticles. Nanoscale Res. Lett. 2013, 8, 474. [Google Scholar] [CrossRef] [Green Version]
- Zhang, S.J.; Yu, H.Q. Radiation-induced degradation of polyvinyl alcohol in aqueous solutions. Water Res. 2004, 38, 309–316. [Google Scholar] [CrossRef]
- Tronc, E.; Belleville, P.; Jolivet, J.P.; Livage, J. Transformation of ferric hydroxide into spinel by iron(II) adsorption. Langmuir 1992, 8, 313–319. [Google Scholar] [CrossRef]
- Seino, S.; Kinoshita, T.; Nakagawa, T.; Kojima, T.; Taniguci, R.; Okuda, S.; Yamamoto, T.A. Radiation induced synthesis of gold/iron-oxide composite nanoparticles using high-energy electron beam. J. Nanoparticle Res. 2008, 10, 1071–1076. [Google Scholar] [CrossRef]


| Irradiation Dose (kGy) | Cluster Size (nm) | Saturation Magnetization (Am/kg) | Particle Size from Equation (4) (nm) | Particle Size from TEM (nm) |
|---|---|---|---|---|
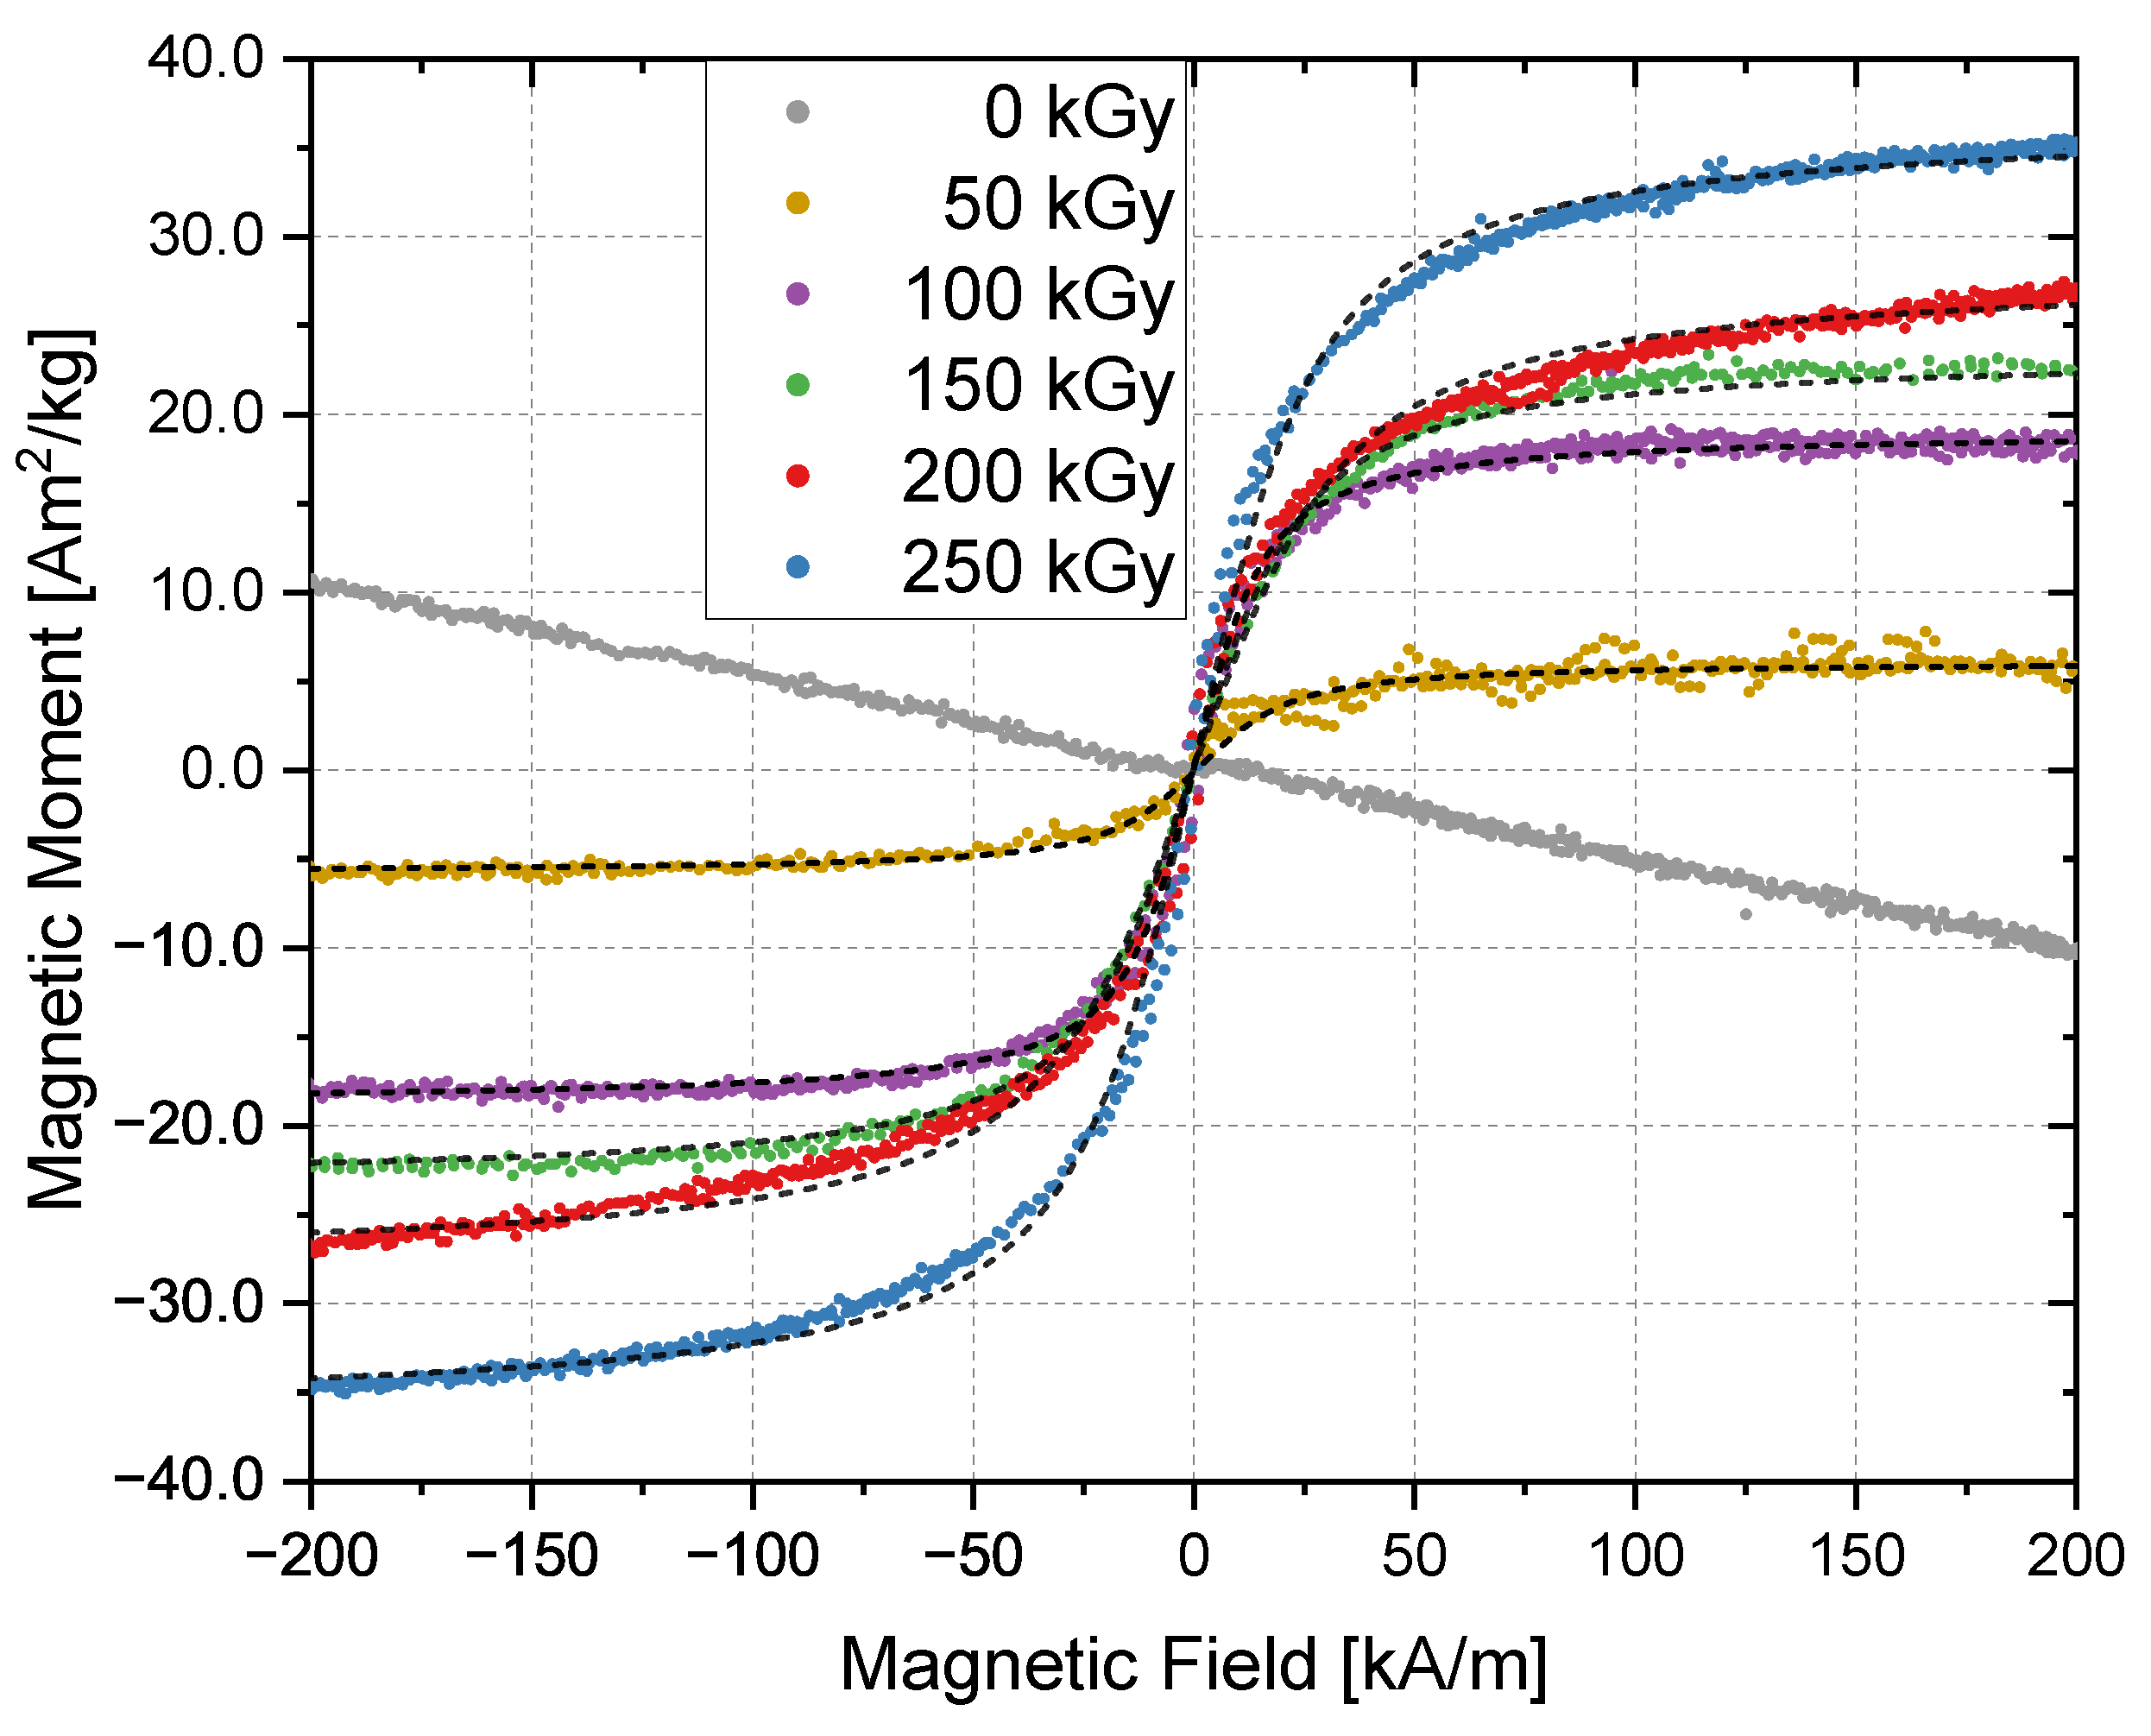
| 50 | - | 6 | 5.4 ± 0.3 | 4.8 ± 0.5 |
| 100 | - | 18 | 5.9 ± 0.4 | 5.4 ± 0.7 |
| 150 | 37 ± 7 | 23 | 5.1 ± 0.3 | 4.7 ± 0.8 |
| 200 | 52 ± 9 | 28 | 4.6 ± 0.3 | 5.0 ± 0.6 |
| 250 | 87 ± 16 | 36 | 4.9 ± 0.4 | 4.9 ± 0.8 |
| Irradiation Dose (kGy) | by Log-Normal Distribution (K) | by Normal Distribution (K) | by 50% Maximum of Integral (K) | K (kJ/m3) |
|---|---|---|---|---|
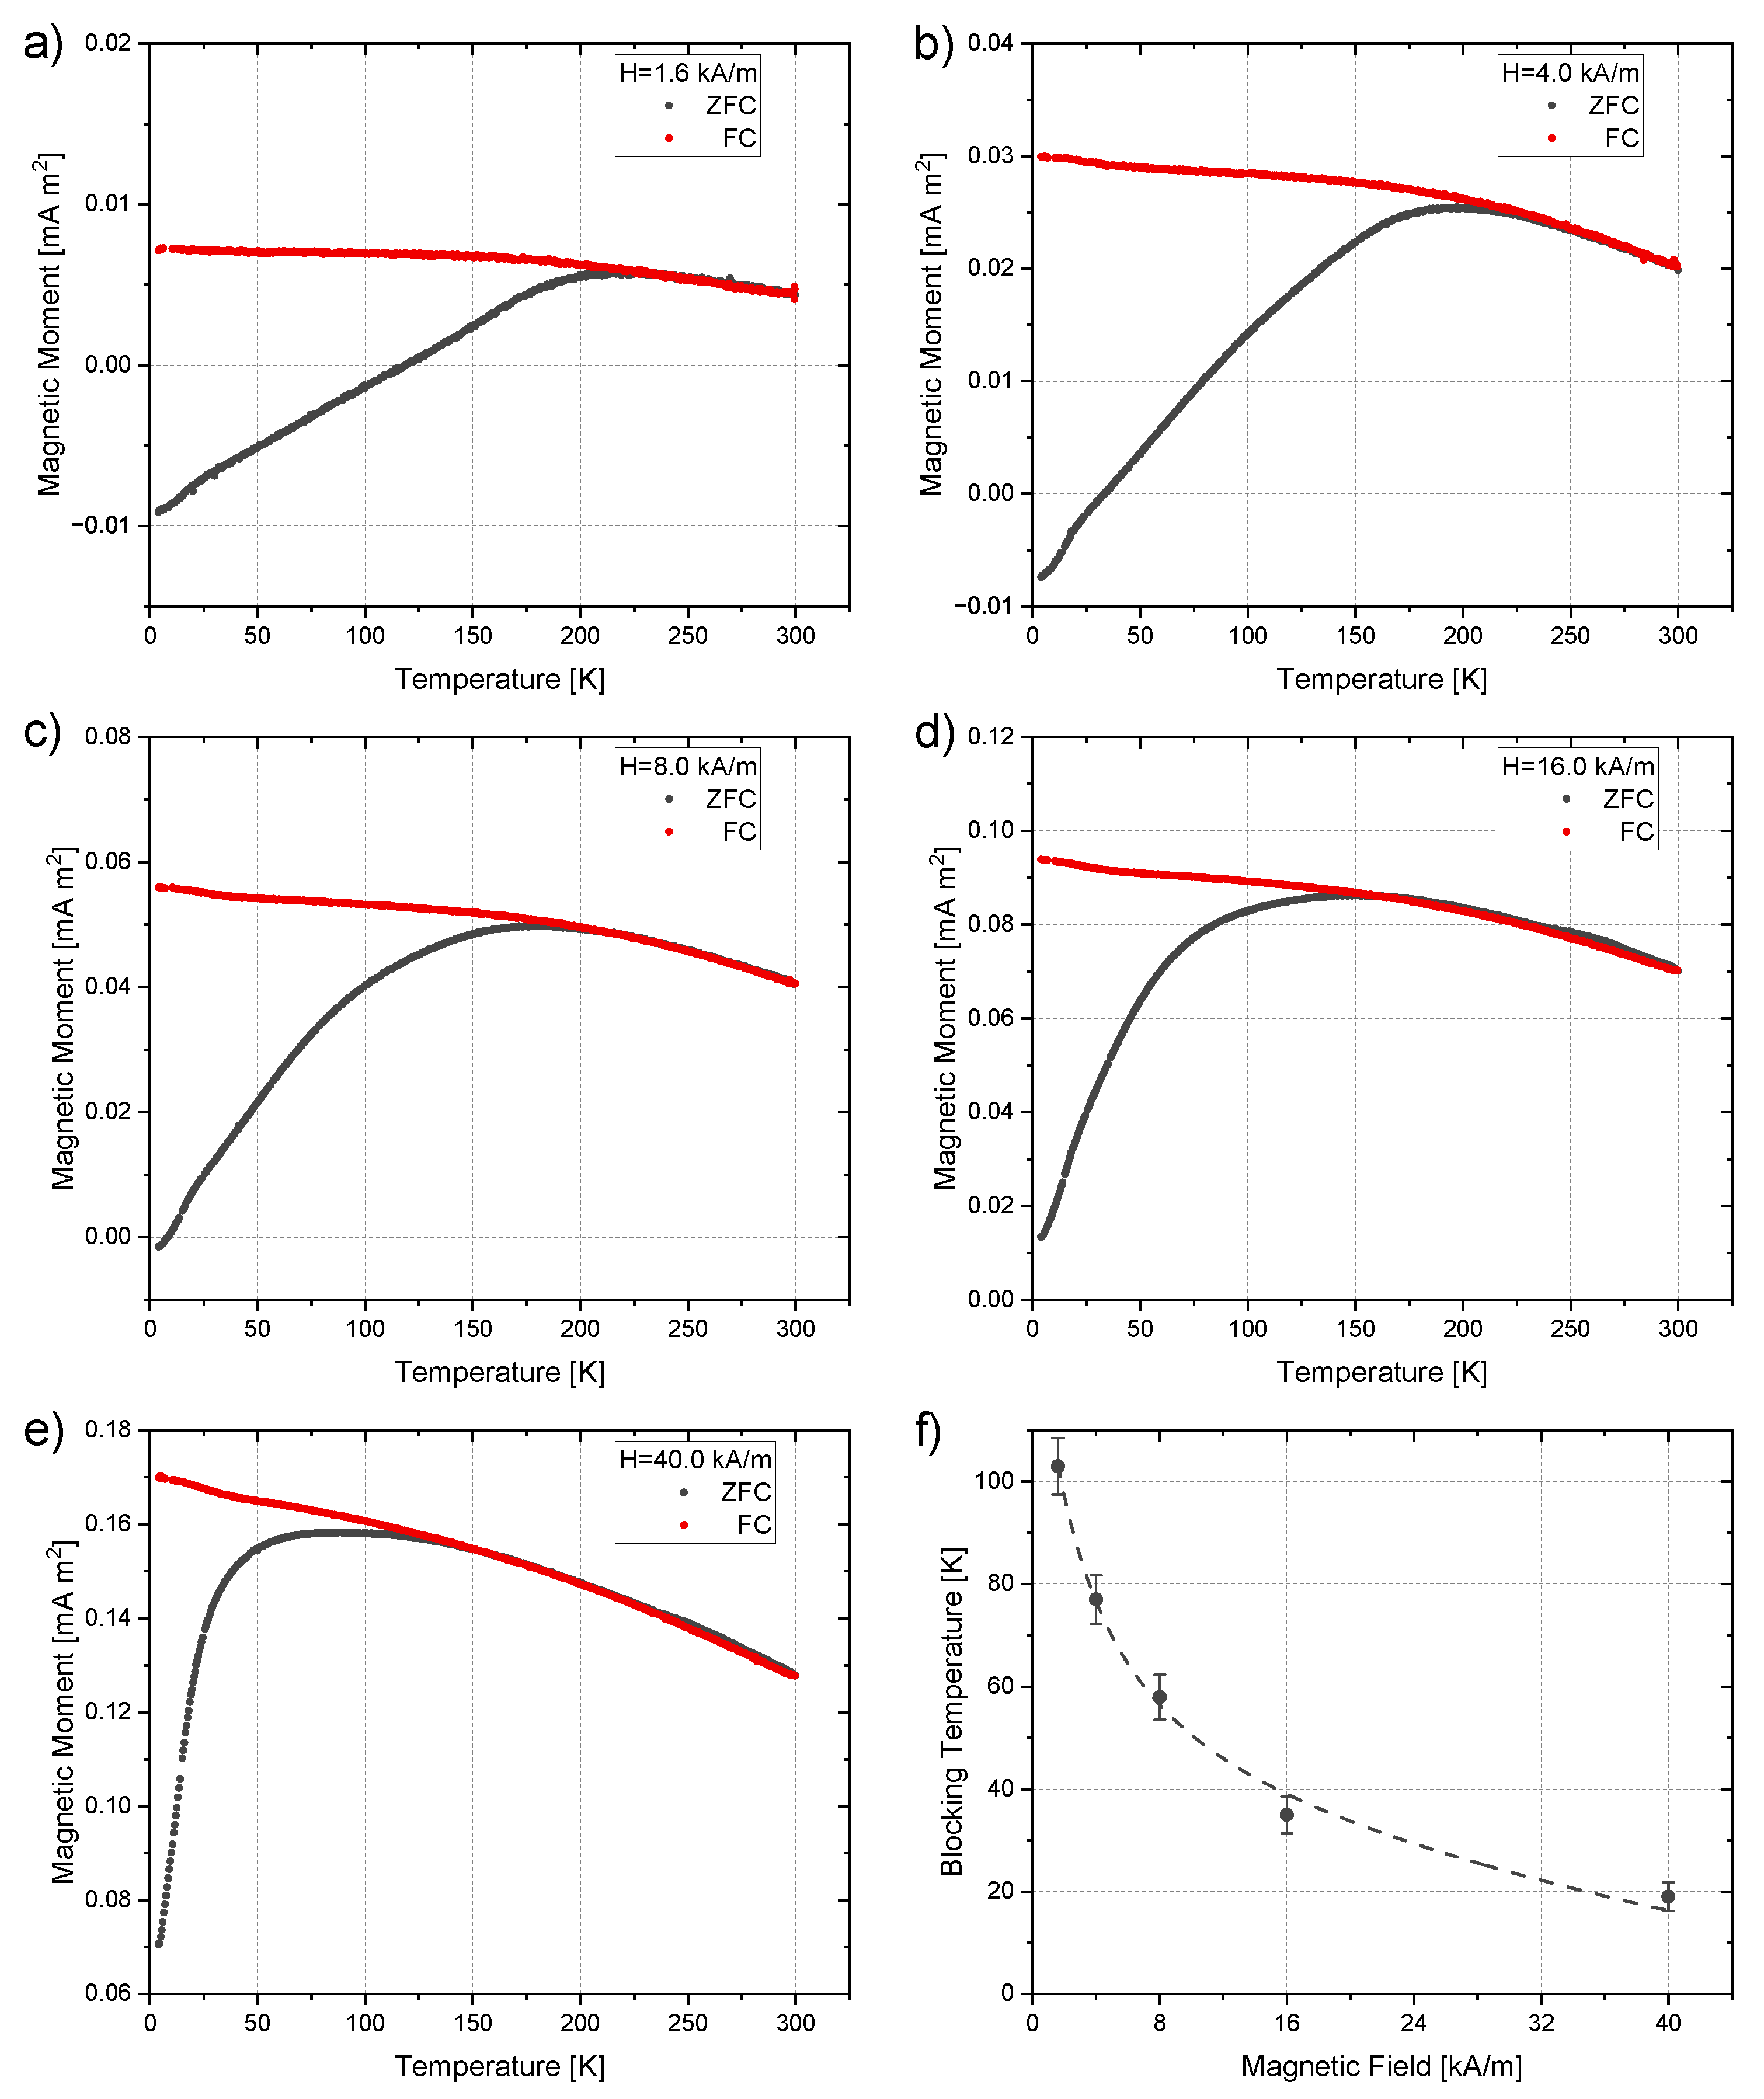
| 50 | 10.3 ± 0.3 | 8.9 ± 0.2 | 9.9 ± 0.3 | 17.9 ± 0.2 |
| 100 | 17.7 ± 0.4 | 11.5 ± 0.2 | 14.4 ± 0.3 | 18.1 ± 0.2 |
| 150 | 22.8 ± 1.8 | 11.6 ± 0.4 | 16.7 ± 0.4 | 22.4 ± 0.7 |
| 200 | 20.8 ± 0.9 | 12.8 ± 0.3 | 17.6 ± 0.4 | 21.2 ± 1.7 |
| 250 | 18.3 ± 2.8 | 8.1 ± 0.9 | 14.3 ± 0.3 | 20.0 ± 2.1 |
Disclaimer/Publisher’s Note: The statements, opinions and data contained in all publications are solely those of the individual author(s) and contributor(s) and not of MDPI and/or the editor(s). MDPI and/or the editor(s) disclaim responsibility for any injury to people or property resulting from any ideas, methods, instructions or products referred to in the content. |
© 2023 by the authors. Licensee MDPI, Basel, Switzerland. This article is an open access article distributed under the terms and conditions of the Creative Commons Attribution (CC BY) license (https://creativecommons.org/licenses/by/4.0/).
Share and Cite
Dietrich, J.; Enke, A.; Wilharm, N.; Konieczny, R.; Lotnyk, A.; Anders, A.; Mayr, S.G. Energetic Electron-Assisted Synthesis of Tailored Magnetite (Fe3O4) and Maghemite (γ−Fe2O3) Nanoparticles: Structure and Magnetic Properties. Nanomaterials 2023, 13, 786. https://0-doi-org.brum.beds.ac.uk/10.3390/nano13050786
Dietrich J, Enke A, Wilharm N, Konieczny R, Lotnyk A, Anders A, Mayr SG. Energetic Electron-Assisted Synthesis of Tailored Magnetite (Fe3O4) and Maghemite (γ−Fe2O3) Nanoparticles: Structure and Magnetic Properties. Nanomaterials. 2023; 13(5):786. https://0-doi-org.brum.beds.ac.uk/10.3390/nano13050786
Chicago/Turabian StyleDietrich, Johannes, Alexius Enke, Nils Wilharm, Robert Konieczny, Andriy Lotnyk, André Anders, and Stefan G. Mayr. 2023. "Energetic Electron-Assisted Synthesis of Tailored Magnetite (Fe3O4) and Maghemite (γ−Fe2O3) Nanoparticles: Structure and Magnetic Properties" Nanomaterials 13, no. 5: 786. https://0-doi-org.brum.beds.ac.uk/10.3390/nano13050786