Polyfluorene-Based Multicolor Fluorescent Nanoparticles Activated by Temperature for Bioimaging and Drug Delivery

 ,
,  ,
,
Abstract
:1. Introduction
2. Materials and Methods
2.1. Materials
2.2. Methods
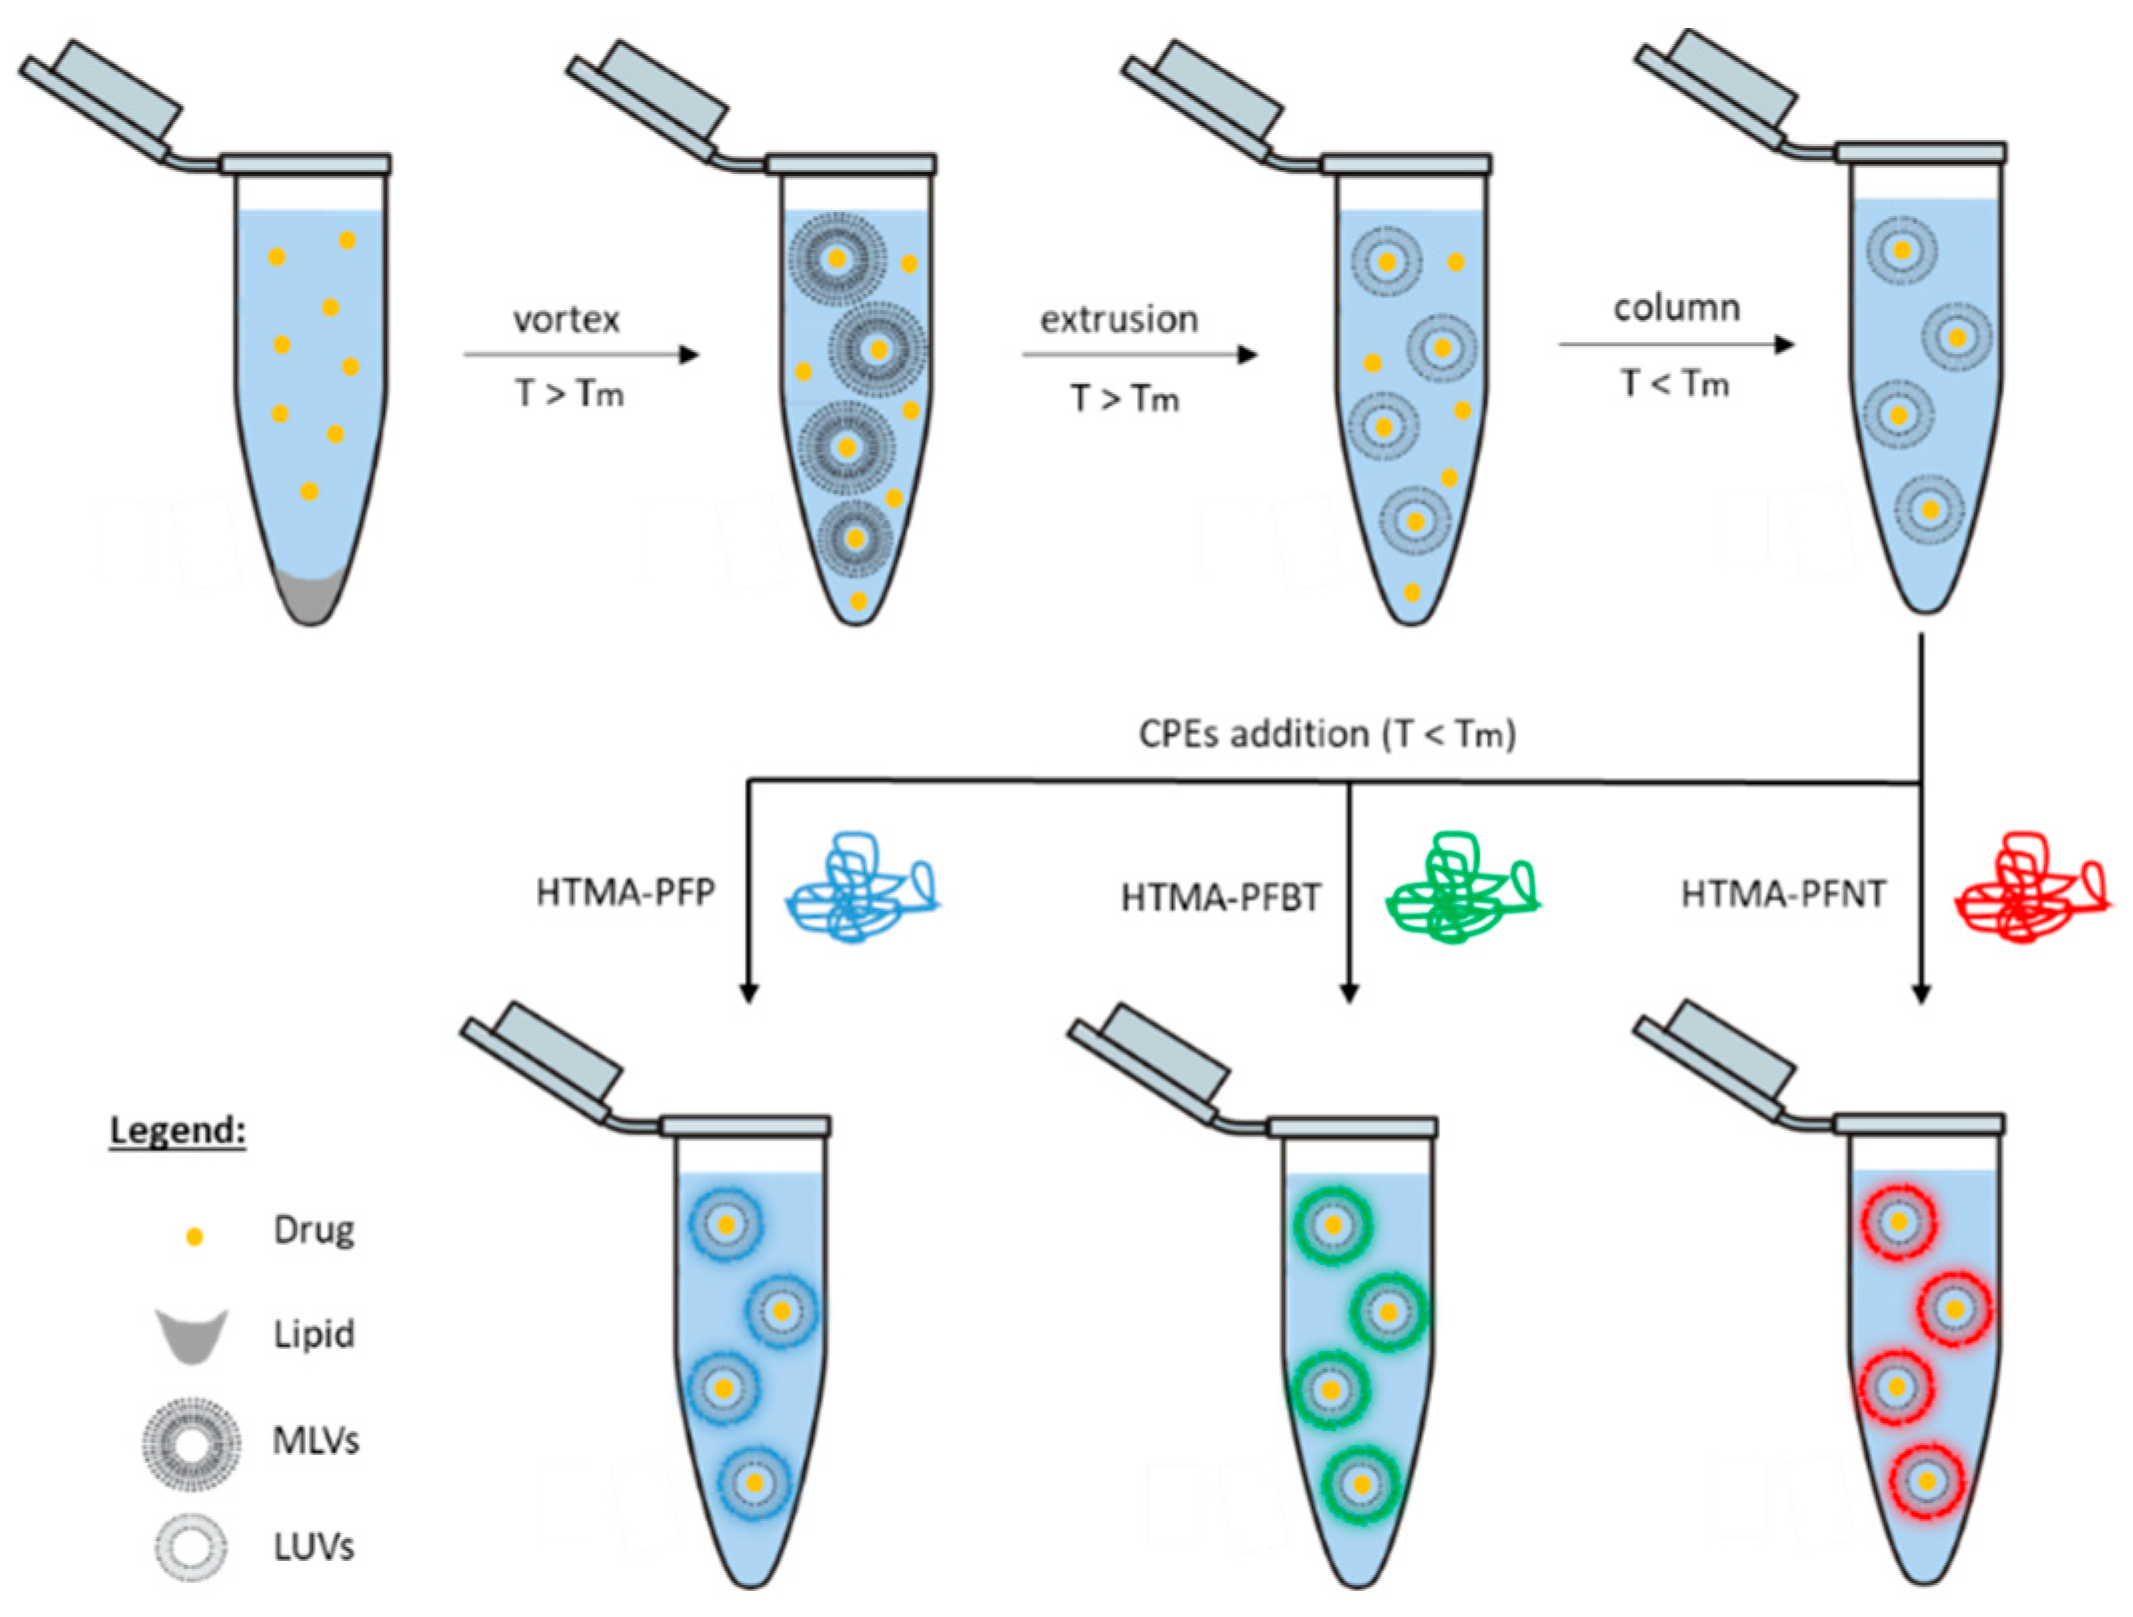
2.2.1. Preparation of Thermosensitive Liposomes (TSLs)
2.2.2. Preparation of Multicolor Fluorescent Nanoparticles
2.2.3. Drug Encapsulation and Release Assays
2.2.4. Particle Size and Zeta Potential
2.2.5. Fluorescence Experiments
2.2.6. Anisotropy Experiments
2.2.7. Partition Coefficient Experiments
2.2.8. Fluorescence Quenching Experiments
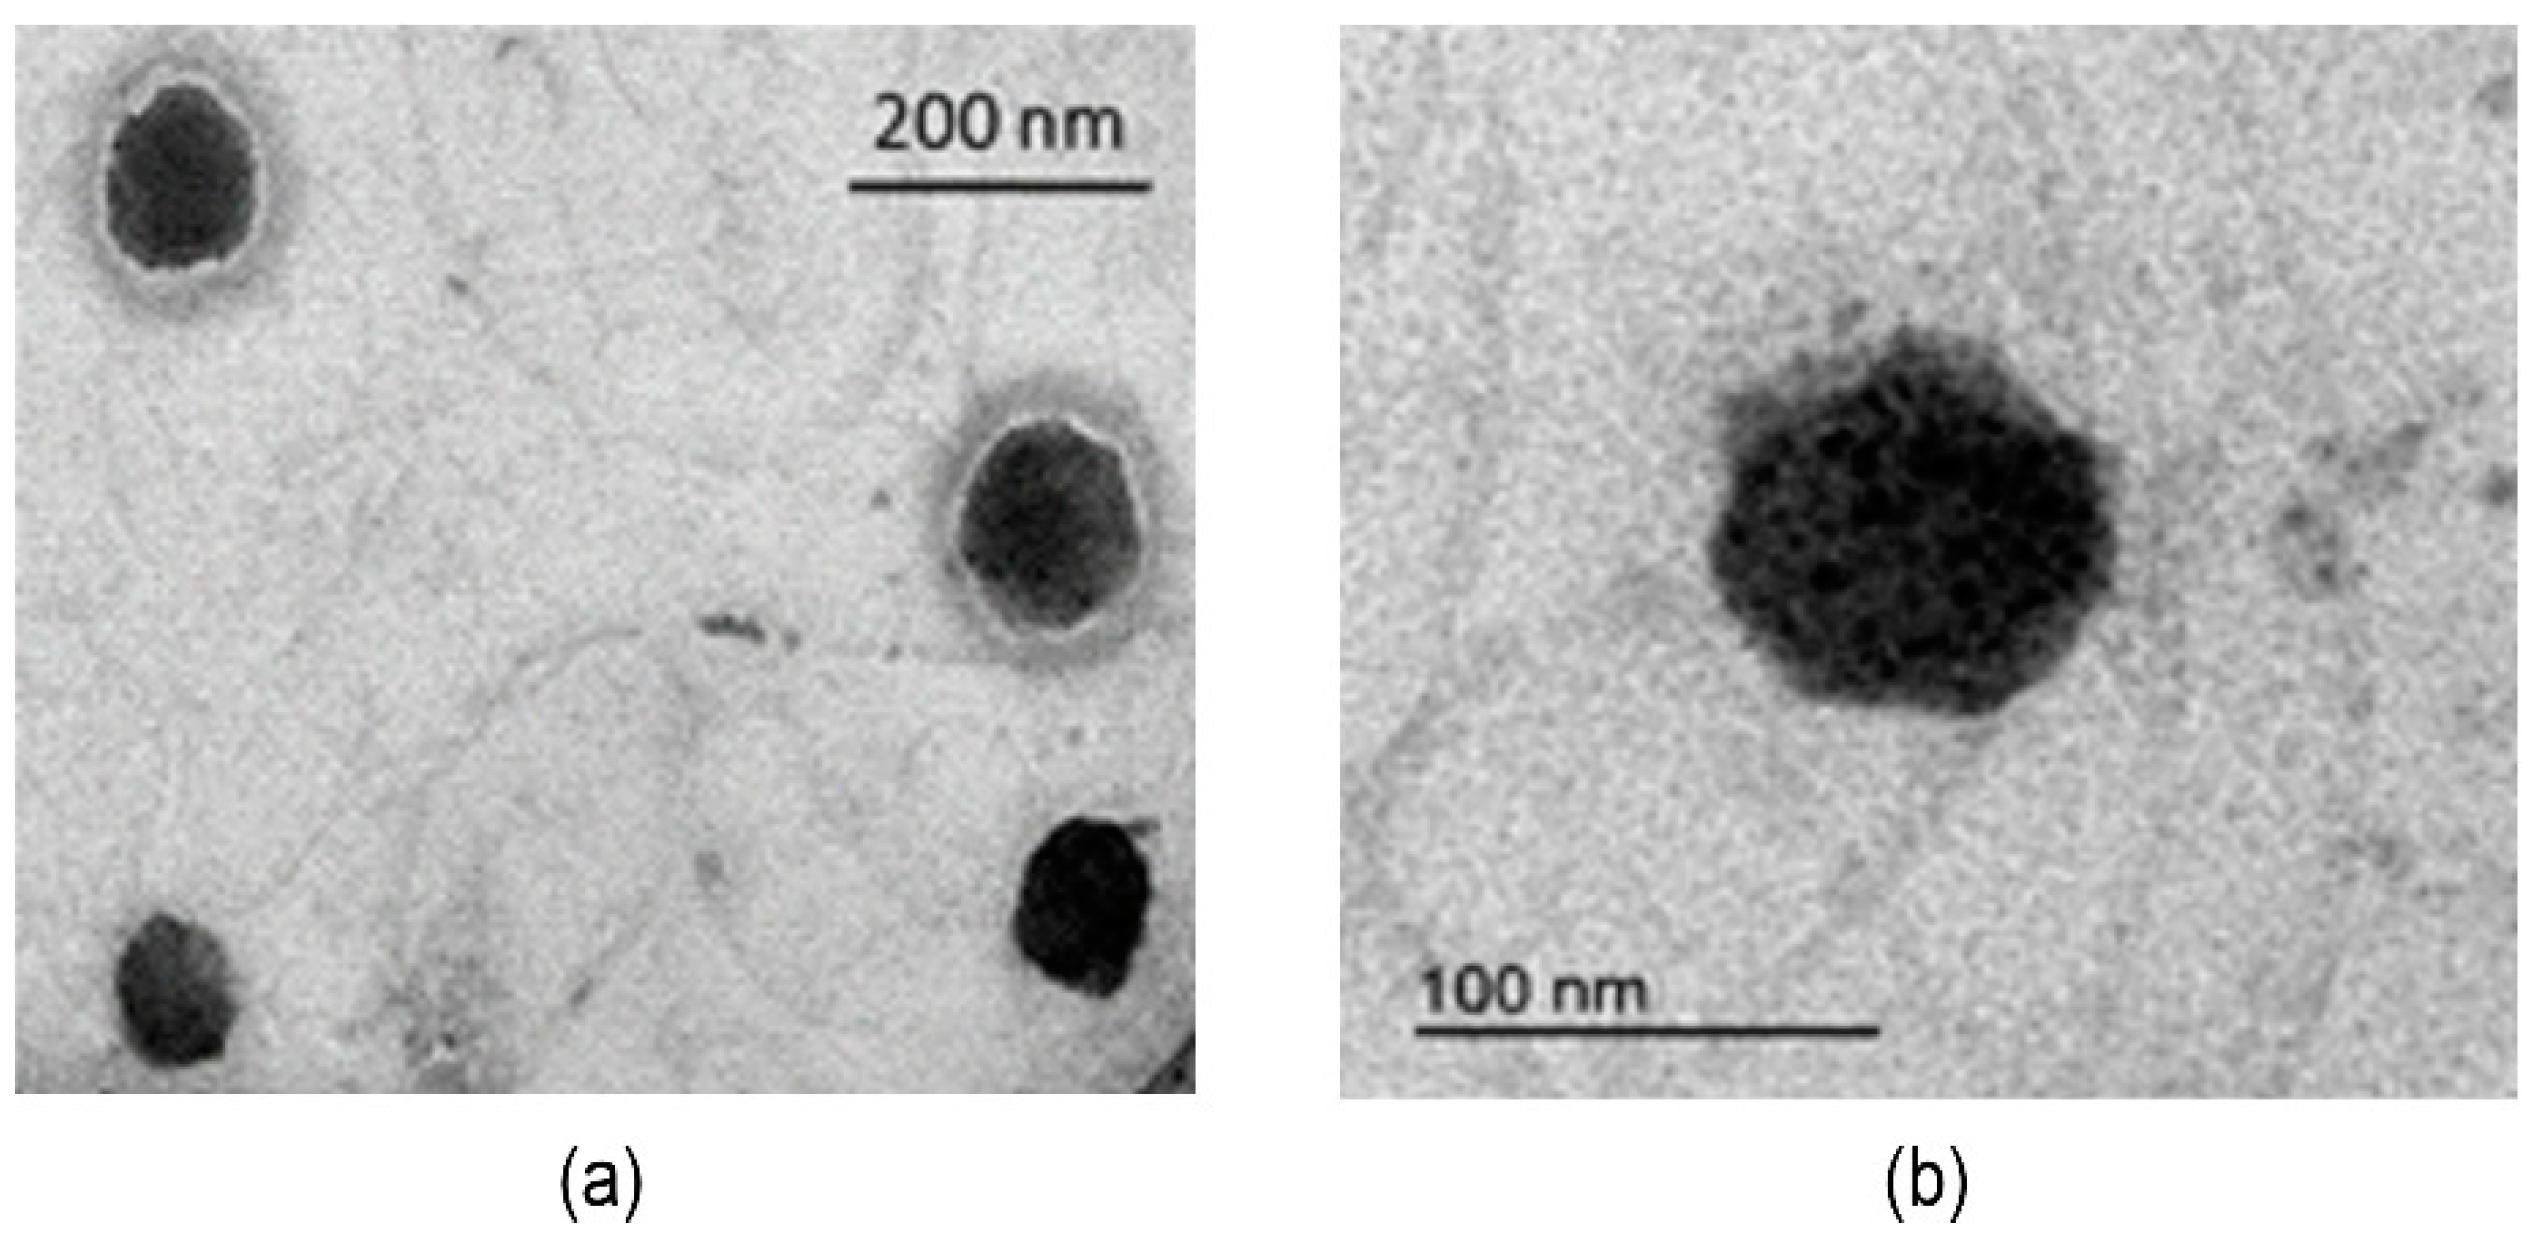
2.2.9. Morphological Observation
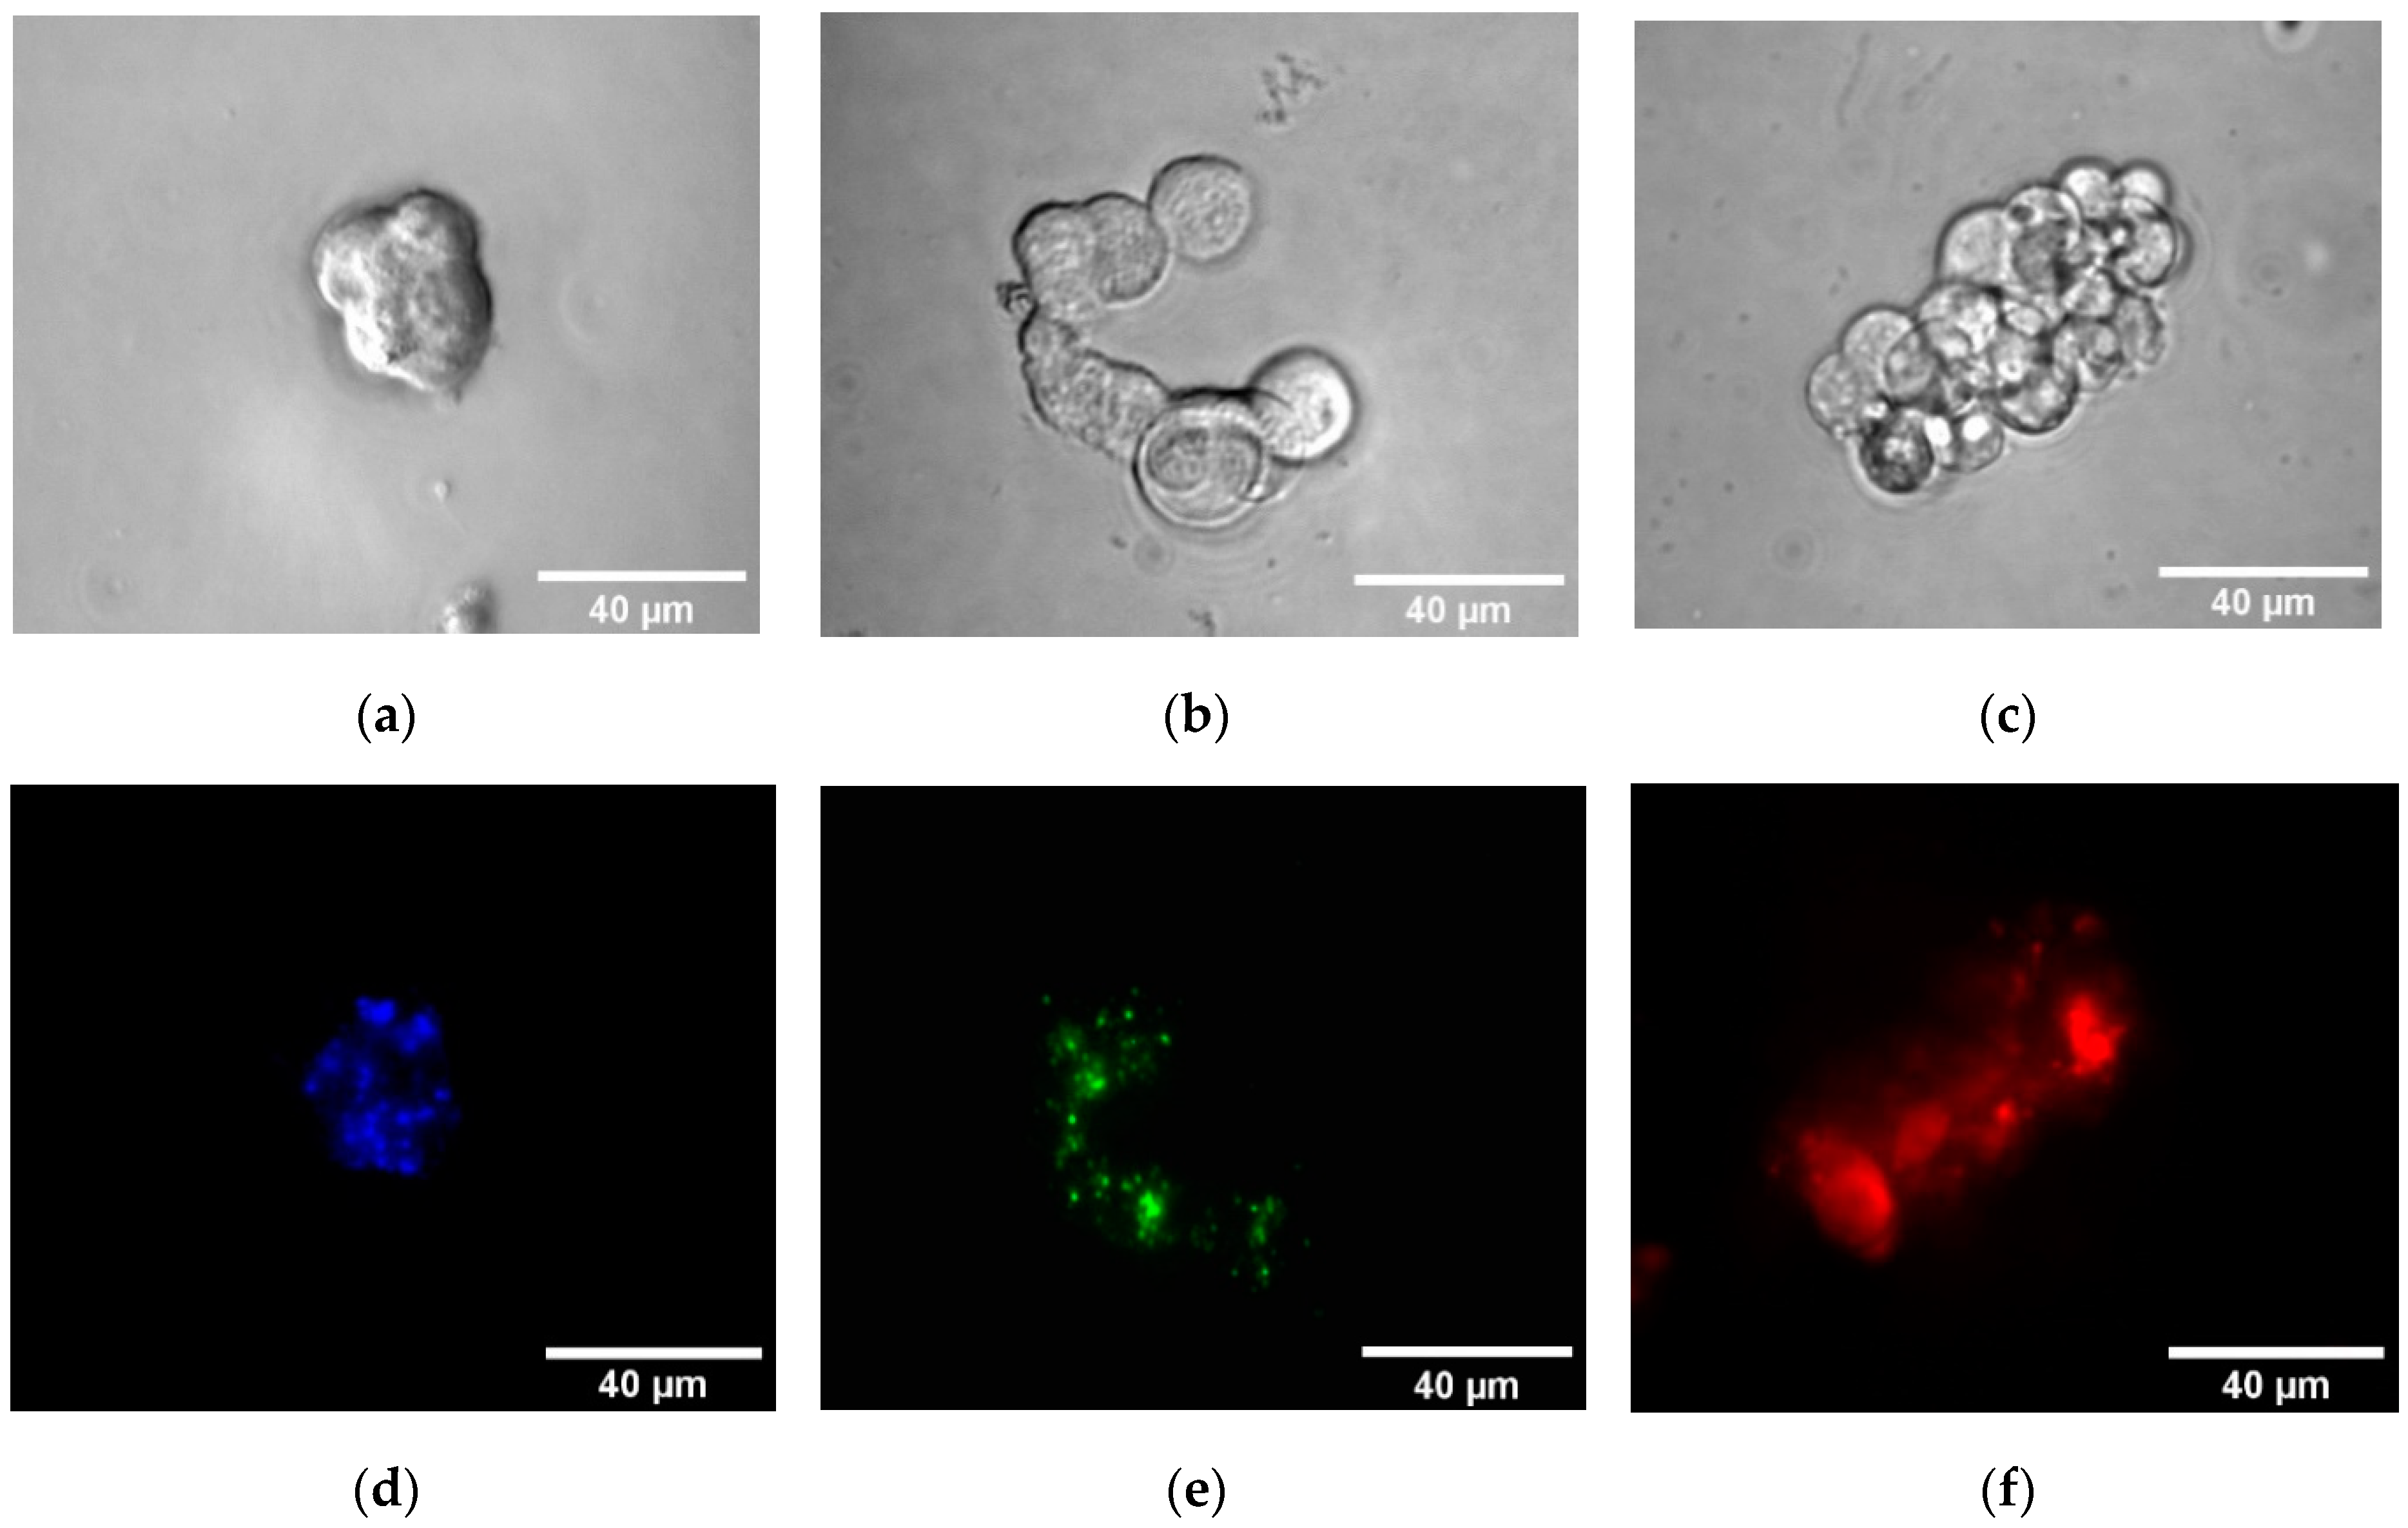
2.2.10. Cell Imaging Experiments
3. Results
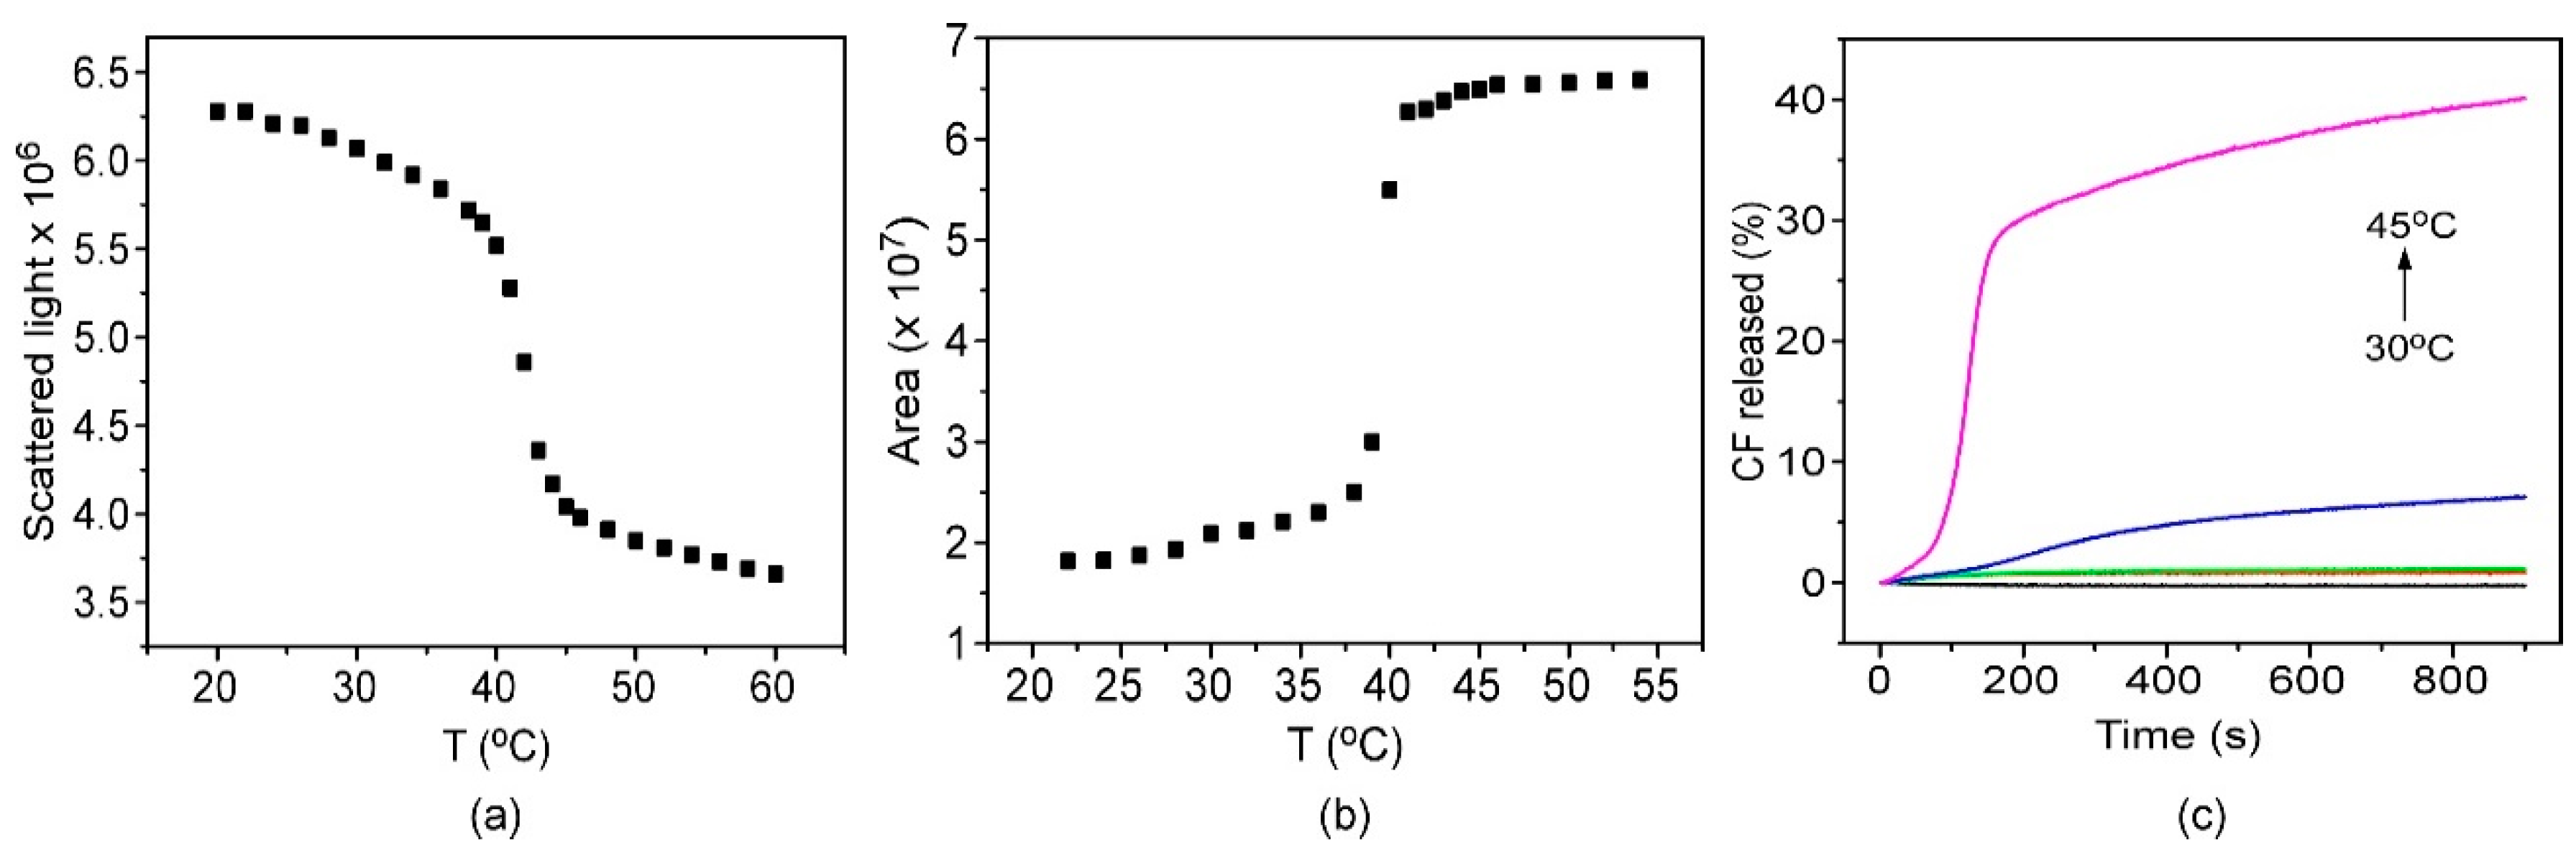
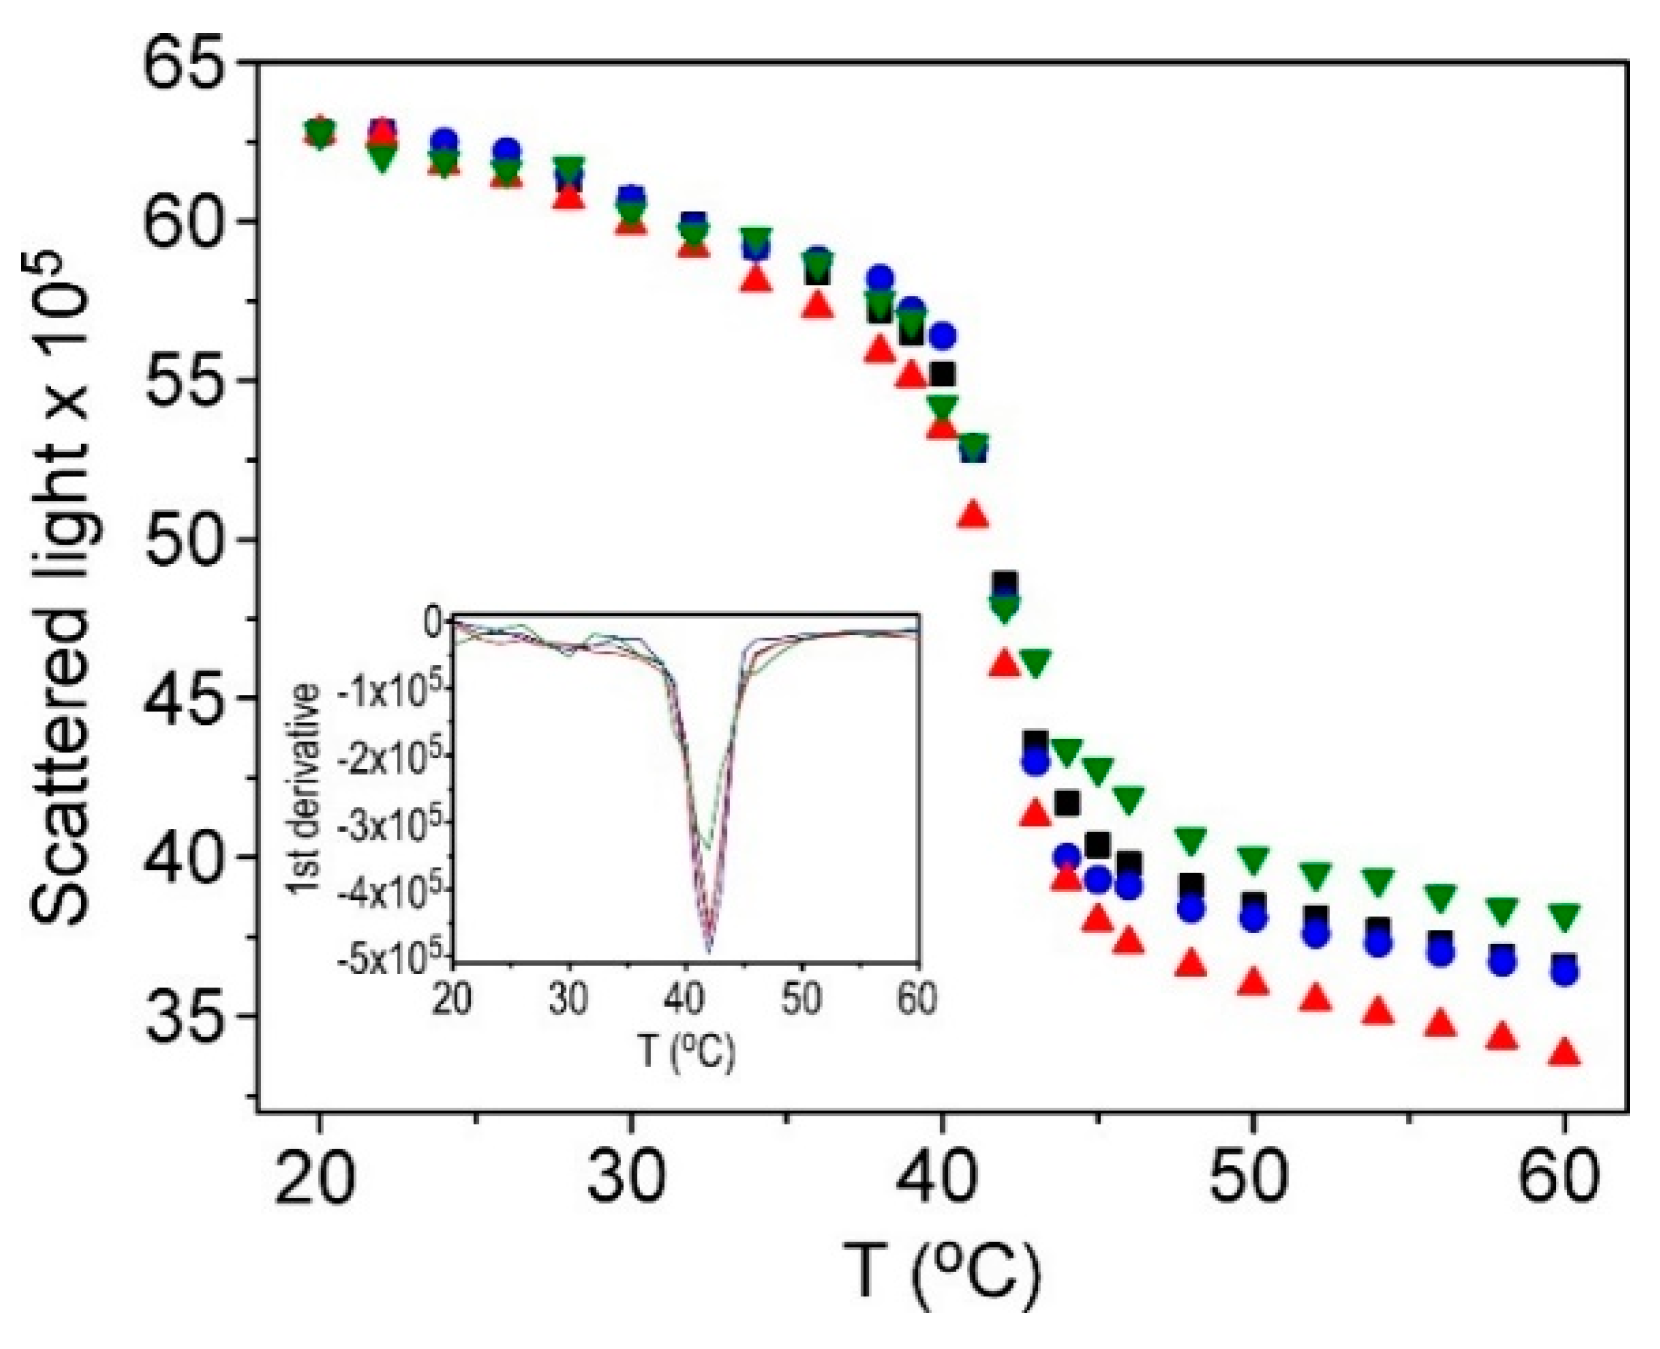
3.1. Characterization of Thermosensitive Liposomes (TSLs)
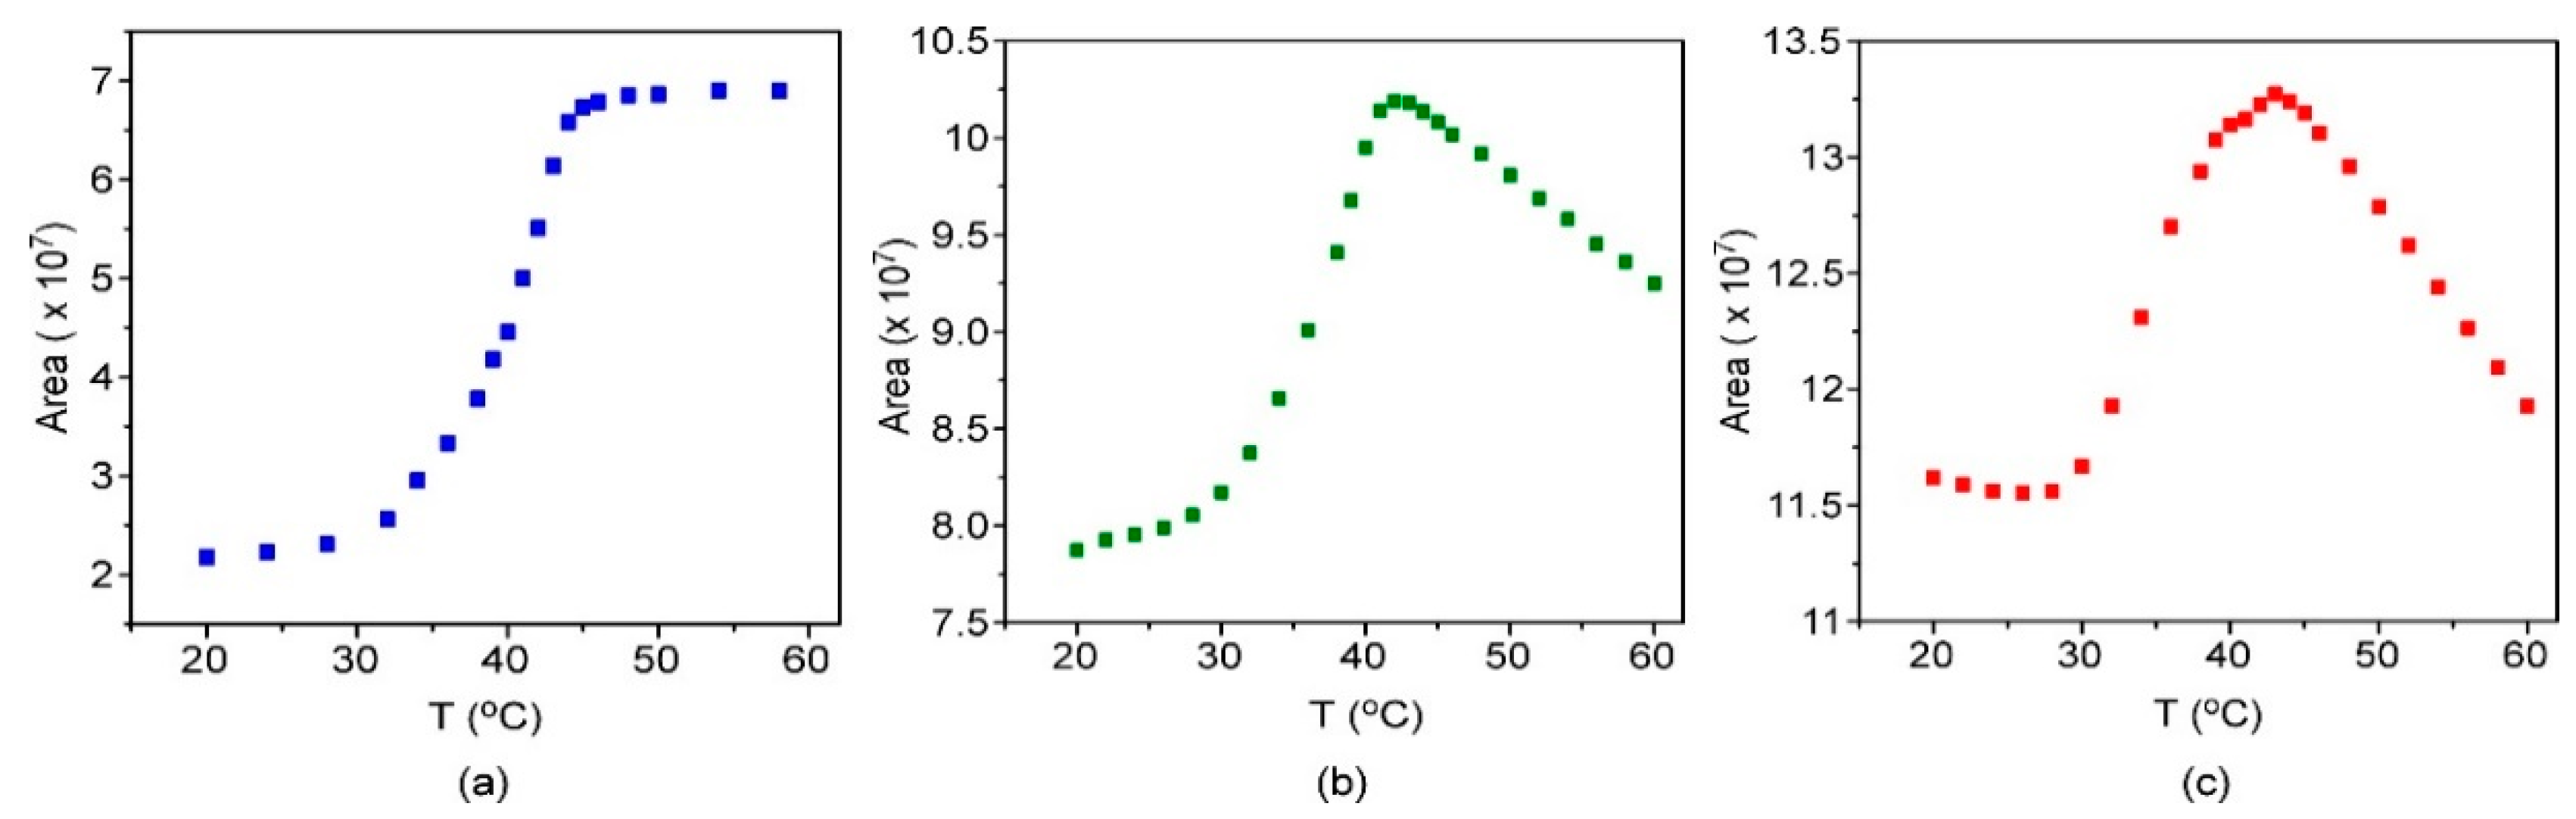
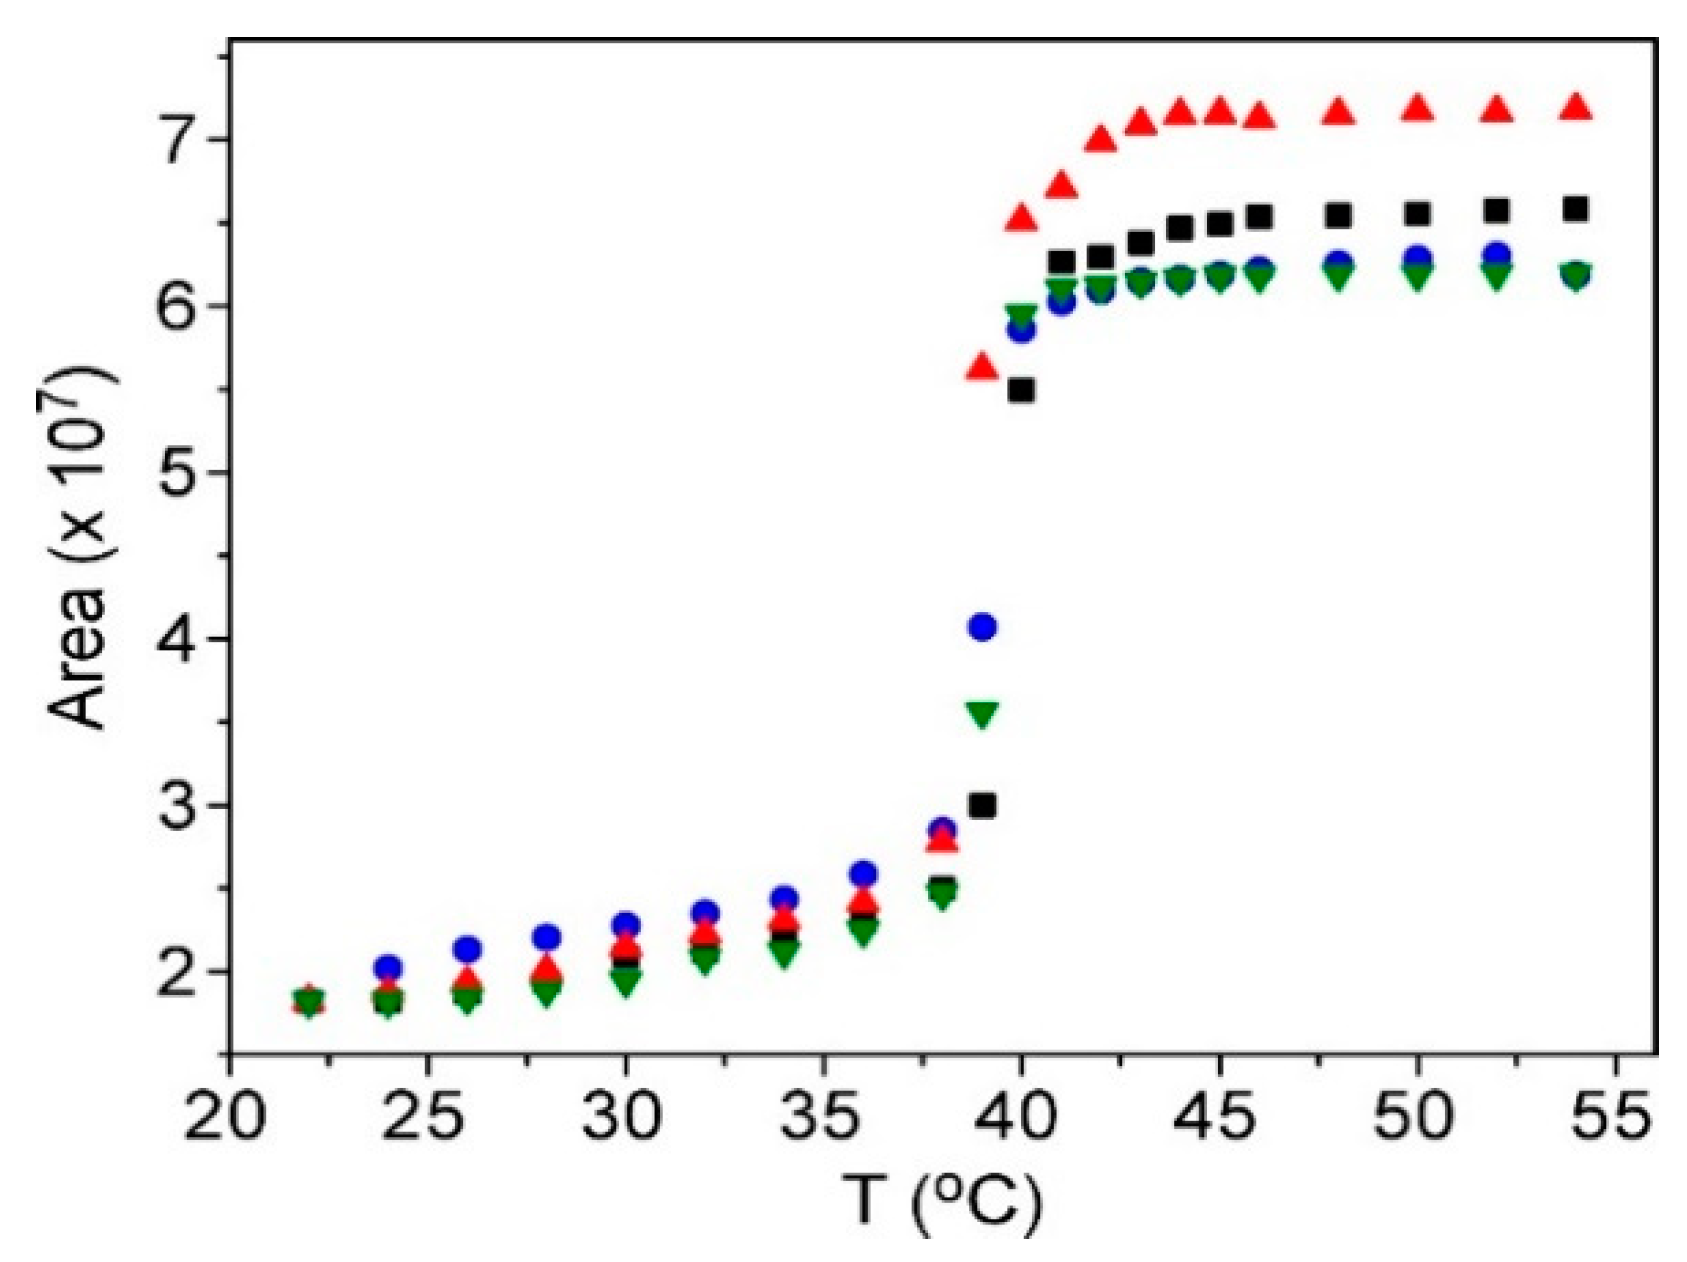
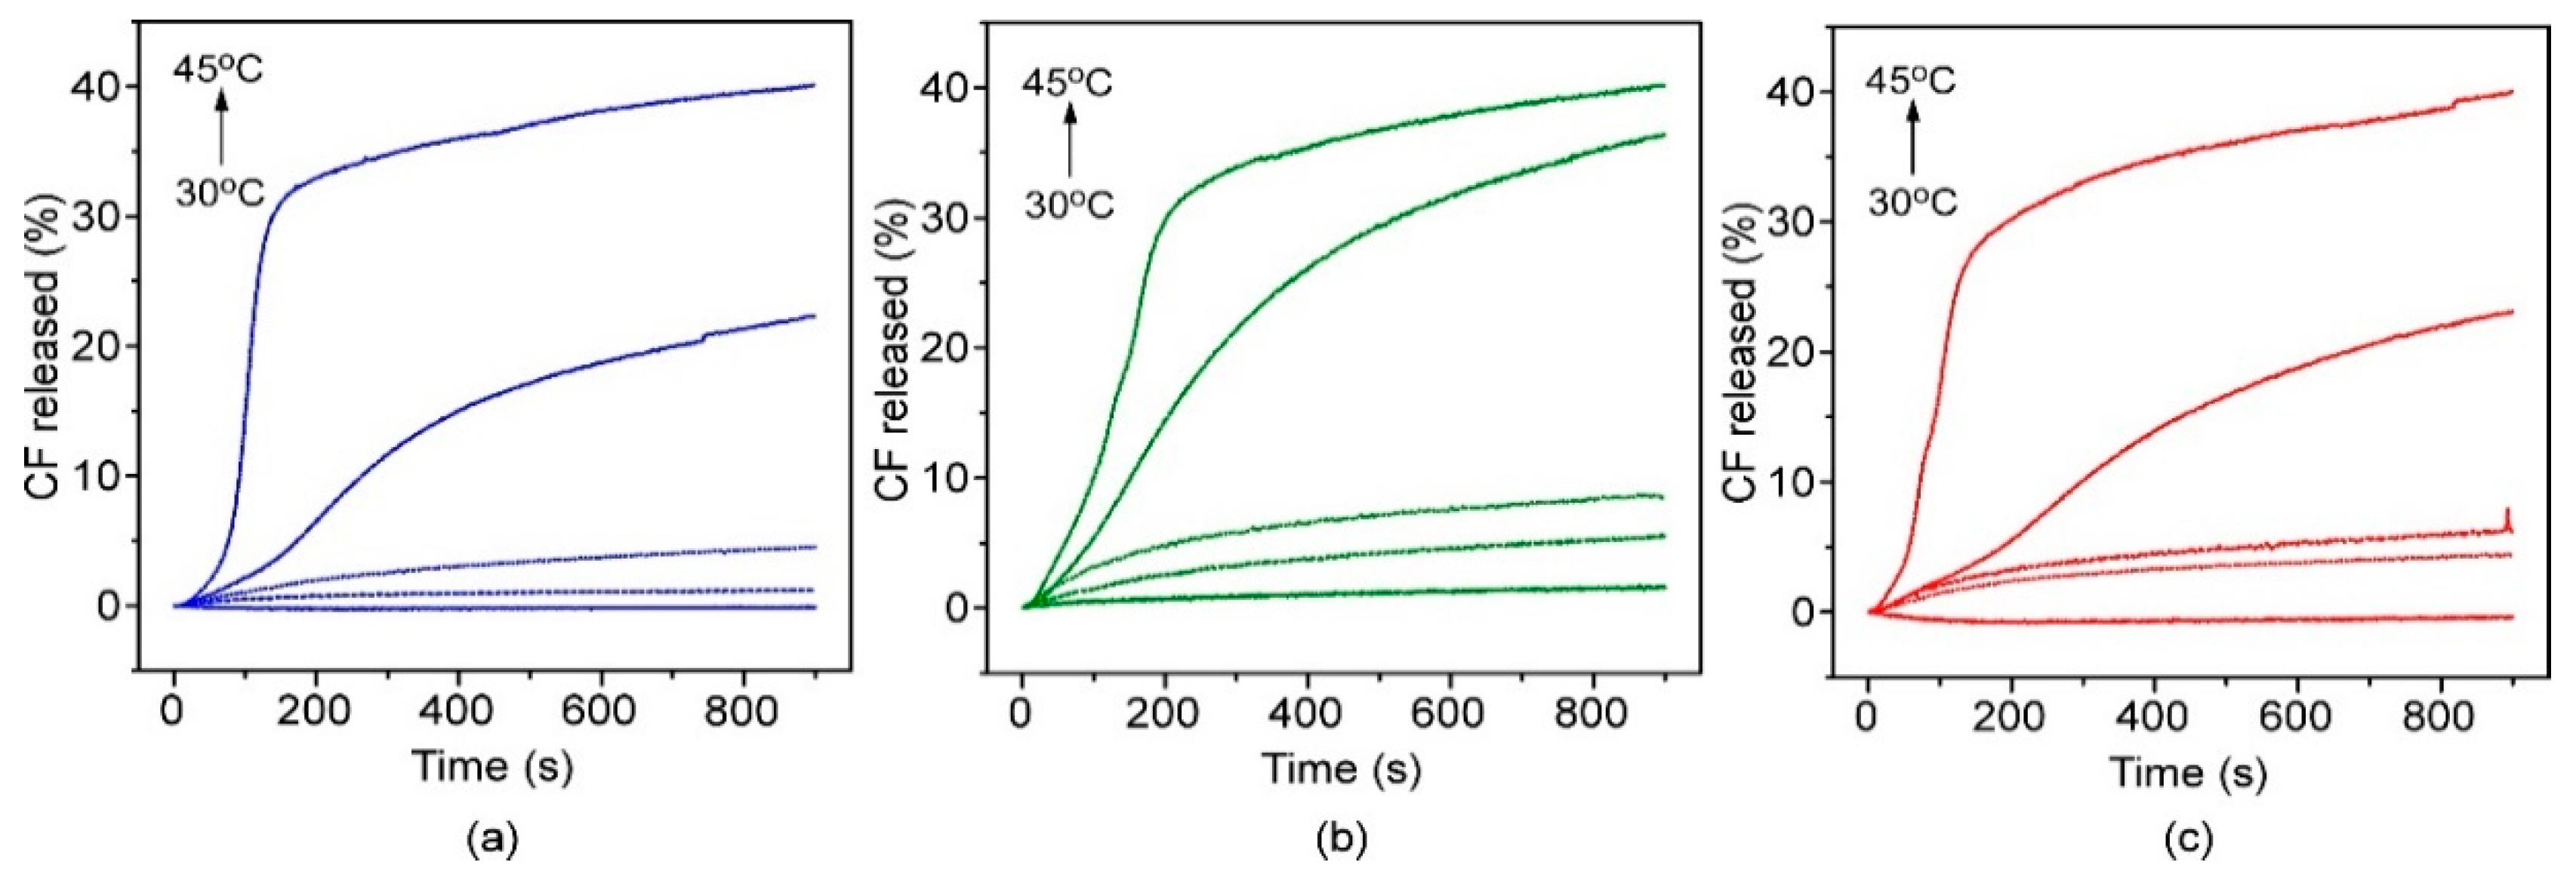
3.2. Encapsulation and Release Assays
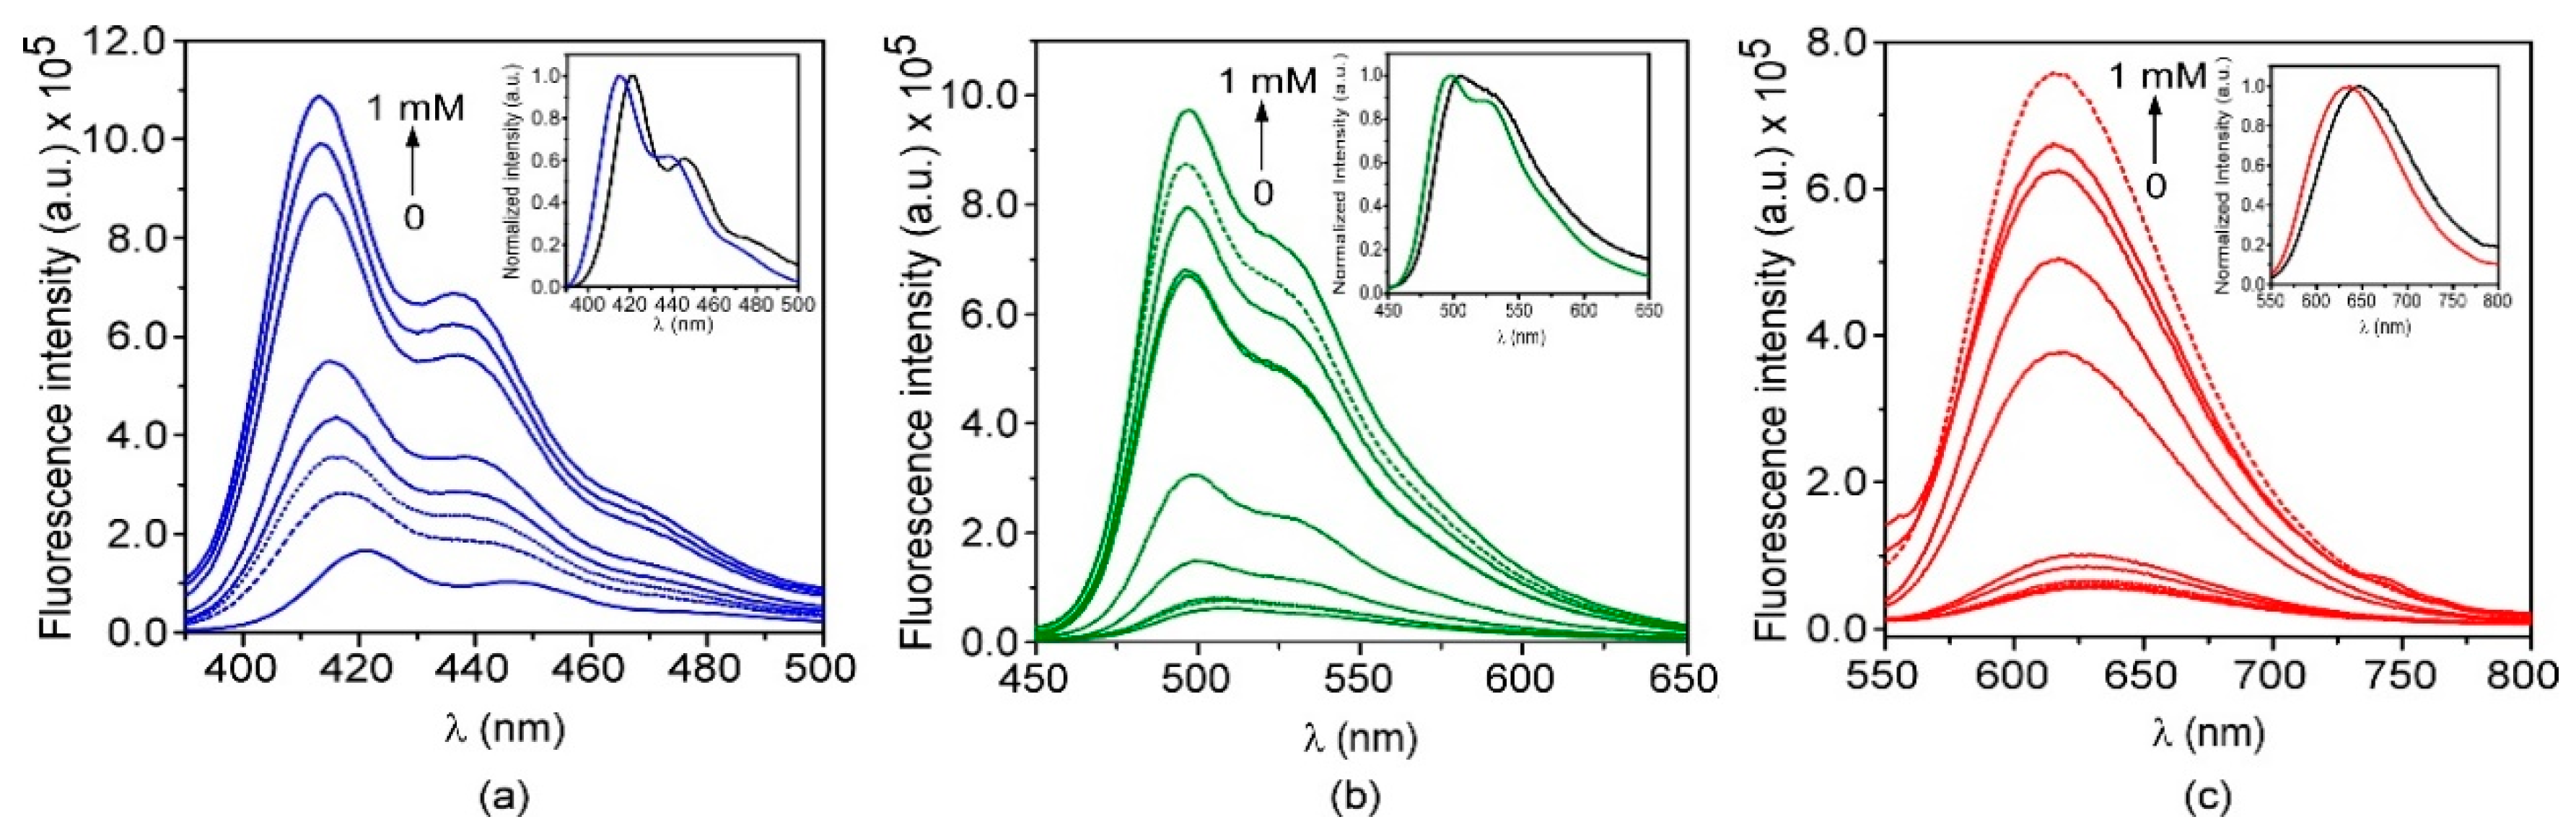
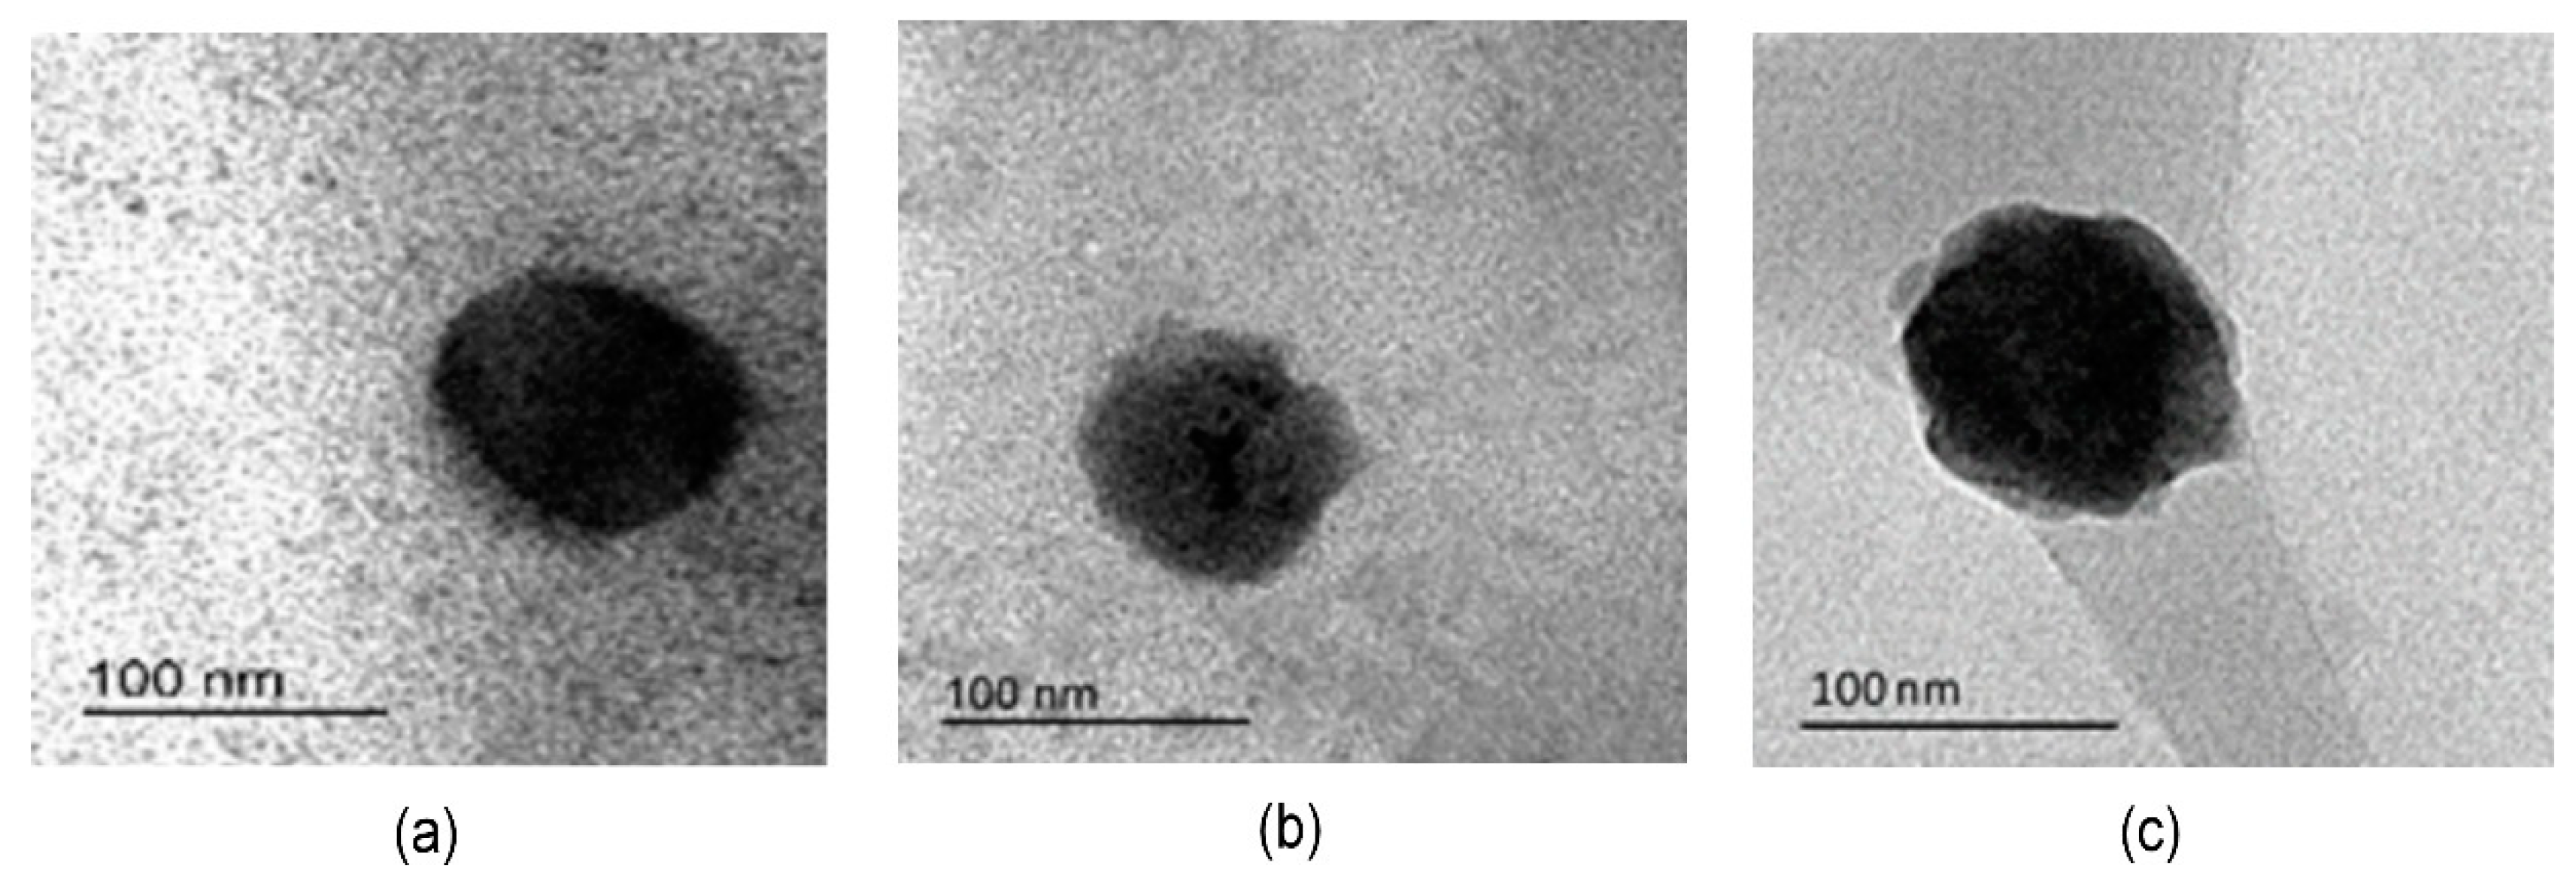
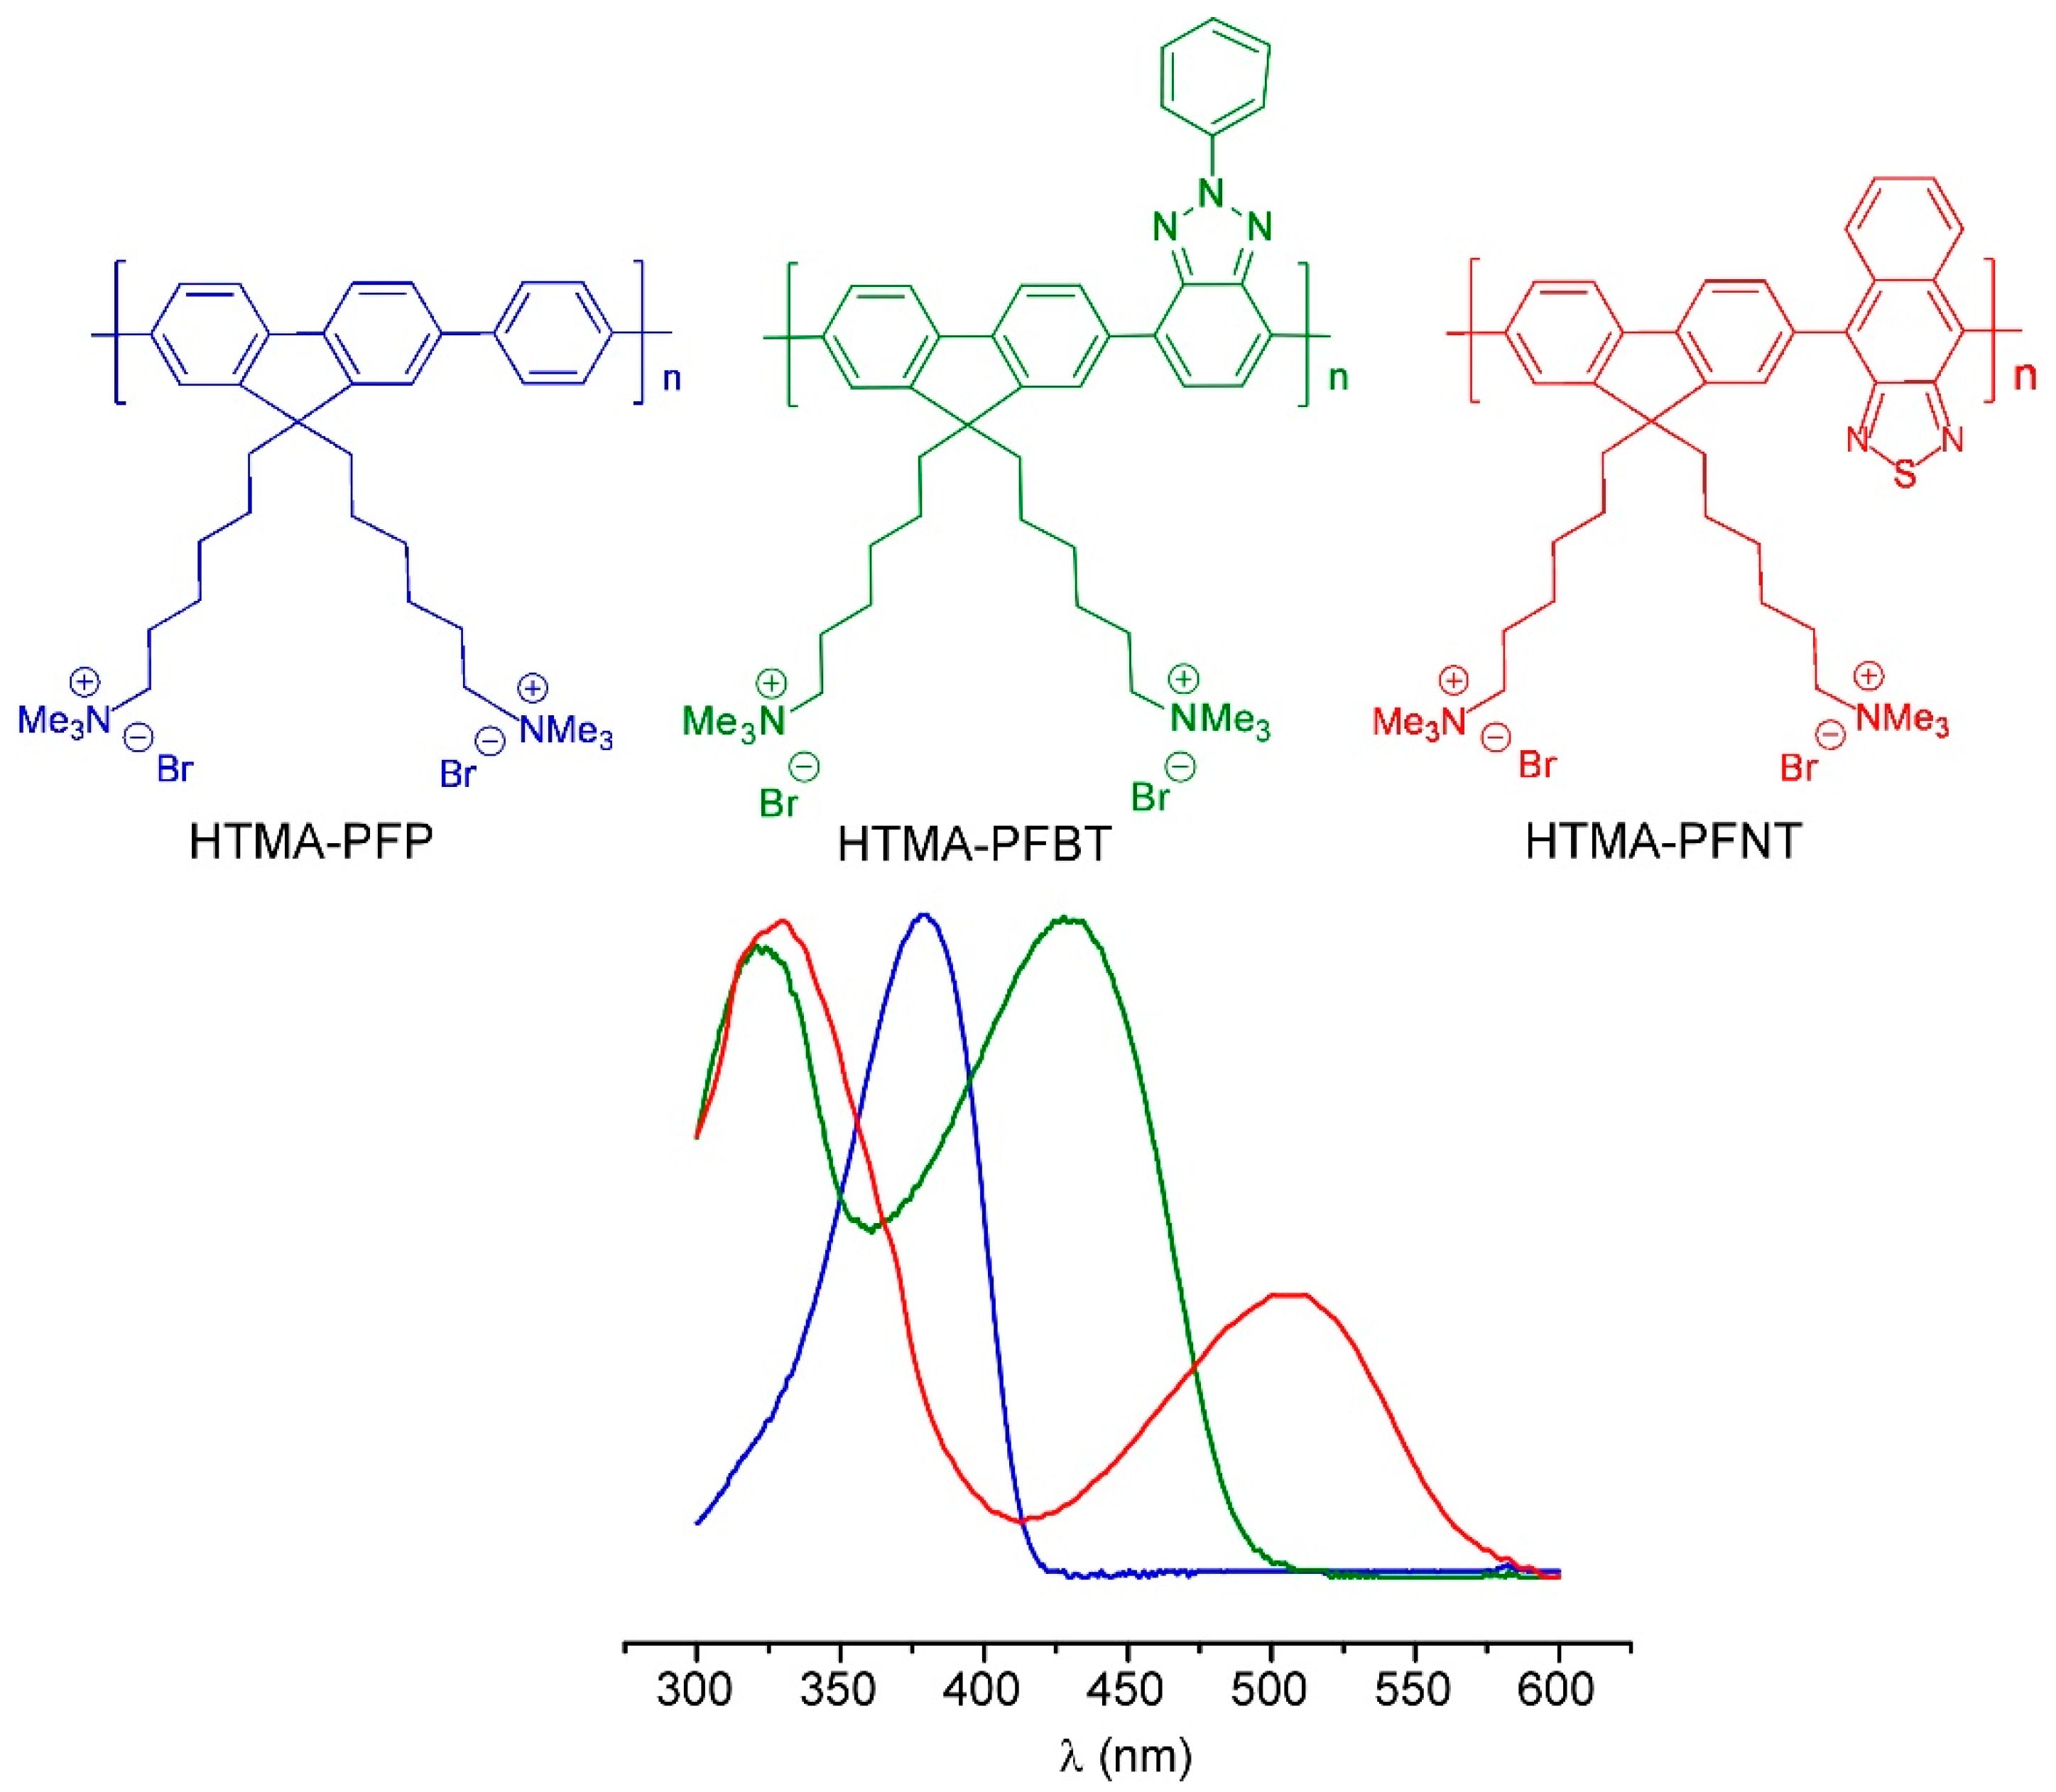
3.3. Preparation and Characterization of Fluorescent Nanoparticles
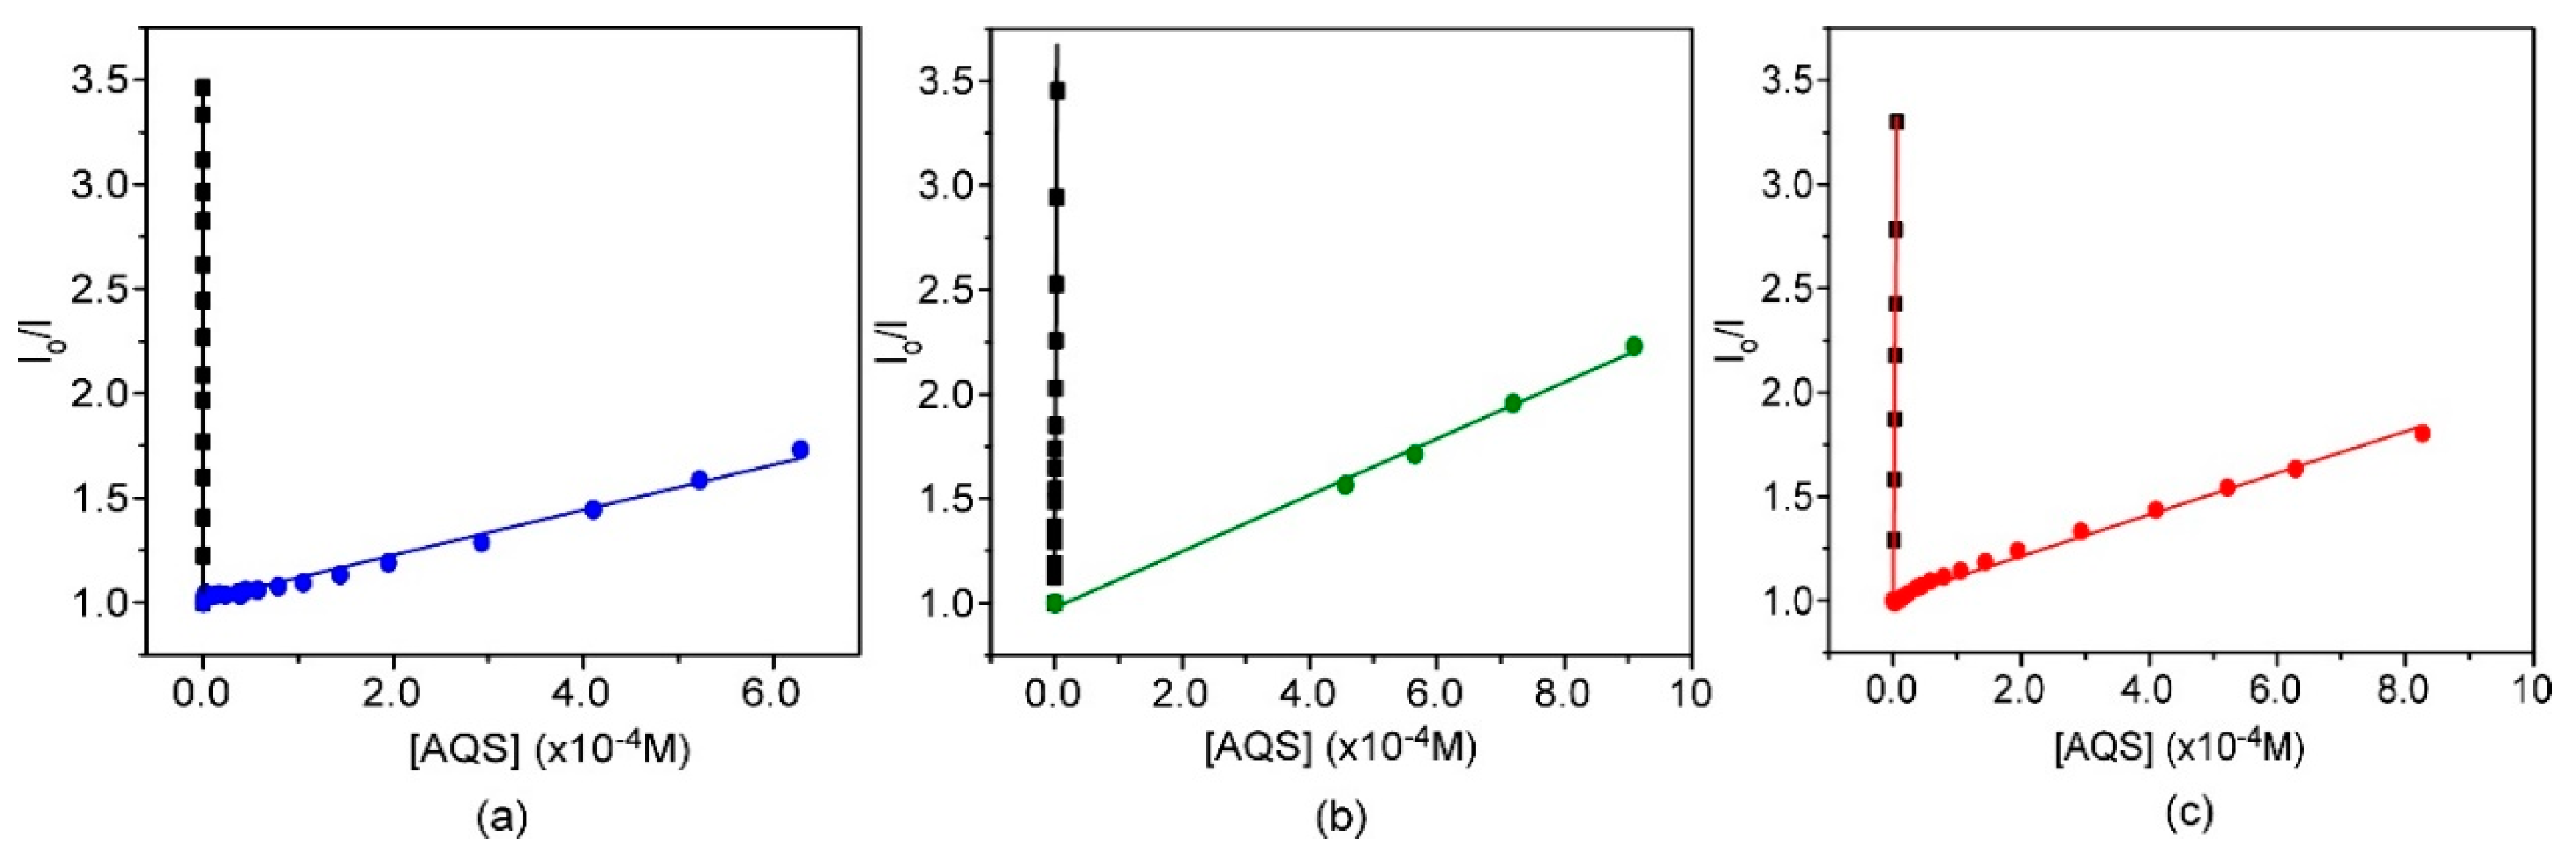
3.4. Nanoparticles as Drug Carriers and Bioimaging Probes
4. Conclusions
Supplementary Materials
Author Contributions
Funding
Acknowledgments
Conflicts of Interest
References
- Bao, G.; Mitragotri, S.; Tong, S. Multifunctional Nanoparticles for Drug Delivery and Molecular Imaging. Annu. Rev. Biomed. Eng. 2013, 15, 253–282. [Google Scholar] [CrossRef] [PubMed]
- Farjadian, F.; Ghasemi, A.; Gohari, O.; Roointan, A.; Karimi, M.; Hamblin, M.R. Nanopharmaceuticals and nanomedicines currently on the market: Challenges and opportunities. Nanomedicine 2019, 14, 93–126. [Google Scholar] [CrossRef] [PubMed]
- Bejarano, J.; Navarro-Marquez, M.; Morales-Zavala, F.; Morales, J.O.; Garcia-Carvajal, I.; Araya-Fuentes, E.; Flores, Y.; Verdejo, H.E.; Castro, P.F.; Lavandero, S.; et al. Nanoparticles for diagnosis and therapy of atherosclerosis and myocardial infarction: Evolution toward prospective theranostic approaches. Theranostics 2018, 8, 4710–4732. [Google Scholar] [CrossRef] [PubMed]
- Anderson, S.D.; Gwenin, V.V. Magnetic Functionalized Nanoparticles for Biomedical, Drug Delivery and Imaging Applications. Nanoscale Res. Lett. 2019, 14, 188. [Google Scholar] [CrossRef] [PubMed]
- Cole, J.T.; Holland, N.B. Multifunctional nanoparticles for use in theranostic applications. Drug Deliv. Transl. Res. 2015, 5, 295–309. [Google Scholar] [CrossRef]
- Edelman, R.; Assaraf, Y.G.; Slavkin, A.; Dolev, T.; Shahar, T.; Livney, Y.D. Developing Body-Components-Based Theranostic Nanoparticles for Targeting Ovarian Cancer. Pharmaceutics 2019, 11, 216. [Google Scholar] [CrossRef]
- Lim, E.K.; Kim, T.; Paik, S.; Haam, S.; Huh, Y.M.; Lee, K. Nanomaterials for theranostics: Recent advances and future challenges. Chem. Rev. 2015, 115, 327–392. [Google Scholar] [CrossRef]
- Martínez-Carmona, M.; Gun’ko, Y.; Vallet-Regí, M. ZnO Nanostructures for Drug Delivery and Theranostic Applications. Nanomaterials 2018, 8, 268. [Google Scholar] [CrossRef]
- Xing, H.; Hwang, K.; Lu, Y. Recent developments of liposomes as nanocarriers for theranostic applications. Theranostics 2016, 6, 1336–1352. [Google Scholar] [CrossRef]
- Allen, T.M.; Cullis, P.R. Liposomal drug delivery systems: From concept to clinical applications. Adv. Drug Deliv. Rev. 2013, 65, 36–48. [Google Scholar] [CrossRef]
- Pandey, H.; Rani, R.; Agarwal, V. Liposome and their applications in cancer therapy. Braz. Arch. Biol. Technol. 2016, 59, e16150477. [Google Scholar] [CrossRef]
- Díaz, M.R.; Vivas-Mejia, P.E. Nanoparticles as drug delivery systems in cancer medicine: Emphasis on RNAi-containing nanoliposomes. Pharmaceuticals 2013, 6, 1361–1380. [Google Scholar] [CrossRef] [PubMed]
- Fernandes, L.F.; Bruch, G.E.; Massensini, A.R.; Frézard, F. Recent advances in the therapeutic and diagnostic use of liposomes and carbon nanomaterials in ischemic stroke. Front. Neurosci. 2018, 12, 453. [Google Scholar] [CrossRef] [PubMed]
- Lee, Y.; Thompson, D.H. Stimuli-responsive liposomes for drug delivery. Wiley Interdiscip. Rev. Nanomed. Nanobiotechnol. 2017, 9, e1450. [Google Scholar] [CrossRef]
- Yatvin, M.B.; Weinstein, J.N.; Dennis, W.H.; Blumenthal, R. Design of liposomes for enhanced local release of drugs by hyperthermia. Science 1978, 202, 1290–1293. [Google Scholar] [CrossRef]
- Petrov, R.R.; Chen, W.H.; Regen, S.L. Thermally gated liposomes: A closer look. Bioconjug. Chem. 2009, 20, 1037–1043. [Google Scholar] [CrossRef]
- Hossann, M.; Wiggenhorn, M.; Schwerdt, A.; Wachholz, K.; Teichert, N.; Eibl, H.; Issels, R.D.; Lindner, L.H. In vitro stability and content release properties of phosphatidylglyceroglycerol containing thermosensitive liposomes. Biochim. Biophys. Acta Biomembr. 2007, 1768, 2491–2499. [Google Scholar] [CrossRef] [Green Version]
- Kneidl, B.; Peller, M.; Winter, G.; Lindner, L.H.; Hossann, M. Thermosensitive liposomal drug delivery systems: State of the art review. Int. J. Nanomed. 2014, 9, 4387–4398. [Google Scholar]
- Nardecchia, S.; Sánchez-Moreno, P.; de Vicente, J.; Marchal, J.A.; Boulaiz, H. Clinical Trials of Thermosensitive Nanomaterials: An Overview. Nanomaterials 2019, 9, 191. [Google Scholar] [CrossRef]
- Tagami, T.; Ernsting, M.J.; Li, S.D. Optimization of a novel and improved thermosensitive liposome formulated with DPPC and a Brij surfactant using a robust in vitro system. J. Control. Release 2011, 154, 290–297. [Google Scholar] [CrossRef]
- Willerding, L.; Limmer, S.; Hossann, M.; Zengerle, A.; Wachholz, K.; ten Hagen, T.L.M.; Koning, G.A.; Sroka, R.; Lindner, L.H.; Peller, M. Method of hyperthermia and tumor size influence effectiveness of doxorubicin release from thermosensitive liposomes in experimental tumors. J. Control. Release 2016, 222, 47–55. [Google Scholar] [CrossRef] [PubMed]
- Bi, H.; Xue, J.; Jiang, H.; Gao, S.; Yang, D.; Fang, Y.; Shi, K. Current developments in drug delivery with thermosensitive liposomes. Asian J. Pharm. Sci. 2019, 14, 365–379. [Google Scholar] [CrossRef]
- Hossann, M.; Wang, T.; Wiggenhorn, M.; Schmidt, R.; Zengerle, A.; Winter, G.; Eibl, H.; Peller, M.; Reiser, M.; Issels, R.D.; et al. Size of thermosensitive liposomes influences content release. J. Control. Release 2010, 147, 436–443. [Google Scholar] [CrossRef] [PubMed]
- Hossann, M.; Syunyaeva, Z.; Schmidt, R.; Zengerle, A.; Eibl, H.; Issels, R.D.; Lindner, L.H. Proteins and cholesterol lipid vesicles are mediators of drug release from thermosensitive liposomes. J. Control. Release 2012, 162, 400–406. [Google Scholar] [CrossRef] [PubMed]
- Bruun, K.; Hille, C. Study on intracellular delivery of liposome encapsulated quantum dots using advanced fluorescence microscopy. Sci. Rep. 2019, 9, 10504. [Google Scholar] [CrossRef] [PubMed]
- Weng, K.C.; Noble, C.O.; Papahadjopoulos-Sternberg, B.; Chen, F.F.; Drummond, D.C.; Kirpotin, D.B.; Wang, D.; Horn, Y.K.; Hann, B.; Park, J.W. Targeted tumor cell internalization and imaging of multifunctional quantum dot-conjugated immunoliposomes in vitro and in vivo. Nano Lett. 2008, 8, 2851–2857. [Google Scholar] [CrossRef]
- Resch-Genger, U.; Grabolle, M.; Cavaliere-Jaricot, S.; Nitschke, R.; Nann, T. Quantum dots versus organic dyes as fluorescent labels. Nat. Methods 2008, 5, 763–775. [Google Scholar] [CrossRef]
- Pisanic, T.R.; Zhang, Y.; Wang, T.H. Quantum dots in diagnostics and detection: Principles and paradigms. Analyst 2014, 139, 2968–2981. [Google Scholar] [CrossRef]
- Pelley, J.L.; Daar, A.S.; Saner, M.A. State of academic knowledge on toxicity and biological fate of quantum dots. Toxicol. Sci. 2009, 112, 276–296. [Google Scholar] [CrossRef]
- Zhang, R.; Ding, Z. Recent Advances in Graphene Quantum Dots as Bioimaging Probes. J. Anal. Test. 2018, 2, 45–60. [Google Scholar] [CrossRef]
- Zhang, Y.; Wei, C.; Lv, F.; Liu, T. Real-time imaging tracking of a dual-fluorescent drug delivery system based on doxorubicin-loaded globin- polyethylenimine nanoparticles for visible tumor therapy. Colloids Surf. B Biointerfaces 2018, 170, 163–171. [Google Scholar] [CrossRef] [PubMed]
- Pu, K.Y.; Liu, B. Fluorescent conjugated polyelectrolytes for bioimaging. Adv. Funct. Mater. 2011, 21, 3408–3423. [Google Scholar] [CrossRef]
- Martiínez-Tomé, M.J.; Esquembre, R.; Mallavia, R.; Mateo, C.R. Formation of Complexes between the Conjugated Polyelectrolyte Poly{[9,9-bis(6’,N,N-trimethylammonium)hexyl]fluorene-phenylene} Bromide (HTMA-PFP) and Human Serum Albumin. Biomacromolecules 2010, 11, 1494–1501. [Google Scholar] [CrossRef] [PubMed]
- Hou, M.; Lu, X.; Zhang, Z.; Xia, Q.; Yan, C.; Yu, Z.; Xu, Y.; Liu, R. Conjugated Polymer Containing Organic Radical for Optical/MR Dual-Modality Bioimaging. ACS Appl. Mater. Interfaces 2017, 9, 44316–44323. [Google Scholar] [CrossRef] [PubMed]
- Qian, C.G.; Chen, Y.L.; Feng, P.J.; Xiao, X.Z.; Dong, M.; Yu, J.C.; Hu, Q.Y.; Shen, Q.D.; Gu, Z. Conjugated polymer nanomaterials for theranostics. Acta Pharmacol. Sin. 2017, 38, 764–781. [Google Scholar] [CrossRef] [Green Version]
- Fu, N.; Wang, Y.; Liu, D.; Zhang, C.; Su, S.; Bao, B.; Zhao, B.; Wang, L. A conjugated polyelectrolyte with pendant high dense short-alkyl-chain-bridged cationic ions: Analyte-induced light-up and label-free fluorescent sensing of tumor markers. Polymers (Basel) 2017, 9, 227. [Google Scholar]
- Gaylord, B.S.; Heeger, A.J.; Bazan, G.C. DNA detection using water-soluble conjugated polymers and peptide nucleic acid probes. Proc. Natl. Acad. Sci. USA 2002, 99, 10954–10957. [Google Scholar] [CrossRef] [Green Version]
- Kahveci, Z.; Martínez-Tomé, M.J.; Mallavia, R.; Mateo, C.R. Fluorescent biosensor for phosphate determination based on immobilized polyfluorene-liposomal nanoparticles coupled with alkaline phosphatase. ACS Appl. Mater. Interfaces 2017, 9, 136–144. [Google Scholar] [CrossRef]
- Ruoyu Zhan, B.L. Benzothiadiazole-Containing Conjugated Polyelectrolytes for Biological Sensing and Imaging. Macromol. Chem. Phys. 2014, 216, 131–144. [Google Scholar] [CrossRef]
- Pina, J.; Seixas De Melo, J.S.; Eckert, A.; Scherf, U. Unusual photophysical properties of conjugated, alternating indigo-fluorene copolymers. J. Mater. Chem. A 2015, 3, 6373–6382. [Google Scholar] [CrossRef]
- Su, H.J.; Wu, F.I.; Tseng, Y.H.; Shu, C.F. Color tuning of a light-emitting polymer: Polyfluorene-containing pendant amino-substituted distyrylarylene units. Adv. Funct. Mater. 2005, 15, 1209–1216. [Google Scholar] [CrossRef]
- Kahveci, Z.; Martínez-Tomé, M.J.; Mallavia, R.; Mateo, C.R. Use of the Conjugated Polyelectrolyte Poly{[9,9-bis(6′-N,N,N-trimethylammonium)hexyl]fluorene-phenylene} Bromide (HTMA-PFP) as a Fluorescent Membrane Marker. Macromolecules 2013, 14, 1990–1998. [Google Scholar] [CrossRef]
- Kahveci, Z.; Vázquez-Guilló, R.; Martínez-Tomé, M.J.; Mallavia, R.; Mateo, C.R. New Red-Emitting Conjugated Polyelectrolyte: Stabilization by Interaction with Biomolecules and Potential Use as Drug Carriers and Bioimaging Probes. ACS Appl. Mater. Interfaces 2016, 8, 1958–1969. [Google Scholar] [CrossRef] [PubMed]
- Vázquez-Guilló, R.; Martínez-Tomé, M.J.; Kahveci, Z.; Torres, I.; Falco, A.; Mallavia, R.; Mateo, R.C. Synthesis and characterization of a novel green cationic polyfluorene and its potential use as a fluorescent membrane probe. Polymers 2018, 10, 938. [Google Scholar] [CrossRef]
- Kahveci, Z.; Martínez-Tomé, M.J.; Esquembre, R.; Mallavia, R.; Mateo, C.R. Selective interaction of a cationic polyfluorene with model lipid membranes: Anionic versus zwitterionic lipids. Materials 2014, 7, 2120–2140. [Google Scholar] [CrossRef] [PubMed]
- Kahveci, Z.; Vázquez-Guilló, R.; Mira, A.; Martinez, L.; Falcó, A.; Mallavia, R.; Mateo, C.R. Selective recognition and imaging of bacterial model membranes over mammalian ones by using cationic conjugated polyelectrolytes. Analyst 2016, 141, 6287–6296. [Google Scholar] [CrossRef]
- Coutinho, A.; Prieto, M. Self-association of the polyene antibiotic nystatin in dipalmitoylphosphatidylcholine vesicles: A time-resolved fluorescence study. Biophys. J. 1995, 69, 2541–2557. [Google Scholar] [CrossRef]
- Melo, M.N.; Castanho, M.A.R.B. Omiganan interaction with bacterial membranes and cell wall models. Assigning a biological role to saturation. Biochim. Biophys. Acta Biomembr. 2007, 1768, 1277–1290. [Google Scholar] [CrossRef] [Green Version]
- Chen, J.; Dong, W.-F.; Möhwald, H.; Krastev, R. Amplified Fluorescence Quenching of Self-Assembled Polyelectrolyte−Dye Nanoparticles in Aqueous Solution. Chem. Mater. 2008, 20, 1664–1666. [Google Scholar] [CrossRef]
- Chemburu, S.; Ji, E.; Casana, Y.; Wu, Y.; Buranda, T.; Schanze, K.S.; Lopez, G.P.; Whitten, D.G. Conjugated polyelectrolyte supported bead based assays for phospholipase A2 activity. J. Phys. Chem. B 2008, 112, 14492–14499. [Google Scholar] [CrossRef]
- Lakowicz, J.R. Principles of Fluorescence Spectroscopy Principles of Fluorescence Spectroscopy, 2nd ed.; Kluwer Academic/Plenum: New York, NY, USA, 1999. [Google Scholar]
- Sun, C.; Wang, J.; Liu, J.; Qiu, L.; Zhang, W.; Zhang, L. Liquid proliposomes of nimodipine drug delivery system: Preparation, characterization, and pharmacokinetics. AAPS PharmSciTech 2013, 14, 332–338. [Google Scholar] [CrossRef] [PubMed]
- Yi, P.N.; MacDonald, R.C. Temperature dependence of optical properties of aqueous dispersions of phosphatidylcholine. Chem. Phys. Lipids 1973, 11, 114–134. [Google Scholar] [CrossRef]
- Esquembre, R.; Ferrer, M.L.; Gutiérrez, M.C.; Mallavia, R.; Mateo, C.R. Fluorescence study of the fluidity and cooperativity of the phase transitions of zwitterionic and anionic liposomes confined in sol-gel glasses. J. Phys. Chem. B 2007, 111, 3665–3673. [Google Scholar] [CrossRef] [PubMed]
- Chen, R.F.; Knutson, J.R. Mechanism of fluorescence concentration quenching of carboxyfluorescein in liposomes: Energy transfer to nonfluorescent dimers. Anal. Biochem. 1988, 172, 61–77. [Google Scholar] [CrossRef]
- Riske, K.A.; Barroso, R.P.; Vequi-Suplicy, C.C.; Germano, R.; Henriques, V.B.; Lamy, M.T. Lipid bilayer pre-transition as the beginning of the melting process. Biochim. Biophys. Acta Biomembr. 2009, 1788, 954–963. [Google Scholar] [CrossRef] [Green Version]


| TSLs | TSLs + HTMA-PFP | TSLs + HTMA-PFBT | TSLs + HTMA-PFNT | |
|---|---|---|---|---|
| d (nm) | 127.3 ± 1.3 | 133.4 ± 0.9 | 143.5 ± 0.5 | 143.1 ± 0.1 |
| ZP (mV) | −35.2 ± 1.7 | −32.0 ± 0.7 | −28.3 ± 0.7 | −30.9 ± 0.9 |
| Kp | KSV (M−1) | |
|---|---|---|
| HTMA-PFP + TSLs | 3.04 ± 0.66 × 10⁴ | 1.11 ± 0.02 × 10³ |
| HTMA-PFP + Buffer | 1.60 + 0.01 × 10⁷ | |
| HTMA-PFBT + TSLs | 5.03 ± 1.16 × 10⁴ | 1.32 ± 0.02 × 10³ |
| HTMA-PFBT + Buffer | 6.08 ± 0.34 × 10⁵ | |
| HTMA-PFNT + TSLs | 2.59 ± 0.41 × 10⁴ | 1.00 ± 0.02 × 10³ |
| HTMA-PFNT + Buffer | 4.19 ± 0.04 × 10⁵ |
© 2019 by the authors. Licensee MDPI, Basel, Switzerland. This article is an open access article distributed under the terms and conditions of the Creative Commons Attribution (CC BY) license (http://creativecommons.org/licenses/by/4.0/).
Share and Cite
Rubio-Camacho, M.; Alacid, Y.; Mallavia, R.; Martínez-Tomé, M.J.; Mateo, C.R. Polyfluorene-Based Multicolor Fluorescent Nanoparticles Activated by Temperature for Bioimaging and Drug Delivery. Nanomaterials 2019, 9, 1485. https://0-doi-org.brum.beds.ac.uk/10.3390/nano9101485
Rubio-Camacho M, Alacid Y, Mallavia R, Martínez-Tomé MJ, Mateo CR. Polyfluorene-Based Multicolor Fluorescent Nanoparticles Activated by Temperature for Bioimaging and Drug Delivery. Nanomaterials. 2019; 9(10):1485. https://0-doi-org.brum.beds.ac.uk/10.3390/nano9101485
Chicago/Turabian StyleRubio-Camacho, Marta, Yolanda Alacid, Ricardo Mallavia, María José Martínez-Tomé, and C. Reyes Mateo. 2019. "Polyfluorene-Based Multicolor Fluorescent Nanoparticles Activated by Temperature for Bioimaging and Drug Delivery" Nanomaterials 9, no. 10: 1485. https://0-doi-org.brum.beds.ac.uk/10.3390/nano9101485