Fiber Optic Sensors: A Review for Glucose Measurement

 ,
, 
 , , , ,
  , and
, and
Abstract
:1. Introduction
2. Sensor Principles
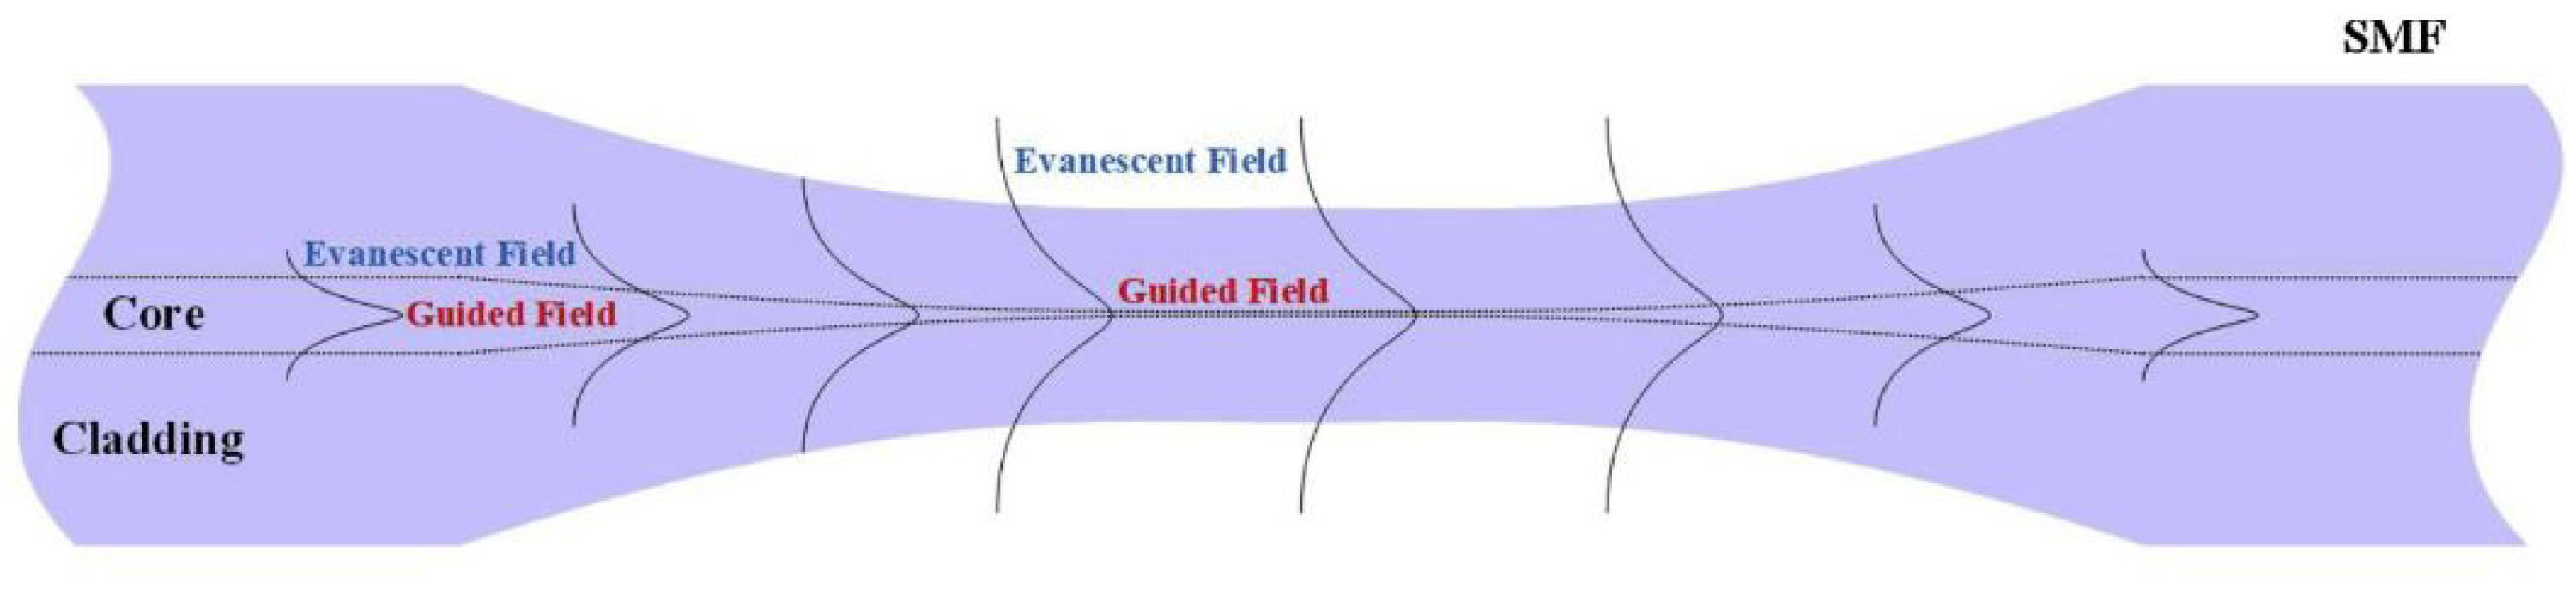
2.1. Fiber Optic Taper Working Principle
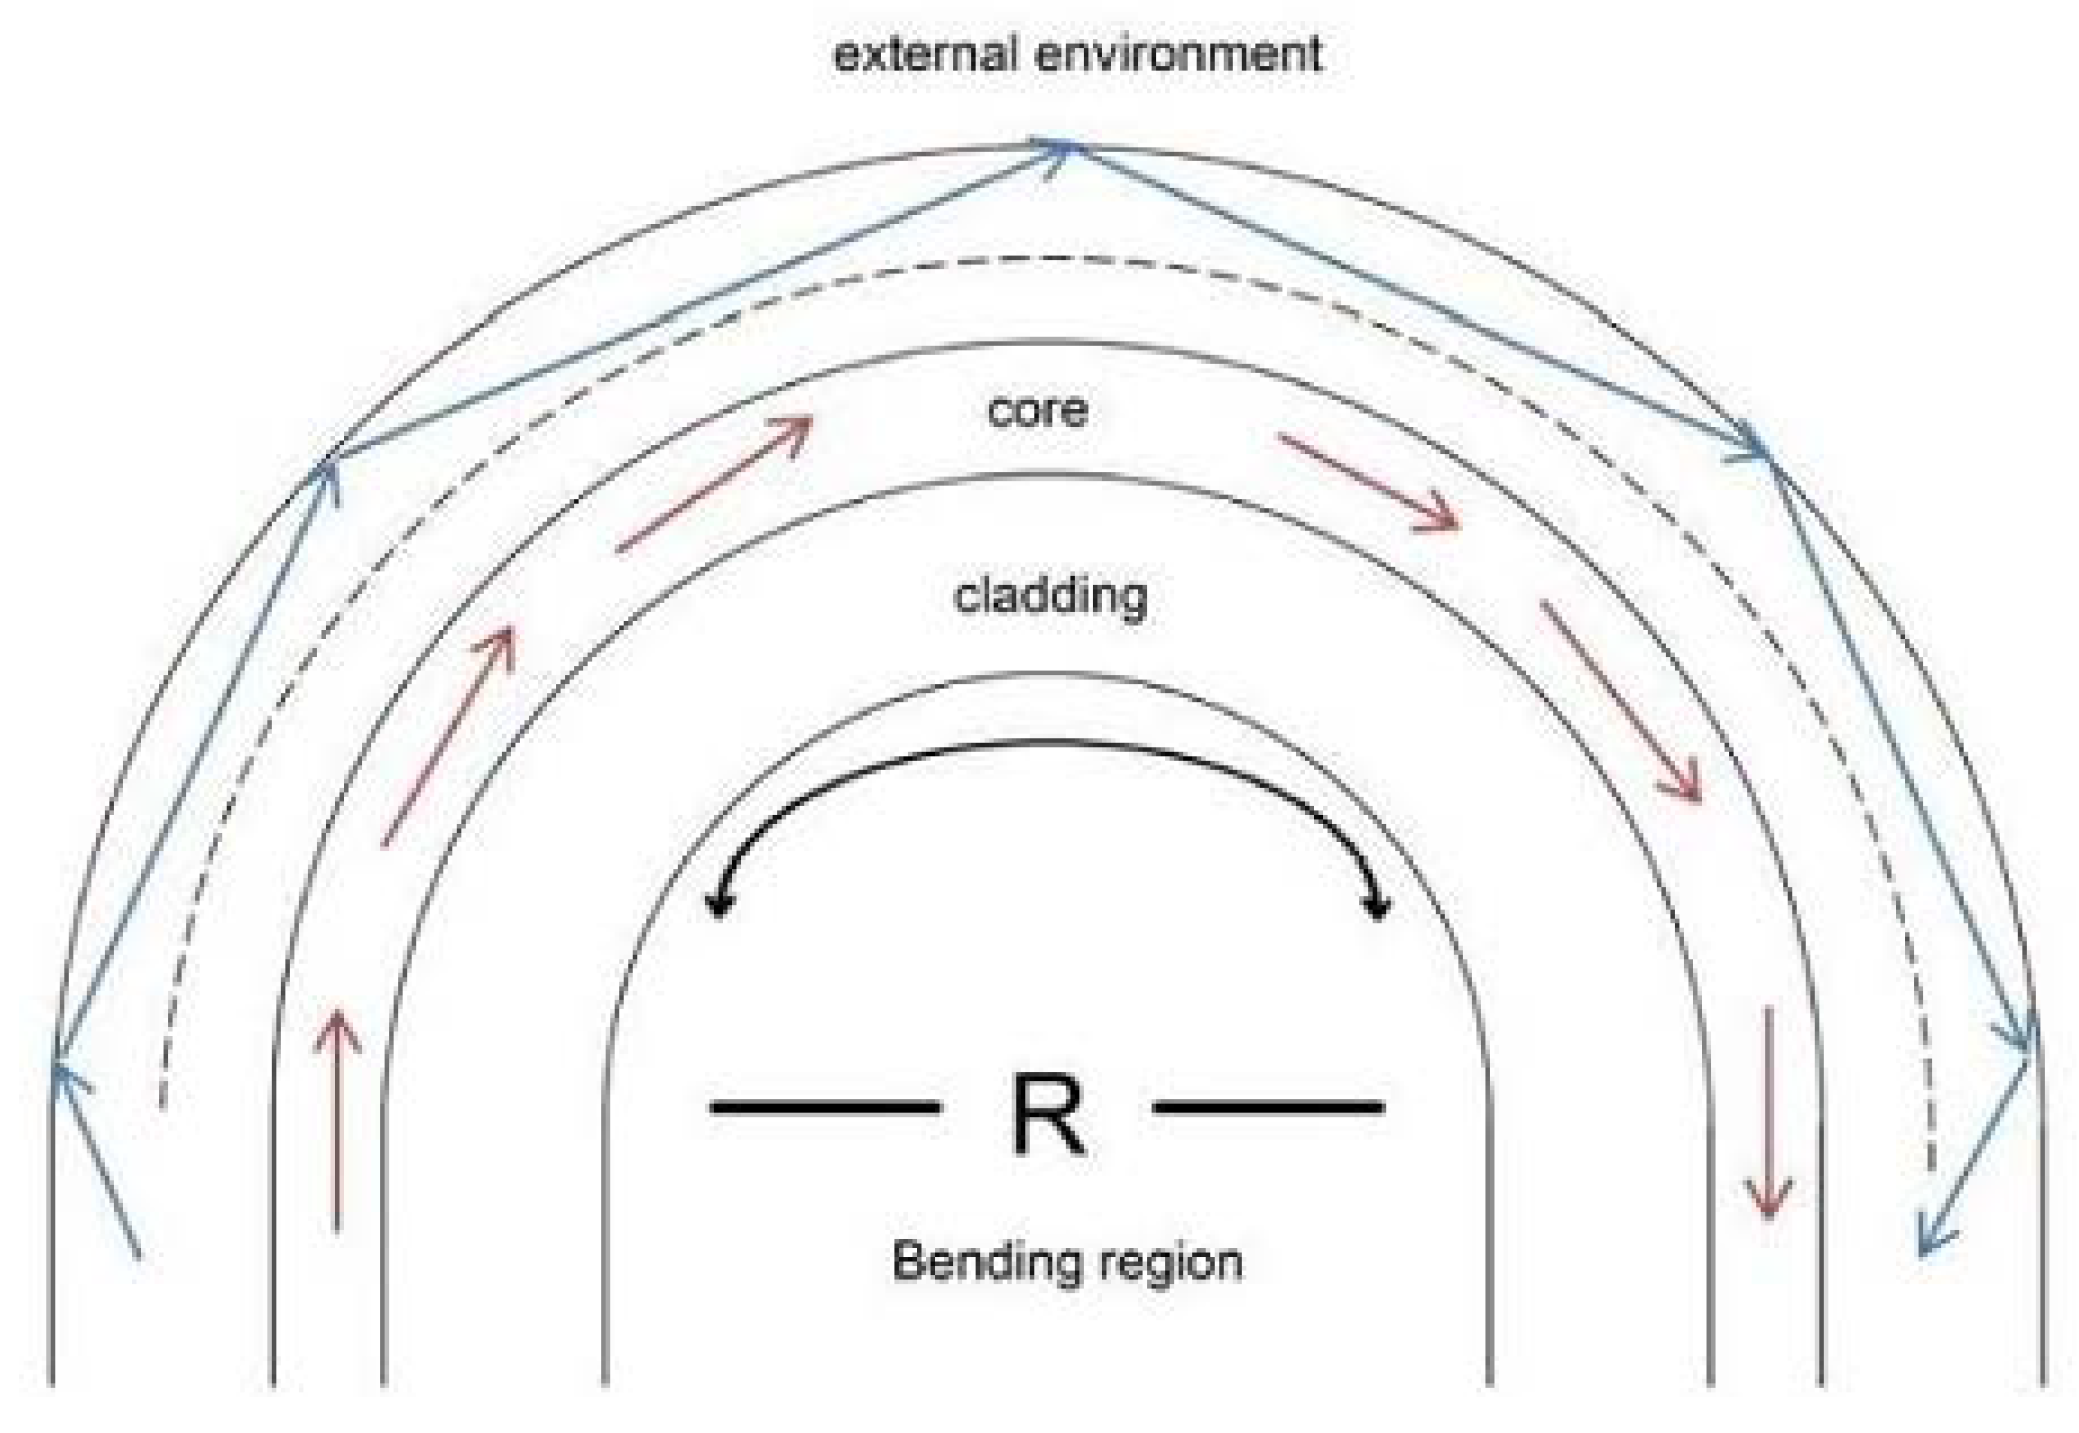
2.2. U-Shaped Fiber Optic Working Principle
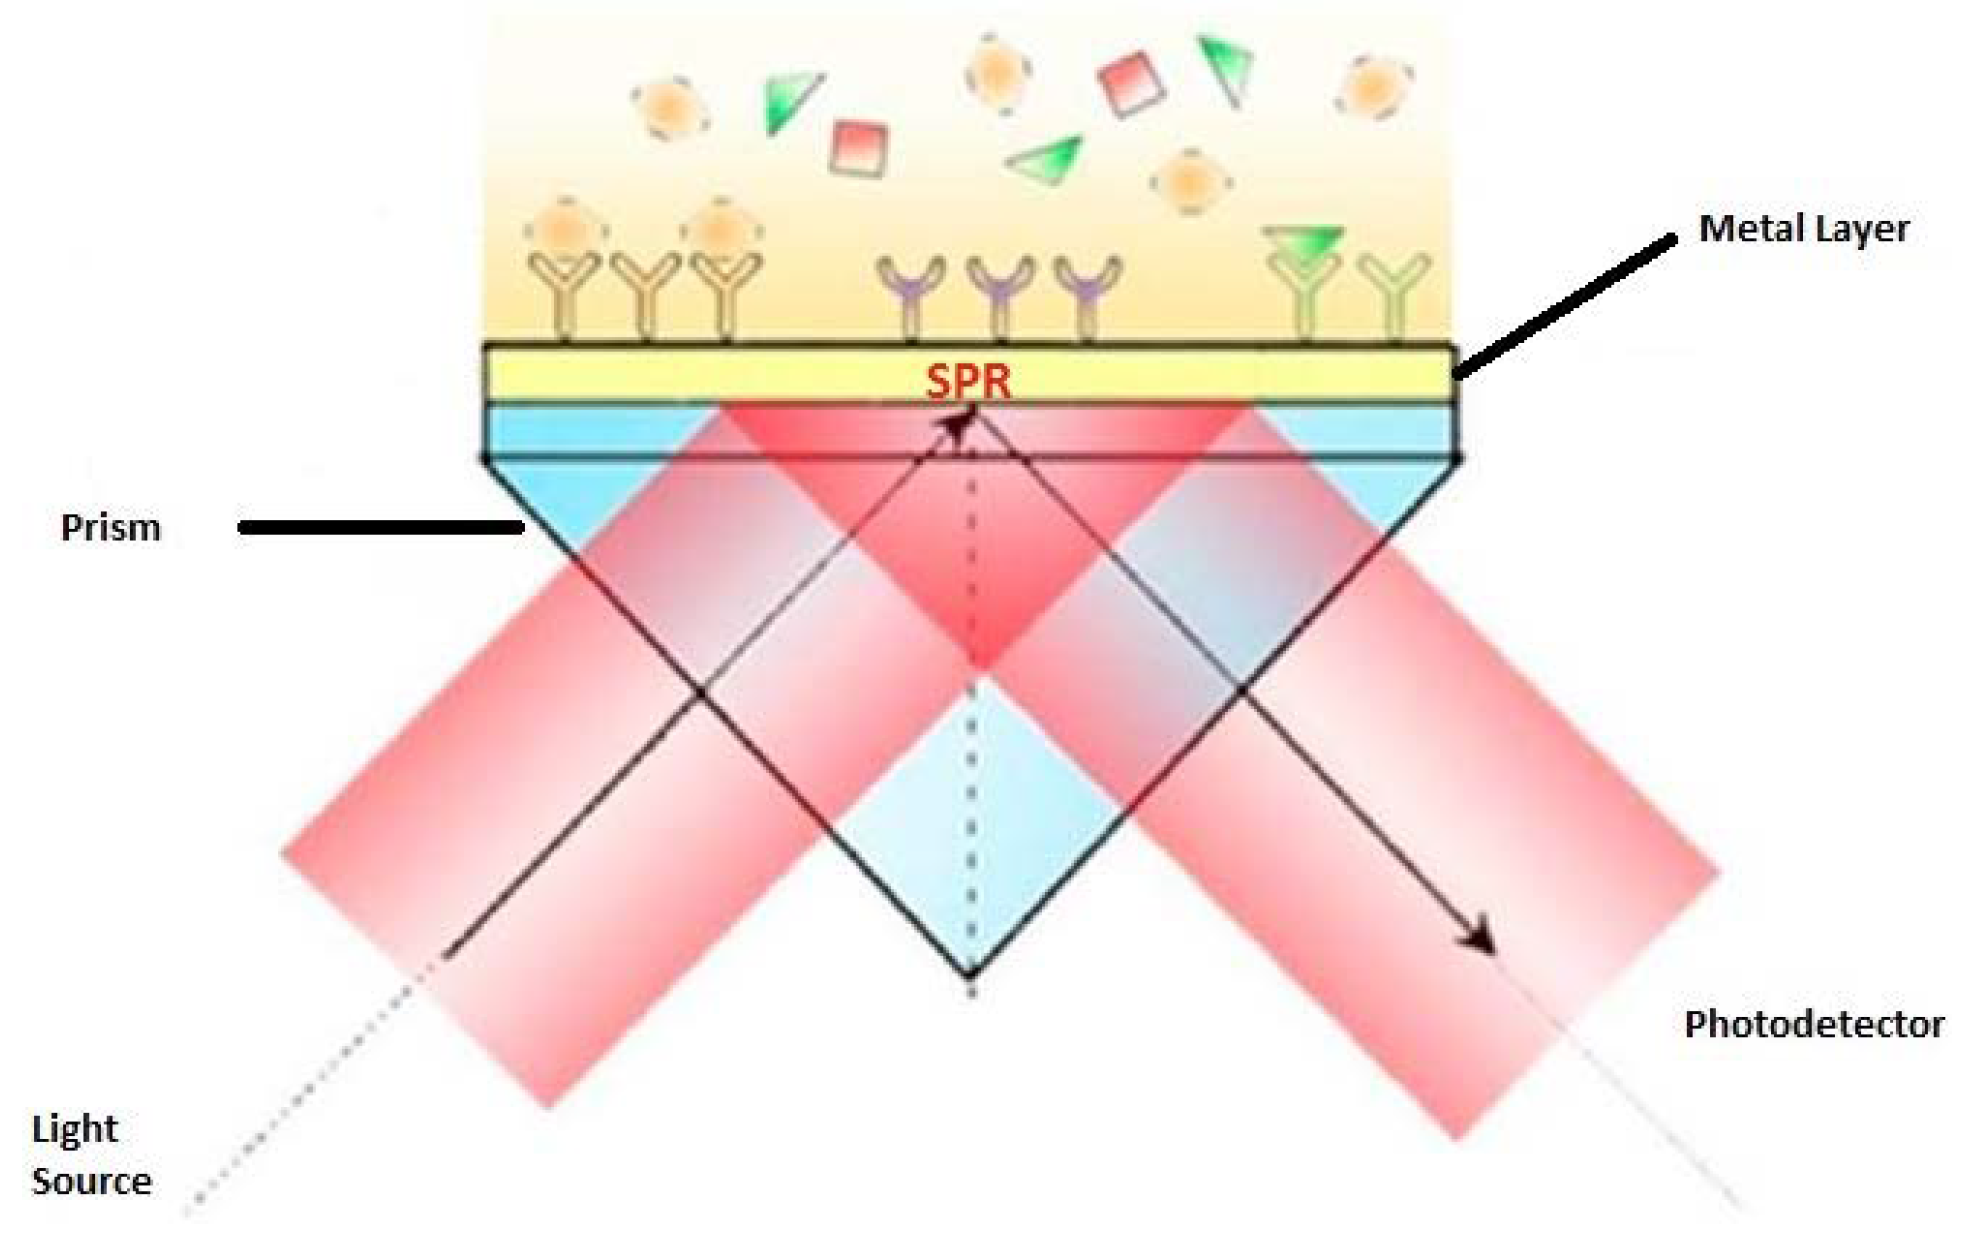
2.3. Surface Plasmon Resonance (SPR)
2.4. Fiber Bragg Grating (FBG)
3. Sensors
3.1. Multimode Fiber Optic Sensors
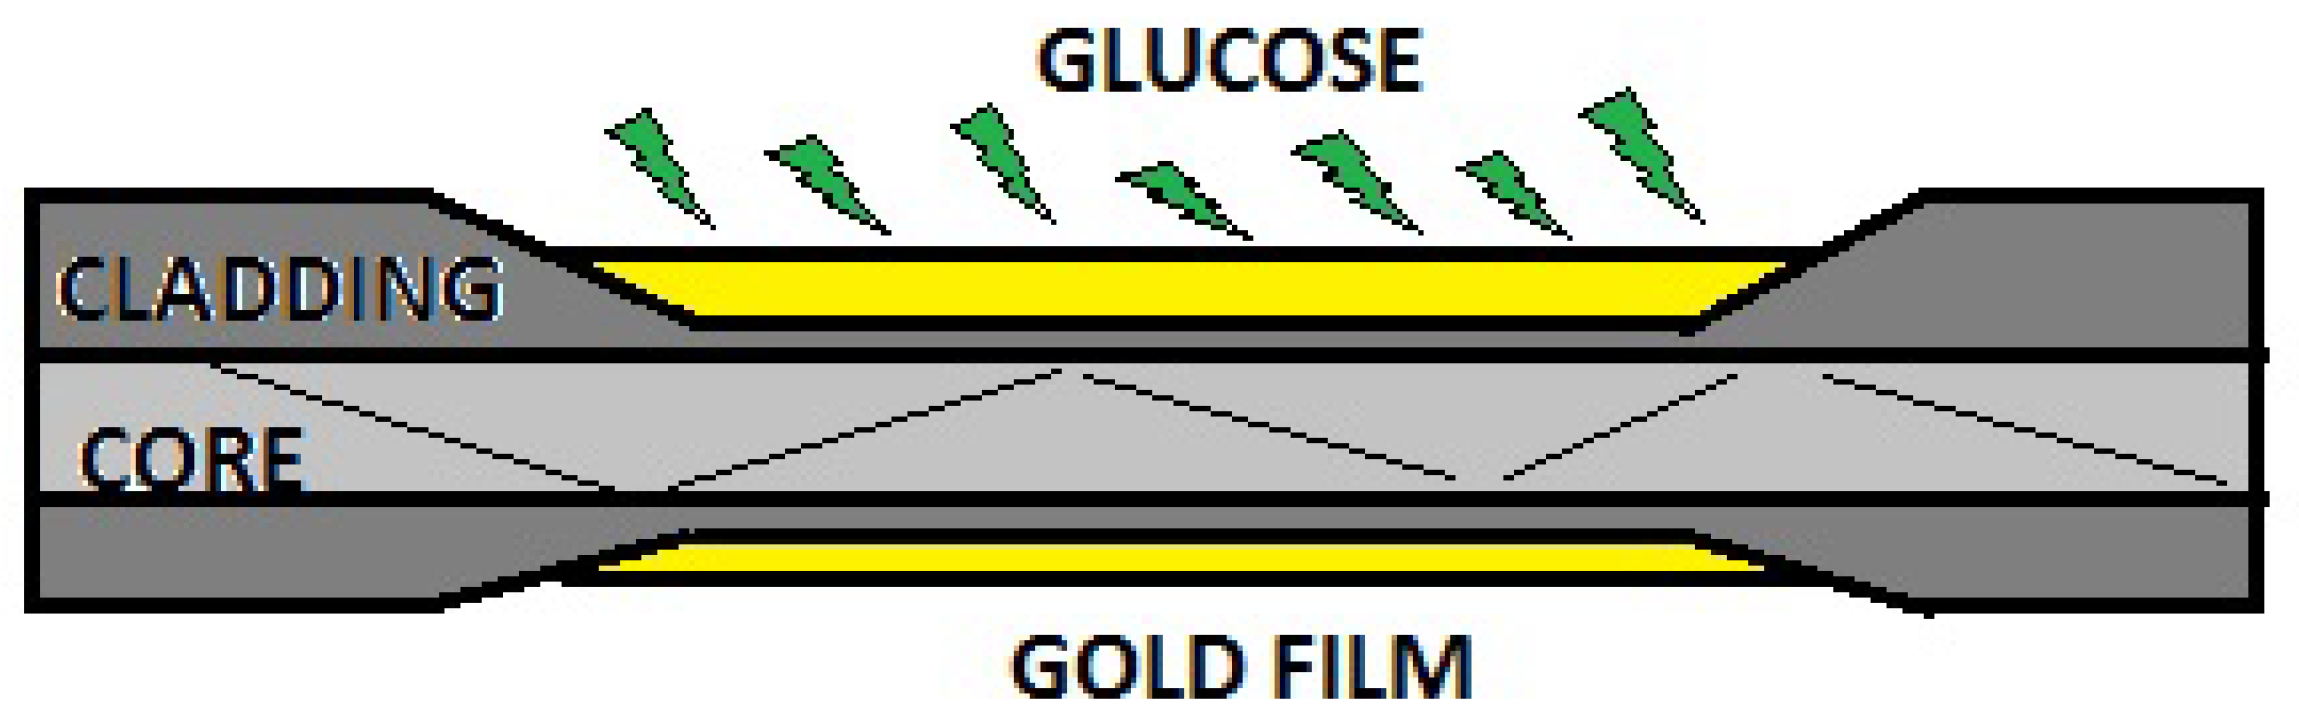
3.2. Plastic Fiber Optic Sensors
3.3. Photonic Fiber Optic Sensors
3.4. Single-Mode Fiber Optic Sensors
4. Discussion
5. Conclusions
Funding
Institutional Review Board Statement
Informed Consent Statement
Acknowledgments
Conflicts of Interest
Abbreviations
| WHO | World Health Organization |
| NI | Non-invasive |
| FOS | Fiber Optic Sensors |
| MI | Minimally Invasive |
| SPR | Surface Plasmon Resonance |
| EW | Evanescent Waves |
| SMF | Single Mode Fiber |
| WGM | Whispering Gallery Mode |
| FBG | Fiber Bragg Grating |
| UV | Ultra Violet |
| TFBG | Tilted Fiber Bragg Gratting Sensor |
| MMF | Multi-mode Fiber |
| POF | Plastic Optical Fiber |
| PCF | Photonic Crystal Fiber |
| LSPR | Localized Surface Plasmon Resonance |
References
- Ekor, M. The growing use of herbal medicines: Issues relating to adverse reactions and challenges in monitoring safety. Front. Pharmacol. 2014, 4, 177. [Google Scholar] [CrossRef] [PubMed] [Green Version]
- Zhang, P.; Zhang, X.; Brown, J.; Vistisen, D.; Sicree, R.; Shaw, J.; Nichols, G. Global healthcare expenditure on diabetes for 2010 and 2030. Diabetes Res. Clin. Pract. 2010, 87, 293–301. [Google Scholar] [CrossRef]
- Wild, S.; Sicree, R.; Roglic, G.; King, H.; Green, A. Estimates for the year 2000 and projections for 2030. World Health 2004, 27, 1047–1053. [Google Scholar]
- Whiting, D.R.; Guariguata, L.; Weil, C.; Shaw, J. IDF Diabetes Atlas: Global estimates of the prevalence of diabetes for 2011 and 2030. Diabetes Res. Clin. Pract. 2011, 94, 311–321. [Google Scholar] [CrossRef]
- Guariguata, L.; Whiting, D.; Weil, C.; Unwin, N. The International Diabetes Federation diabetes atlas methodology for estimating global and national prevalence of diabetes in adults. Diabetes Res. Clin. Pract. 2011, 94, 322–332. [Google Scholar] [CrossRef]
- Risk, C.C.; Follow-on, A. Nine-Year Effects of 3.7 Years of Intensive Glycemic Control on Cardiovascular Outcomes. Diabetes Care 2016, 39, 701–708. [Google Scholar] [CrossRef] [Green Version]
- Ward, J.E.F.; Stetson, B.A.; Mokshagundam, S.P.L. Patient perspectives on self-monitoring of blood glucose: Perceived recommendations, behaviors and barriers in a clinic sample of adults with type 2 diabetes. J. Diabetes Metab. Disord. 2015, 1–7. [Google Scholar] [CrossRef] [Green Version]
- Wang, J. Electrochemical Glucose Biosensors. Chem. Rev. 2008, 108, 814–825. [Google Scholar] [CrossRef]
- Vashist, S.K.; Zheng, D.; Al-Rubeaan, K.; Luong, J.H.T.; Sheu, F.S. Technology behind commercial devices for blood glucose monitoring in diabetes management: A review. Anal. Chim. Acta 2011, 703, 124–136. [Google Scholar] [CrossRef] [PubMed]
- Mascini, M.; Tombelli, S. Biosensors for biomarkers in medical diagnostics. Biomarkers 2008, 13, 637–657. [Google Scholar] [CrossRef]
- Vashist, S.K. Non-invasive glucose monitoring technology in diabetes management: A review. Anal. Chim. Acta 2012, 750, 16–27. [Google Scholar] [CrossRef]
- Schena, E.; Tosi, D.; Saccomandi, P.; Lewis, E.; Kim, T. Fiber optic sensors for temperature monitoring during thermal treatments: An overview. Sensors 2016, 16, 1144. [Google Scholar] [CrossRef]
- Inaudi, D.; Vurpilot, S.; Casanova, N.; Kronenberg, P. Structural monitoring by curvature analysis using interferometric fiber optic sensors. Smart Mater. Struct. 1998, 7, 199–208. [Google Scholar] [CrossRef]
- Poeggel, S.; Tosi, D.; Duraibabu, D.; Leen, G.; McGrath, D.; Lewis, E. Optical fibre pressure sensors in medical applications. Sensors 2015, 15, 17115–17148. [Google Scholar] [CrossRef]
- Liu, X.; Jin, B.; Bai, Q.; Wang, Y.; Wang, D.; Wang, Y. Distributed fiber-optic sensors for vibration detection. Sensors 2016, 16, 1164. [Google Scholar] [CrossRef] [Green Version]
- Yang, Q.; Zhu, G.; Singh, L.; Wang, Y.; Singh, R.; Zhang, B.; Zhang, X.; Kumar, S. Highly sensitive and selective sensor probe using glucose oxidase/gold nanoparticles/graphene oxide functionalized tapered optical fiber structure for detection of glucose. Optik 2020, 208, 164536. [Google Scholar] [CrossRef]
- Przhiyalkovsky, Y.V.; Gubin, V.P.; Starostin, N.I.; Morshnev, S.K.; Sazonov, A.I. Detection of electric current pulses by a fibre-optic sensor using spun fibre. Quantum Electron. 2018, 48, 62–69. [Google Scholar] [CrossRef]
- Bogue, R. Fibre optic sensors: A review of today’s applications. Sens. Rev. 2011, 31, 304–309. [Google Scholar] [CrossRef]
- Zhang, T.; Pang, F.; Liu, H.; Cheng, J.; Lv, L.; Zhang, X.; Chen, N.; Wang, T. A fiber-optic sensor for acoustic emission detection in a high voltage cable system. Sensors 2016, 16, 2026. [Google Scholar] [CrossRef] [PubMed] [Green Version]
- Ayyanar, N.; Raja, G.T. Design of Glucose Sensor Using Tri-Core Modified Photonic Crystal Fiber. Proc. IEEE Sens. 2018, 2018, 1–4. [Google Scholar] [CrossRef]
- Harun, S.W.; Jasim, A.A.; Rahman, H.A.; Muhammad, M.Z.; Ahmad, H. Micro-ball lensed fiber-based glucose sensor. IEEE Sens. J. 2013, 13, 348–350. [Google Scholar] [CrossRef]
- Chauhan, S.; Punjabi, N.; Sharma, D.; Mukherji, S. Evanescent Wave Absorption Based S-shaped Fiber-optic Biosensor for Immunosensing Applications. Procedia Eng. 2016, 168, 117–120. [Google Scholar] [CrossRef]
- Chen, K.C.; Li, Y.L.; Wu, C.W.; Chiang, C.C. Glucose sensor using U-shaped optical fiber probe with gold nanoparticles and glucose oxidase. Sensors 2018, 18, 1217. [Google Scholar] [CrossRef] [PubMed] [Green Version]
- Mas, S.; Martí, J.; Palací, J. Biconical tapered fibers manipulation for refractive index and strain sensing applications. IEEE Sens. J. 2015, 15, 1331–1335. [Google Scholar] [CrossRef]
- Shao, Y.; Xu, S.; Zheng, X.; Wang, Y.; Xu, W. Optical fiber LSPR biosensor prepared by gold nanoparticle assembly on polyelectrolyte multilayer. Sensors 2010, 10, 3585–3596. [Google Scholar] [CrossRef] [PubMed] [Green Version]
- Yang, X.C.; Lu, Y.; Wang, M.T.; Yao, J.Q. A photonic crystal fiber glucose sensor filled with silver nanowires. Opt. Commun. 2016, 359, 279–284. [Google Scholar] [CrossRef]
- Acciaroli, G.; Vettoretti, M.; Facchinetti, A.; Sparacino, G. Calibration of minimally invasive continuous glucose monitoring sensors: State-of-the-art and current perspectives. Biosensors 2018, 8, 24. [Google Scholar] [CrossRef] [Green Version]
- Saur, N.M.; England, M.R.; Menzie, W.; Melanson, A.M.; Trieu, M.Q.; Berlin, J.; Hurley, J.; Krystyniak, K.; Kongable, G.L.; Nasraway, S.A. Accuracy of a novel noninvasive transdermal continuous glucose monitor in critically ill patients. J. Diabetes Sci. Technol. 2014, 8, 945–950. [Google Scholar] [CrossRef] [Green Version]
- Lipani, L.; Dupont, B.G.R.; Doungmene, F.; Marken, F.; Tyrrell, R.M.; Guy, R.H.; Ilie, A. Non-invasive, transdermal, path-selective and specific glucose monitoring via a graphene-based platform. Nat. Nanotechnol. 2018, 13, 504–511. [Google Scholar] [CrossRef]
- Worsley, G.J.; Tourniaire, G.A.; Medlock, K.E.S.; Sartain, F.K.; Harmer, H.E.; Thatcher, M.; Horgan, A.M.; Pritchard, J. Measurement of glucose in blood with a phenylboronic acid optical sensor. J. Diabetes Sci. Technol. 2008, 2, 213–220. [Google Scholar] [CrossRef] [PubMed]
- Srivastava, S.K.; Abdulhalim, I. Spectral Interrogation based SPR Sensor for Blood Glucose Detection with Improved Sensitivity and Stability. J. Biosens. Bioelectron. 2015, 06, 10–12. [Google Scholar] [CrossRef]
- Badugu, R.; Reece, E.A.; Lakowicz, J.R. Glucose-sensitive silicone hydrogel contact lens toward tear glucose monitoring. J. Biomed. Opt. 2018, 23, 1. [Google Scholar] [CrossRef] [PubMed] [Green Version]
- Park, J.; Kim, J.; Kim, S.Y.; Cheong, W.H.; Jang, J.; Park, Y.G.; Na, K.; Kim, Y.T.; Heo, J.H.; Lee, C.Y.; et al. Soft, smart contact lenses with integrations of wireless circuits, glucose sensors, and displays. Sci. Adv. 2018, 4, 1–12. [Google Scholar] [CrossRef] [PubMed] [Green Version]
- Oh, S.Y.; Hong, S.Y.; Jeong, Y.R.; Yun, J.; Park, H.; Jin, S.W.; Lee, G.; Oh, J.H.; Lee, H.; Lee, S.S.; et al. Skin-Attachable, Stretchable Electrochemical Sweat Sensor for Glucose and pH Detection. ACS Appl. Mater. Interfaces 2018, 10, 13729–13740. [Google Scholar] [CrossRef]
- Wang, Y.; Wang, X.; Lu, W.; Yuan, Q.; Zheng, Y.; Yao, B. A thin film polyethylene terephthalate (PET) electrochemical sensor for detection of glucose in sweat. Talanta 2019, 198, 86–92. [Google Scholar] [CrossRef] [PubMed]
- Gu, X.; Wang, H.; Schultz, Z.D.; Camden, J.P. Sensing Glucose in Urine and Serum and Hydrogen Peroxide in Living Cells by Use of a Novel Boronate Nanoprobe Based on Surface-Enhanced Raman Spectroscopy. Anal. Chem. 2016, 88, 7191–7197. [Google Scholar] [CrossRef] [Green Version]
- Radhakumary, C.; Sreenivasan, K. Naked eye detection of glucose in urine using glucose oxidase immobilized gold nanoparticles. Anal. Chem. 2011, 83, 2829–2833. [Google Scholar] [CrossRef]
- Mudgal, N.; Saharia, A.; Agarwal, A.; Ali, J.; Yupapin, P.; Singh, G. Modeling of highly sensitive surface plasmon resonance (SPR) sensor for urine glucose detection. Opt. Quantum Electron. 2020, 52, 1–14. [Google Scholar] [CrossRef]
- Zhang, W; Wang, M.L. Saliva Glucose Monitoring System. U.S. patent 9244035B2, 26 January 2016.
- Lerner, M.B.; Kybert, N.; Mendoza, R.; Villechenon, R.; Bonilla Lopez, M.A.; Charlie Johnson, A.T. Scalable, non-invasive glucose sensor based on boronic acid functionalized carbon nanotube transistors. Appl. Phys. Lett. 2013, 102. [Google Scholar] [CrossRef] [Green Version]
- Jia, J.; Guan, W.; Sim, M.; Li, Y.; Li, H. Carbon nanotubes based glucose needle-type biosensor. Sensors 2008, 8, 1712–1718. [Google Scholar] [CrossRef] [Green Version]
- Chen, X.; Pan, H.; Liu, H.; Du, M. Nonenzymatic glucose sensor based on flower-shaped Au@Pd core-shell nanoparticles-ionic liquids composite film modified glassy carbon electrodes. Electrochim. Acta 2010, 56, 636–643. [Google Scholar] [CrossRef]
- Ni, P.; Sun, Y.; Shi, Y.; Dai, H.; Hu, J.; Wang, Y.; Li, Z. Facile fabrication of CuO nanowire modified Cu electrode for non-enzymatic glucose detection with enhanced sensitivity. RSC Adv. 2014, 4, 28842–28847. [Google Scholar] [CrossRef]
- Rossetti, P.; Bondia, J.; Vehí, J.; Fanelli, C.G. Estimating plasma glucose from interstitial glucose: The issue of calibration algorithms in commercial continuous glucose monitoring devices. Sensors 2010, 10, 10936–10952. [Google Scholar] [CrossRef] [PubMed]
- Rodbard, D. Continuous Glucose Monitoring: A Review of Successes, Challenges, and Opportunities. Diabetes Technol. Ther. 2016, 18, S23–S213. [Google Scholar] [CrossRef] [Green Version]
- Al Hayek, A.A.; Al Dawish, M.A. The Potential Impact of the FreeStyle Libre Flash Glucose Monitoring System on Mental Well-Being and Treatment Satisfaction in Patients with Type 1 Diabetes: A Prospective Study. Diabetes Ther. 2019, 10, 1239–1248. [Google Scholar] [CrossRef] [Green Version]
- Al Hayek, A.A.; Robert, A.A.; Al Dawish, M.A. Differences of FreeStyle Libre Flash Glucose Monitoring System and Finger Pricks on Clinical Characteristics and Glucose Monitoring Satisfactions in Type 1 Diabetes Using Insulin Pump. Clin. Med. Insights Endocrinol. Diabetes 2019, 12. [Google Scholar] [CrossRef] [PubMed] [Green Version]
- Mohammed, Z.H. The Fresnel Coefficient of Thin Film Multilayer Using Transfer Matrix Method TMM. IOP Conf. Ser. Mater. Sci. Eng. 2019, 518. [Google Scholar] [CrossRef]
- Zibaii, M.I.; Kazemi, A.; Latifi, H.; Azar, M.K.; Hosseini, S.M.; Ghezelaiagh, M.H. Measuring bacterial growth by refractive index tapered fiber optic biosensor. J. Photochem. Photobiol. B Biol. 2010, 101, 313–320. [Google Scholar] [CrossRef] [PubMed]
- Correia, R.; James, S.; Lee, S.W.; Morgan, S.P.; Korposh, S. Biomedical application of optical fibre sensors. J. Opt. 2018, 20. [Google Scholar] [CrossRef]
- Villatoro, J.; Monzón-Hernández, D.; Mejía, E. Fabrication and modeling of uniform-waist single-mode tapered optical fiber sensors. Appl. Opt. 2003, 42, 2278. [Google Scholar] [CrossRef]
- Tian, Y.; Wang, W.; Wu, N.; Zou, X.; Wang, X. Tapered optical fiber sensor for label-free detection of biomolecules. Sensors 2011, 11, 3780–3790. [Google Scholar] [CrossRef] [Green Version]
- Kieu, K.Q.; Mansuripur, M. Biconical fiber taper sensors. IEEE Photonics Technol. Lett. 2006, 18, 2239–2241. [Google Scholar] [CrossRef]
- Gravina, R.; Testa, G.; Bernini, R. Perfluorinated plastic optical fiber tapers for evanescent wave sensing. Sensors 2009, 9, 10423–10433. [Google Scholar] [CrossRef] [PubMed] [Green Version]
- Castle, P.F. Bend Loss Measurements on High Numerical Wavelength and Bend Radius. J. Light. Technol. 1986, LT-4, 34–40. [Google Scholar]
- Zhao, Y.; Zhao, H.; Lv, R.Q.; Zhao, J. Review of optical fiber Mach–Zehnder interferometers with micro-cavity fabricated by femtosecond laser and sensing applications. Opt. Lasers Eng. 2019, 117, 7–20. [Google Scholar] [CrossRef]
- Liu, T.; Chen, Y.; Han, Q.; Lu, X. Magnetic field sensor based on U-bent single-mode fiber and magnetic fluid. IEEE Photonics J. 2014, 6. [Google Scholar] [CrossRef]
- Nam, S.H.; Yin, S. High-temperature sensing using whispering gallery mode resonance in bent optical fibers. IEEE Photonics Technol. Lett. 2005, 17, 2391–2393. [Google Scholar] [CrossRef]
- Hassan, H.U.; Janting, J.; Aasmul, S.; Bang, O. Polymer Optical Fiber Compound Parabolic Concentrator Fiber Tip-Based Glucose Sensor: In Vitro Testing. IEEE Sens. J. 2016, 16, 8483–8488. [Google Scholar] [CrossRef]
- Hou, C.H.; Chiang, C.C.; Hsieh, T.S.; Li, Y.L.; Tsai, L.; Hsu, C.Y. Double-knotted U-shaped spiral optical fiber probe for measuring glucose solutions. Optik 2020, 207. [Google Scholar] [CrossRef]
- Teng, C.; Yu, F.; Deng, S.; Liu, H.; Yuan, L.; Zheng, J.; Deng, H. Displacement sensor based on a small U-shaped single-mode fiber. Sensors 2019, 19, 2531. [Google Scholar] [CrossRef] [Green Version]
- Yang, X.; Yuan, Y.; Dai, Z.; Liu, F.; Huang, J. Sensors and Actuators B: Chemical Optical property and adsorption isotherm models of glucose sensitive membrane based on prism SPR sensor. Sens. Actuators B. Chem. 2016, 237, 150–158. [Google Scholar] [CrossRef]
- Raether, H. Surface-Plasmons on Smooth and Rough Surfaces and on Gratings. Springer Tracts Mod. Phys. 1988, 111, 1–133. [Google Scholar]
- Monzon-Hernandez, D.; Velazquez-Gonzalez, J.S.; Luna-Moreno, D.; Torres-Cisneros, M.; Hernandez-Romano, I. Prism-based Surface Plasmon Resonance for Dual-Parameter Sensing. IEEE Sens. J. 2018, 1748, 1–8. [Google Scholar] [CrossRef]
- Deng, S.; Wang, P.; Yu, X. Phase-sensitive surface plasmon resonance sensors: Recent progress and future prospects. Sensors 2017, 17, 2819. [Google Scholar] [CrossRef] [Green Version]
- Li, D.C.; Wu, J.W.; Wu, P.; Lin, Y.; Sun, Y.J.; Zhu, R.; Yang, J.; Xu, K.X. Glucose measurement using surface plasmon resonance sensor with affinity based surface modification by borate polymer. In Proceedings of the 2015 Transducers–2015 18th International Conference on Solid-State Sensors, Actuators and Microsystems (TRANSDUCERS), Anchorage, AK, USA, 21–25 June 2015. [Google Scholar]
- Zhang, A.P.; Gao, S.; Yan, G.; Bai, Y. Photonic Sensors Advances in Optical Fiber Bragg Grating Sensor Technologies. Photon-Sensors 2012, 2, 1–13. [Google Scholar] [CrossRef] [Green Version]
- Kurasawa, S.; Koyama, S. Verification of Non-Invasive Blood Glucose Measurement Method Based on Pulse Wave Signal Detected by FBG Sensor System. Sensors 2017, 17, 2702. [Google Scholar] [CrossRef] [Green Version]
- Lamberti, A.; Luyckx, G.; Van Paepegem, W.; Rezayat, A.; Vanlanduit, S. Detection, Localization and Quantification of Impact Events on a Stiffened Composite Panel with Embedded Fiber Bragg Grating Sensor Networks. Sensors 2017, 17, 743. [Google Scholar] [CrossRef] [Green Version]
- Series, C. Simple Glucose Measurement System Based on Uncladded Fiber Bragg Grating Etched with Nitric Acid Simple Glucose Measurement System Based on Uncladded Fiber Bragg Grating Etched with Nitric Acid. J. Phys. Conf. Ser. 2019. [Google Scholar] [CrossRef]
- Siddiq, N.A.; Asnawi, A.; Goshals, S.K.; Pramono, Y.H. Optical Spectrum of Uncladded Fiber Bragg Grating for Glucose Concentration Measurement Optical Spectrum of Uncladded Fiber Bragg Grating for Glucose Concentration Measurement. J. Phys. Conf. Ser. 2020. [Google Scholar] [CrossRef]
- Sridevi, S.; Vasu, K.S.; Sampath, S.; Asokan, S.; Sood, A.K. Optical detection of glucose and glycated hemoglobin using etched fiber Bragg gratings coated with functionalized reduced graphene oxide. J. Biophotonics 2015, 10, 1–10. [Google Scholar] [CrossRef] [PubMed]
- Hang, X.U.Z.; Iu, F.U.L.; Iangqiang, Q.F.U.; Hen, X.I.C.; Ian, J.X.U.; Hang, Z.H.Z.; Uang, Y.U.H.; Ang, Y.O.N.G.T.; Uan, T.; Uo, G.; et al. Hydrogen peroxide and glucose concentration measurement using optical fiber grating sensors with corrodible plasmonic nanocoatings. Biomed. Opt. Express 2018, 9, 225–231. [Google Scholar]
- Lobry, M.; Lahem, D.; Loyez, M.; Debliquy, M.; Chah, K.; David, M.; Caucheteur, C. Non-enzymatic D-glucose plasmonic optical fi ber grating biosensor. Biosens. Bioelectron. 2019, 142, 111506. [Google Scholar] [CrossRef] [Green Version]
- Jiang, B.; Zhou, K.; Wang, C.; Sun, Q.; Yin, G. Label-free glucose biosensor based on enzymatic graphene oxide-functionalized tilted fiber grating. Sens. Actuators B Chem. 2018, 254, 1033–1039. [Google Scholar] [CrossRef]
- Saxl, T.; Khan, F.; Ferla, M.; Birch, D.; Pickup, J. A fluorescence lifetime-based fibre-optic glucose sensor using glucose/galactose-binding protein. Analyst 2011, 136, 968–972. [Google Scholar] [CrossRef] [Green Version]
- Singh, S.; Gupta, B.D. Fabrication and characterization of a surface plasmon resonance based fiber optic sensor using gel entrapment technique for the detection of low glucose concentration. Sens. Actuators B Chem. 2013, 177, 589–595. [Google Scholar] [CrossRef]
- Li, D.; Wu, J.; Wu, P.; Lin, Y.; Sun, Y.; Zhu, R.; Yang, J.; Xu, K. Affinity based glucose measurement using fiber optic surface plasmon resonance sensor with surface modification by borate polymer. Sens. Actuators B Chem. 2015, 213, 295–304. [Google Scholar] [CrossRef]
- Milenko, K.; Fuglerud, S.S.; Jernelv, I.L.; Aksnes, A.; Ellingsen, R.; Hjelme, D.R. Towards fiber-optic Raman spectroscopy for glucose sensing. Opt. InfoBase Conf. Pap. 2018, Part F98-B, 1–2. [Google Scholar] [CrossRef]
- Trettnak, W.; Wolfbeis, O.S. A fully reversible fiber optic glucose biosensor based on the intrisic fluorescense of glucose oxidase. Fresenius’ Z. für Anal. Chem. 1989, 334, 427–430. [Google Scholar] [CrossRef]
- Binu, S.; Mahadevan Pillai, V.P.; Pradeepkumar, V.; Padhy, B.B.; Joseph, C.S.; Chandrasekaran, N. Fibre optic glucose sensor. Mater. Sci. Eng. C 2009, 29, 183–186. [Google Scholar] [CrossRef]
- Qiu, H.W.; Xu, S.C.; Jiang, S.Z.; Li, Z.; Chen, P.X.; Gao, S.S.; Zhang, C.; Feng, D.J. A novel graphene-based tapered optical fiber sensor for glucose detection. Appl. Surf. Sci. 2015, 329, 390–395. [Google Scholar] [CrossRef]
- Verma, R.; Gupta, B.D. A novel approach for simultaneous sensing of urea and glucose by SPR based optical fiber multianalyte sensor. Analyst 2014, 139, 1449–1455. [Google Scholar] [CrossRef] [PubMed]
- Tiangco, C.; Fon, D.; Sardesai, N.; Kostov, Y.; Sevilla, F.; Rao, G.; Tolosa, L. Fiber optic biosensor for transdermal glucose based on the glucose binding protein. Sens. Actuators B Chem. 2017, 242, 569–576. [Google Scholar] [CrossRef]
- Yunianto, M.; Eka, D.; Permata, A.N.; Ariningrum, D.; Wahyuningsih, S.; Marzuki, A. Development and testing of a plastic optical fiber grating biosensor for detection of glucose in the blood. J. Phys. Conf. Ser. 2016, 755. [Google Scholar] [CrossRef]
- Zhao, M.; Dai, L.; Zhong, N.; Wang, Z.; Chen, M.; Li, B.; Luo, B.; Tang, B.; Shi, S.; Song, T.; et al. Wet etching technique for fabrication of a high-quality plastic optical fiber sensor. Appl. Opt. 2017, 56, 8845. [Google Scholar] [CrossRef] [PubMed]
- Azkune, M.; Ruiz-Rubio, L.; Aldabaldetreku, G.; Arrospide, E.; Pérez-Álvarez, L.; Bikandi, I.; Zubia, J.; Vilas-Vilela, J.L. U-shaped and surface functionalized polymer optical fiber probe for glucose detection. Sensors 2018, 18, 34. [Google Scholar] [CrossRef] [PubMed] [Green Version]
- Azkune, M.; Frosch, T.; Arrospide, E.; Aldabaldetreku, G.; Bikandi, I.; Zubia, J.; Popp, J.; Frosch, T. Liquid-Core Microstructured Polymer Optical Fiber as Fiber-Enhanced Raman Spectroscopy Probe for Glucose Sensing. J. Light. Technol. 2019, 37, 2981–2988. [Google Scholar] [CrossRef]
- Asher, S.A.; Alexeev, V.L.; Goponenko, A.V.; Sharma, A.C.; Lednev, I.K.; Wilcox, C.S.; Finegold, D.N. Photonic crystal carbohydrate sensors: Low ionic strength sugar sensing. J. Am. Chem. Soc. 2003, 125, 3322–3329. [Google Scholar] [CrossRef]
- Mohamed, M.S.; Hameed, M.F.O.; Areed, N.F.F.; El-Okr, M.M.; Obayya, S.S.A. Analysis of highly sensitive photonic crystal biosensor for glucose monitoring. Appl. Comput. Electromagn. Soc. J. 2016, 31, 836–842. [Google Scholar]
- Azab, M.Y.; Hameed, M.F.; Heikal, A.M.; Obayya, S.S.; Swillam, M.A. Surface Plasmon Photonic Crystal Fiber Biosensor for Glucose Monitoring. Opt. Quantum Electron. 2017, 49, 5. [Google Scholar] [CrossRef]
- Natesan, A.; Kuppusamy, P.G.; Gopal, T.R.; Dhasarathan, V.; Aly, A.H. Tricore photonic crystal fibre based refractive index sensor for glucose detection. IET Optoelectron. 2019, 13, 118–123. [Google Scholar] [CrossRef]
- Hossain, M.; Podder, E.; Adhikary, A.; Al-Mamun, A. Optimized Hexagonal Photonic Crystal Fibre Sensor for Glucose Sensing. Adv. Res. 2018, 13, 1–7. [Google Scholar] [CrossRef]
- Rosenzweig, Z.; Kopelman, R. Analytical properties of miniaturized oxygen and glucose fiber optic sensors. Sens. Actuators B Chem. 1996, 36, 475–483. [Google Scholar] [CrossRef]
- Yin, M.; Huang, B.; Gao, S.; Zhang, A.P.; Ye, X. Optical fiber LPG biosensor integrated microfluidic chip for ultrasensitive glucose detection. Biomed. Opt. Express 2016, 7, 2067. [Google Scholar] [CrossRef] [Green Version]
- Fang, Y.L.; Wang, C.T.; Chiang, C.C. A small U-Shaped bending-induced interference optical fiber sensor the measurement of glucose solutions. Sensors 2016, 16, 1460. [Google Scholar] [CrossRef] [PubMed] [Green Version]
- Sun, X.; Li, N.; Zhou, B.; Zhao, W.; Liu, L.; Huang, C.; Ma, L.; Kost, A.R. Non-enzymatic glucose detection based on phenylboronic acid modified optical fibers. Opt. Commun. 2018, 416, 32–35. [Google Scholar] [CrossRef]
- Aruna Gandhi, M.S.; Liu, X.; Li, Q. D-glucose Sensing Fiber Optic D-type Microbiosensor. Asia Commun. Photonics Conf. ACP 2018, 2018, 1–3. [Google Scholar] [CrossRef]
- Novais, S.; Ferreira, C.I.A.; Ferreira, M.S.; Pinto, J.L. Optical Fiber Tip Sensor for the Measurement of Glucose Aqueous Solutions. IEEE Photonics J. 2018, 10. [Google Scholar] [CrossRef]
- Khan, M.R.R.; Watekar, A.V.; Kang, S.W. Fiber-Optic Biosensor to Detect pH and Glucose. IEEE Sens. J. 2018, 18, 1528–1538. [Google Scholar] [CrossRef]
- Smith, J.L. The Pursuit of Noninvasive Glucose: Hunting the Deceitful Turkey. Available online: https://www.researchgate.net/publication/215519631_The_Pursuit_of_Noninvasive_Glucose_Hunting_the_Deceitful_Turkey (accessed on 15 January 2021).
- Purvinis, G.; Cameron, B.D.; Altrogge, D.M. Noninvasive polarimetric-based glucose monitoring: An in vivo study. J. Diabetes Sci. Technol. 2011, 5, 380–387. [Google Scholar] [CrossRef] [PubMed] [Green Version]
- Winkler, A.M.; Bonnema, G.T.; Barton, J.K. Optical polarimetry for noninvasive glucose sensing enabled by Sagnac interferometry. Appl. Opt. 2011, 50, 2719–2731. [Google Scholar] [CrossRef] [PubMed]
- Ahmad, R.; Tripathy, N.; Ahn, M.S.; Bhat, K.S.; Mahmoudi, T.; Wang, Y.; Yoo, J.Y.; Kwon, D.W.; Yang, H.Y.; Hahn, Y.B. Highly Efficient Non-Enzymatic Glucose Sensor Based on CuO Modified Vertically-Grown ZnO Nanorods on Electrode. Sci. Rep. 2017, 7, 1–10. [Google Scholar] [CrossRef] [PubMed] [Green Version]
- Vega, K.; Jiang, N.; Liu, X.; Kan, V.; Barry, N.; Maes, P.; Yetisen, A.; Paradiso, J. The dermal abyss: Interfacing with the skin by tattooing biosensors. Proc. Int. Symp. Wearable Comput. ISWC 2017, Part F1305, 138–145. [Google Scholar] [CrossRef]
- Szmacinski, H.; Lakowicz, J.R. Fluorescence lifetime-based sensing and imaging. Sens. Actuators B Chem. 1995, 29, 16–24. [Google Scholar] [CrossRef]
- Klonoff, D.C. Overview of Fluorescence Glucose Sensing. J. Diabetes Sci. Technol. 2012, 6, 1242–1250. [Google Scholar] [CrossRef] [Green Version]
- Oliver, N.S.; Toumazou, C.; Cass, A.E.G.; Johnston, D.G. Glucose sensors: A review of current and emerging technology. Diabetes Med. 2009, 197–210. [Google Scholar] [CrossRef]
- Maruo, K.; Oota, T.; Tsurugi, M.; Arimoto, H.; Tamura, M.; Ozaki, Y. New Methodology to Obtain a Calibration Model for Noninvasive Near-Infrared Blood Glucose Monitoring. Appl. Spectrosc. 2006, 60, 441–449. [Google Scholar] [CrossRef]
- Gourzi, M.; Rouane, A.; Guelaz, R.; Alavi, M.S.; Mchugh, M.B.; Nadi, M.; Roth, P. Non-invasive glycaemia blood measurements by electromagnetic sensor: Study in static and dynamic blood circulation. J. Med Eng. Technol. 2005, 29, 22–26. [Google Scholar] [CrossRef] [PubMed]
- Jahangiri, N. Non-invasive Optical Techniques for determination of blood Glucose levels: A Review Article. Iran. J. Med. Phys. 2014, 11, 224–232. [Google Scholar]
- Achao, D.L.I.; Ie, J.S.U.; Ang, J.I.A.Y.; Onglin, S.Y.U.; Hang, J.I.Z.; Exin, K.; Aixia, H.Y.U. Optical surface plasmon resonance sensor modified by mutant glucose/galactose-binding protein for affinity detection of glucose molecules. Biomed. Opt. Express 2017, 8, 51–57. [Google Scholar]
- Thoniyot, P.; Cappuccio, F.E.; Gamsey, S.; Cordes, D.B.; Wessling, R.A.; Singaram, B. Continuos glucose sensing with fluorescent thin-film hydrogels.2. fiber optic sensor fabrication and in vitro testing. Diabetes Technol. Ther. 2006, 8, 279–287. [Google Scholar] [CrossRef]
- Fallauto, C.; Perrone, G.; Vallan, A.; Member, S. Impact of Optical Fiber Characteristics in SPR Sensors for Continuous Glucose Monitoring. In Proceedings of the 2014 IEEE International Symposium on Medical Measurements and Applications (MeMeA), Lisbon, Portugal, 11–12 June 2014; pp. 5–9. [Google Scholar]
- Yuan, Y.I.Y.; Yang, X.I.Y.; Gong, D.E.G.; Liu, F.A.N.G.L.; Wenbin, W.H.U.; Cai, W.E.C.; Huang, J.U.N.H.; Ang, M. inghong Y. Investigation for terminal reflection optical fiber SPR glucose sensor and glucose sensitive membrane with immobilized GODs. Opt. Express 2017, 25, 512–518. [Google Scholar] [CrossRef] [PubMed]


| Sensor Fibers Technology | Advantages | Disadvantages |
|---|---|---|
| Fluorescence | Immune to light spreading of tissue | Short useful life |
| High specificity | Toxicity problems | |
| Sensitive to very small concentrations of glucose | Noticeable to interference | |
| Spectroscopy | Absorption band specifies | Fake readings |
| High specificity | Strong water absorption | |
| Low level of penetration | ||
| Temperature-susceptible | ||
| Electromagnetic | Single-frequency use | Very sensitive to temperature |
| No risk of ionization | Sensitive to electromagnetic fields | |
| SPR | They are not susceptible to electromagnetic interference | Calibration process |
| They’re not disposable. | Temperature sensitive | |
| Very sensitive to small changes in glucose | Sensitive to movement | |
| Instant results | Bulky in size | |
| Minimally invasive | ||
| Continuous monitoring |
| Type of Fiber | Parameters | Ref | |||||
|---|---|---|---|---|---|---|---|
| Sensing System | Detection Range | Dynamic Range | Immobilization Structure | Response Time | Sensitivity | ||
| MMF | In the extreme | N/A | 45–360 mg/dL | Boronic acid with fluorescent dye | 5 min | N/A | [113] |
| In the extreme | 542 nm | 0–100 mM | Agarose or polystyrene | 1 h | N/A | [76] | |
| Middle area | 600–750 nm | 0–260 mg/dL | Silver and Sicilian | 60 s | N/A | [77] | |
| Middle area | N/A | N/A | gold | N/A | 3632 nm/RIU | [114] | |
| Middle area | 625–668 nm | 1–300 mg/dL | Borate chromium gold polymer | N/A | N/A | [78] | |
| N/A | 625–700 nm | 0–500 nm/dL | Glucose oxidase and polyacrylamide | 22 s | 0.14 nm/(mg/dL) | [115] | |
| In the extreme | N 785 nm | 0–1110 mM | N/A | 10–20 s | N/A | [79] | |
| PCF | N/A | 496–624 nm | 0–100 mM | Boronic acid | N/A | N/A | [89] |
| N/A | 1400–1420 nm | 30–330 g/L | N/A | N/A | 422 nm/RIU | [90] | |
| In extreme | 600–750 nm | 40–400 mg/dL | N/A | N/A | N/A | [59] | |
| N/A | 1663–1665 nm | N/A | gold | N/A | 200 nm/RIU | [91] | |
| N/A | 440–470 nm | 10–20 g/L | Silicon substrate | N/A | 23,267.33 nm/RIU | [92] | |
| N/A | 1200–1600 nm | 20–60 % | N/A | N/A | N/A | [93] | |
| N/A | 4950–6930 nm | 10–40 g/L | N/A | N/A | 6930.6 nm/RIU | [20] | |
| POF | In extreme | 450–500 nm | 1.5–2 mM | Glucose oxidase | 2–30 min | N/A | [80] |
| In extreme | 660 nm | 0–25 g/dL | N/A | N/A | 0.0072 V/wt | [81] | |
| Middle area | 620–635 nm | 1–40% | Graphene | N/A | N/A | [82] | |
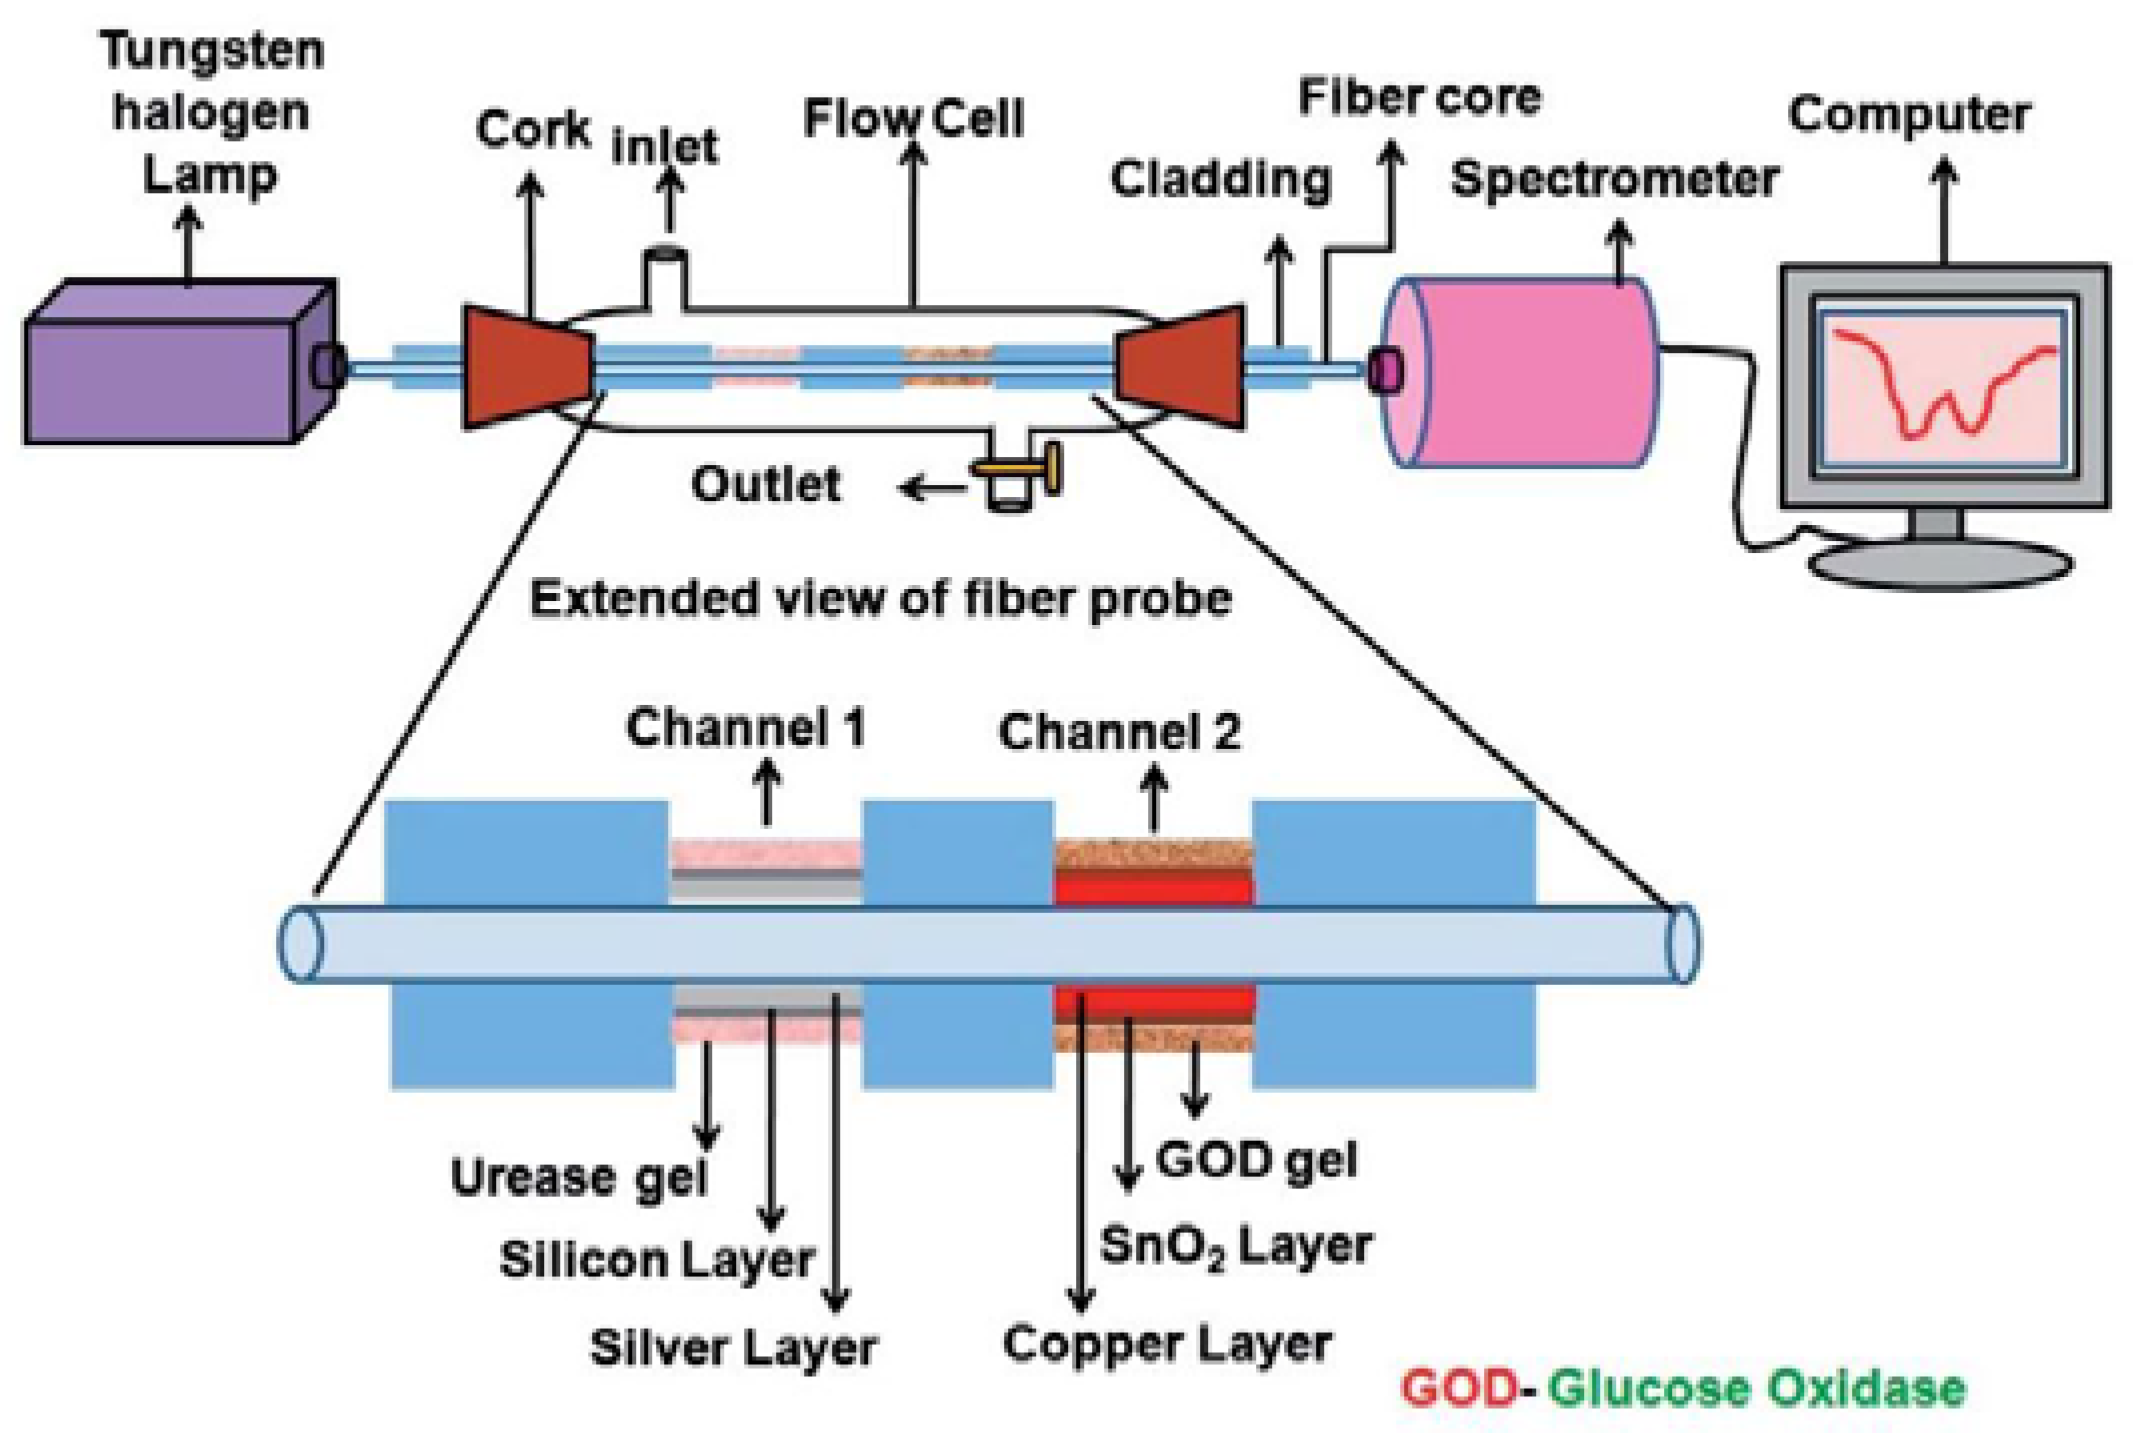
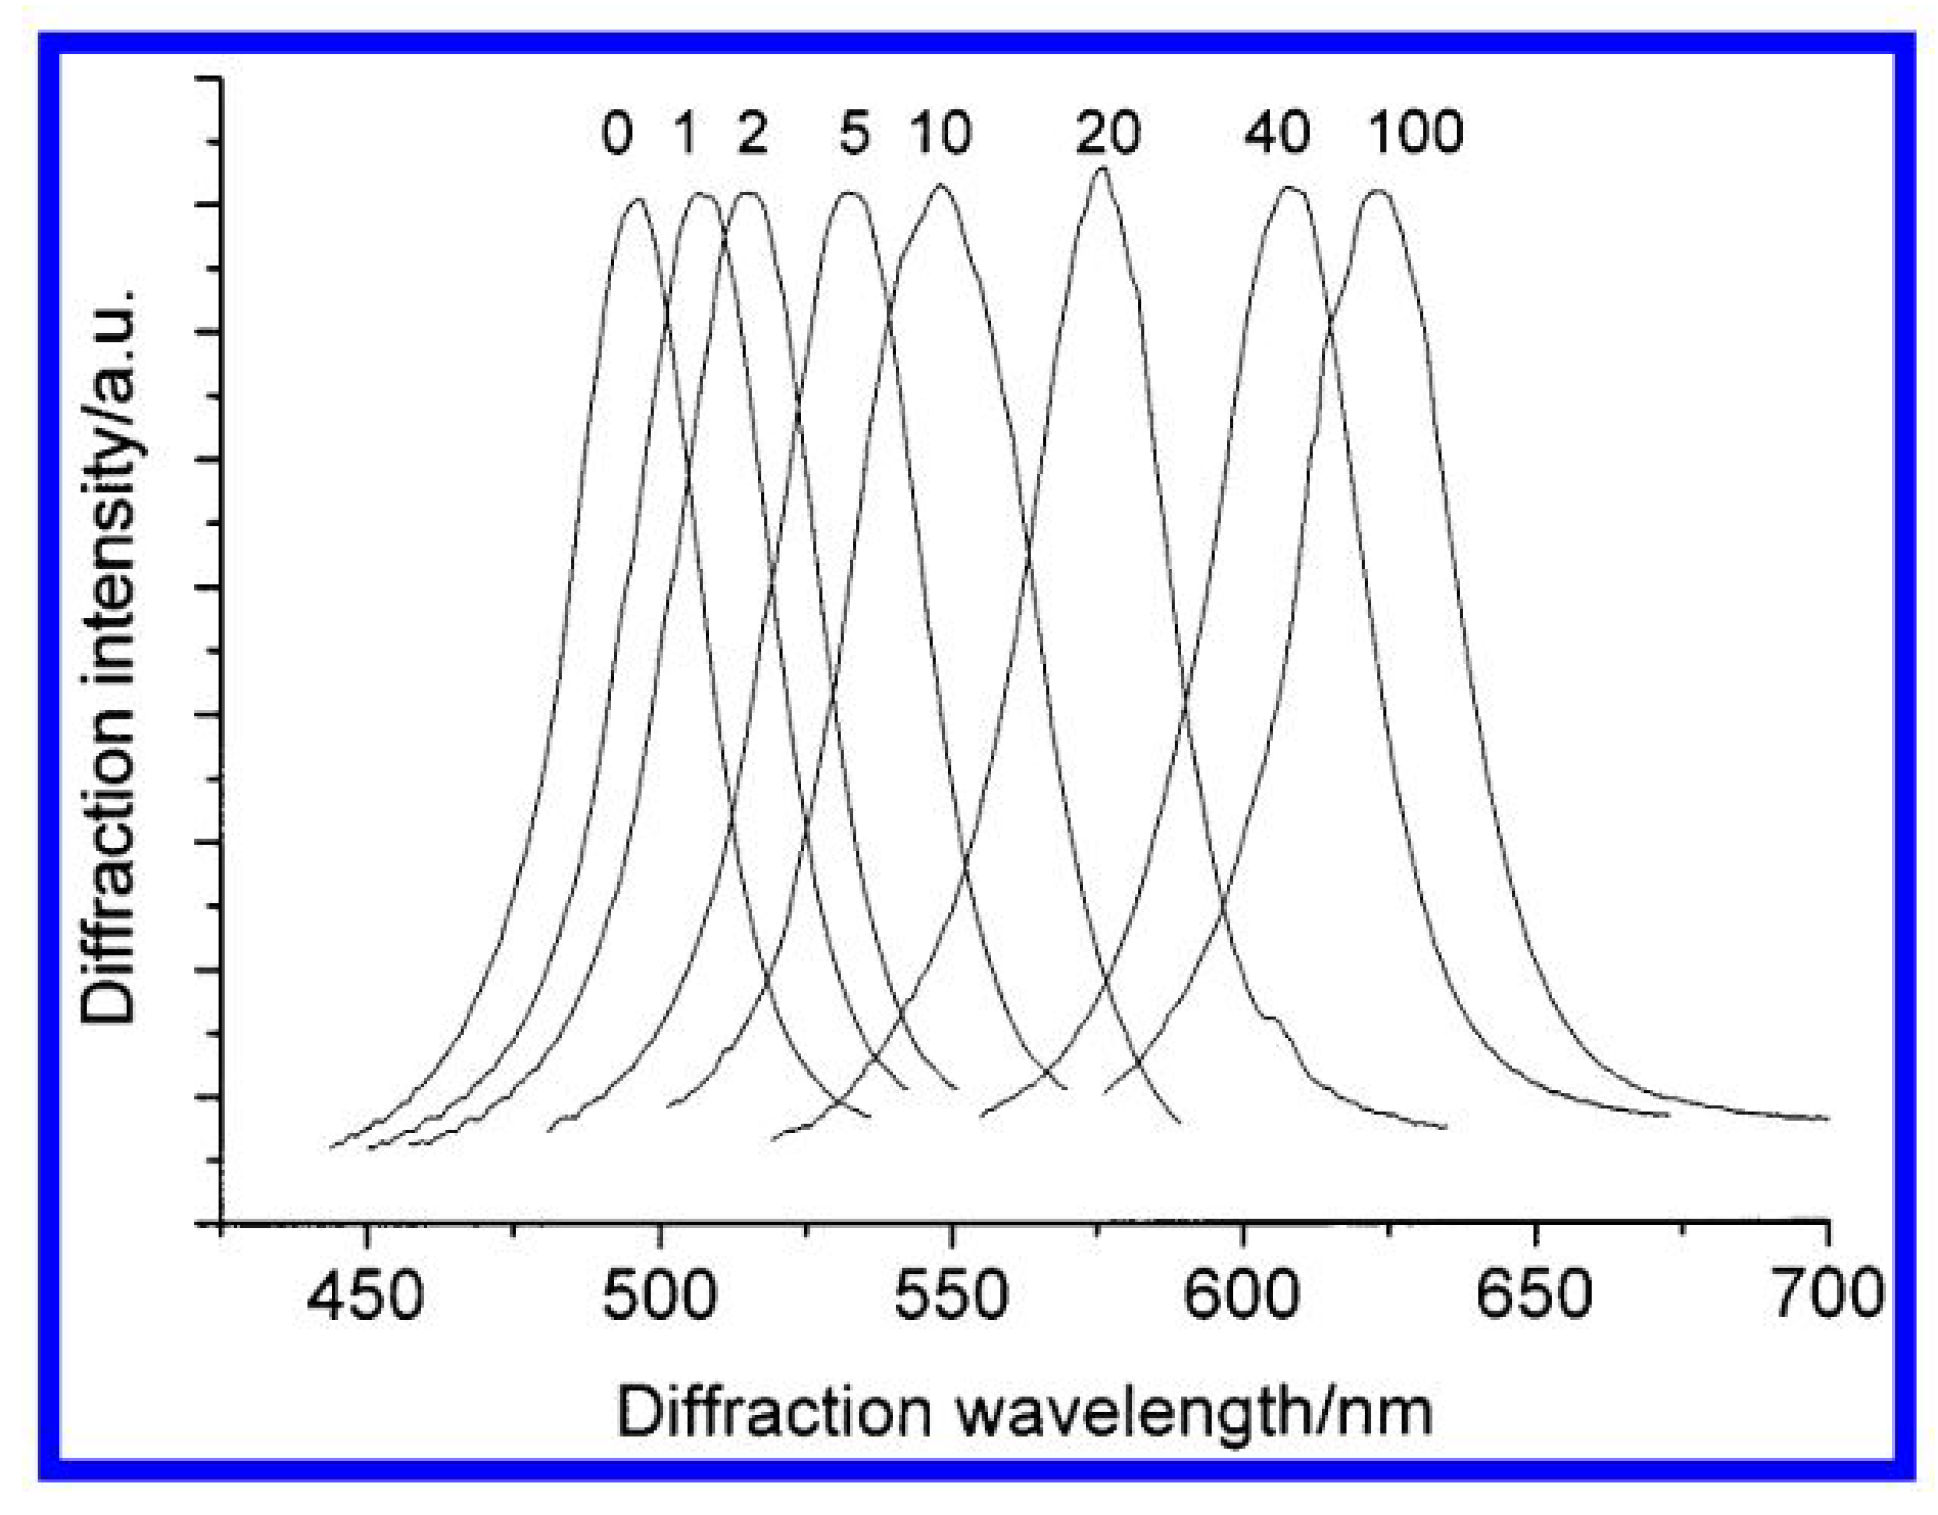
| Middle area | 500–800 nm | 0–260 mg/dL | copper and tin oxide | N/A | N/A | [83] | |
| In extreme | 366–540 nm | 4–20 mM | NI-NTA Agarose Beads | 50 s | 2.888 ± 0.08085 | [84] | |
| Middle area | 581 nm | 81.2–235.1 mg/dL | N/A | N/A | N/A | [85] | |
| Middle area | 500–750 nm | 10–80% | Acetic acid | N/A | 9.10 [(RIU)(g/L)]−1 | [86] | |
| In extreme | N/A | 0–25 mM | methyl methacrylate | 10 s | N/A | [87] | |
| Middle area | 450–500 nm | N/A | Methyl methacrylate | N/A | N/A | [88] | |
| SMF | In extreme | 488 nm | 0.7–10 mM | Methylene chloride | 1.5 s | N/A | [94] |
| Middle area | 500–550 nm | N/A | gold | N/A | 13.09 AU/RIU | [25] | |
| Middle area | 1510–1520 nm | 2–10 µM | Glucose oxidase | 6 min–70 s | 205 nm/RIU | [95] | |
| Middle area | 1490–1532 nm | 6–30% | N/A | N/A | 0.85 dB | [96] | |
| In extreme | 1545–1560 nm | 0–60% | Hydrofluoridric acid | N/A | 1467.59 nm/RIU | [99] | |
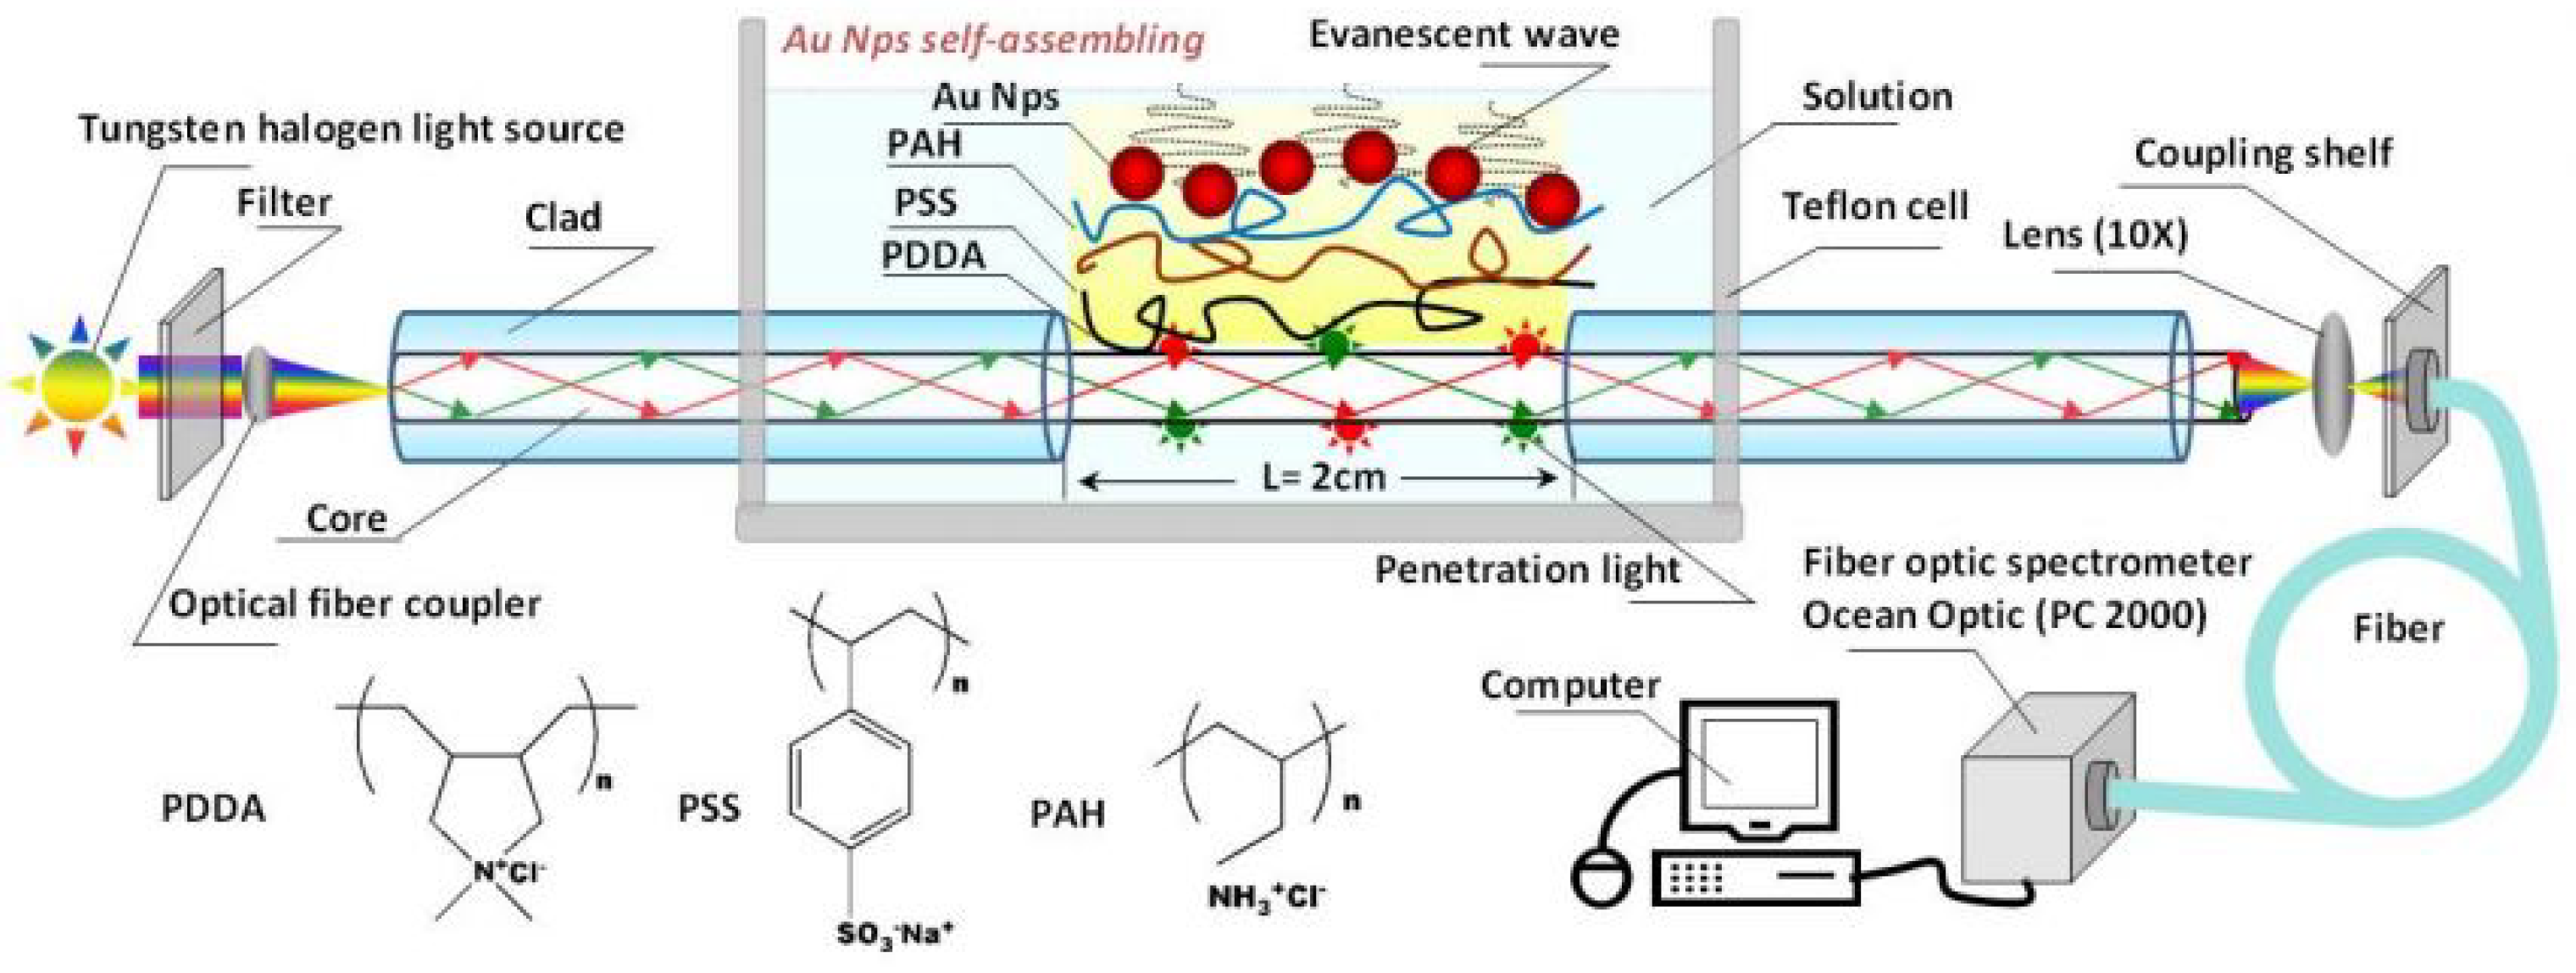
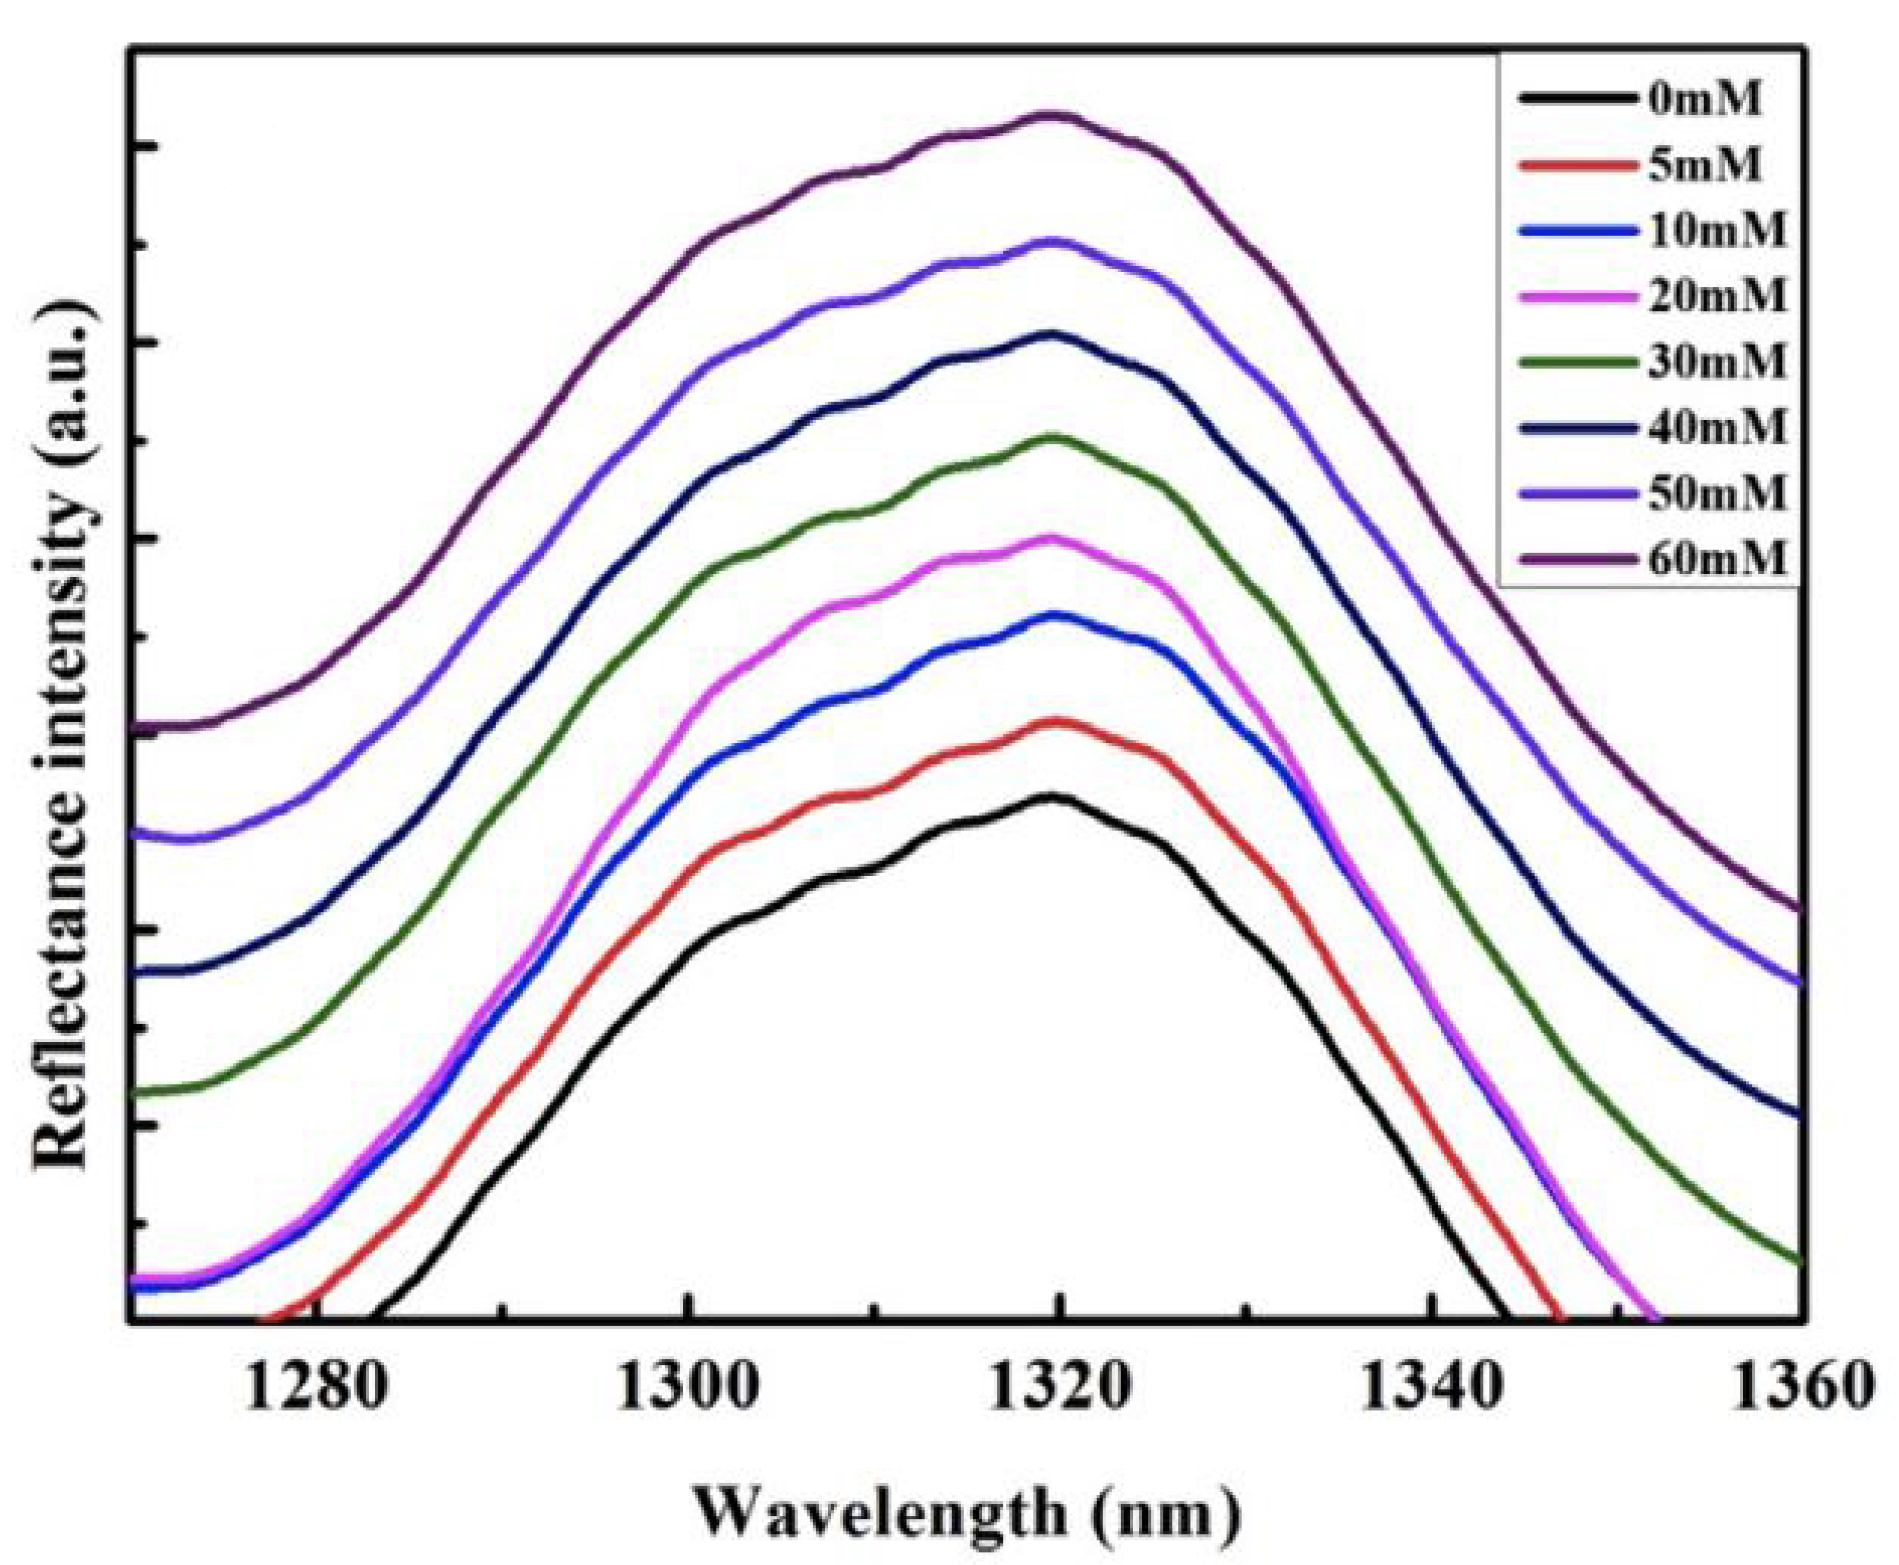
| In extreme | 1280–1340 nm | 0–60 mM | Hydrofluoridric acid | N/A | 0.1787%/nM | [97] | |
| Middle area | 880 nm | 10–50% | Gold | N/A | 12820 nm/RIU | [98] | |
| In extreme | 820–920 nm | 1 µM–1 M | Gold | 8–9 s | 3.25 nm/mM | [100] | |
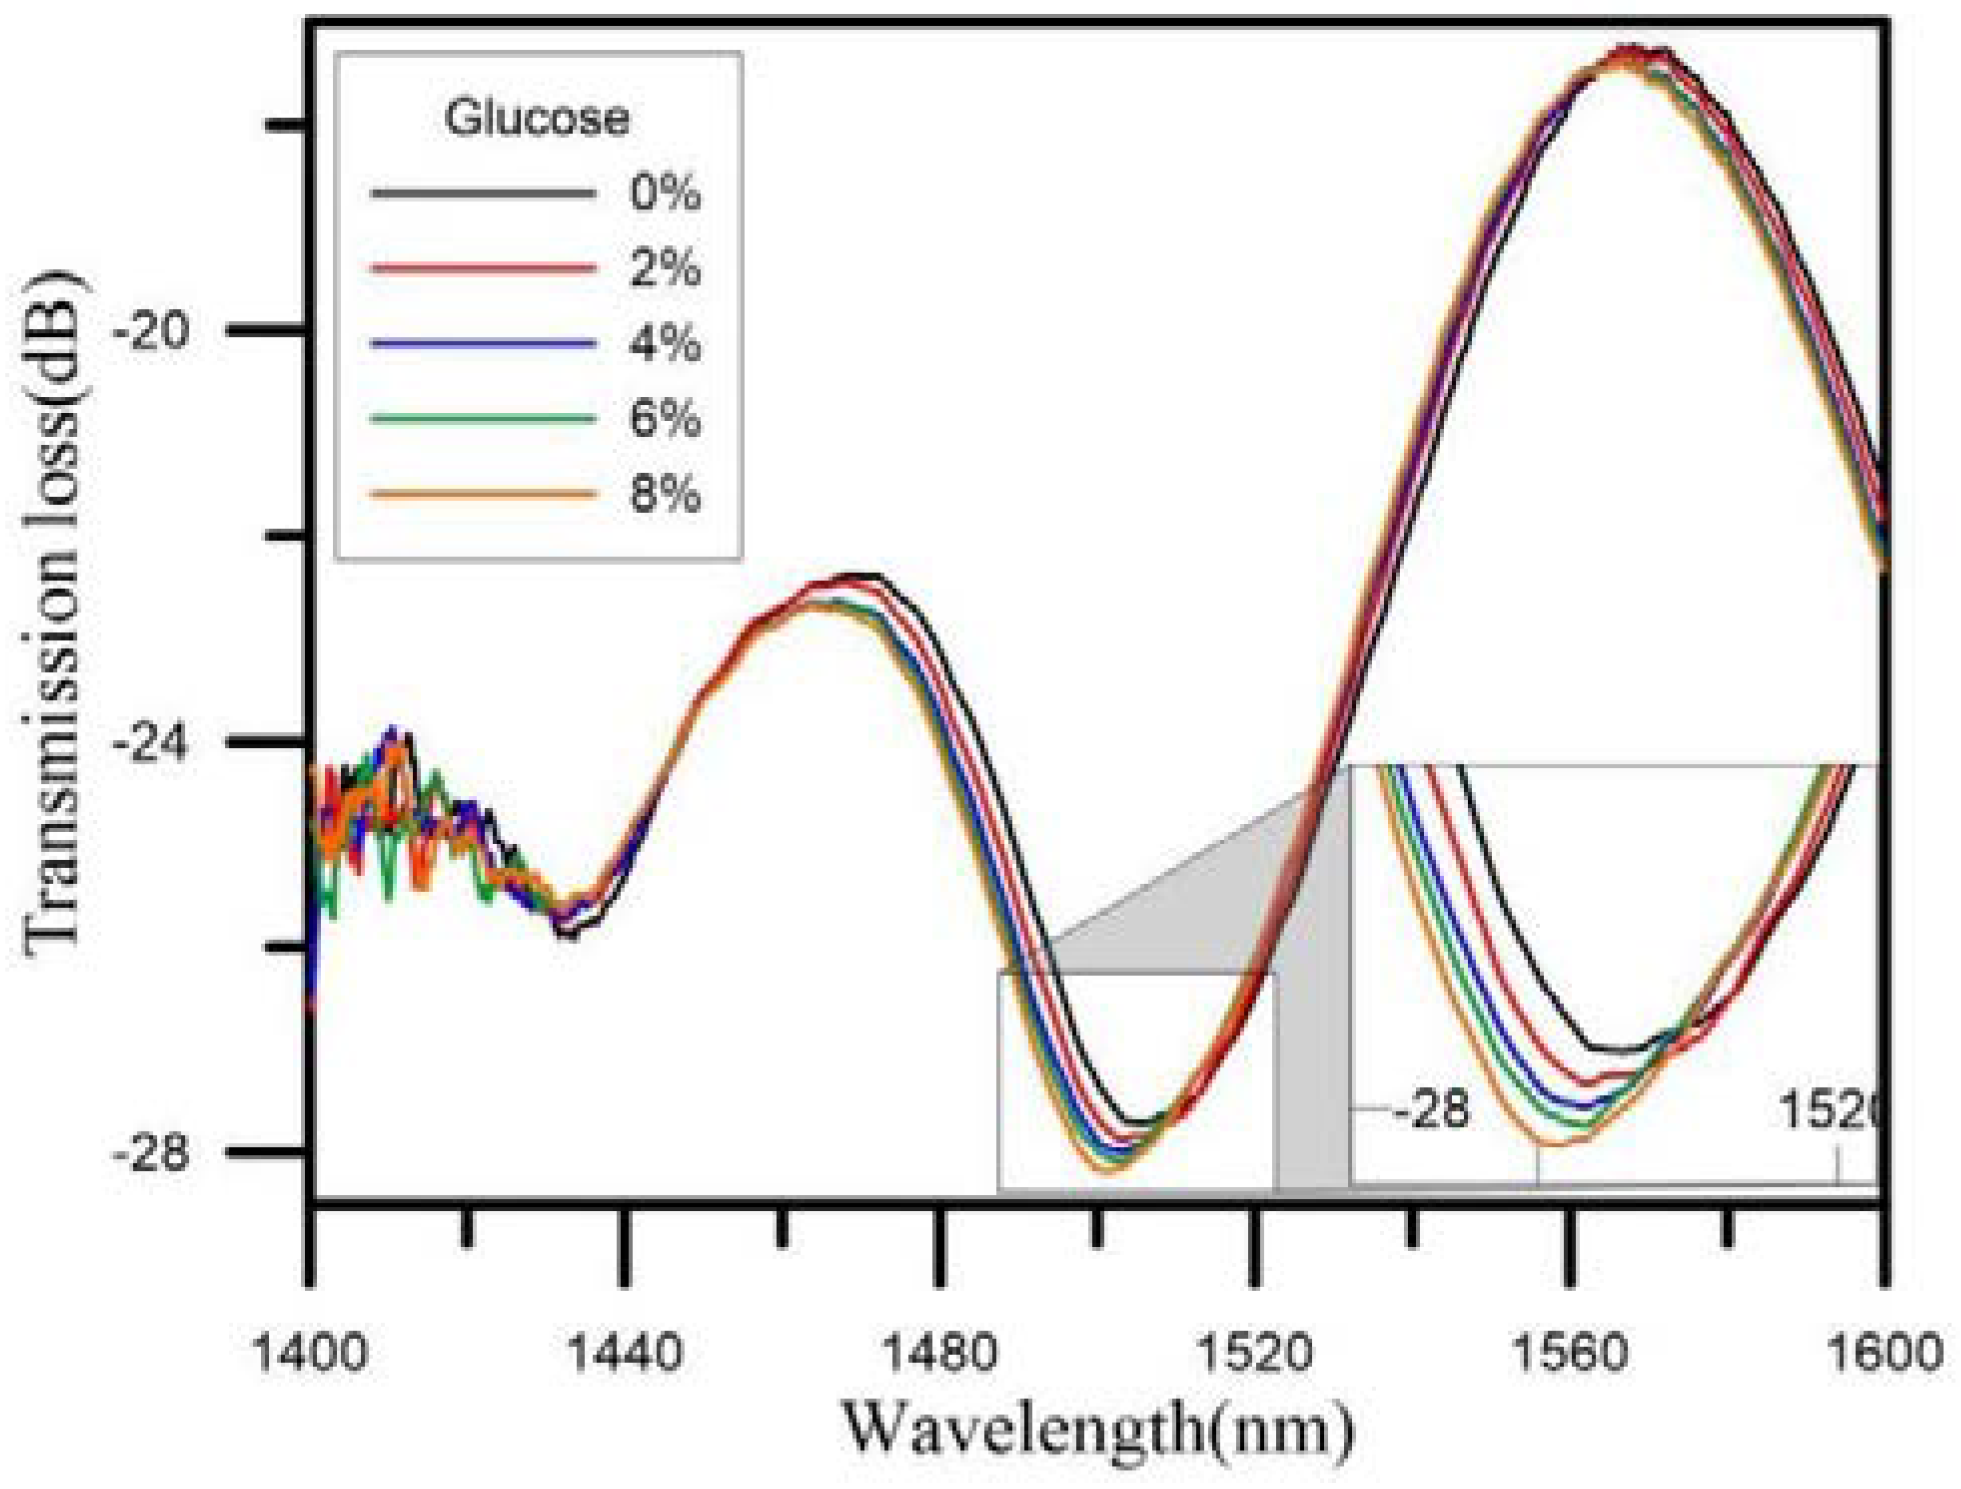
| Middle area | 1480–1520 nm | 0–8% | Gold and Glucose oxidase | N/A | 5.101 dB/% | [23] | |
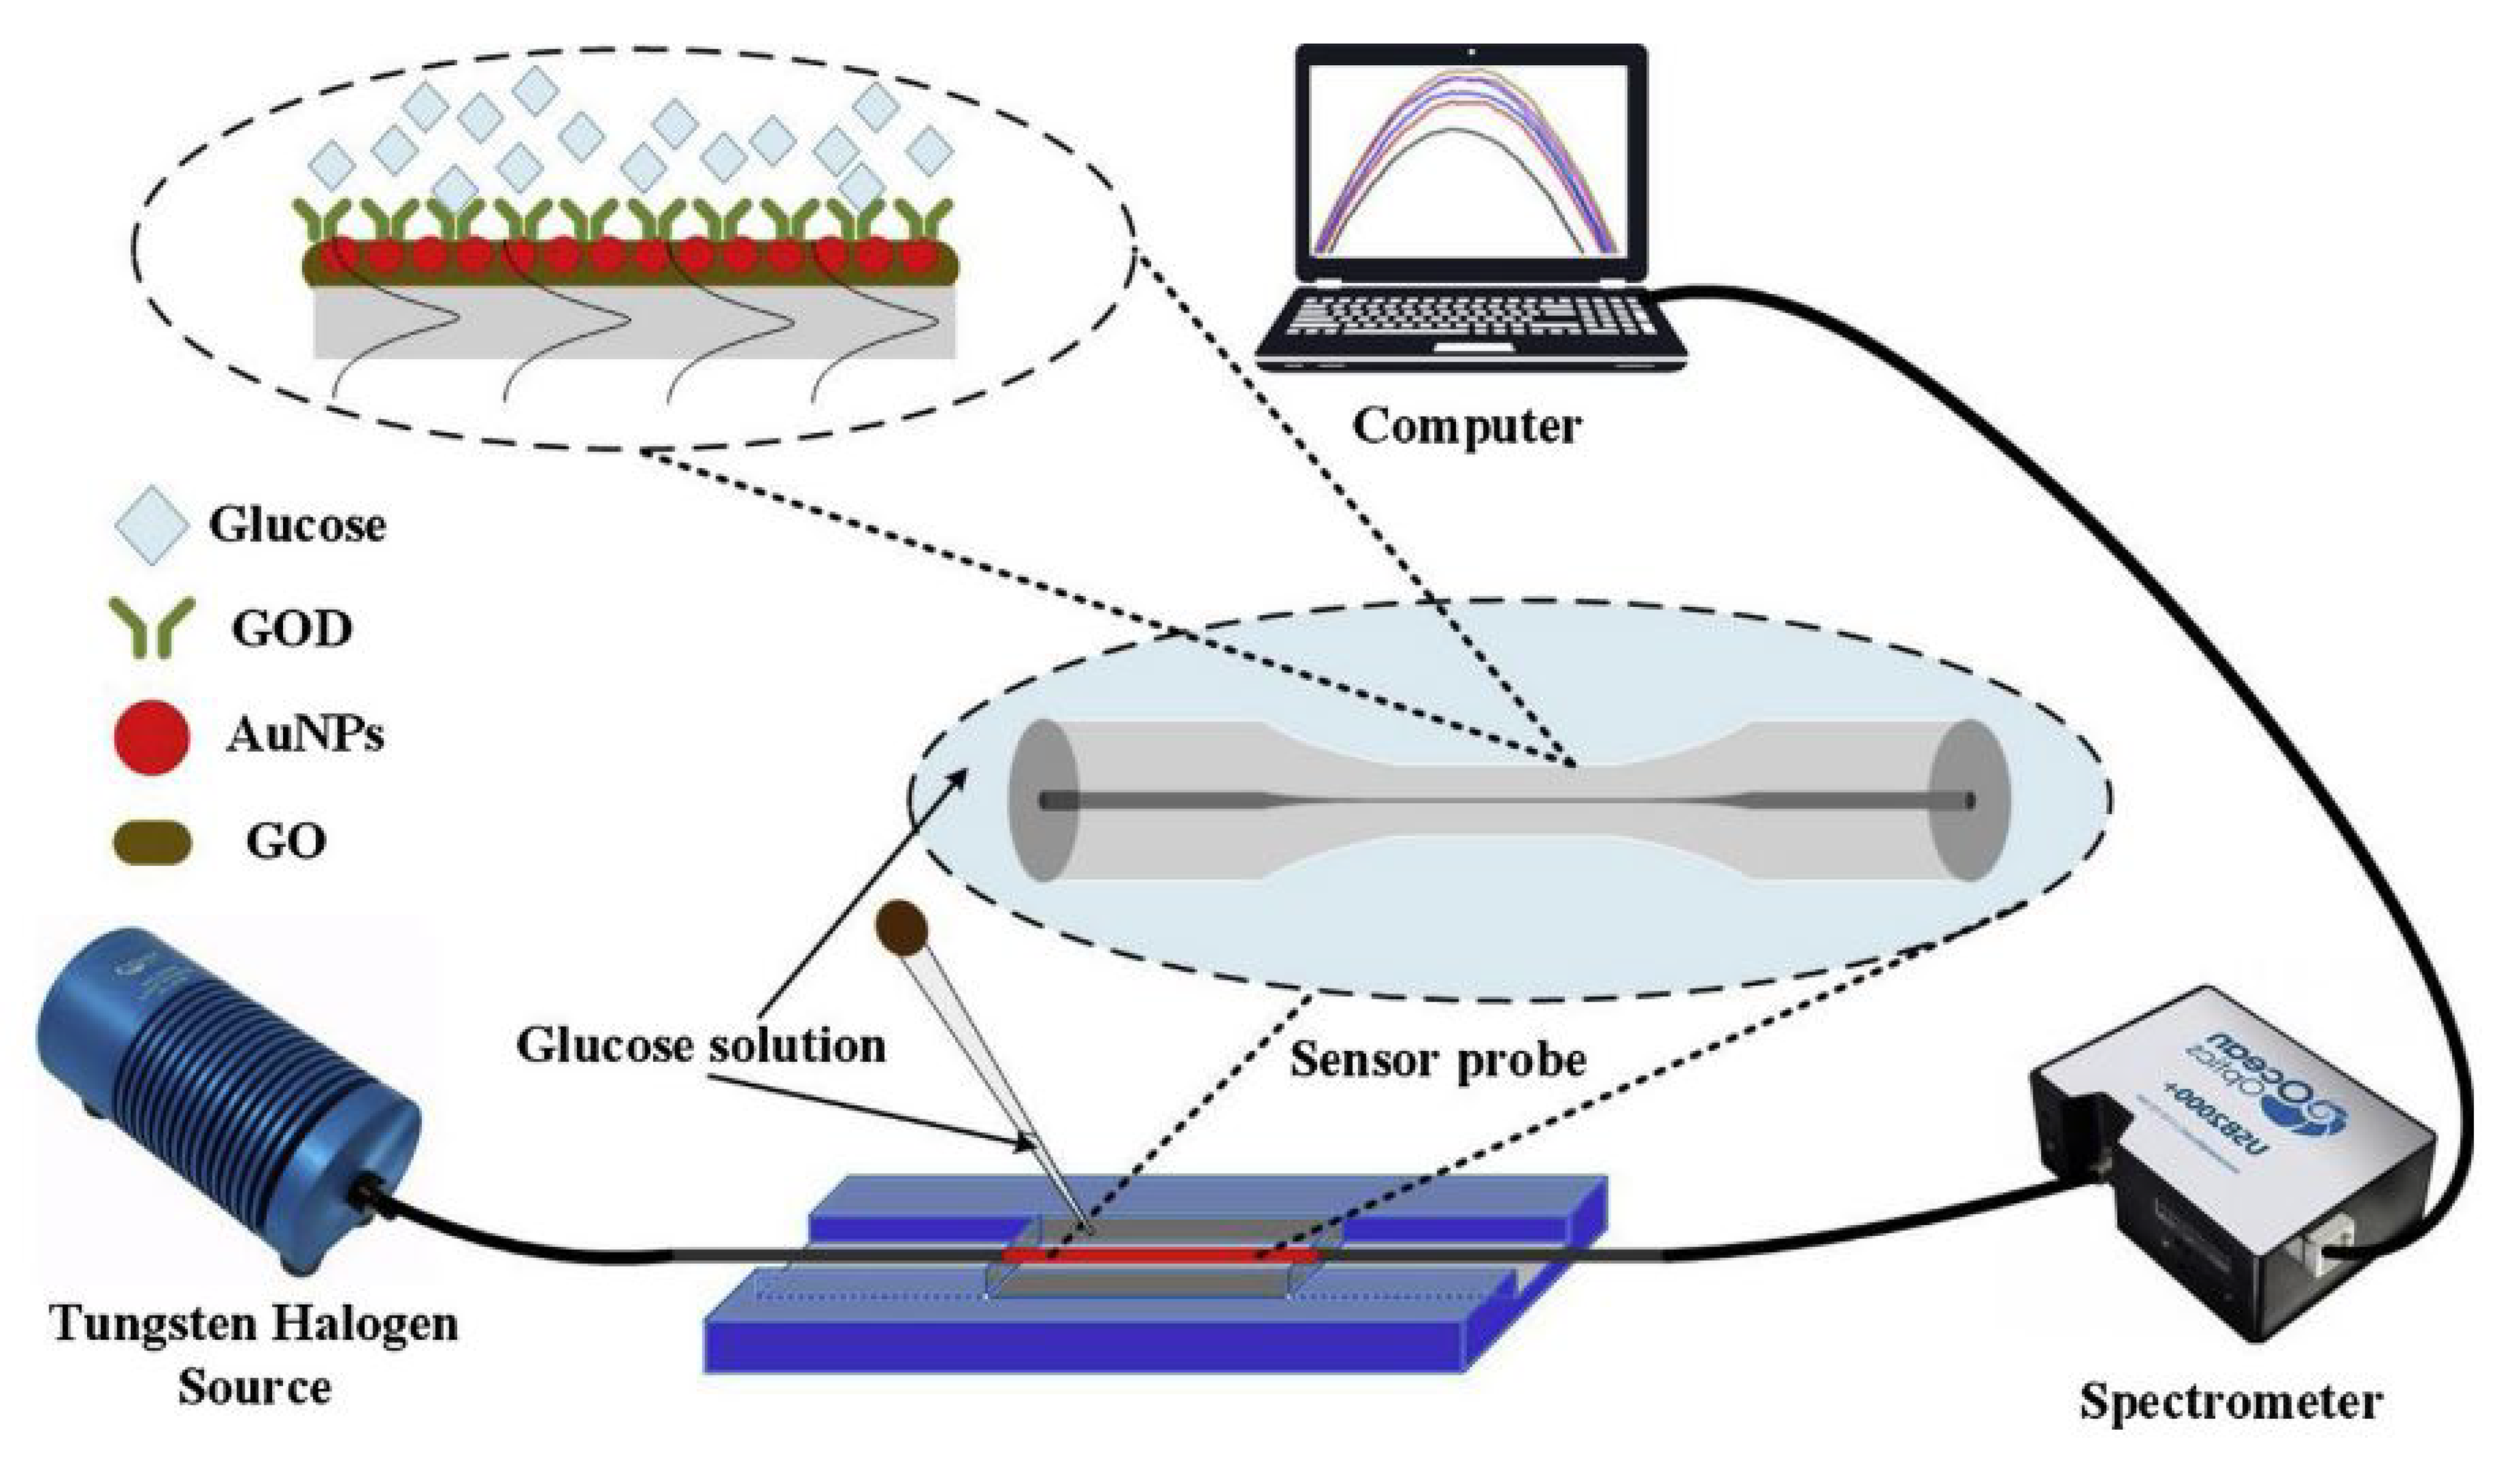
| Middle area | 230–519 nm | 0–11 mM | Graphene Oxide and Gold | N/A | 1.06 nm/mM | [16] | |
Publisher’s Note: MDPI stays neutral with regard to jurisdictional claims in published maps and institutional affiliations. |
© 2021 by the authors. Licensee MDPI, Basel, Switzerland. This article is an open access article distributed under the terms and conditions of the Creative Commons Attribution (CC BY) license (http://creativecommons.org/licenses/by/4.0/).
Share and Cite
Cano Perez, J.L.; Gutiérrez-Gutiérrez, J.; Perezcampos Mayoral, C.; Pérez-Campos, E.L.; Pina Canseco, M.d.S.; Tepech Carrillo, L.; Mayoral, L.P.-C.; Vargas Treviño, M.; Apreza, E.L.; Rojas Laguna, R. Fiber Optic Sensors: A Review for Glucose Measurement. Biosensors 2021, 11, 61. https://0-doi-org.brum.beds.ac.uk/10.3390/bios11030061
Cano Perez JL, Gutiérrez-Gutiérrez J, Perezcampos Mayoral C, Pérez-Campos EL, Pina Canseco MdS, Tepech Carrillo L, Mayoral LP-C, Vargas Treviño M, Apreza EL, Rojas Laguna R. Fiber Optic Sensors: A Review for Glucose Measurement. Biosensors. 2021; 11(3):61. https://0-doi-org.brum.beds.ac.uk/10.3390/bios11030061
Chicago/Turabian StyleCano Perez, José Luis, Jaime Gutiérrez-Gutiérrez, Christian Perezcampos Mayoral, Eduardo L. Pérez-Campos, Maria del Socorro Pina Canseco, Lorenzo Tepech Carrillo, Laura Pérez-Campos Mayoral, Marciano Vargas Treviño, Edmundo López Apreza, and Roberto Rojas Laguna. 2021. "Fiber Optic Sensors: A Review for Glucose Measurement" Biosensors 11, no. 3: 61. https://0-doi-org.brum.beds.ac.uk/10.3390/bios11030061