An Analytical Method Based on Electrochemical Sensor for the Assessment of Insect Infestation in Flour


1
Key Laboratory of Novel Materials for Sensor of Zhejiang Province, College of Materials and Environmental Engineering, Hangzhou Dianzi University, Hangzhou 310018, China
2
Co-Innovation Center for Sustainable Forestry in Southern China, Nanjing Forestry University, Nanjing 210037, China
3
School of Resources and Environment, University of Electronic Science and Technology of China, Xiyuan Ave, Chengdu 611731, China
4
Department of Chemical Engineering, Quchan University of Technology, Quchan 9477177870, Iran
5
Department of Chemical Sciences, University of Johannesburg, Doornfontein Campus, P.O. Box 17011, Johannesburg 2028, South Africa
*
Author to whom correspondence should be addressed.
Biosensors 2021, 11(9), 325; https://0-doi-org.brum.beds.ac.uk/10.3390/bios11090325
Submission received: 3 August 2021
/
Revised: 27 August 2021
/
Accepted: 8 September 2021
/
Published: 9 September 2021
(This article belongs to the Special Issue Electrochemical Sensors for Biometrics)
Abstract
:Uric acid is an important indicator of the insect infestation assessment in flour. In this work, we propose a method for uric acid detection based on voltammetry. This technique is particularly considered for the physicochemical properties of flour and contains a simple pretreatment process to rapidly achieve extraction and adsorption of uric acid in flour. To achieve specific recognition of uric acid, graphene and poly(3,4-ethylenedioxythiophene) (PEDOT) were used for the adsorption and concentration of uric acid in flour. The adsorbed mixture was immobilized on the surface of a screen-printed electrode for highly sensitive detection of the uric acid. The results showed that electrocatalytic oxidation of uric acid could be achieved after adsorption by graphene and PEDOT. This electrocatalytic reaction allows its oxidation peak to be distinguished from those of other substances that commonly possess electrochemical activity. This voltammetry-based detection method is a portable and disposable analytical method. Because it is simple to operate, requires no professional training, and is inexpensive, it is a field analysis method that can be promoted.
1. Introduction
Wheat is one of the most important food crops, accounting for 22% of total grain production. Wheat flour milled from wheat produces a wide variety of foods and is one of the main sources of nutrition and energy for human consumption. However, a large percentage of flour is lost each year due to insect infestation [1,2,3]. For example, insect infestation causes mold and quality deterioration of flour, which can reduce the edible quality and nutritional value of flour. The secretions and excretions of some pests also have a heavy odor, which directly affects the sensory quality of the flour. Sometimes, grain and food contaminated by pests can cause diseases in humans and animals [4,5,6]. There are two sources of insect infestation in flour. One type comes from the original grain: some moth-eating pests hidden inside the grain. The pests lay their eggs inside the grain prior to harvesting. There are also some parasitic larvae and pupae that live inside the grain. These cannot be removed by normal cleaning and processing techniques [7,8]. Another type of insect infestation source is the pests infected during transportation and storage. Without protection during the distribution of grain, pests can infect grain from the outside environment [9]. Heat treatment of grains is the most commonly used method to stop the deterioration of further insect infections. Research in this area over the last two decades has focused on (1) determining the heat-tolerant stage of a species based on the sensitivity of specific stages at different constant elevated temperatures [10], (2) investigating differences in the sensitivity of stored product insect species to elevated temperatures [11], (3) the degree and duration of insect suppression obtained after heat treatment interventions [12], and (4) investigating thermal mortality kinetic models to predict the survival of heat-tolerant stages [13].
There are many methods to detect insect infestation in grain, but fewer methods can be applied to detect insect infestation in flour. Commonly used methods include flotation, near-infrared spectroscopy, staining, and DNA fingerprinting. The flotation method mainly detects pest fragments in flour [14], and the content of pest fragments in flour has different regulations in different countries. The U.S. Food and Drug Administration (FDA) requires a maximum of 75 insect fragments per 50 g of flour. The flotation method is easily accepted and applied. However, this method has some shortcomings. For example, it is easy to cause the loss of fragments during the actual operation, thus not reflecting the content of fragments faithfully. Secondly, the flotation method is tedious and takes about 2 h per sample, which is time-consuming. Although chemical stains can be used for the detection of pest eggs in flour, only very few staining methods can be used for the detection of pest eggs in flour [15]. Although chemical stains can be used for the detection of pest eggs in flour. However, it is difficult to identify the insect eggs in the dust of flour because they are small and therefore difficult to operate in practice. The NIR spectroscopy method can be used for insect infestation detection because the absorption characteristics of flour containing pest fragments and flour without pest fragments are different at different NIR wavelengths [16]. However, the sensitivity of the NIR spectroscopy method needs further improvement to be well applied to field detection [17]. DNA fingerprinting is an important method for distinguishing differences between organisms of the same species and between organisms of different species from a molecular level. By designing primers specific for the segment of genes that determine the prolongation factor of pest growth and development, followed by a series of molecular marker techniques based on PCR, smaller fragments of pests in flour that are not easily observed with the naked eye can be detected [18,19]. However, there are more bands in DNA fingerprinting and the strength of each band varies, making it more difficult to determine the alleles. Moreover, the cost of this technique is high, which makes it difficult to be widely used at this stage. According to the above, different techniques have their own shortcomings. Therefore, it is of great practical value to develop an efficient, economical, and accurate detection method.
Uric acid is the main end product of purine metabolism in insects and is a trioxypurine with a weakly acidic alcoholic form. The synthesis of uric acid is an important part of the study of insect metabolic pathways [20,21]. Insect secretions are often excreted as uric acid in order to prevent significant loss of water in the body. As an end product of insect nitrogen metabolism, uric acid has been suggested as an indicator of insect contamination on seeds and grain products [22,23]. The current methods for uric acid determination mainly include high performance liquid chromatography, the uric acid enzyme method, and the phosphotungstic acid reduction method [24]. The first two of these methods are specific and sensitive, but their use is limited by the need for special equipment with high cost. Although the phosphotungstic acid reduction method is non-specific, it is widely used because of the simplicity of the required conditions. The electrochemical detection of uric acid has been extensively studied, mainly for medical purposes [25,26,27]. These electrochemical sensors provide highly sensitive detection of uric acid. However, these sensors are designed primarily for the biological environment of the human body and therefore cannot be used directly for the detection of uric acid in flour. In this work, we designed a novel electrochemical sensing detection technique based on the physicochemical properties of flour. This technique allows highly sensitive detection of uric acid in flour. By the level of uric acid, we can further evaluate the insect infestation level of flour. We have performed a comparative corroboration with phosphotungstic acid reduction method and found that this voltammetric detection-based technique possesses good reproducibility, short operation time, and low price.
2. Materials and Methods
2.1. Materials
Graphene dispersion (2 mg/mL) was purchased from Jiangsu XFNANO Materials Tech Co., Ltd. (Nanjing, China). 3,4-Ethylenedioxythiophene (EDOT) was purchased from Shanghai Guchen Biotech Co., Ltd. (Shanghai, China). Phosphotungstic acid, sodium tungstate, sodium carbonate, uric acid, and ascorbic acid were purchased from Alading Co., Ltd. All of the solutions were made from analytical grade reagents and ultra-pure water. A commercial screen-printed electrode (SPE, Nanjing Youyun Technology Co., Ltd. (Nanjing, China)) with a three-electrode system was used for voltammetry recording.
2.2. Preparation of Graphene/PEDOT Composite
The graphene/PEDOT composite was synthesized by a microwave based method [28]. Specifically, 5 mL of graphene dispersion (0.5 mg/mL) was mixed with 1 mL of EDOT and then stirred for 1 h. The mixture was then transferred into a reaction tube and placed into a microwave oven and reacted at 200 W for 5 min. Then, the formed graphene/PEDOT composite was collected after filtration and the washing process.
2.3. Electrochemical Sensor Fabrication and Measurement
The synthesized graphene/PEDOT composite was first dispersed into ethanol to form a 0.1 mg/mL solution. Then, 0.2 mL of graphene/PEDOT composite solution was added to 1 mL of uric acid solution or flour extract. The mixed solution was sonicated for 3 min to allow the graphene/PEDOT composite to adsorb uric acid. Subsequently, 5 μL of the above solution was drop coated on the surface of the SPE and dried at room temperature. Cyclic voltammetry (CV) and differential pulse voltammetry (DPV) have been used for measuring the electro-oxidation of uric acid. The electrolyte is a 0.1 M phosphate buffer solution (PBS).
2.4. Phosphotungstic Acid Reduction for Uric Acid Measurement
Add 0.5 mL of uric acid solution or flour extract to 4.5 mL of tungstic acid reagent, mix well and let stand for 5 min, then centrifuge at 3000 r/min for 5 min. Add 0.5 mL of 100 g/L sodium carbonate solution to the above centrifuged supernatant, mix well, and let it stand at room temperature for 10 min. The absorbance was measured by UV spectrophotometer at 660 nm.
2.5. Real Sample Preparation
Tribolium castaneum with a clean and vigorous body were selected, reared on flour and incubated in a biochemical incubator. After 48 h of incubation, the adult Tribolium castaneum were separated from the flour by passing through a 60 mesh grain sieve. The sieved flour was then sieved through an 80 mesh grain standard sieve to separate the eggs (the eggs were produced with mucus, they can adhere to the flour and are able to remain on the 80 mesh grain sieve). The eggs were collected from the sieve and placed in a Petri dish for use. Add flour with different numbers of eggs to the test tubes, then add 2 mL of distilled water, and 1 mL of 0.1% sodium carbonate solution. The suspension was formed after shaking. The flour extract was then transferred to a centrifuge tube and centrifuged at 10,000 r/min for 10 min to obtain the flour extract after the eggs were completely broken.
3. Results and Discussion
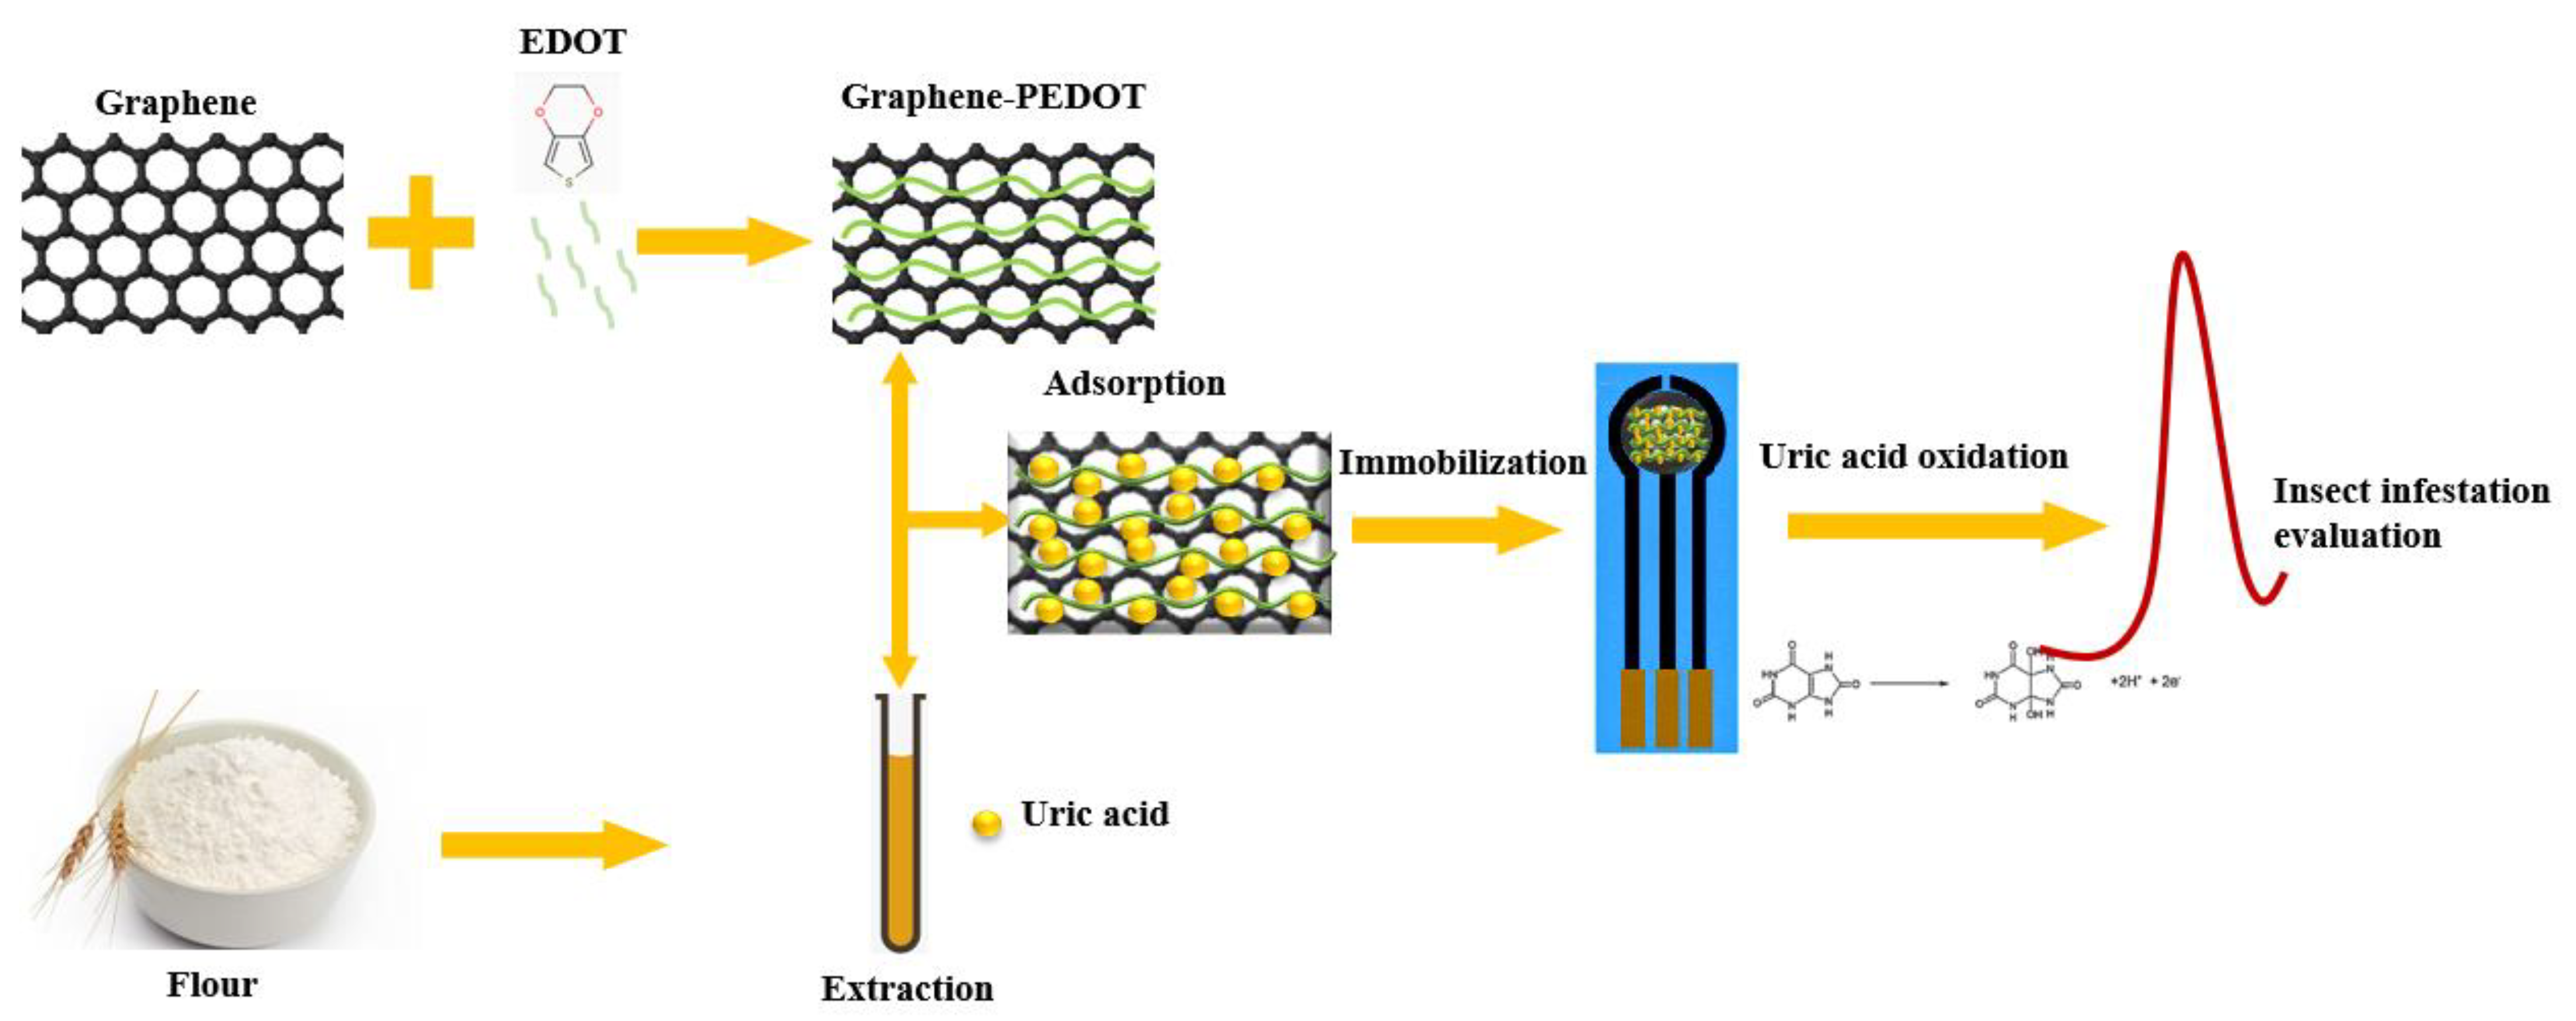
Figure 1 shows a schematic diagram of the fabrication of our proposed analytical sensor. In this detection method, the detection of uric acid is not simple oxidation on the electrode. The uric acid molecules are first adsorbed and concentrated by the graphene-PEDOT nanocomposite, which is then immobilized on the SPE electrode surface. This process not only improves the sensitivity of the uric acid oxidation current but also helps to improve the interference resistance in the actual sample detection. Graphene can be used to adsorb uric acid molecules due to its high specific surface area [29]. At the same time, graphene has very good electrical properties and can improve the electrochemical signal [30]. PEDOT acts as a catalyst in composite materials. Previous studies demonstrated that uric acid can be electrocatalytically oxidized on the surface of PEDOT-modified electrodes [31]. This electrocatalytic behavior allows the sensor to perform detection of uric acid avoiding the influence of other common interferents, since the amount of uric acid and the degree of insect infestation show a positive relationship. The oxidation current of uric acid recorded in this assay can be used to evaluate insect infestation in flour.
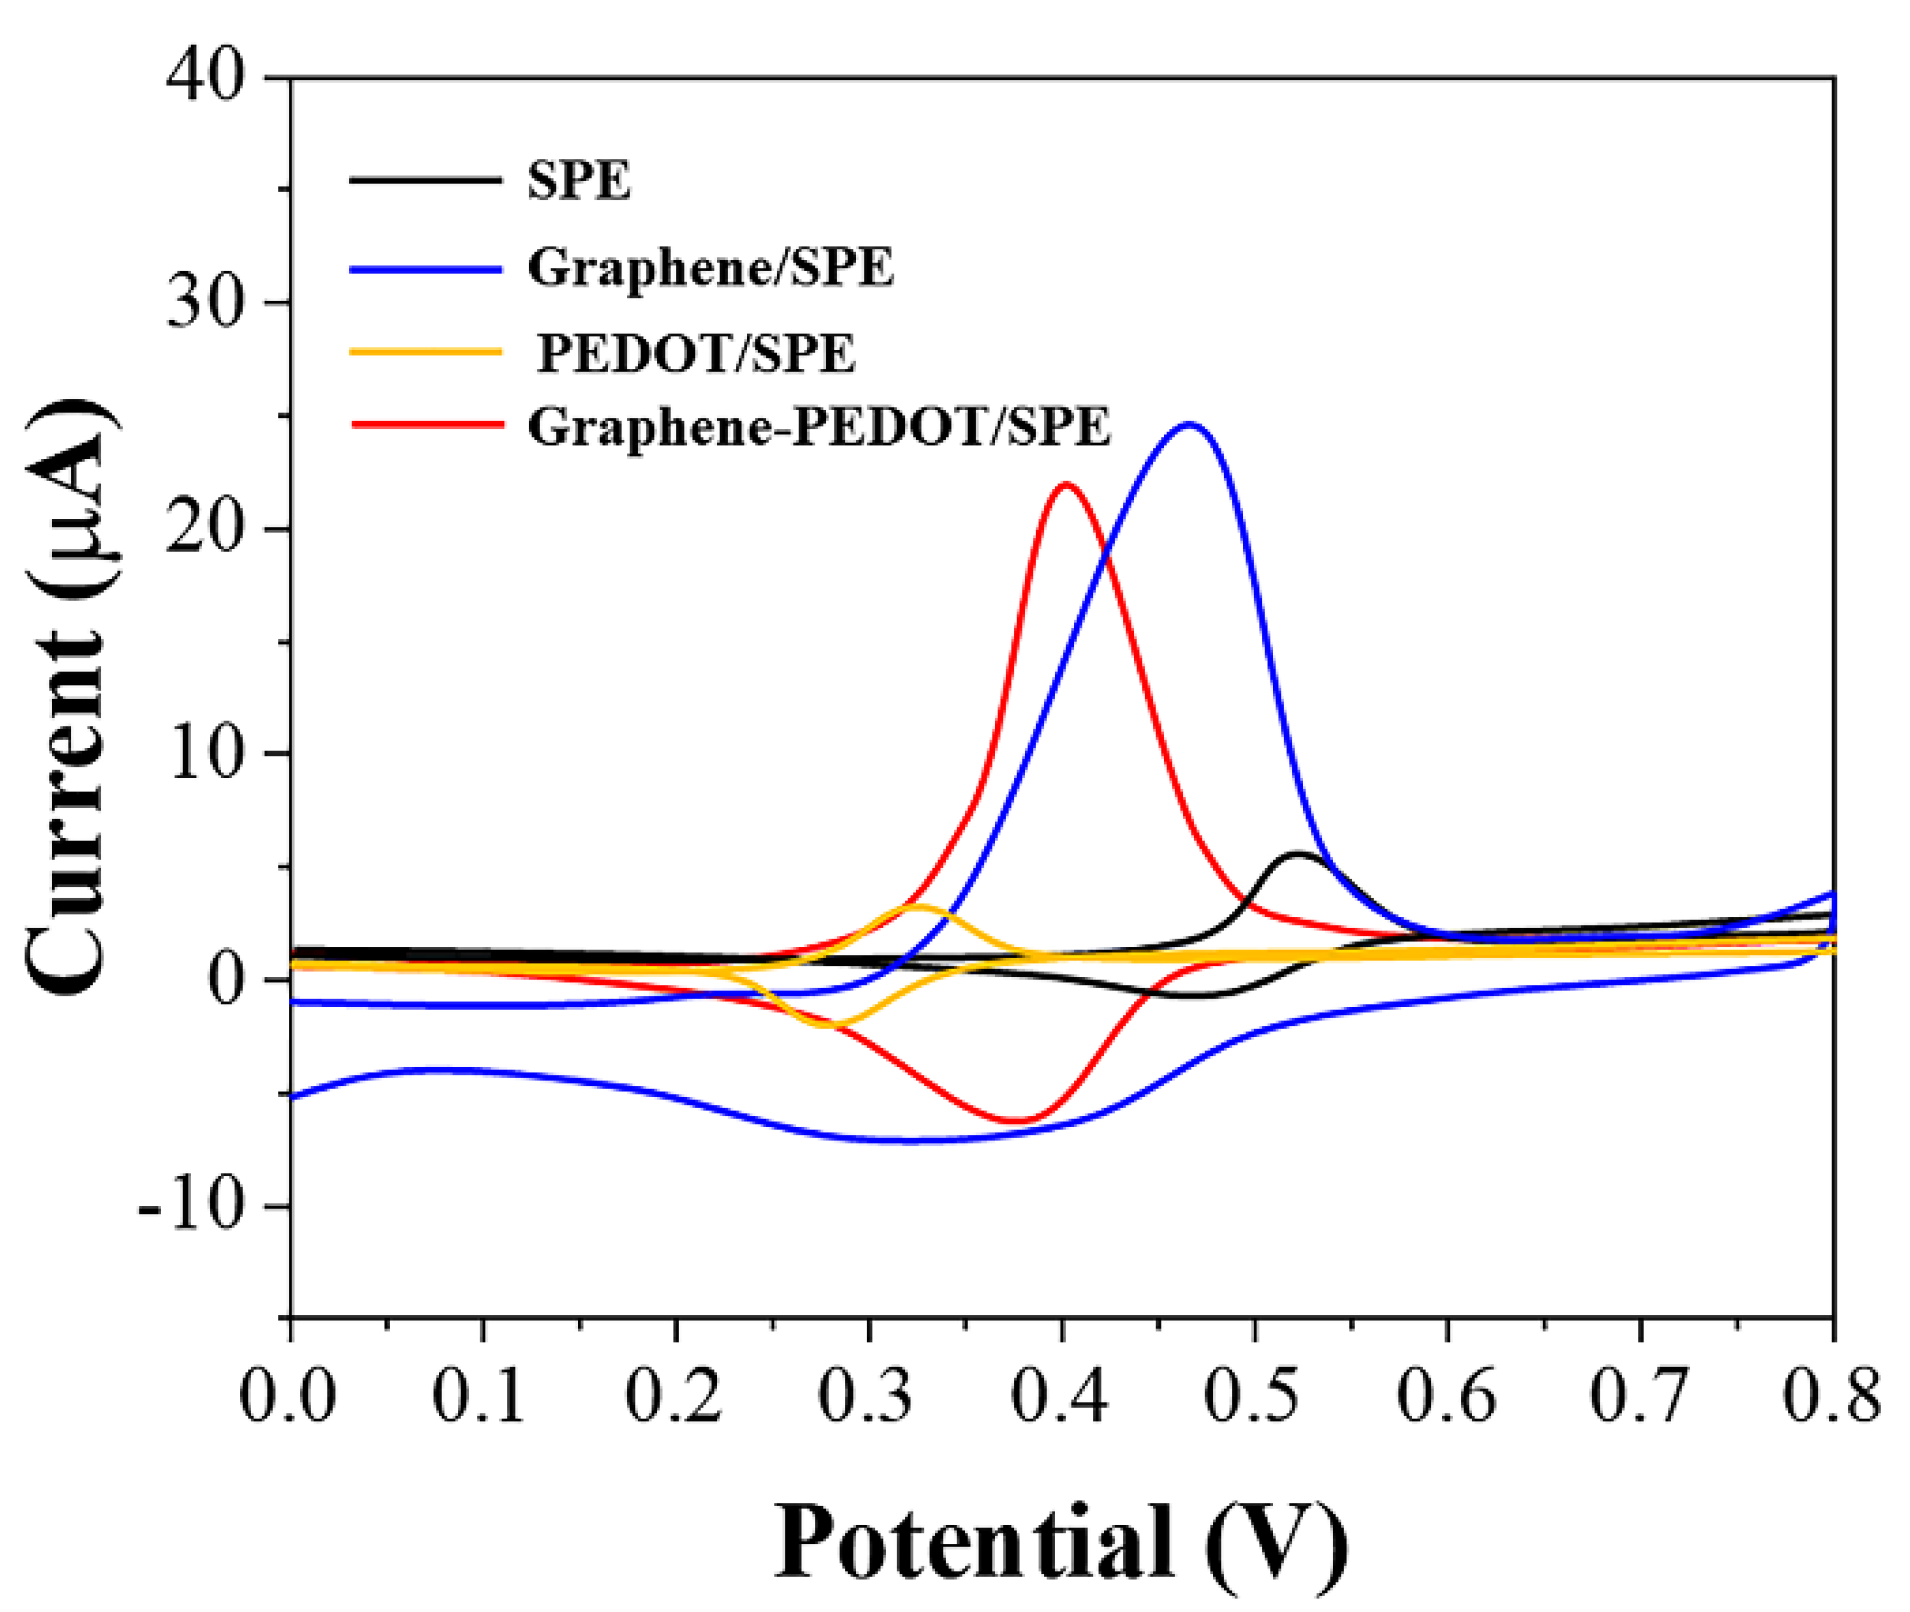
The electrochemical oxidation behaviors of uric acid at different electrodes were shown in Figure 2. It can be seen that uric acid can be oxidized directly on the SPE with a very easily recognizable oxidation peak at 0.62 V, corresponding to a current of 4.7 μA. The small current obtained in this case was not only due to the limitations of the detection performance of the SPE itself; only a fraction of the free uric acid molecules were instinctively involved in the electrochemical reaction. If the uric acid molecule and PEDOT were co-mixed and then immobilized on SPE, the oxidation potential of uric acid shifts negatively. However, the current value is lower than the direct oxidation of uric acid on SPE. It can be seen that, although the presence of PEDOT can achieve an electrocatalytic effect on the oxidation of uric acid, the poor electrical conductivity of PEDOT leads to a decrease in the efficiency of electron transfer. In contrast, graphene adsorption of uric acid can greatly increase the current of the oxidation peak. In addition, graphene adsorption can allow a small negative shift of the oxidation potential of uric acid. This catalytic property is caused by the defects on the surface of graphene and functional groups on the boundary, which is consistent with our previous report [32]. The best results were observed on SPEs of graphene-PEDOT composites adsorbed with uric acid. The oxidation of uric acid on this electrode not only has a very significant negative potential shift but also possesses a very high current response. Therefore, we used graphene-PEDOT to first adsorb and concentrate uric acid to improve the sensitivity of the sensor.
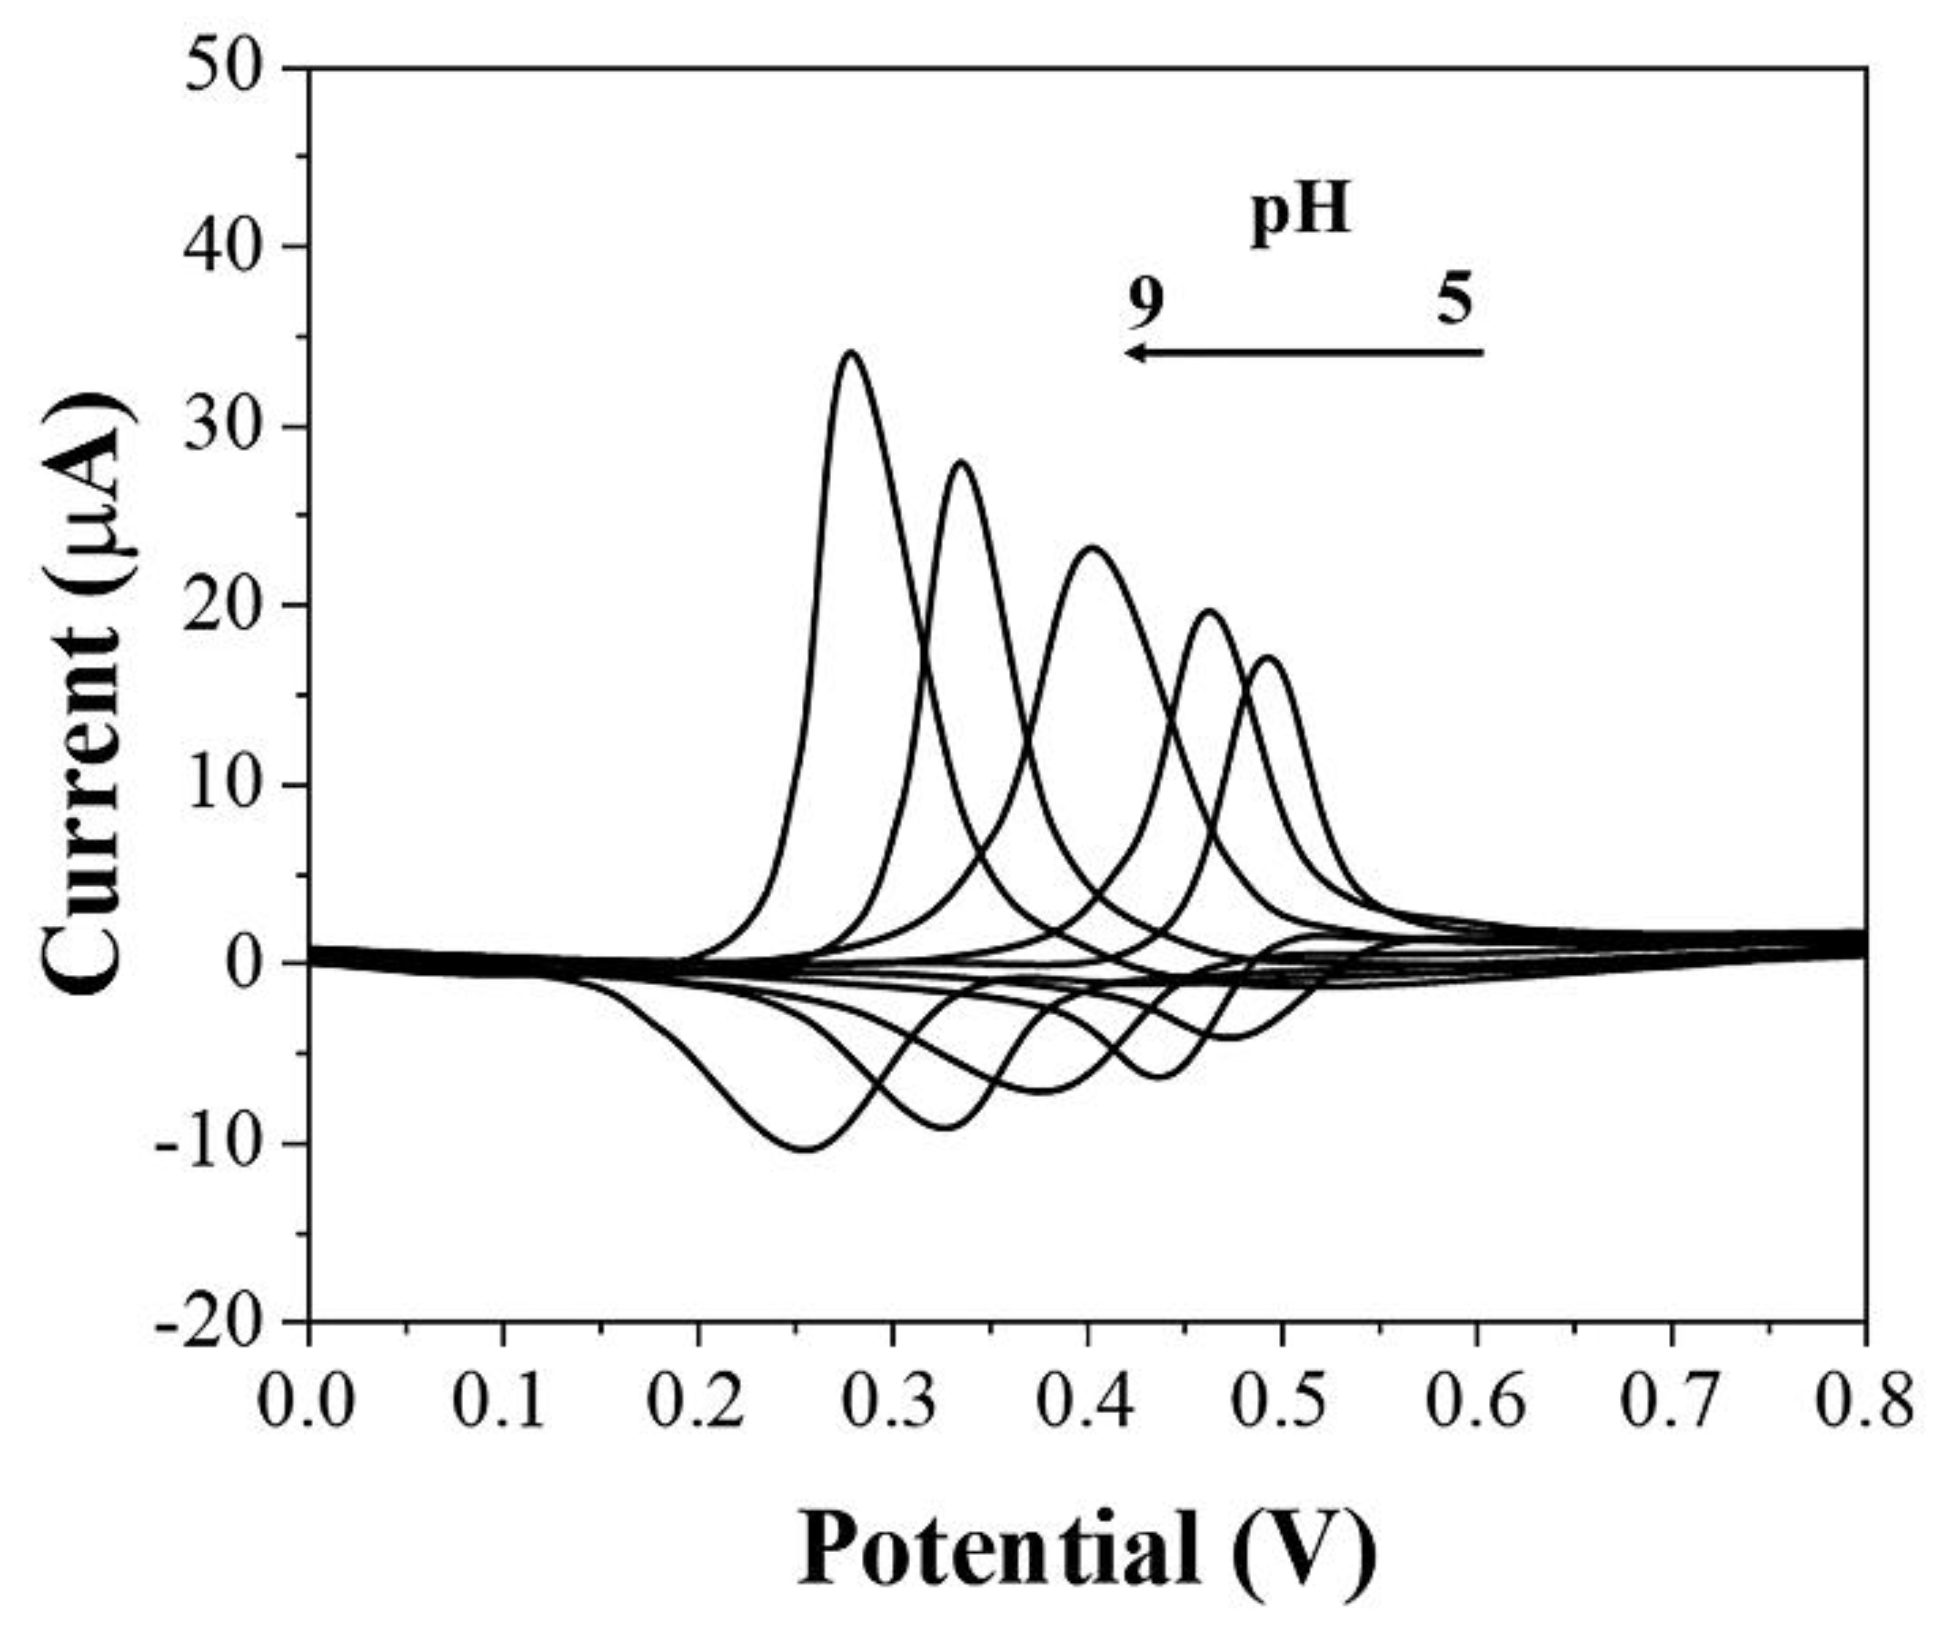
Electrolytes can influence the electrochemical behavior of uric acid at the electrode. In this work, we investigated the electrochemical response of uric acid after adsorption by graphene-PEDOT in PBS under different pH. As shown in Figure 3, there is a positive correlation between the intensity of the oxidation current of uric acid and pH. As the pH increases, the current of the oxidation peak becomes larger. In addition, the oxidation potential of uric acid was influenced by pH as well. As the pH increased, the oxidation potential of uric acid also underwent a negative shift due to the involvement of protons in the electrochemical reaction [33]. Although a lower potential for electrochemical sensing helps detection, we finally chose pH 7 as the electrolyte environment for sensor operation considering the oxidation potential overlapping of some other substances, such as ascorbic acid [34].
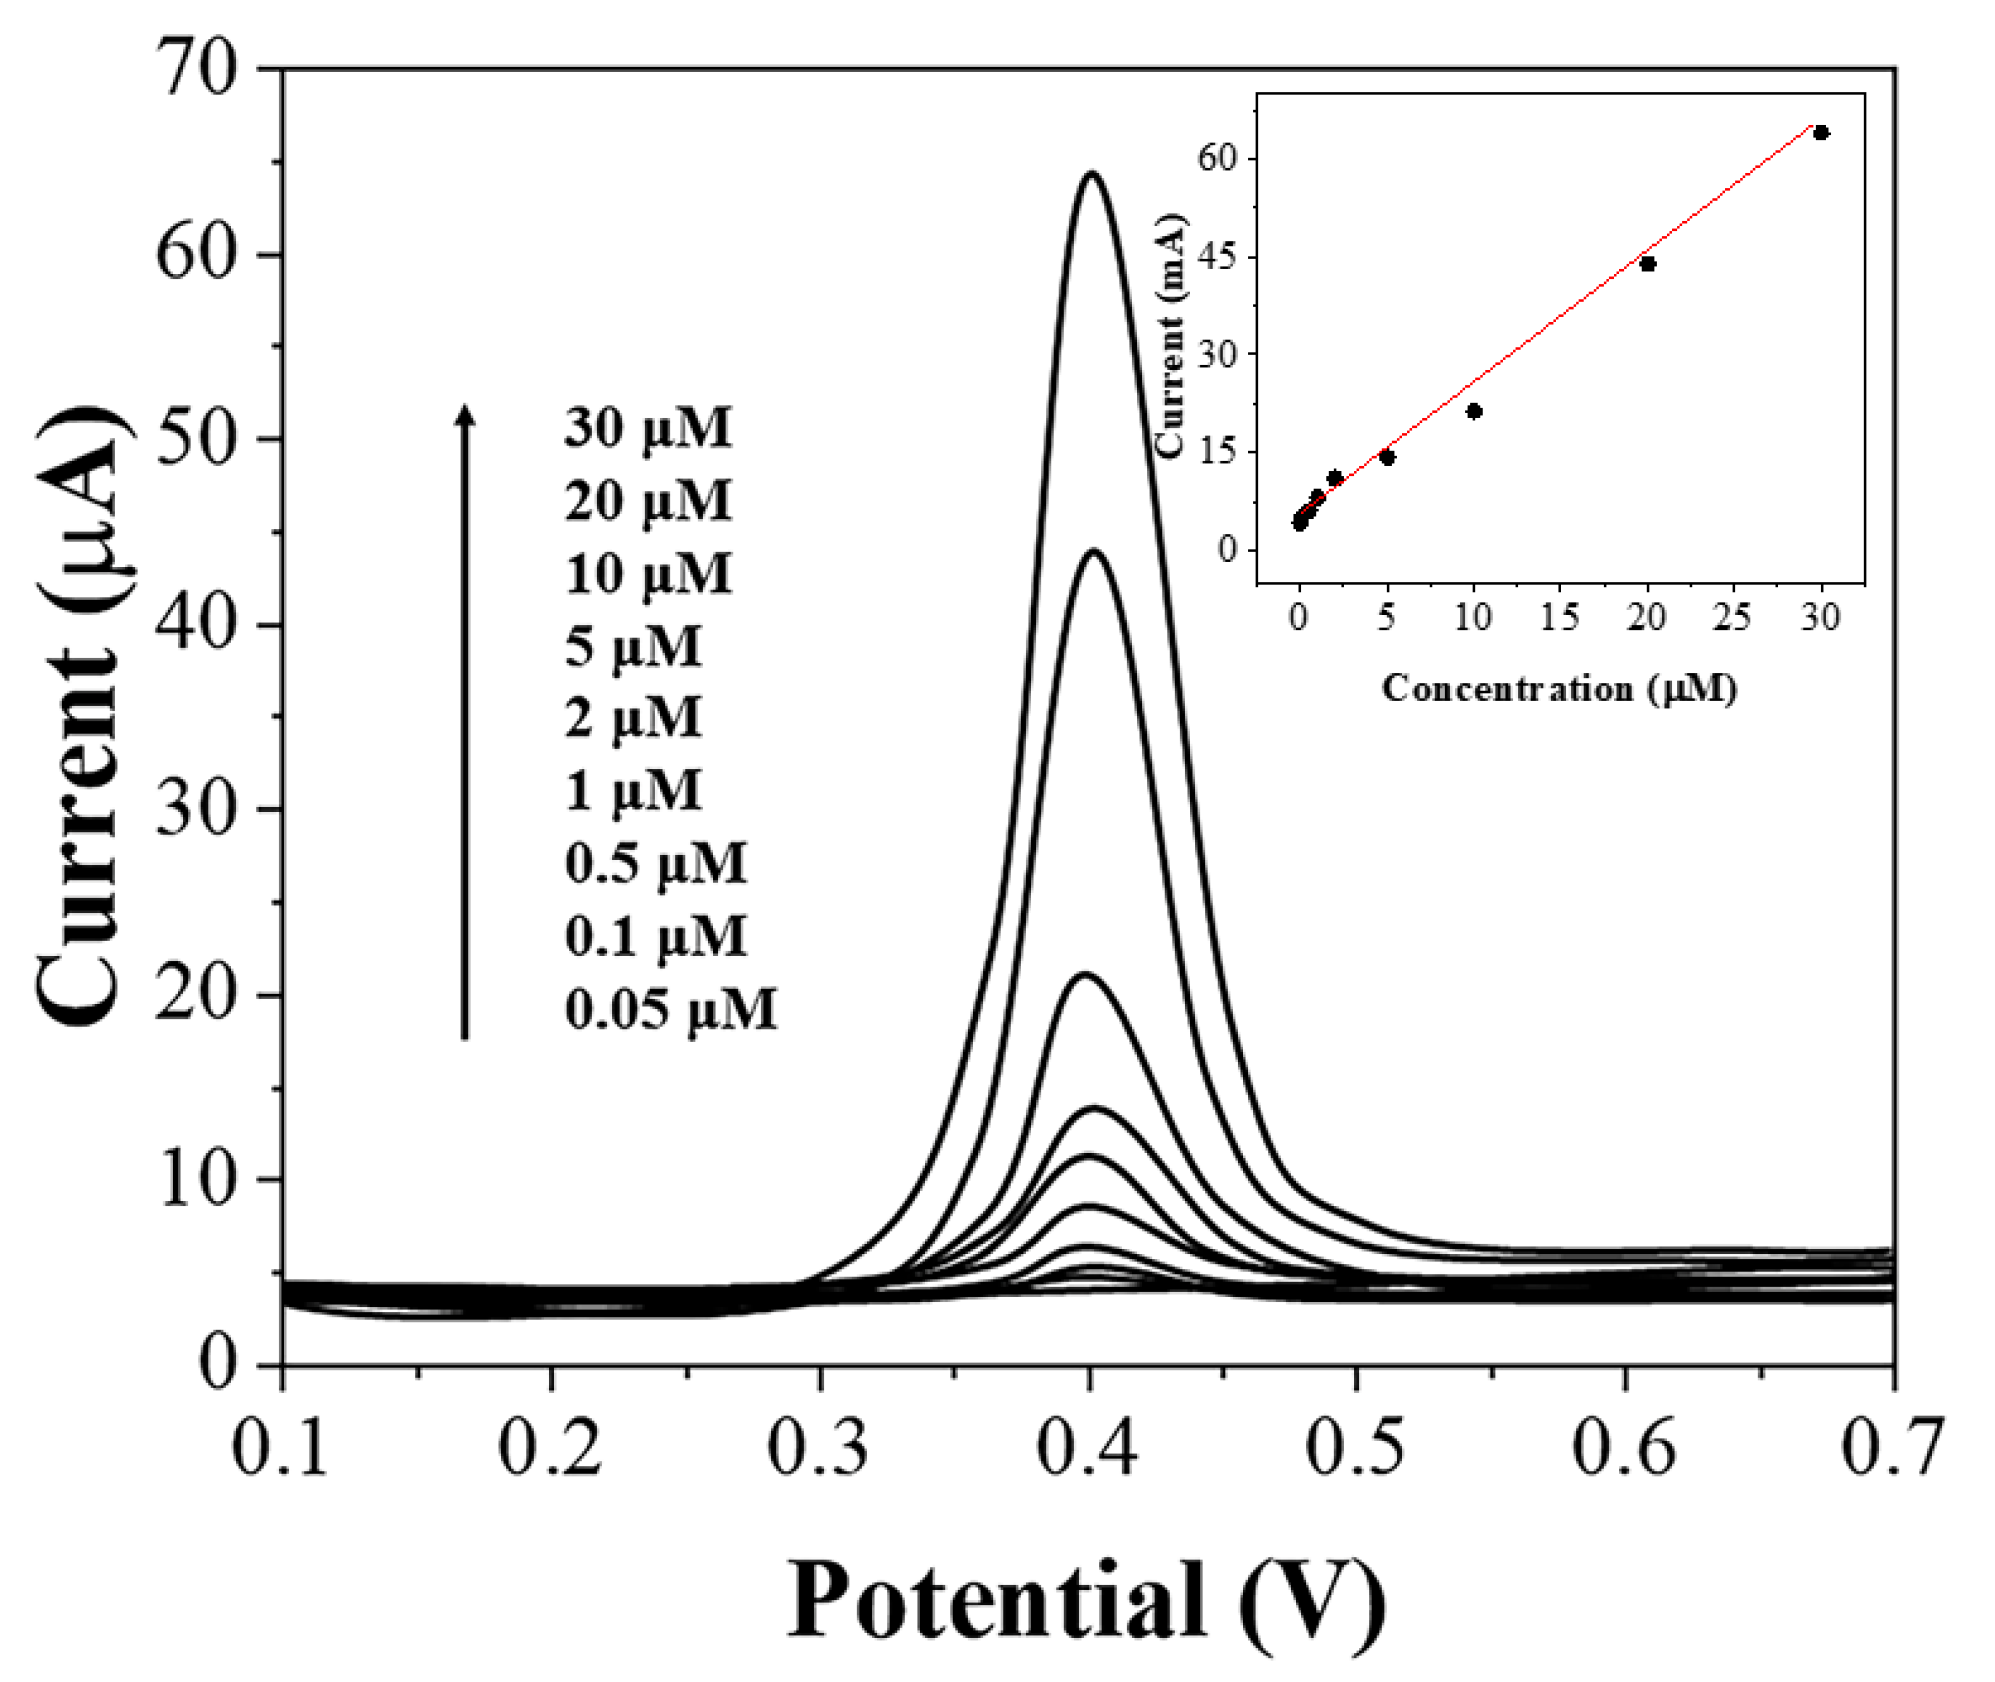
Before performing the detection of uric acid in flour, we verified the detection performance of the assembled sensor. Figure 4 shows the linear sweep voltammetry (LSV) of graphene-PEDOT adsorbed with different concentrations of uric acid and then immobilized on SPE. As expected, the oxidation current of uric acid increases linearly with an increasing concentration of uric acid in the range of 0.05–30 μM. The detection limit can be calculated as 15 nM based on S/N = 3. Table 1 compares the effectiveness of the proposed sensor with other reported literature. It can be seen that our sensor is particularly sensitive at lower concentrations but has no advantage at higher concentrations of uric acid. Since our sensor is used for the detection of uric acid in flour, it needs to be sensitive to lower concentrations of uric acid. This is why we need to use graphene-PEDOT for adsorption and concentration of uric acid molecules. We tested five prepared sensors and they showed excellent performance for the oxidation of 10 μM uric acid. The RSD of the current value was only 3.2%. The selectivity of the sensor was then tested. Common small molecules, such as 10-fold of ascorbic acid, fructose, and sucrose do not affect the test results.
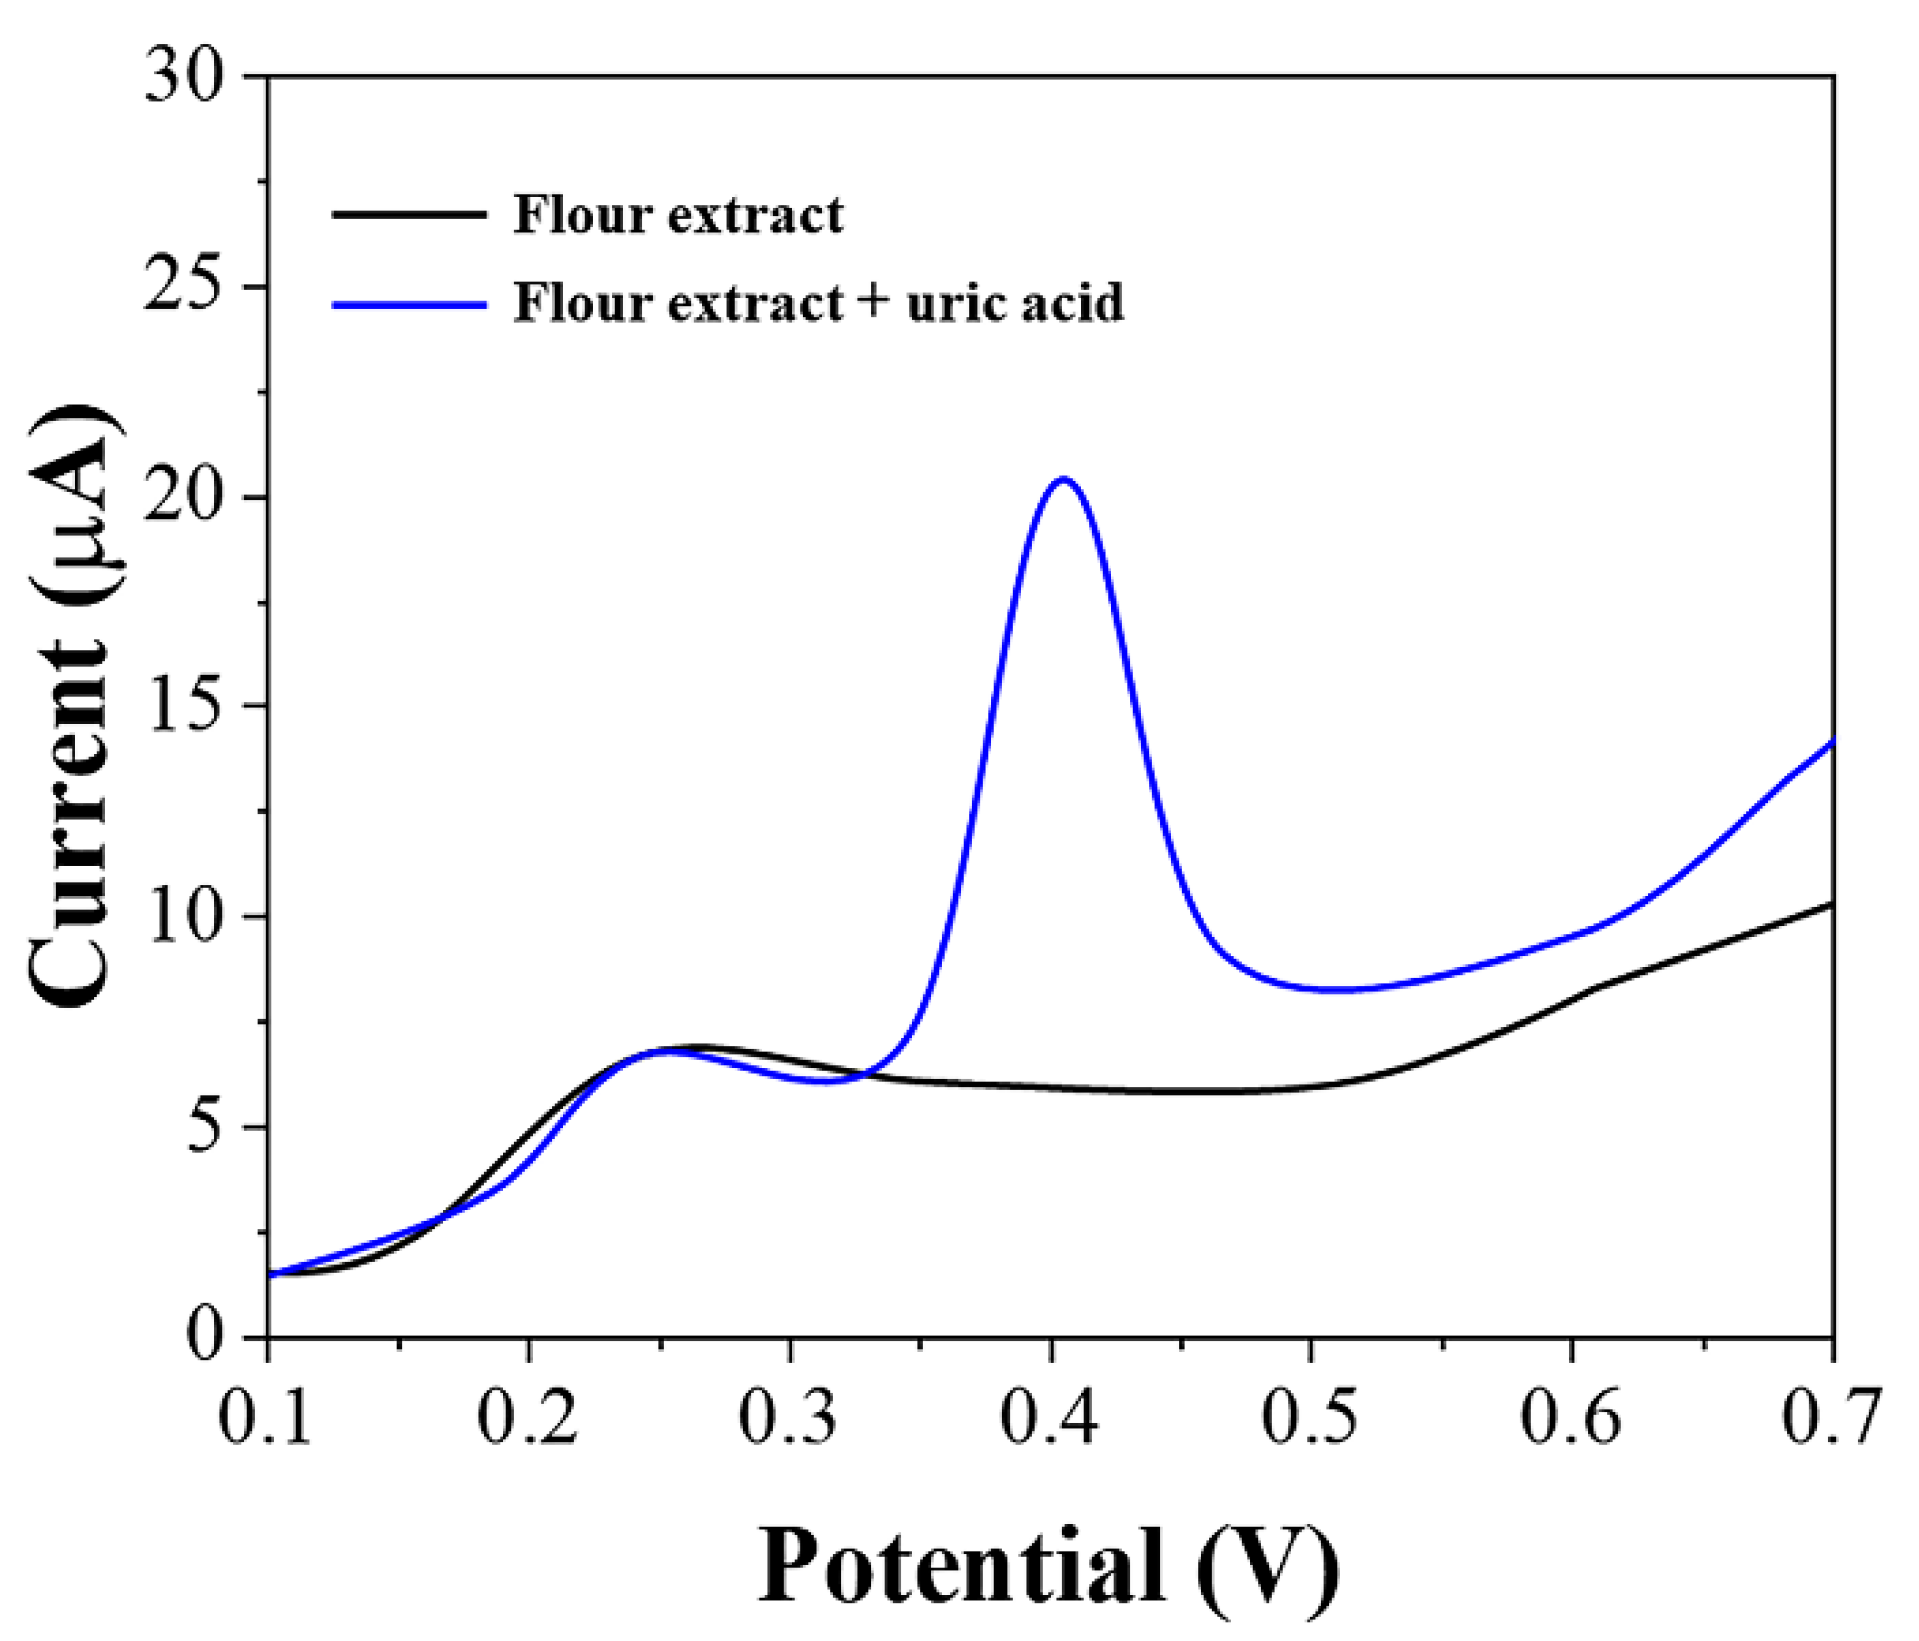
The extract of the flour must contain other substances possessing electrochemical activity. Figure 5 shows the LSV of graphene-PEDOT after adsorption of the flour extract. From the figure, it can be seen that there are substances in the flour extract that can be electrochemically oxidized. These substances are complex in composition and are mainly small antioxidant molecules in wheat. We then added 10 μM of uric acid to the flour extract and could see that the oxidation peaks of uric acid did not overlap with those of other substances. This is the reason why we selected pH 7 as the detection environment. At other pH conditions, the electrochemical oxidation of these substances would partially overlap with the oxidation peak of uric acid, which in turn would affect our determination of uric acid content.
We then tested the linear detection range of the proposed electrochemical assay for uric acid in flour extracts. Since graphene-PEDOT adsorbs other substances in addition to uric acid molecules during the adsorption process, the detection performance of the sensor is slightly reduced compared to the previous detection of a single uric acid. However, this analytical method still provides a linear detection of 0.1–20 μM uric acid. The detection limit can reach 37 nM. We then tested the proposed sensor using the eggs of Tribolium castaneum as an actual insect infestation. Phosphotungstic acid reduction was used as a conventional assay for comparison. Table 2 shows the comparison of the results of the two different detection methods. As can be seen from the table, the number of Tribolium castaneum eggs is directly proportional to the amount of uric acid. The results of the electrochemical sensor are very similar to those of the phosphotungstic acid reduction method, proving that our proposed method can be well applied to the determination of uric acid in flour.
4. Conclusions
In conclusion, a novel electrochemical sensor was prepared for the determination of uric acid content in flour and further reflected the insect infestation situation. Graphene-PEDOT was first synthesized for the adsorption and concentration of uric acid from flour extracts. This step allows the electrochemical sensor to detect very low concentrations of uric acid. After optimizing the parameters, the proposed electrochemical sensor can provide linear detection of uric acid between 0.05 and 30 μM. In real flour samples, the linear detection range of the sensor is slightly reduced due to interference from other substances. However, the sensor is still able to achieve linear detection in the 0.1–20 μM range.
Author Contributions
Conceptualization, L.F. and H.K.-M.; methodology, L.F. and H.K.-M.; software, J.Z.; validation, L.F. and J.Z.; formal analysis, J.Z. and H.K.-M.; investigation, L.F. and J.Z.; data curation, J.Z. and H.K.-M.; writing—original draft preparation, L.F.; writing—review and editing, H.K.-M.; supervision, L.F.; project administration, L.F.; funding acquisition, L.F. All authors have read and agreed to the published version of the manuscript.
Funding
This research was funded by the National Natural Science Foundation of China (22004026).
Institutional Review Board Statement
Not applicable.
Informed Consent Statement
Not applicable.
Data Availability Statement
Data sharing not applicable.
Conflicts of Interest
The authors declare no conflict of interest.
References
- Campbell, J.F.; Arbogast, R.T. Stored-product insects in a flour mill: Population dynamics and response to fumigation treatments. Èntomol. Exp. Appl. 2004, 112, 217–225. [Google Scholar] [CrossRef]
- Perez-Mendoza, J.; Throne, J.; Dowell, F.; Baker, J. Detection of insect fragments in wheat flour by near-infrared spectroscopy. J. Stored Prod. Res. 2002, 39, 305–312. [Google Scholar] [CrossRef] [Green Version]
- Guo, X.N.; Wu, S.H.; Zhu, K.X. Effect of superheated steam treatment on quality characteristics of whole wheat flour and storage stability of semi-dried whole wheat noodle. Food Chem. 2020, 322, 126738. [Google Scholar] [CrossRef] [PubMed]
- Attia, M.A.; Wahba, T.F.; Shaarawy, N.; Moustafa, F.I.; Guedes, R.N.C.; Dewer, Y. Stored Grain Pest Prevalence and Insec-ticide Resistance in Egyptian Populations of the Red Flour Beetle Tribolium Castaneum (Herbst) and the Rice Weevil Sitophilus Oryzae (L.). J. Stored Prod. Res. 2020, 87, 101611. [Google Scholar] [CrossRef]
- Lü, J.; Kang, Y.; Huo, M. Influence of Packaging Materials on Infestation by Tribolium castaneum (Herbst) in Wheat Flour. J. Kans. Èntomol. Soc. 2018, 91, 223–228. [Google Scholar] [CrossRef]
- Xu, S.; Zhou, Z.; Li, K.; Jamir, S.M.; Luo, X. Recognition of the Duration and Prediction of Insect Prevalence of Stored Rough Rice Infested by the Red Flour Beetle (Tribolium castaneum Herbst) Using an Electronic Nose. Sensors 2017, 17, 688. [Google Scholar] [CrossRef] [Green Version]
- Gerken, A.R.; Campbell, J.F. Oviposition and Development of Tribolium Castaneum Herbst (Coleoptera: Tenebrionidae) on Different Types of Flour. Agronomy 2020, 10, 1593. [Google Scholar] [CrossRef]
- Rumbos, C.I.; Rigopoulou, M.; Athanassiou, C.G. Are insect meals prone to insect infestation during storage? Development of major storage insects on substrates based on Tenebrio molitor larvae meal. J. Pest. Sci. 2020, 93, 1359–1367. [Google Scholar] [CrossRef]
- El-Desouky, T.A.; Elbadawy, S.S.; Hussain, H.B.; Hassan, N.A. Impact of Insect Densities Tribolium Castaneum on the Benzoquinone Secretions and Aflatoxins Levels in Wheat Flour During Storage Periods. Open Biotechnol. J. 2018, 12, 104–111. [Google Scholar] [CrossRef]
- Yang, J.W.; Yi, H.-S.; Kim, H.; Lee, B.; Lee, S.; Ghim, S.-Y.; Ryu, C.-M. Whitefly infestation of pepper plants elicits defence responses against bacterial pathogens in leaves and roots and changes the below-ground microflora. J. Ecol. 2010, 99, 46–56. [Google Scholar] [CrossRef]
- Chigoverah, A.A.; Mvumi, B.M. Efficacy of metal silos and hermetic bags against stored-maize insect pests under simulated smallholder farmer conditions. J. Stored Prod. Res. 2016, 69, 179–189. [Google Scholar] [CrossRef]
- Paudyal, S.; Opit, G.P.; Osekre, E.A.; Arthur, F.H.; Bingham, G.V.; Payton, M.E.; Danso, J.K.; Manu, N.; Nsiah, E.P. Field evaluation of the long-lasting treated storage bag, deltamethrin incorporated, (ZeroFly® Storage Bag) as a barrier to insect pest infestation. J. Stored Prod. Res. 2017, 70, 44–52. [Google Scholar] [CrossRef] [Green Version]
- Walker, S.; Jaime, R.; Kagot, V.; Probst, C. Comparative effects of hermetic and traditional storage devices on maize grain: Mycotoxin development, insect infestation and grain quality. J. Stored Prod. Res. 2018, 77, 34–44. [Google Scholar] [CrossRef]
- Matumba, L.; Singano, L.; Pungulani, L.; Mvula, N.; Matumba, A.; Singano, C.; Matita, G. Aflatoxins, discolouration and insect damage in dried cowpea and pigeon pea in Malawi and the effectiveness of flotation/washing operation in eliminating the aflatoxins. Mycotoxin Res. 2017, 33, 129–137. [Google Scholar] [CrossRef] [PubMed]
- Sutar, S.A.; Thirumdas, R.; Chaudhari, B.B.; Deshmukh, R.R.; Annapure, U.S. Effect of cold plasma on insect infestation and keeping quality of stored wheat flour. J. Stored Prod. Res. 2021, 92, 101774. [Google Scholar] [CrossRef]
- Biancolillo, A.; Firmani, P.; Bucci, R.; Magrì, A.; Marini, F. Determination of insect infestation on stored rice by near infrared (NIR) spectroscopy. Microchem. J. 2018, 145, 252–258. [Google Scholar] [CrossRef]
- Mishra, G.; Srivastava, S.; Panda, B.K.; Mishra, H.N. Rapid Assessment of Quality Change and Insect Infestation in Stored Wheat Grain Using FT-NIR Spectroscopy and Chemometrics. Food Anal. Methods 2017, 11, 1189–1198. [Google Scholar] [CrossRef]
- Carneiro-Leão, M.P.; Tiago, P.V.; Medeiros, L.V.; Da Costa, A.F.; De Oliveira, N.T. Dactylopius opuntiae: Control by the Fusarium incarnatum–equiseti species complex and confirmation of mortality by DNA fingerprinting. J. Pest. Sci. 2017, 90, 925–933. [Google Scholar] [CrossRef]
- Michereff-Filho, M.; Fonseca, M.E.N.; Boiteux, L.S.; Torres, J.B.; Silva, K.F.A.D.S.; Specht, A. Helicoverpa armigera Harm 1 Haplotype Predominates in the Heliothinae (Lepidoptera: Noctuidae) Complex Infesting Tomato Crops in Brazil. Neotrop. Èntomol. 2021, 50, 258–268. [Google Scholar] [CrossRef]
- Mezei, P.; Potterf, M.; Škvarenina, J.; Rasmussen, J.G.; .Jakuš, R. Potential solar radiation as a driver for bark beetle infestation on a landscape scale. Forests 2019, 10, 604. [Google Scholar] [CrossRef] [Green Version]
- Srivastava, S.; Mishra, G.; Mishra, H.N. Fuzzy controller based E-nose classification of Sitophilus oryzae infestation in stored rice grain. Food Chem. 2019, 283, 604–610. [Google Scholar] [CrossRef]
- Banga, K.S.; Kotwaliwale, N.; Mohapatra, D.; Giri, S.K. Techniques for insect detection in stored food grains: An overview. Food Control 2018, 94, 167–176. [Google Scholar] [CrossRef]
- Mishra, G.; Srivastava, S.; Panda, B.K.; Mishra, H.N. Sensor array optimization and determination of Rhyzopertha dominica infestation in wheat using hybrid neuro-fuzzy-assisted electronic nose analysis. Anal. Methods 2018, 10, 5687–5695. [Google Scholar] [CrossRef]
- Carroll, J.J.; Coburn, H.; Douglass, R.; Babson, A.L. A Simplified Alkaline Phosphotungstate Assay for Uric Acid in Serum. Clin. Chem. 1971, 17, 158–160. [Google Scholar] [CrossRef] [PubMed]
- Huang, H.; Yue, Y.; Chen, Z.; Chen, Y.; Wu, S.; Liao, J.; Liu, S.; Wen, H.-R. Electrochemical sensor based on a nanocomposite prepared from TmPO4 and graphene oxide for simultaneous voltammetric detection of ascorbic acid, dopamine and uric acid. Microchim. Acta 2019, 186, 189. [Google Scholar] [CrossRef]
- Sha, R.; Vishnu, N.; Badhulika, S. MoS2 based ultra-low-cost, flexible, non-enzymatic and non-invasive electrochemical sensor for highly selective detection of Uric acid in human urine samples. Sens. Actuators B Chem. 2018, 279, 53–60. [Google Scholar] [CrossRef]
- Yang, Y.; Li, M.; Zhu, Z. A novel electrochemical sensor based on carbon nanotubes array for selective detection of dopamine or uric acid. Talanta 2019, 201, 295–300. [Google Scholar] [CrossRef] [PubMed]
- Sun, D.; Jin, L.; Chen, Y.; Zhang, J.-R.; Zhu, J.-J. Microwave-Assisted In Situ Synthesis of Graphene/PEDOT Hybrid and Its Application in Supercapacitors. ChemPlusChem 2012, 78, 227–234. [Google Scholar] [CrossRef]
- Fu, L.; Wang, Q.; Zhang, M.; Zheng, Y.; Wu, M.; Lan, Z.; Pu, J.; Zhang, H.; Chen, F.; Su, W.; et al. Electrochemical Sex Determination of Dioecious Plants Using Polydopamine-Functionalized Graphene Sheets. Front. Chem. 2020, 8, 92. [Google Scholar] [CrossRef]
- Fu, L.; Wang, A.; Lai, G.; Su, W.; Malherbe, F.; Yu, J.; Lin, C.-T.; Yu, A. Defects regulating of graphene ink for electrochemical determination of ascorbic acid, dopamine and uric acid. Talanta 2018, 180, 248–253. [Google Scholar] [CrossRef]
- Motshakeri, M.; Travas-Sejdic, J.; Phillips, A.R.; Kilmartin, P. Rapid electroanalysis of uric acid and ascorbic acid using a poly(3,4-ethylenedioxythiophene)-modified sensor with application to milk. Electrochim. Acta 2018, 265, 184–193. [Google Scholar] [CrossRef]
- Fu, L.; Xie, K.; Zheng, Y.; Zhang, L.; Su, W. Graphene Ink Film Based Electrochemical Detector for Paracetamol Analysis. Electronics 2018, 7, 15. [Google Scholar] [CrossRef] [Green Version]
- Krishnan, R.G.; Rejithamol, R.; Saraswathyamma, B. Non-Enzymatic Electrochemical Sensor for the Simultaneous Deter-mination of Adenosine, Adenine and Uric Acid in Whole Blood and Urine. Microchem. J. 2020, 155, 104745. [Google Scholar] [CrossRef]
- Brainina, K.Z.; Bukharinova, M.A.; Stozhko, N.Y.; Sokolkov, S.V.; Tarasov, A.V.; Vidrevich, M.B. Electrochemical Sensor Based on a Carbon Veil Modified by Phytosynthesized Gold Nanoparticles for Determination of Ascorbic Acid. Sensors 2020, 20, 1800. [Google Scholar] [CrossRef] [Green Version]
- Hou, C.; Liu, H.; Zhang, D.; Yang, C.; Zhang, M. Synthesis of ZnO nanorods-Au nanoparticles hybrids via in-situ plasma sputtering-assisted method for simultaneous electrochemical sensing of ascorbic acid and uric acid. J. Alloys Compd. 2016, 666, 178–184. [Google Scholar] [CrossRef]
- Yang, Y.J.; Li, W. CTAB functionalized graphene oxide/multiwalled carbon nanotube composite modified electrode for the simultaneous determination of ascorbic acid, dopamine, uric acid and nitrite. Biosens. Bioelectron. 2014, 56, 300–306. [Google Scholar] [CrossRef]
- Huang, H.; Gao, Y.; Liu, A.; Yang, X.; Huang, F.; Xu, L.; Danfeng, X.; Chen, L. EIF3D promotes sunitinib resistance of renal cell carcinoma by interacting with GRP78 and inhibiting its degradation. EBioMedicine 2019, 49, 189–201. [Google Scholar] [CrossRef] [Green Version]
- Li, S.; Ma, Y.; Liu, Y.; Xin, G.; Wang, M.; Zhang, Z.; Liu, Z. Electrochemical sensor based on a three dimensional nanostructured MoS2 nanosphere-PANI/reduced graphene oxide composite for simultaneous detection of ascorbic acid, dopamine, and uric acid. RSC Adv. 2019, 9, 2997–3003. [Google Scholar] [CrossRef] [Green Version]
- Si, Y.; Park, J.W.; Jung, S.; Hwang, G.-S.; Goh, E.; Lee, H.J. Layer-by-layer electrochemical biosensors configuring xanthine oxidase and carbon nanotubes/graphene complexes for hypoxanthine and uric acid in human serum solutions. Biosens. Bioelectron. 2018, 121, 265–271. [Google Scholar] [CrossRef]
- Li, H.; Wang, Y.; Ye, D.; Luo, J.; Su, B.; Zhang, S.; Kong, J. An electrochemical sensor for simultaneous determination of ascorbic acid, dopamine, uric acid and tryptophan based on MWNTs bridged mesocellular graphene foam nanocomposite. Talanta 2014, 127, 255–261. [Google Scholar] [CrossRef] [PubMed]
Figure 1.
Schematic diagram of the fabrication of our proposed analytical sensor for the assessment of insect infestation in flour.
Figure 1.
Schematic diagram of the fabrication of our proposed analytical sensor for the assessment of insect infestation in flour.

Figure 2.
CVs of SPE, PEDOT/SPE, graphene/SPE, and graphene−PEDOT/SPE towards 10 μM uric acid.

Figure 3.
CVs of graphene−PEDOT/SPE towards 10 μM uric acid under different pH conditions of PBS.

Figure 4.
LSV of graphene-PEDOT/SPE towards 0.05–30 μM uric acid in PBS (pH = 7).

Figure 5.
LSV of graphene-PEDOT/SPE towards flour extract and flour extract with the addition of 10 μM uric acid.
Figure 5.
LSV of graphene-PEDOT/SPE towards flour extract and flour extract with the addition of 10 μM uric acid.


Table 1.
Comparison of the proposed sensor with other reported electrochemical sensors.
| Sensor | Linear Detection Range | Limit of Detection | Reference |
|---|---|---|---|
| ZnO-Au NPs | 4–400 μM | 2.375 μM | [35] |
| CTAB-GO/MWCNT | 3–60 μM | 1 μM | [36] |
| GO/TmPO4 | 10–100 μM | 5.9 μM | [37] |
| MoS2-PANI/RGO | 1–500 μM | 0.36 μM | [38] |
| PDDA-CNT-G/SPE | 5–50 μM | 4.4 μM | [39] |
| MWCNTs/MGF/GCE | 5–100 μM | 0.9 μM | [40] |
| graphene-PEDOT/SPE | 0.05–30 μM | 15 nM | This work |
Table 2.
Results and uric acid measurement using the proposed electrochemical sensor and the phosphotungstic acid reduction method.
Table 2.
Results and uric acid measurement using the proposed electrochemical sensor and the phosphotungstic acid reduction method.
| Egg Number | Phosphotungstic Acid Reduction | Electrochemical Sensor | ||
|---|---|---|---|---|
| Absorbance | Uric Acid Concentration | Current | Uric Acid Concentration | |
| 0 | 0.425 | 0.000 μM | 4.020 μA | 0.000 μM |
| 2 | 0.442 | 2.511 μM | 9.112 μA | 2.504 μM |
| 4 | 0.449 | 3.781 μM | 11.241 μA | 3.779 μM |
| 6 | 0.455 | 5.713 μM | 14.647 μA | 5.710 μM |
| 8 | 0.462 | 7.101 μM | 19.202 μA | 7.095 μM |
Publisher’s Note: MDPI stays neutral with regard to jurisdictional claims in published maps and institutional affiliations. |
© 2021 by the authors. Licensee MDPI, Basel, Switzerland. This article is an open access article distributed under the terms and conditions of the Creative Commons Attribution (CC BY) license (https://creativecommons.org/licenses/by/4.0/).
Share and Cite
MDPI and ACS Style
Fu, L.; Zhu, J.; Karimi-Maleh, H. An Analytical Method Based on Electrochemical Sensor for the Assessment of Insect Infestation in Flour. Biosensors 2021, 11, 325. https://0-doi-org.brum.beds.ac.uk/10.3390/bios11090325
AMA Style
Fu L, Zhu J, Karimi-Maleh H. An Analytical Method Based on Electrochemical Sensor for the Assessment of Insect Infestation in Flour. Biosensors. 2021; 11(9):325. https://0-doi-org.brum.beds.ac.uk/10.3390/bios11090325
Chicago/Turabian StyleFu, Li, Jiangwei Zhu, and Hassan Karimi-Maleh. 2021. "An Analytical Method Based on Electrochemical Sensor for the Assessment of Insect Infestation in Flour" Biosensors 11, no. 9: 325. https://0-doi-org.brum.beds.ac.uk/10.3390/bios11090325
Note that from the first issue of 2016, this journal uses article numbers instead of page numbers. See further details here.