4.1. Impacts of Nutritive Conditions on the Modality of the Bioluminescence Signal
Figure 1 reports the time-dependent bioluminescence response of Cd-responsive biosensors as a function of total Cd concentration in solution in the presence and absence of amino acids (
Figure 1A–D) for the nutritive conditions
x = 1 (glucose-containing solution without xylose;
Figure 1A,B) and
x = 0 (xylose-containing solution without glucose;
Figure 1C,D).
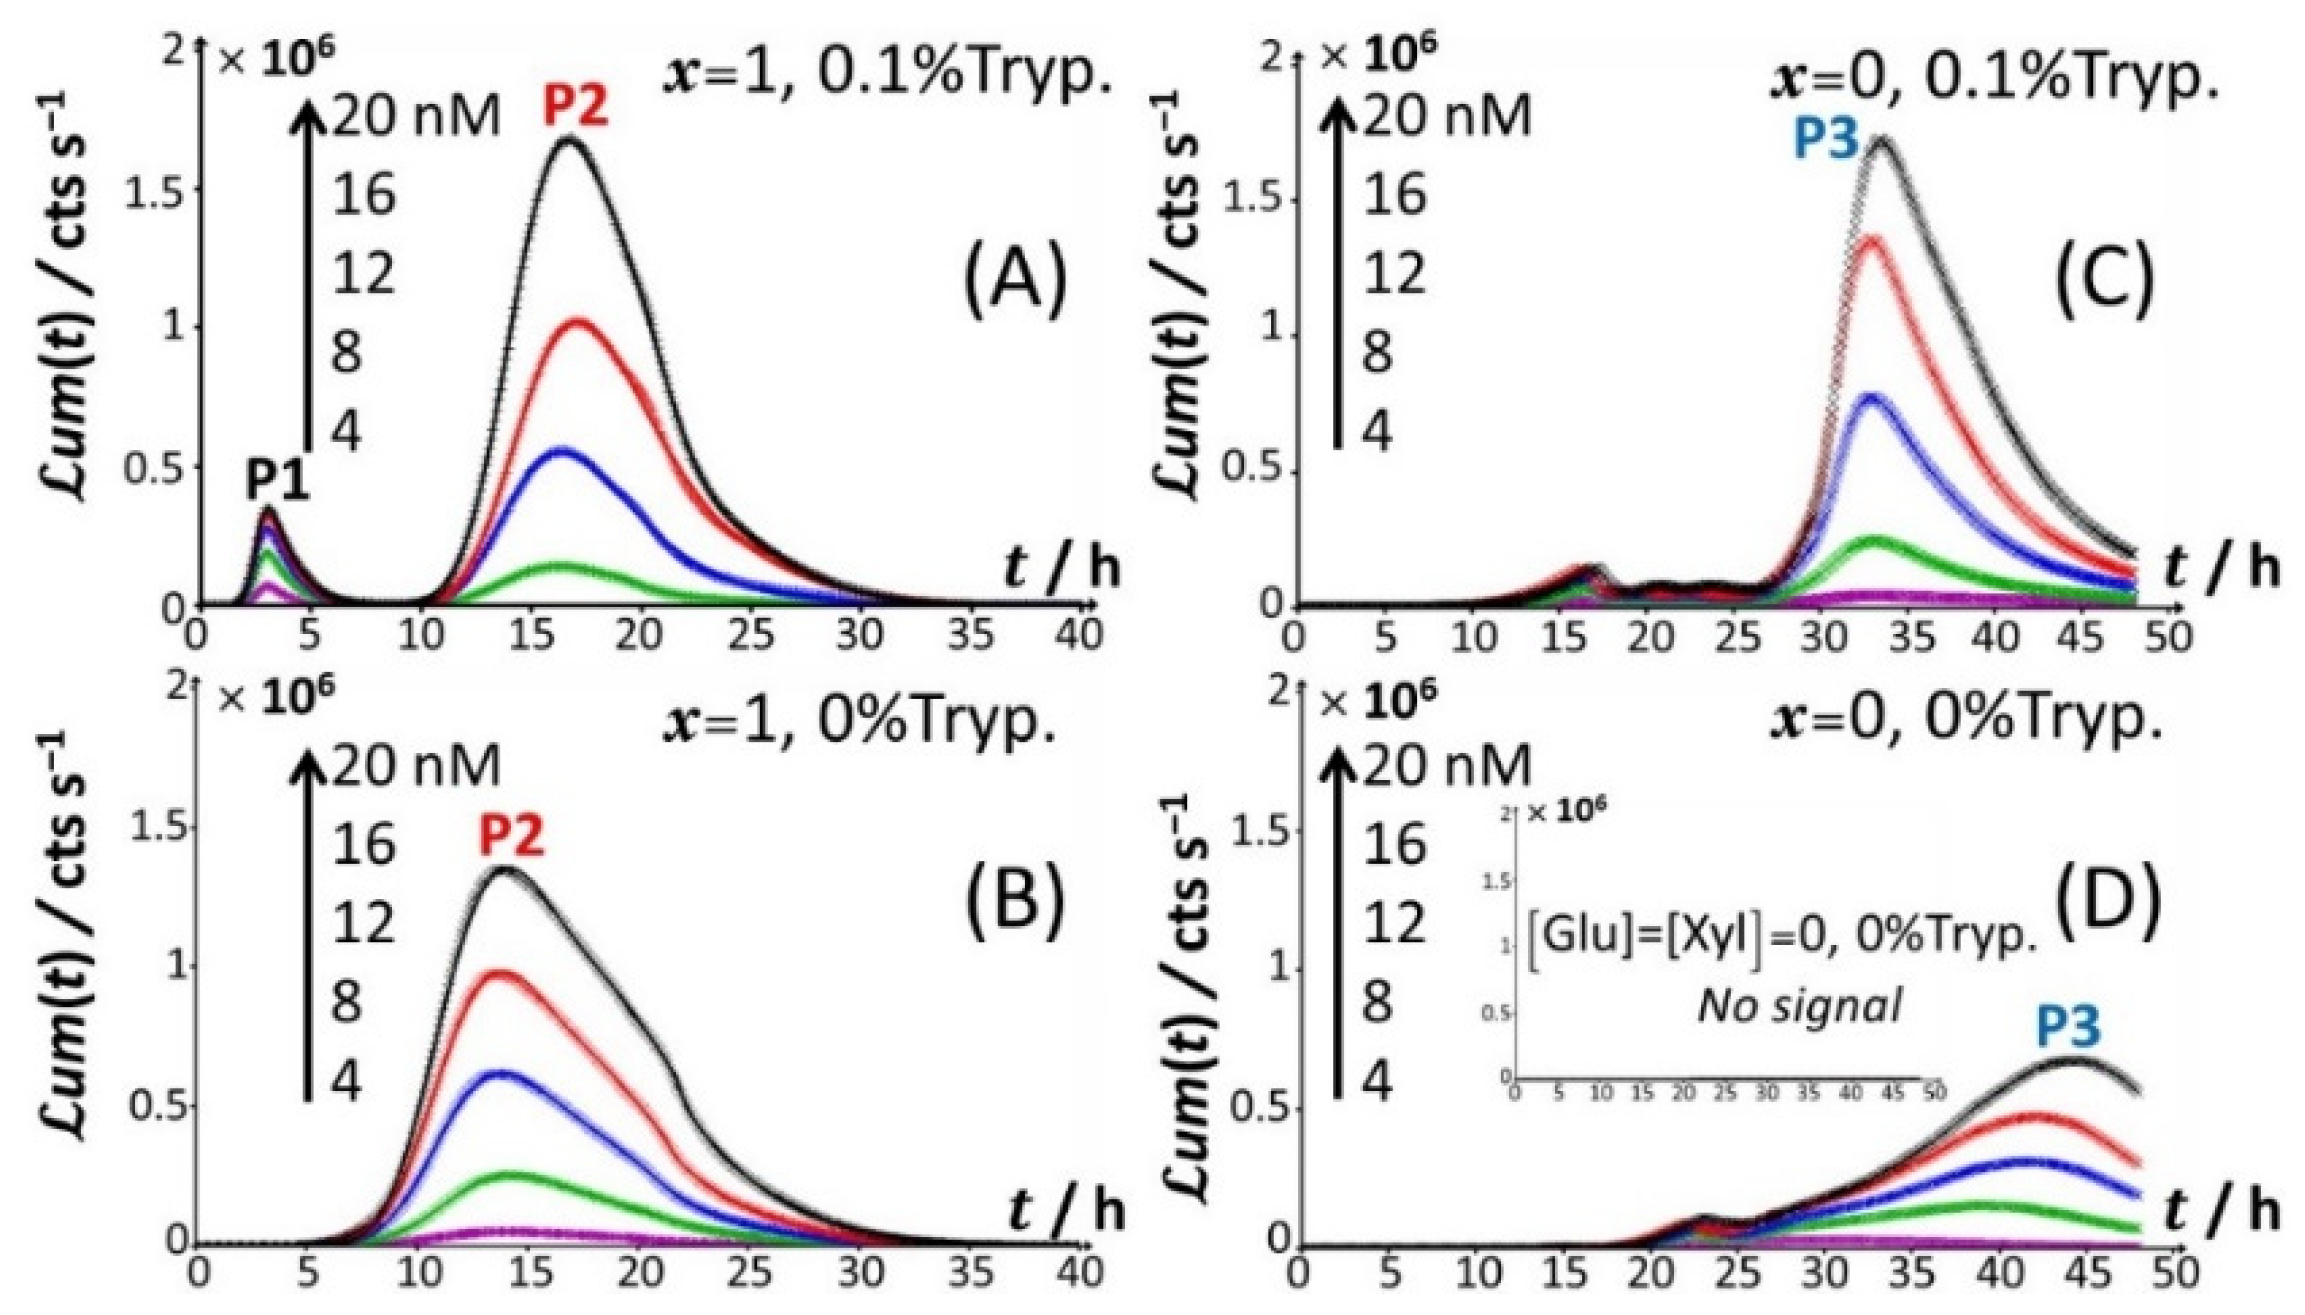
Under all examined medium conditions, the cell response took the form of bell-shaped signal(s) with a marked dependence on Cd concentration, which validates the genetic construction of a Cd-sensing
E. coli strain. In the presence of both amino acids and glucose (
Figure 1A), the bioluminescence emission is bimodal, with the appearance of a short-term peak (P1) at
tmax,1~3 h and a long-term peak (P2) at
tmax,2~16 h, where
tmax,1 and
tmax,2 correspond to the time positions where maxima in P1 and P2 are achieved, respectively. This bimodality is qualitatively in line with the bioluminescence data reported by Duval and Pagnout [
32] for another Cd-sensing luxCDABE
E. coli strain (JW3596) measured in a diluted nGGM medium (source of glucose) supplemented with LB as the source of amino acids (instead of tryptone in
Figure 1A). Briefly, the appearance of the two successive peaks originates from the stringent cell response. The first luminescence emission (peak P1) is controlled by the absorption of amino acids bioavailable in the medium and brought by tryptone. When there is a shortage of amino acids in solution, the level of uncharged tRNA critically increases, which results in the production of alarmones (p)ppGpp. These alarmones reprogram the resource-consuming processes by decreasing the levels of transcriptional machinery of tRNA and ribosome synthesis and by activating the transcription of genes for the biosynthesis of amino acids. In turn, cells recover their capacity to produce bioluminescence once they have self-palliated the deficiency of amino acids in solution, which is reflected by the appearance of the peak P2 [
32,
45]. In agreement with this stringent-response mechanism, the suppression of the amino acid source from the medium at
t = 0 leads to the only peak P2 and the absence of peak P1 (
Figure 1B). Under conditions where the medium contain amino acids but glucose is replaced by xylose (
Figure 1C), cell response develops into a distinctive peak (hereafter denoted as P3) appearing at
tmax,2~33–35 h, and this peak is preceded by wavy modulations of the bioluminescence in the time range of 15–25 h. Given the times at which P1 and P2 peaks are observed in
Figure 1A,B and the one marking the appearance of P3 in
Figure 1C, the shift from the glucose-to-xylose carbon source obviously and significantly delays the cell response and modify the cell energetic trade-off, leading to the aforementioned stringence-controlled production of luminescence. Remarkably, starting from the situation in
Figure 1C where xylose is the only carbon source, the suppression of amino acids in solution (
Figure 1D) leads to vanishing of the pre-cited wavy modulations in bioluminescence and to a better-defined signal located at the foot of peak P3 that then spreads over a larger time window (
tmax,3~30–45 h depending on Cd concentration). Finally, the lack of both amino acid and sugar carbon sources in the medium (inset
Figure 1D) result in the absence of any bioluminescence production, as expected from the recognized key importance of sugars as source of energy for bacteria. In order to refine our analysis of the way bioluminescence response is mediated by nutriment bioavailability (i.e., presence/absence of amino acids and presence/absence and nature of sugar components), the cell response patterns featured in
Figure 1 for the extremes
x = 0 and
x = 1 are detailed in
Figure 2 for conditions that cover a large range of
x-values between 0.02 and unity in a medium containing 0.1% tryptone.
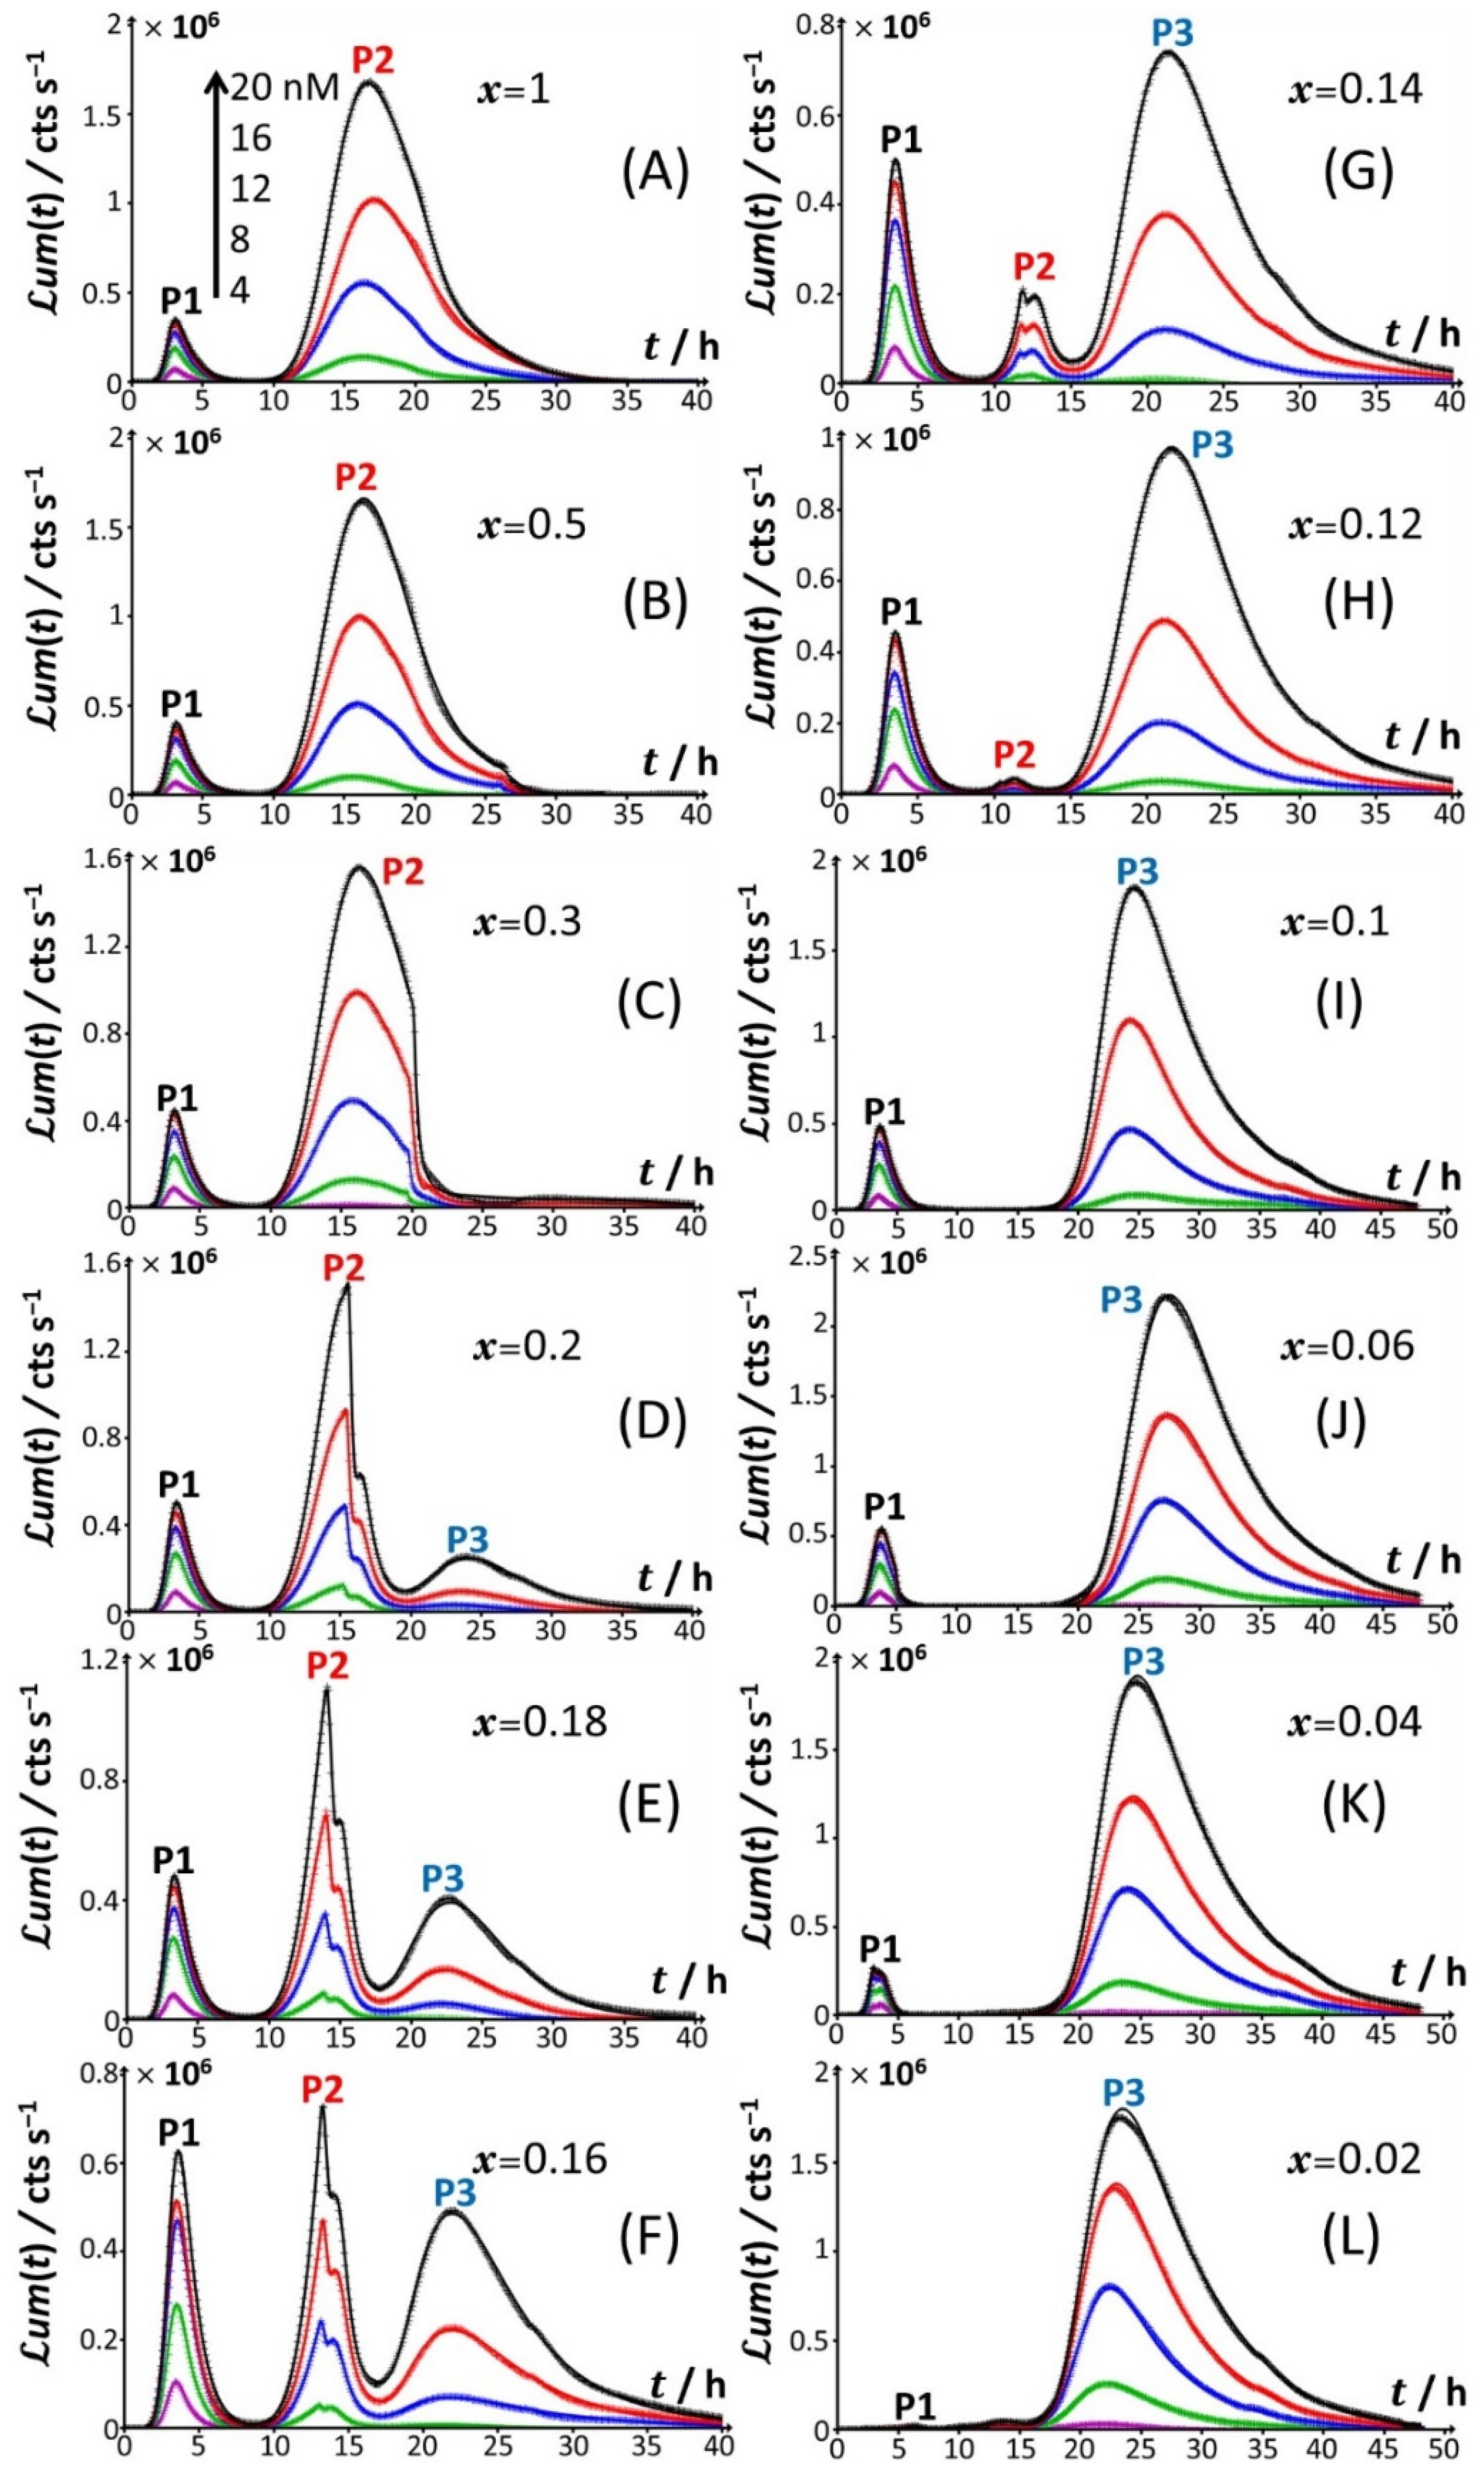
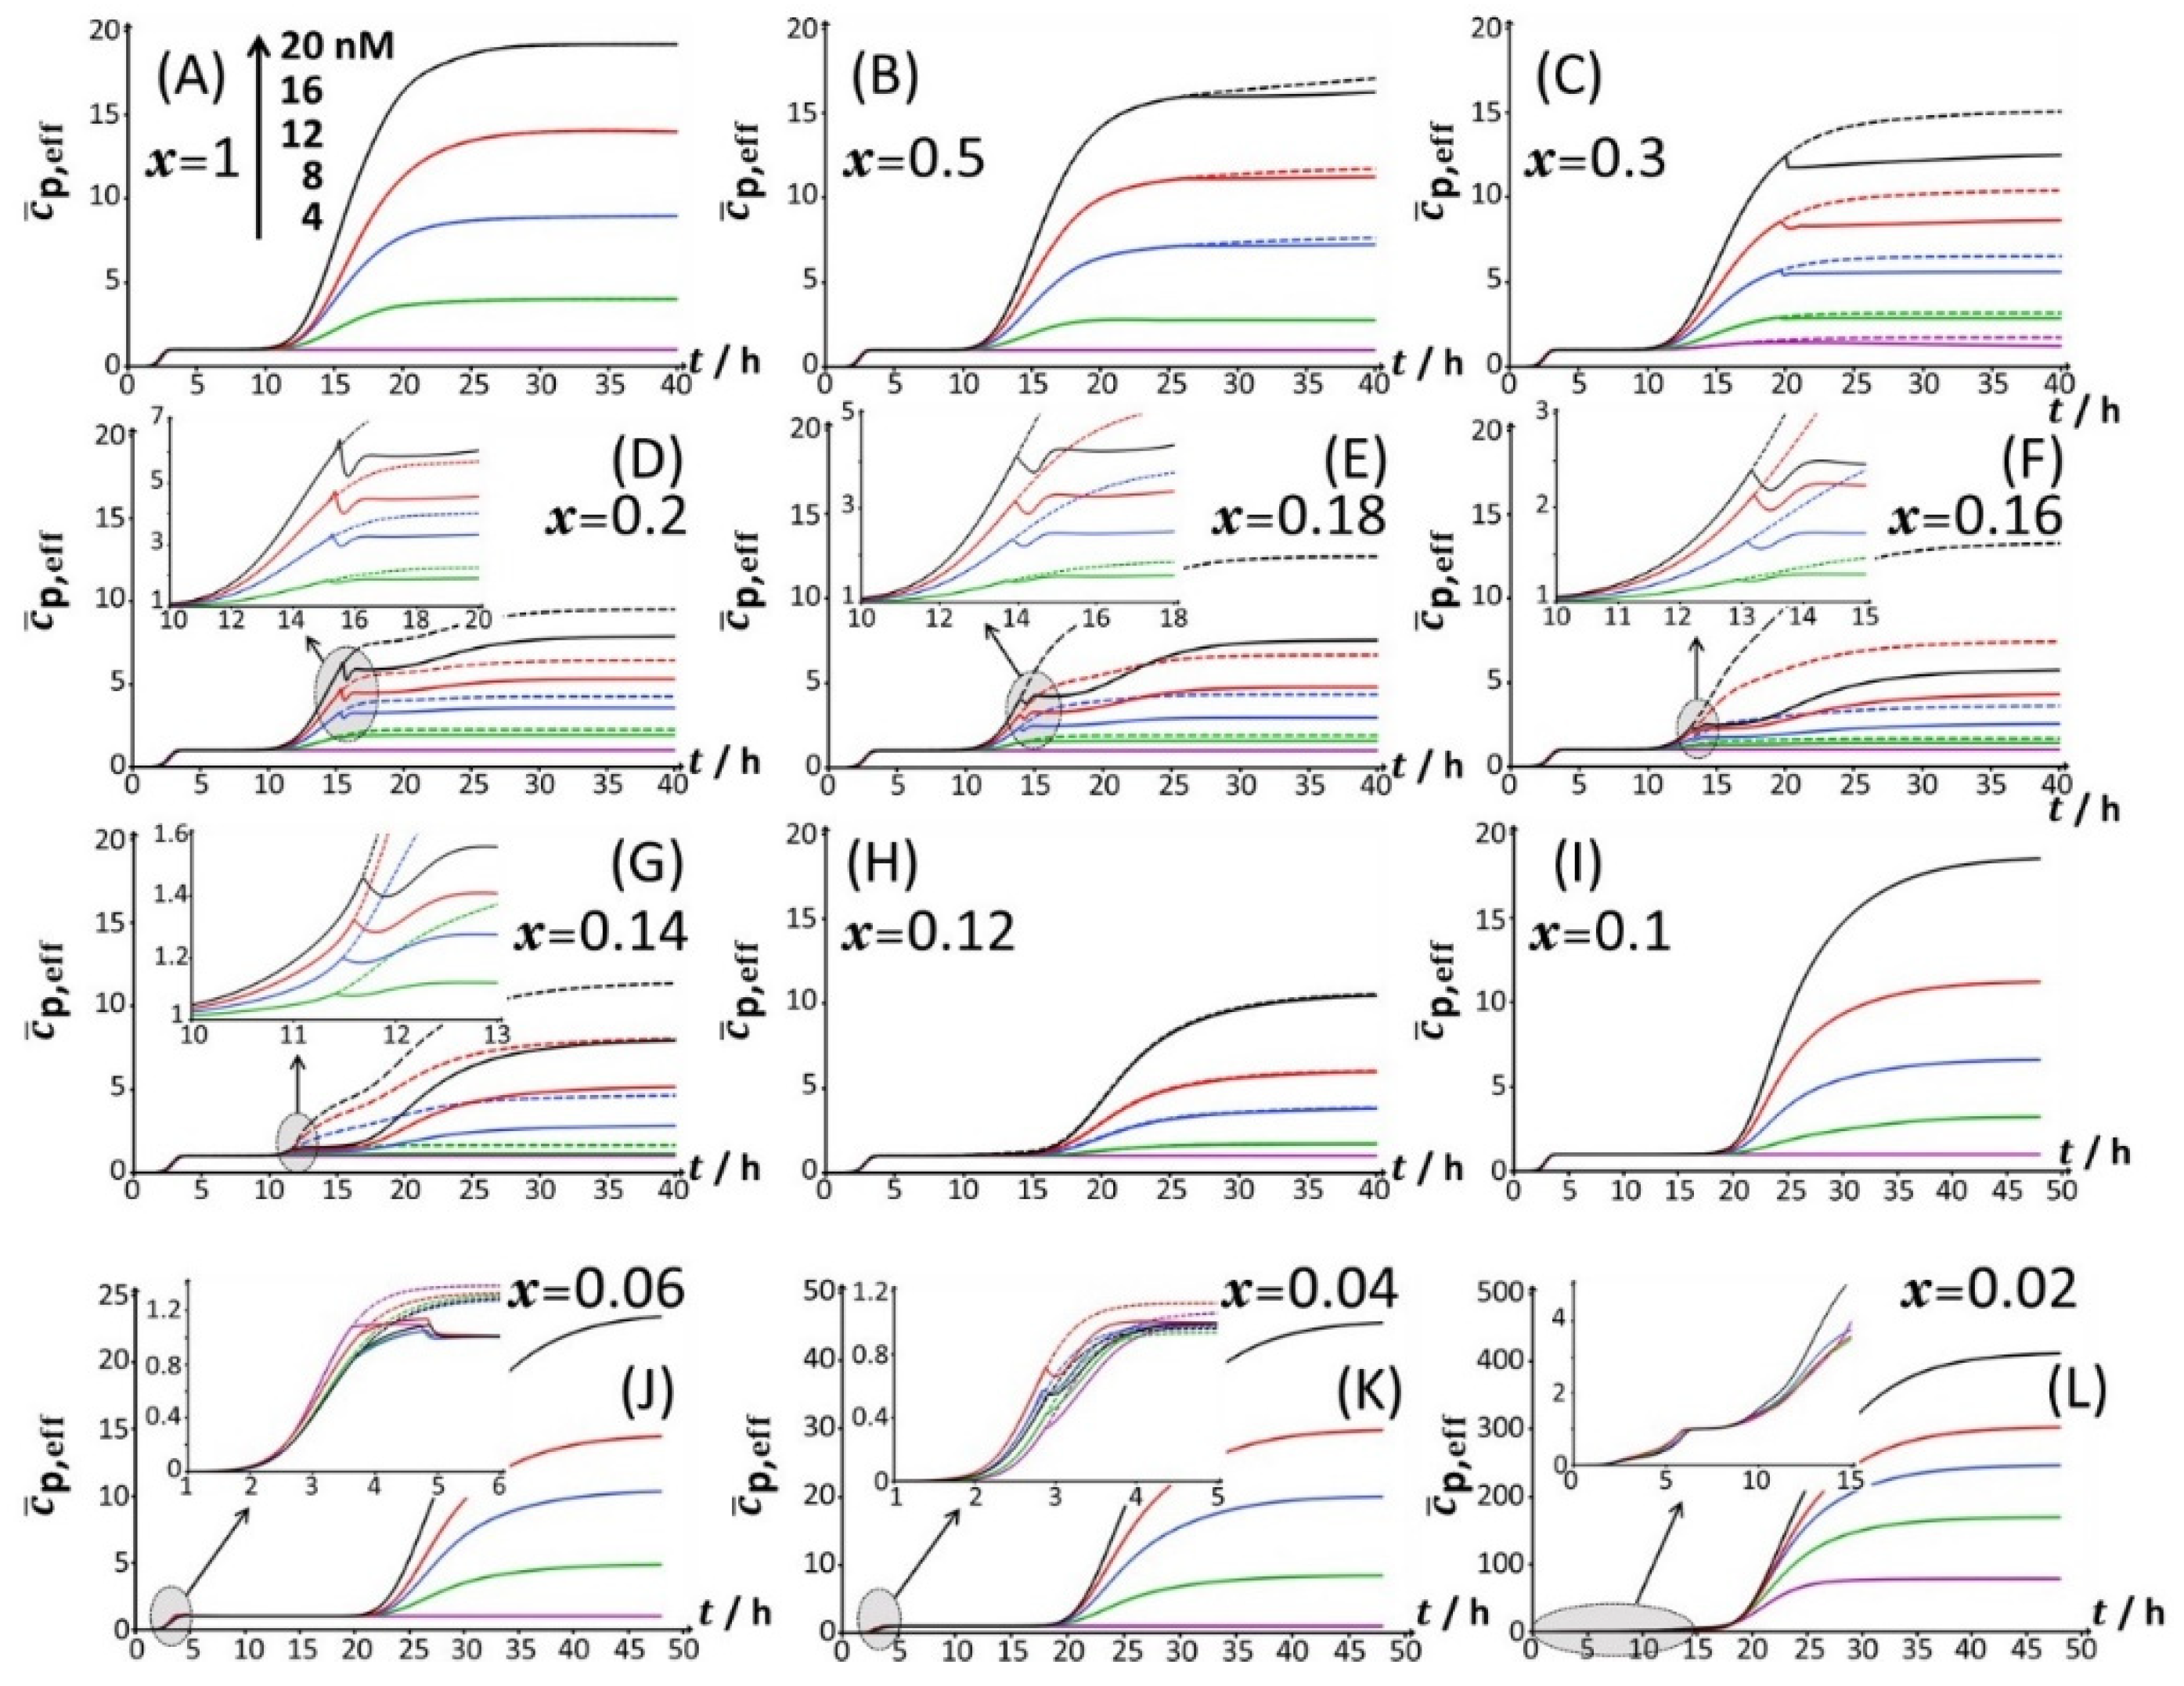
Starting from
Figure 2A, which corresponds to the nutrient conditions examined in
Figure 1A (
x = 1) and to a bimodal bioluminescence emission controlled by a stringent cell response (peaks P1 and P2 at
tmax,1~3 h and
tmax,2~16 h, respectively), a decrease in glucose concentration from
x = 1 to 0.5 and 0.3 (
Figure 2B,C) results in a truncated peak P2. The truncation appears at a timepoint hereafter denoted as
t2*, with
t2*~26 h and 20 h for
x = 0.5 and 0.3, respectively. This truncation materializes in an abrupt drop of the bioluminescence with time for
t >
t2* and a resulting discontinuity of the derivative of the signal with respect to time at
t=
t2*. In addition, the shape and time-position of peak P1 remain basically unchanged, as is the time position of peak P2 compared to the case
x = 1. With decreasing
x from 0.3 to 0.2 (
Figure 2D), the truncation of peak P2 is shifted to a shorter timepoint (
t2*~15 h), in agreement with the trend commented for
t2* when decreasing
x from 0.5 to 0.3. As a result, the time-position of the maximum of peak P2 slightly decreases to
tmax,2~
t2*~15 h. The new features in
Figure 2D are the appearance of a right shoulder in (the descending part of) the P2 signal (i.e., for
t2* <
t ≤ ~20 h) and the emergence of a third signal (peak P3) that spans over the time range of ~20 h ≤
t ≤ ~40 h and reaches a maximum at
tmax,3~24 h. The amplitude of peak P3 further increases with Cd concentration in solution. A progressive decrease in
x from 0.2 to 0.12 (
Figure 2D–H) leads to an increase in the magnitude of peak P3 at a fixed Cd concentration and to a concomitant gradual extinction of peak P2 (
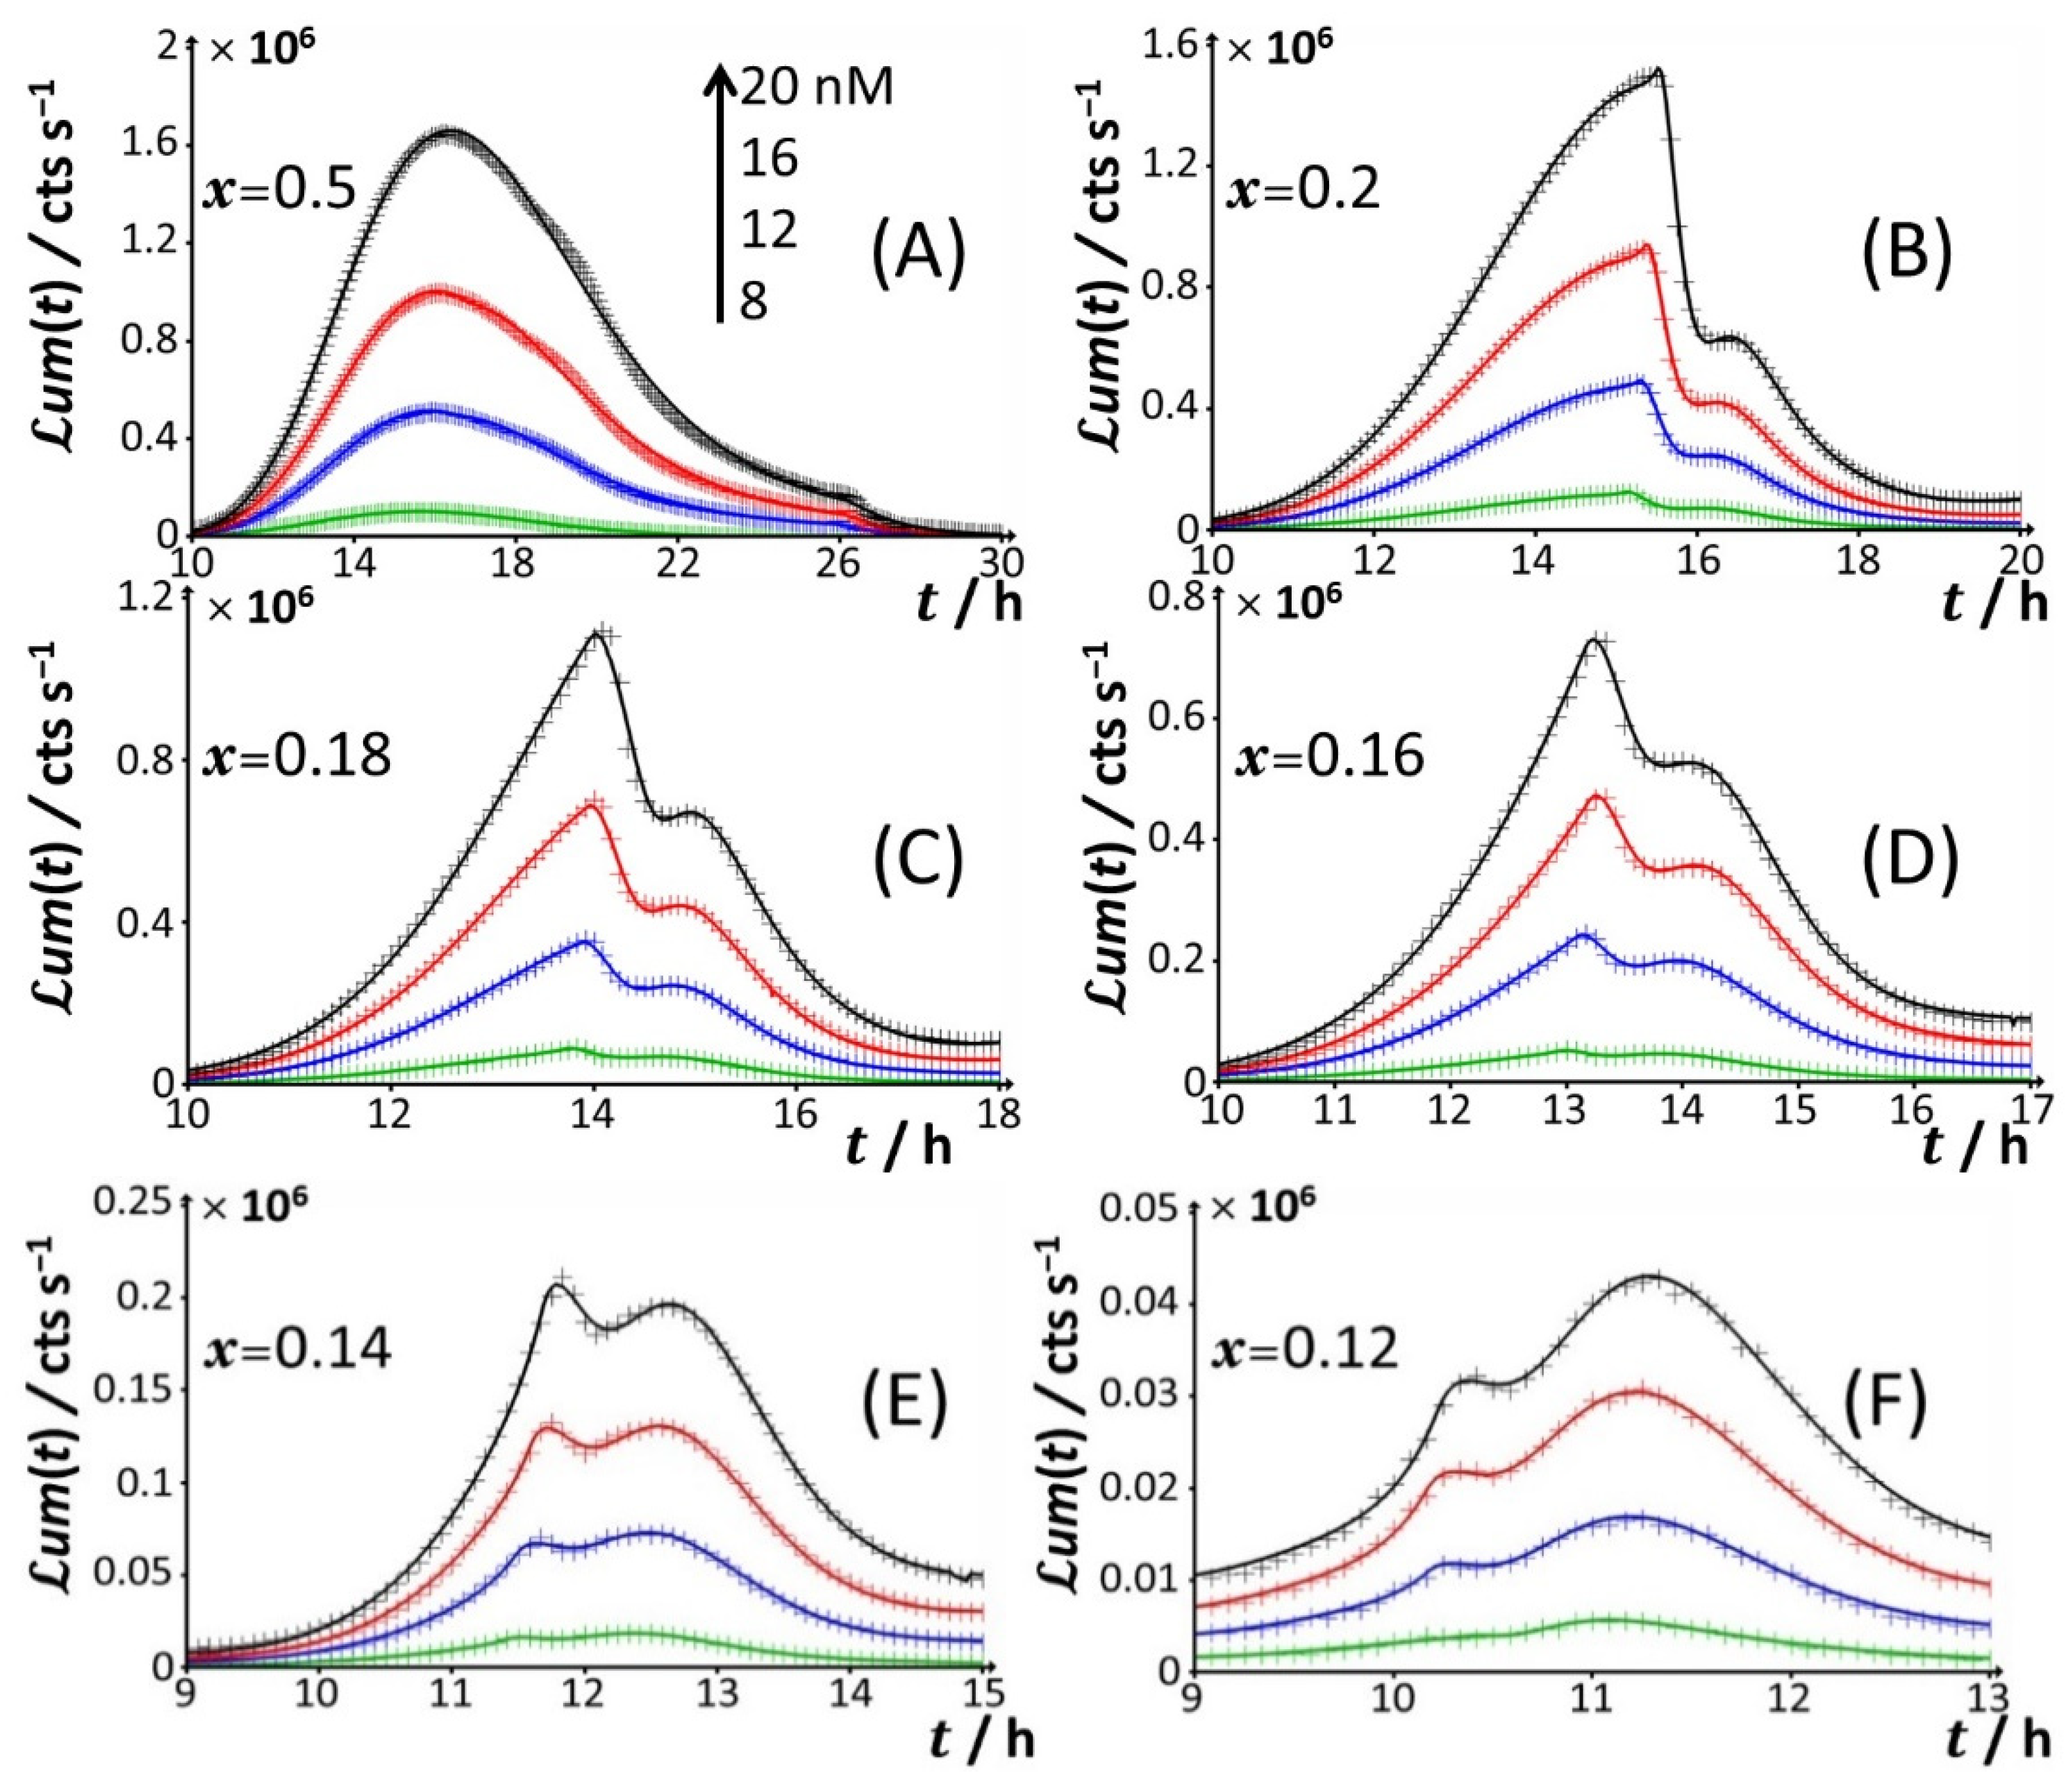
Figure 3). This extinction is accompanied by a truncation of the peak P2 that then appears earlier with time (decreasing
t2*), consistent with the trend described above for
t2* and 0.5 ≤
x ≤ 0.2 (
Figure 3). The associated discontinuity of the P2 signal, very well-observed at
x = 0.3 (
Figure 2C) and
x = 0.2 (
Figure 2D and
Figure 3B), leaves place at lower values of
x to a P2 signal that looks more like a doublet (
Figure 3D–F). This transition stems from the fact that the shoulder in peak 2 (as clearly observed at, e.g.,
x = 0.2) has gradually ‘cropped’ the whole P2 signal upon decreasing
x. In turn, this leads to a ratio between the two sequential (short-term and long-term) extrema identifiable within peak P2 that ranges from values larger than unity for 0.3 ≤
x ≤ 0.16 (
Figure 3B–D), to ~1 for
x = 0.14 (
Figure 3E), and to values lower than unity for
x = 0.12 (
Figure 3F). Due to this increased contribution of the shoulder, positioned at the right side of the peak P2 at
x = 0.2, the delay of the appearance of peak P2 (
tmax,2) is shifted to shorter times when switching the carbon source from glucose to xylose in the range of 1 ≤
x ≤ 0.12 (
Figure 2 and
Figure 3), decreasing from
tmax,2~16 h at
x = 1 to
tmax,2~11.5 h at
x = 0.12.
For glucose concentrations corresponding to
x < 0.12 (
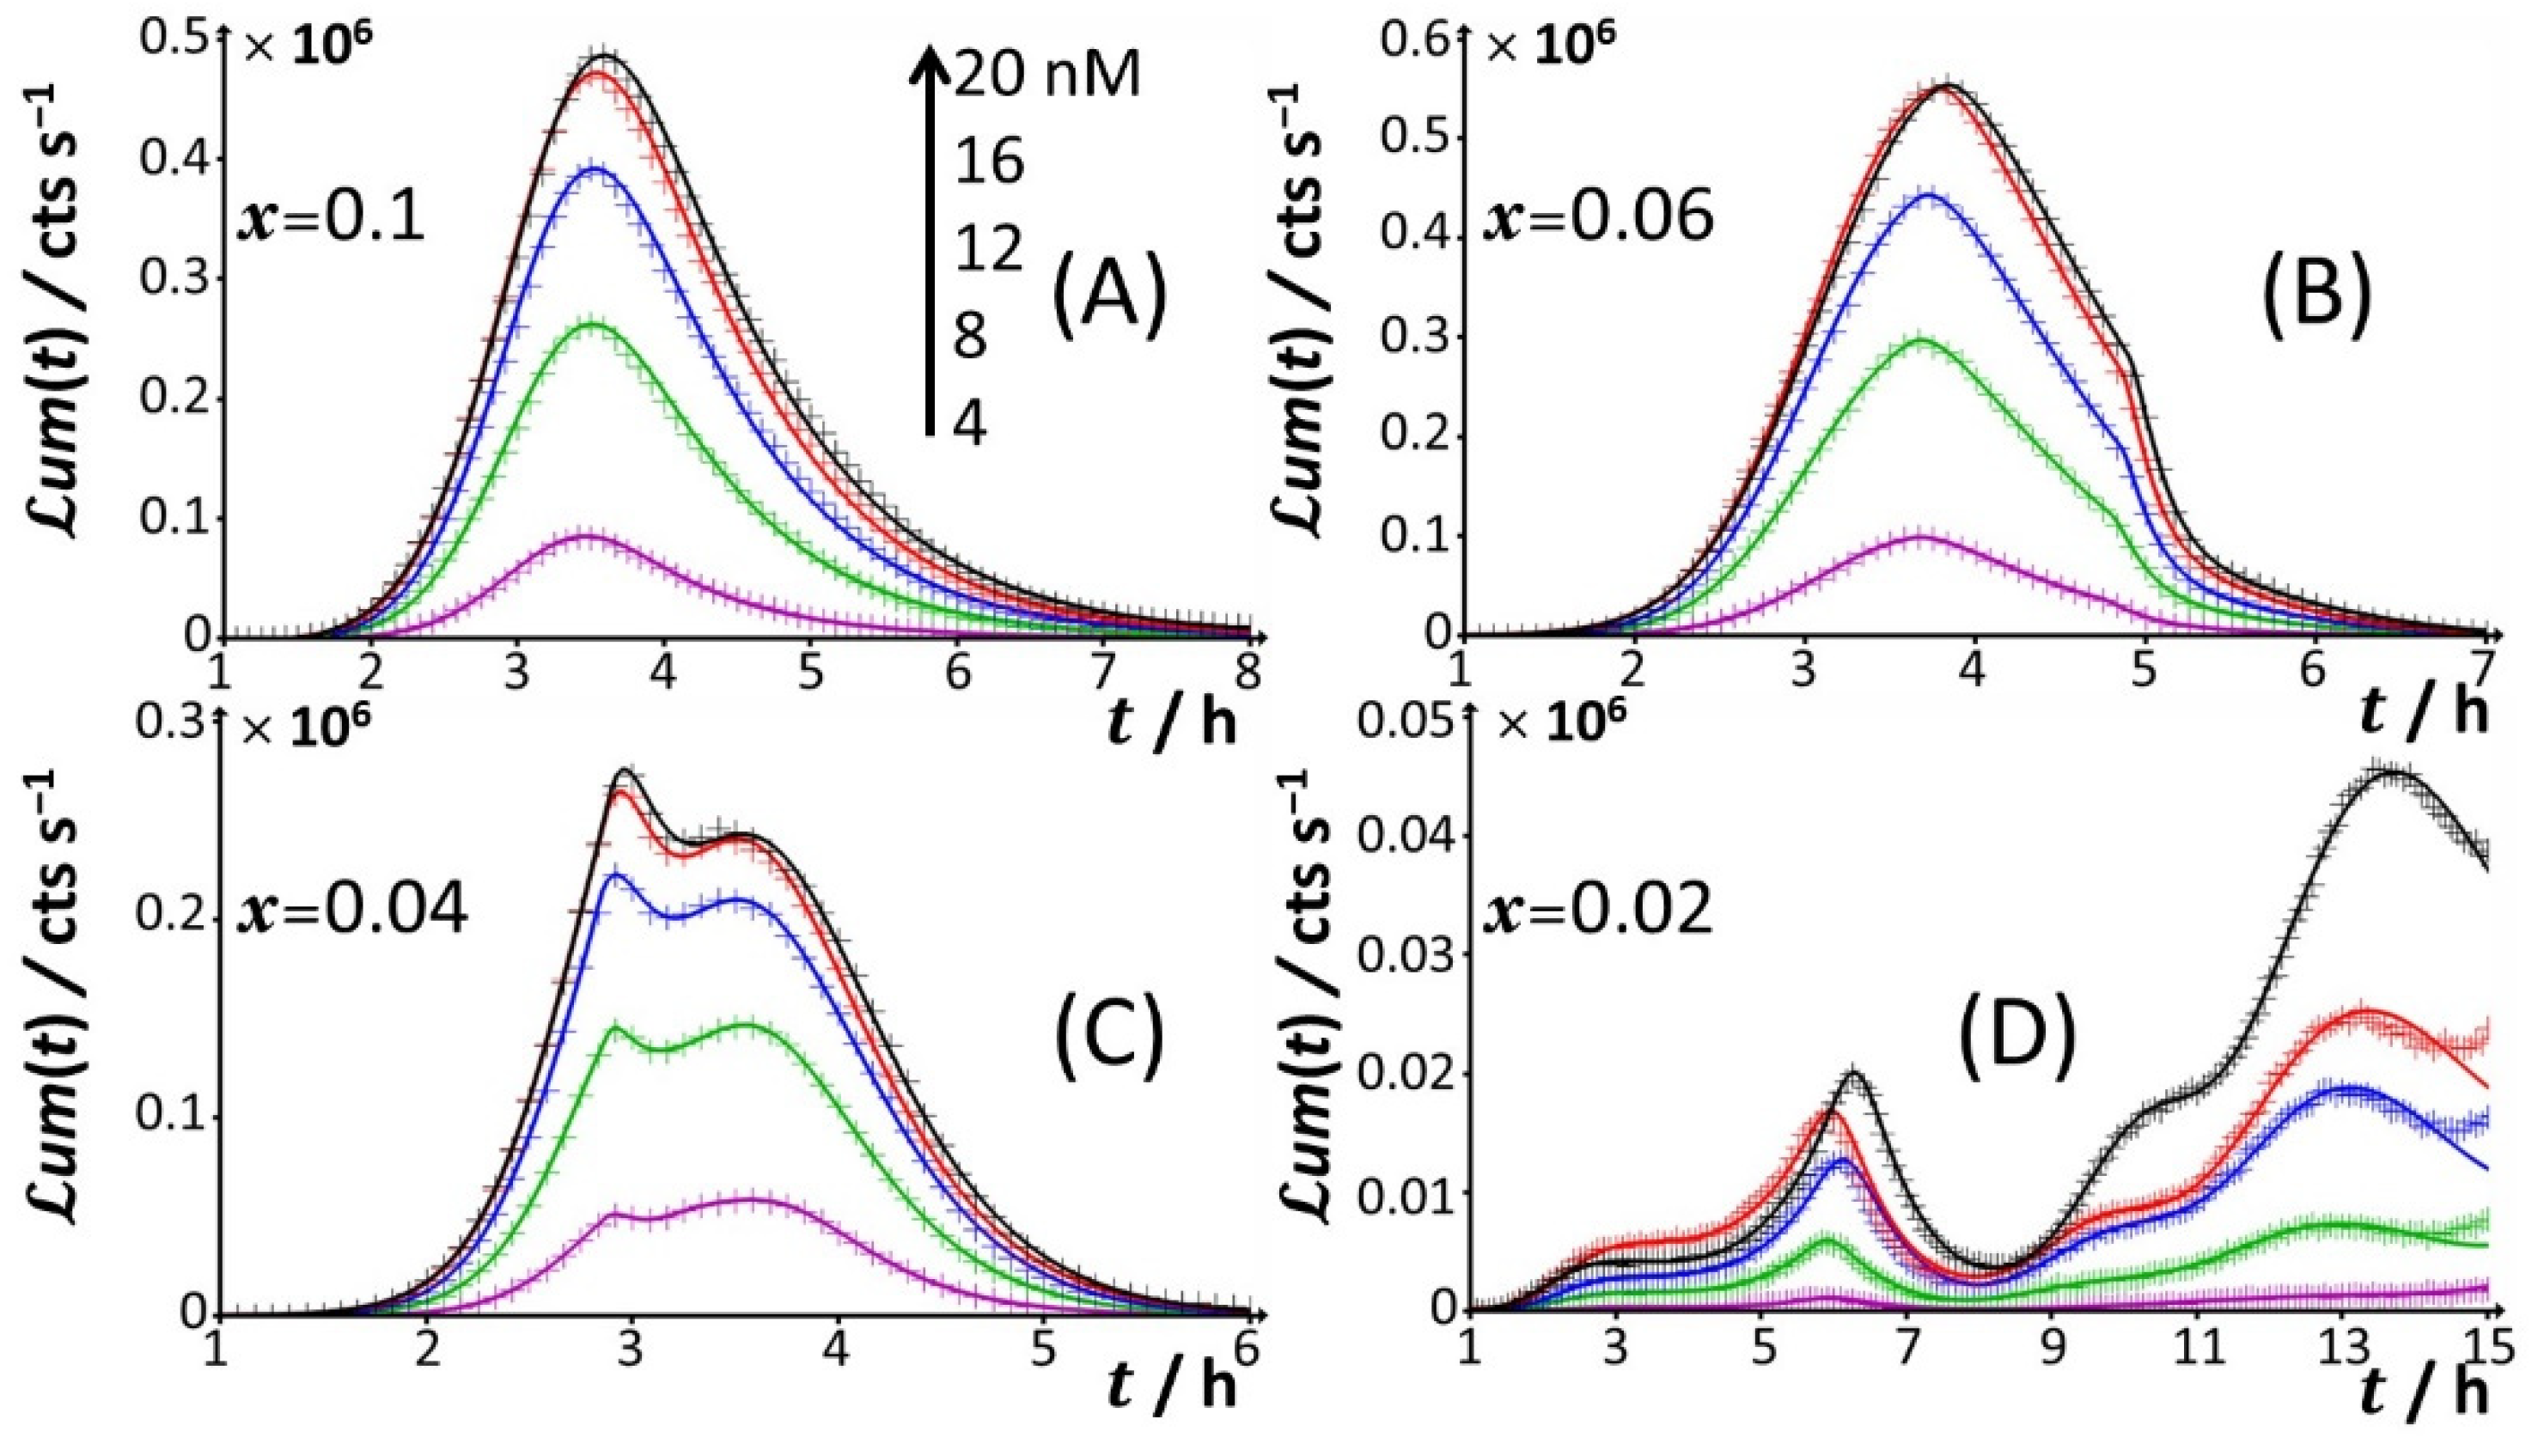
Figure 2I–L), peak P2 disappears and the signal takes the form of a P1–P3 bimodal emission. Remarkably, at sufficiently low
x in line with such a P1–P3 signal (i.e.,
x = 0.06), peak P1 is distinctly truncated (
Figure 2J and
Figure 4B) in a way similar to that previously detailed for peak P2 at
x = 0.5 and
x = 0.3. At lower values of
x (i.e.,
x = 0.04;
Figure 4C), the truncated peak P1 splits into two sub-peaks whose respective amplitudes clearly increase with Cd concentration before leveling off for 16–20 nM Cd in solution. The shape of the resulting doublet qualitatively conforms to that of peak P2 observed at
x = 0.14 (
Figure 3E). At
x = 0.02 (
Figure 2L and
Figure 4D), the defining properties of the P1 doublet are no longer recognizable in the bioluminescence emission pattern. Indeed, the magnitude of P1 peak has here largely decreased, and the overall cell response is then dominated by the peak P3 preceded by the wavy modulations in bioluminescence shown in
Figure 1D for glucose-lacking medium.
Figure 3.
Time-dependence of bioluminescence (
um(
t)) measured for the Cd-responsive
E. coli biosensor as a function of total Cd concentration in the range of 0–20 nM (indicated) in nGGM media supplemented with 0.1% tryptone and different concentrations of glucose and xylose (subsumed in the variable
x). Data are given for selected values of
x, and they refer to the only peak P2 identified in
Figure 1 and
Figure 2. The scale in Cd concentration and associated color nomenclature specified in (
A) apply to panels (
B–
F). (+) symbols: experimental data. Lines: reconstruction on the basis of the theory outlined in
Section 3. Signals were corrected by point-by-point subtraction of the corresponding cell response measured in 0 nM Cd concentration. See text for details.
Remarkably, when replacing the amino acid source (0.1% tryptone) with 0.15% LB, the basic features of the cell response shown in
Figure 2 when changing glucose concentration remain qualitatively similar (
Supplementary Figure S2). Specifically, the biosensor signal changes from a bimodal P1–P2 signal to a P1-truncated P2 signal with gradually decreasing
x, followed by a trimodal P1–P2–P3 emission, a bimodal P1–P3 response, and (finally) a bioluminescence response dominated by the only peak P3 at sufficiently low values of
x. The presence of a shoulder in the severely truncated peak P2, as illustrated in
Figure 2, is also shown in
Figure S2 (e.g., in panel D) despite the lower frequency of bioluminescence data acquisition adopted for measurements in LB (one measurement every 15 min instead of every 5 min; see
Figure 2), which makes the observation of signal truncation more difficult. Last, for a selected range of
x conditions, we verified that changing LB concentration (
Figure S3, 0.1% LB) qualitatively leads to the preservation of the different bioluminescence patterns measured in 0.15% LB. The observed differences are only relative to the respective magnitudes of the detected peaks P1, P2, and P3. This latter result echoes our previous finding on stringence-controlled cell response and the related LB concentration-dependent ratio between the maxima of peaks P1 and P2 [
32].
Figure 4.
Time-dependence of bioluminescence (
um(
t)) measured for the Cd-responsive
E. coli biosensor as a function of total Cd concentration in the range of 0–20 nM (indicated) in nGGM media supplemented with 0.1% tryptone and different concentrations of glucose and xylose (subsumed in the variable
x). Data are given for selected values of
x, and they refer to the only peak P1 identified in
Figure 1 and
Figure 2. The scale in Cd concentration and associated color nomenclature specified in (
A) apply to panels (
B–
D). (+) symbols: experimental data. Lines: reconstruction on the basis of the theory outlined in
Section 3. Signals were corrected by point-by-point subtraction of the corresponding cell response measured in 0 nM Cd concentration. See text for details.
Prior to detailed discussion of the mechanisms underlying the remarkable bioluminescence time-profiles with changing concentrations in amino acids and sugars (
Section 4.3), we quantitatively analyze the way the maxima of peaks P1, P2 and P3 depend on nutritive conditions and Cd concentration in solution.
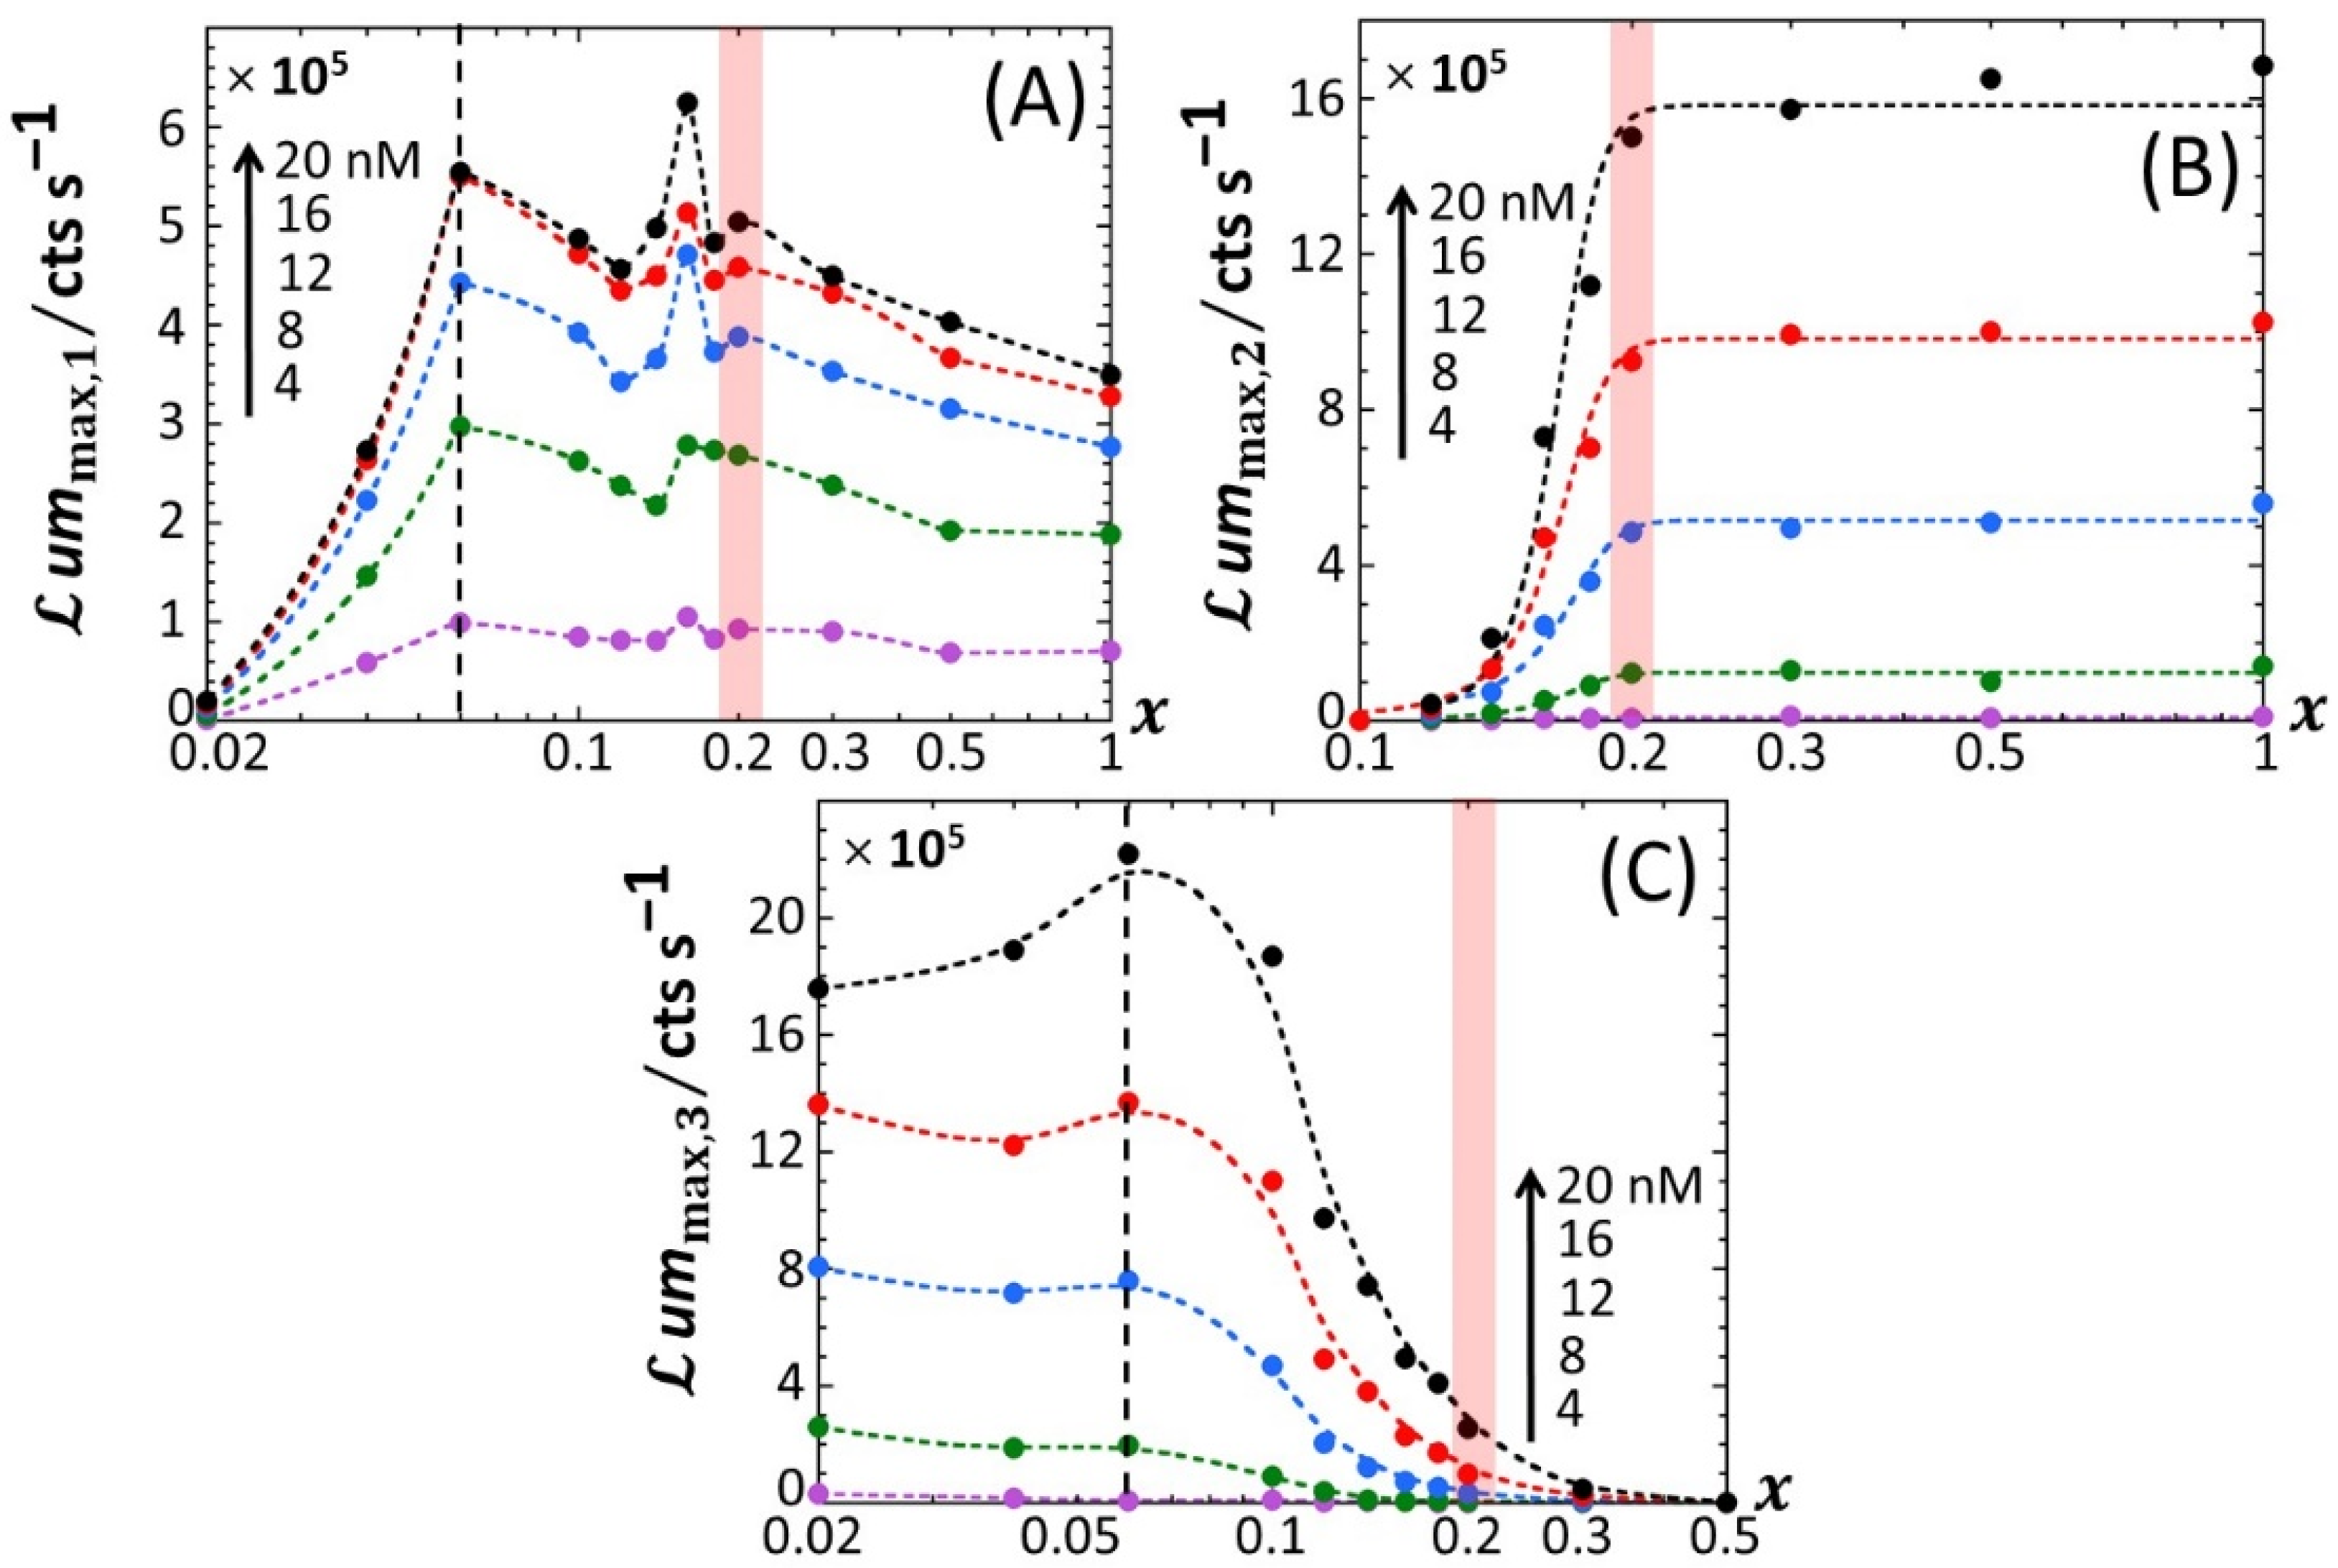
4.2. Impacts of Nutritive Conditions on Bioluminescence Maxima
Figure 5 reports the dependence of the maxima of the peaks P1, P2 and P3—denoted as
ummax,1,
ummax,2 and
ummax,3, respectively—on the dimensionless glucose to total sugar concentration ratio,
x and on the total Cd concentration,
, under the conditions detailed in
Figure 2,
Figure 3 and
Figure 4 (0.1% tryptone). The critical value of
x where peak P3 appears in the biosensor response, denoted hereafter as
x* with
x*~0.2, is explicitly indicated by the red-colored transition zone in
Figure 5. In the range of
x-values satisfying
x >
x*, the biosensor response displays a P1–P2 bimodality over time with
ummax,1 that somewhat increases with decreasing
x from 1 to
x* for
≥ 8 nM (
Figure 5A). In addition, at fixed
x ummax,1 clearly levels off for
≥ 16 nM. In contrast, under such conditions,
ummax,2 remains independent of
x and increases with
in the whole range of examined metal concentration (
Figure 5B). With decreasing glucose concentration from
x =
x* to 0.02,
ummax,2 monotonously decreases to 0 regardless of Cd content in solution. This suppression of peak P2 is combined with the appearance of peak P3, whose magnitude
ummax,3 increases with decreasing
x from
x =
x* to 0.02 while passing through a maximum (at
x~0.06) that is most pronounced at large
(
Figure 5C). This transition from a P1–P2 to P1–P3 bimodal emission is further clearly marked by a local maximum in
ummax,1 at
x = 0.16 (
Figure 5A), which is followed by a further increase in
ummax,1 with decreasing
x from 0.16 to 0.06 and by a massive decrease in
ummax,1 with decreasing
x from 0.06 to 0.02. Remarkably, the position
x~0.06 of the maximum in
ummax,3 corresponds to the onset of the significant decrease in
ummax,1 with decreasing
x (see vertical dotted lines in
Figure 5A,C).
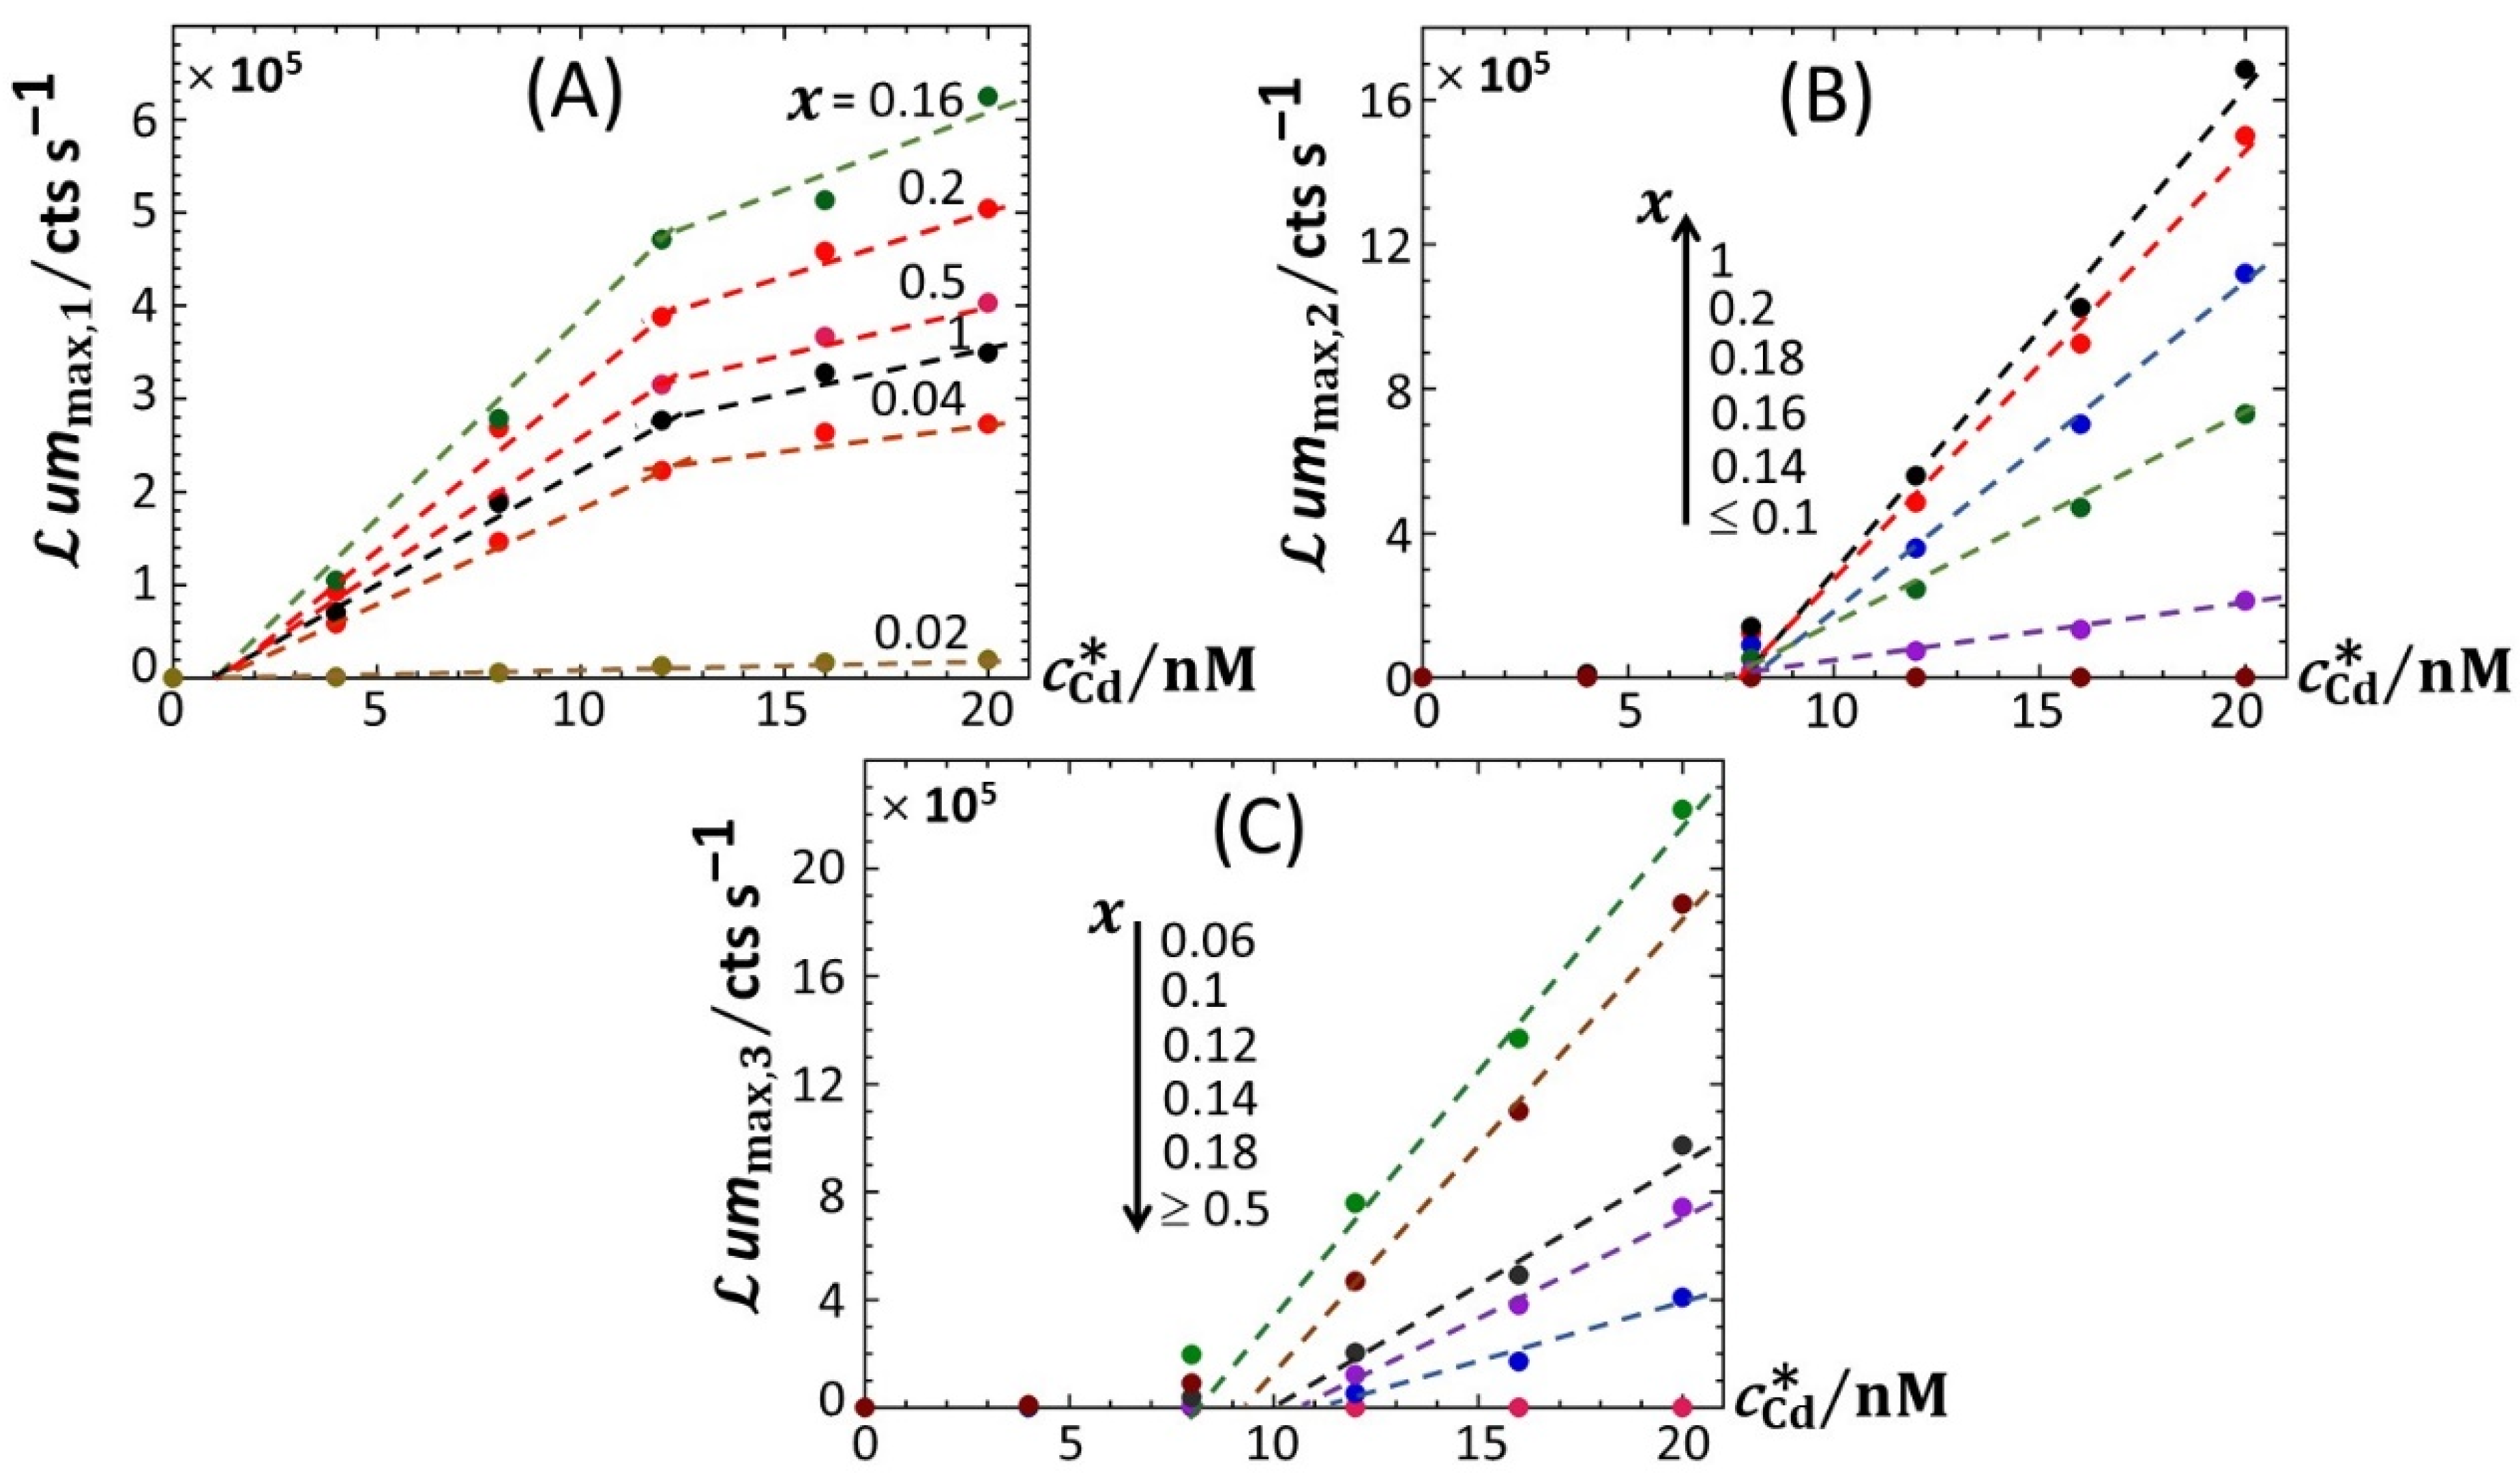
Figure 6A–C highlights how the increase in
ummax,1,
ummax,2 and
ummax,3 with increasing
, respectively, is impacted by switching the carbon source from glucose to xylose. Starting with
Figure 6B (
Figure 6C),
ummax,2 (
ummax,3, respectively) increases linearly with
, and the more so as
x increases (decreases, respectively), in agreement with the qualitative inspections of
Figure 5B,C. The data further indicate that the threshold value of Cd concentration above which bioluminescence is produced in the emission mode corresponding to peak P2 (ca. 8 nM) remains independent of
x but decreases for peak P3 from ~11 to ~8 nM with decreasing
x from 0.18 to 0.06. More remarkable are the data pertaining to peak P1 (
Figure 6A). Indeed, putting aside the
x-conditions corresponding to a significant extinction of peak P1 (i.e.,
x < 0.04; see
Figure 5A), for this emission mode, we note that the rate of linear increase in
ummax,1 with increasing
is clearly a function of
x for
< 12 nM, whereas this dependence is less marked at larger Cd concentrations. In turn, this feature marks a change in the slope of the plot
ummax,1 versus
at
= 12 nM.
For the sake of comparison, we report in
Figures S4 and S5 the equivalent of
Figure 5 for 0.1% and 0.15% LB media, respectively, containing glucose-to-xylose concentration ratios in the range of 0.1 ≤
x ≤ 1 and 0.02 ≤
x ≤ 1, respectively. In agreement with
Figure 2,
Figures S2 and S3, the findings revealed by
Figure 5 for
ummax,1,
ummax,2 and
ummax,3 in 0.1% tryptone medium also apply in 0.1% and 0.15% LB media. In particular, the presence of local maxima in the variation of
ummax,1 with
x is confirmed (
Figure 5A,
Figures S4A and S5A) in the range of 0.1 <
x < 0.2, especially at large
. Noticeably, the decrease in
ummax,3 measured at
= 20 nM when decreasing
x from 0.06 to 0.02 in 0.1% tryptone (
Figure 5C) is no longer observed in 0.15% LB (
Figure S5C). Unlike in 0.1% tryptone and 0.15% LB media,
ummax,1 remains further constant with decreasing
x from 1 to 0.3 in 0.1% LB over the whole range of adopted
values (
Figure S4A). As the analogue of
Figure 6 pertaining to data in 0.1% tryptone medium,
Figure S6 evidences linear dependences of
ummax,1,
ummax,2 and
ummax,3 on
in 0.1% LB with varying
x values (the same holds for the 0.15% LB medium; data not shown). The minimum Cd concentrations for the induction of bioluminescence in the P1 and P2 emission modes (3 and 6–7 nM, respectively) are comparable to those estimated in 0.1% tryptone, whereas the minimal Cd concentration for light induction in the P3 emission mode is independent of
x in 0.1% LB (ca. 11 nM instead of 8 nM-11 nM for 0.1% tryptone depending on
x). Interestingly, the presence of the two Cd concentration regimes identified in
Figure 6A from the change in the rate of increase in
ummax,1 with varying
in 0.1% tryptone is also observed in 0.1% LB (
Figure S6A), though the corresponding transition (positioned at
= 12–15 nM, depending on
x) in 0.1% LB is lesser marked. In addition, the dependence of
ummax,1 on
in 0.1% LB is impacted by
x to a smaller extent than in 0.1% tryptone.
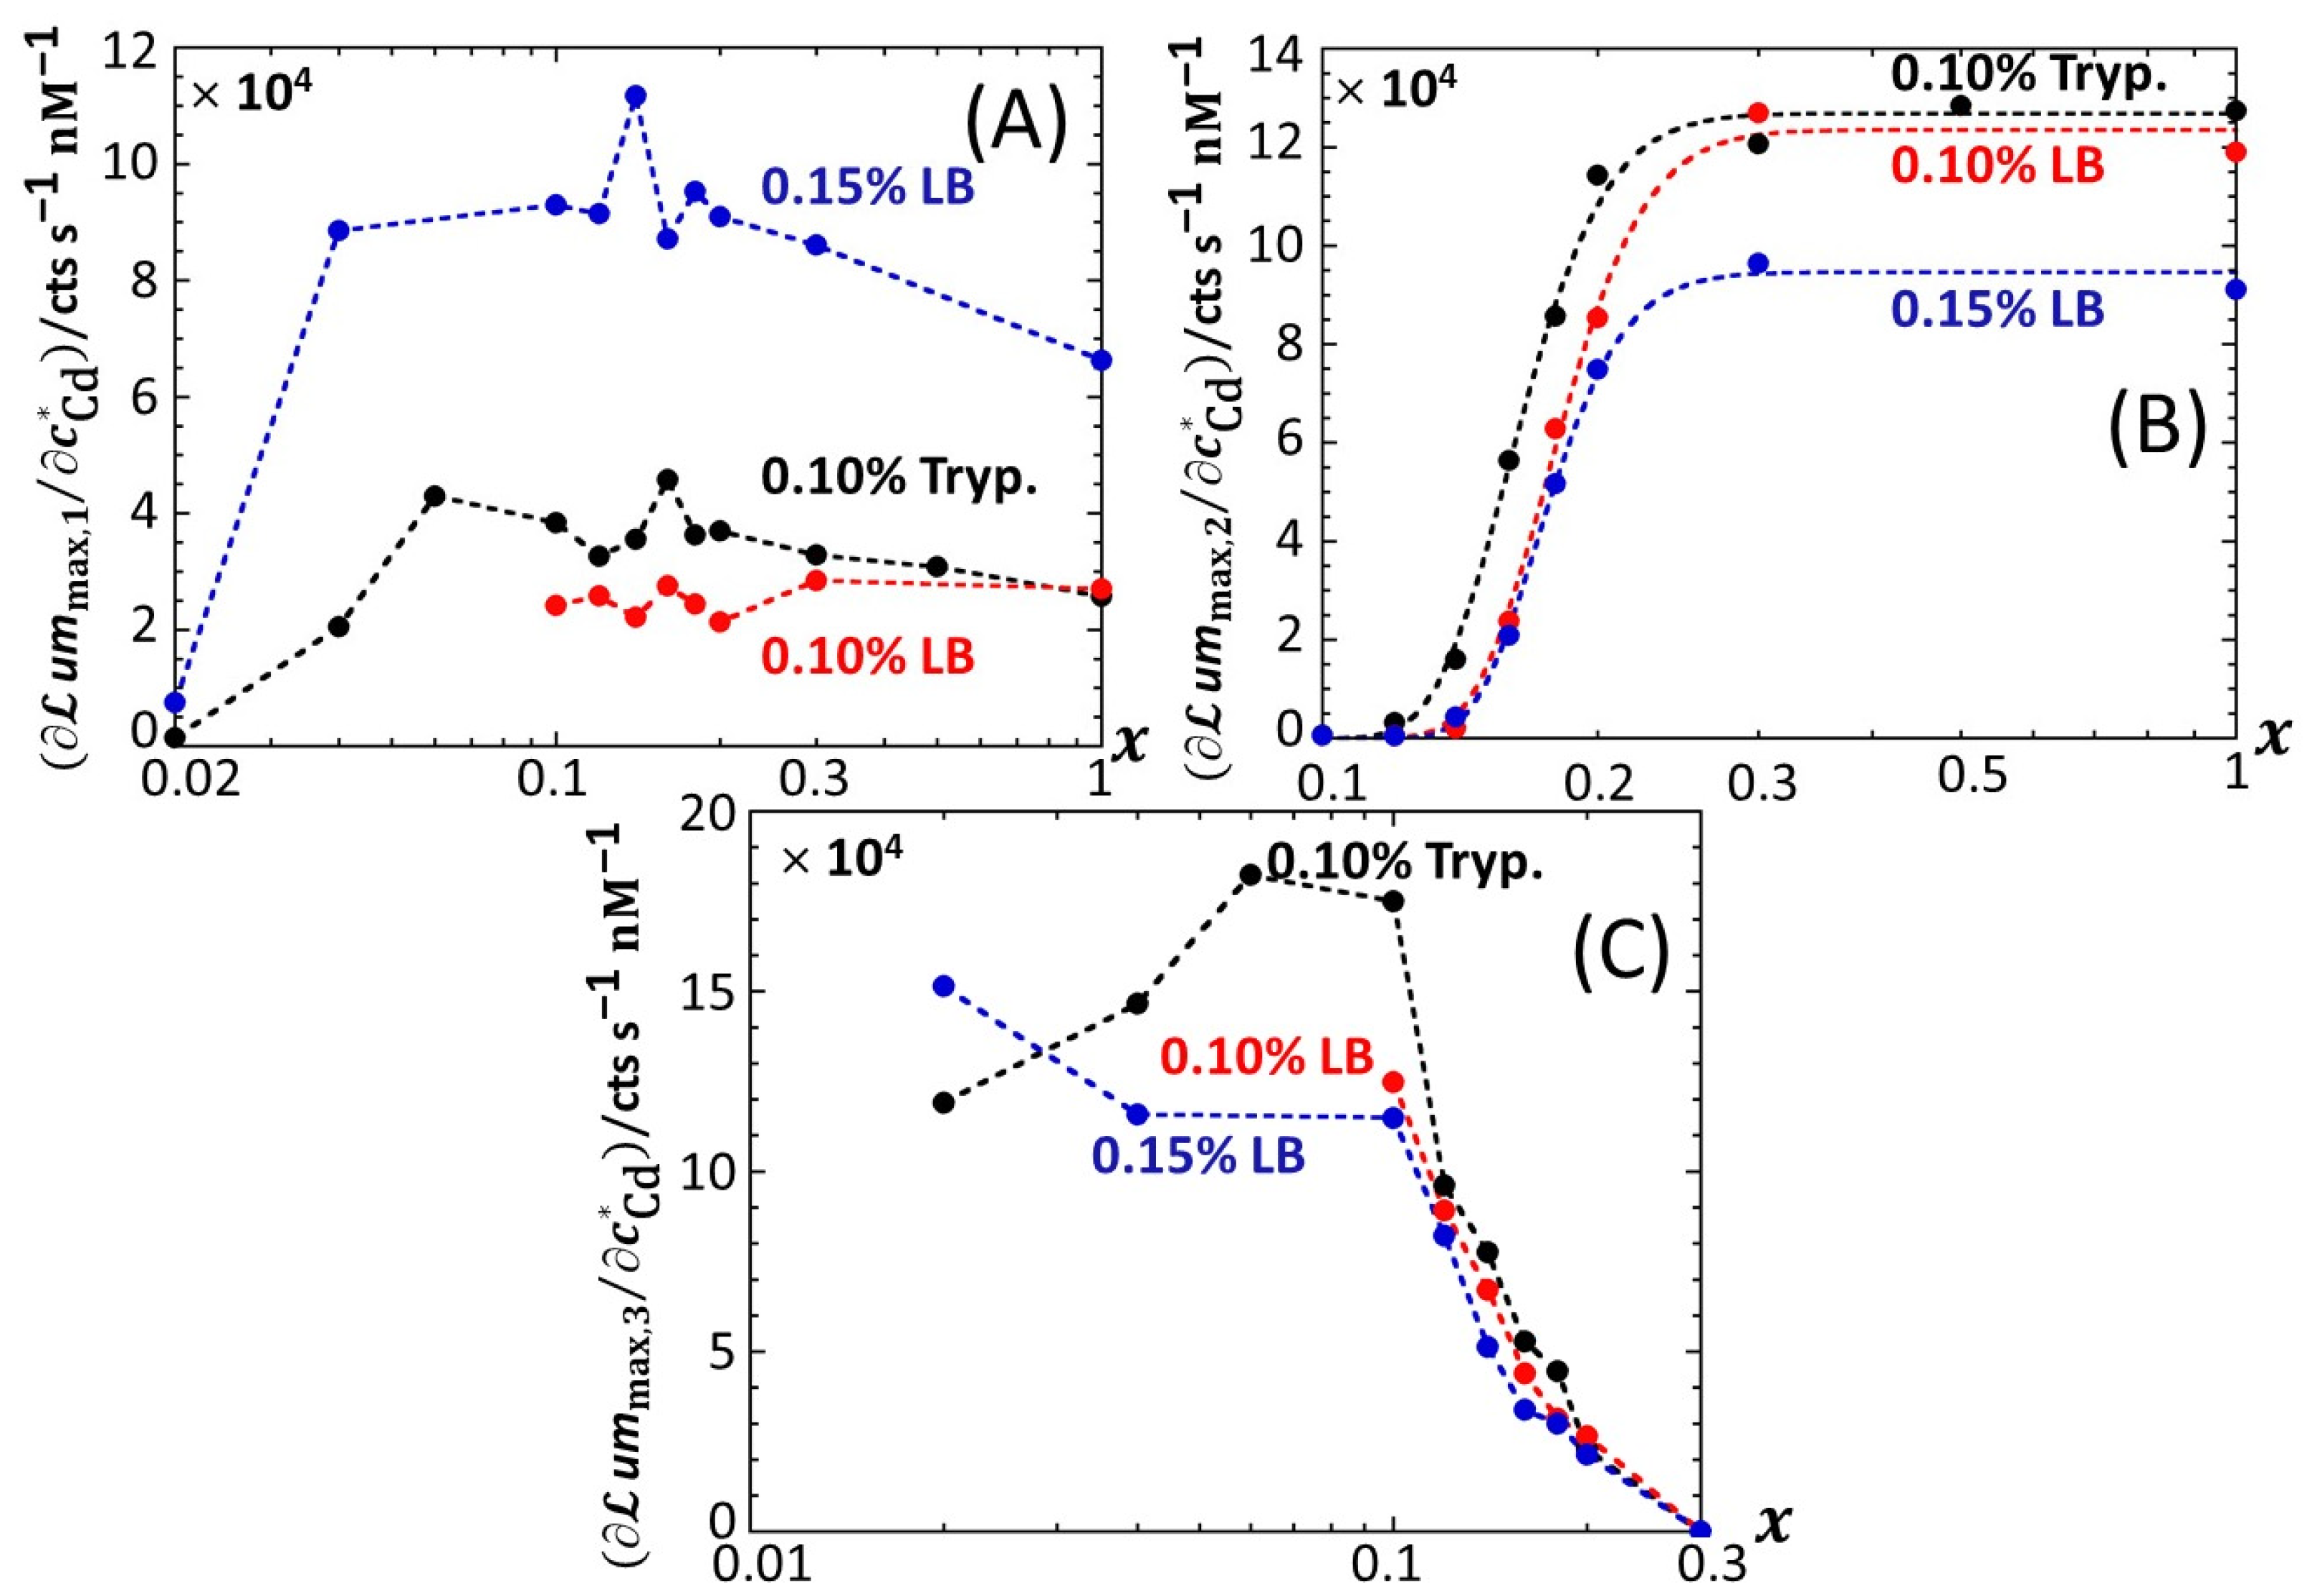
Figure 7 provides an overview of these comparative observations by reporting the slopes of
ummax,1 (
Figure 7A),
ummax,2 (
Figure 7B) and
ummax,3 (
Figure 7C) versus
for the various
x-conditions tested in 0.1% tryptone, 0.1% LB and 0.15% LB. The main conclusions drawn from
Figure 7 can be summarized as follows. First, the dependence of the slopes on
x as estimated for the P1, P2 and P3 emission modes qualitatively follows the variation of the corresponding peak maxima with changing
x (
Figure 5,
Figures S4 and S5). Quantitatively, the slopes pertaining to emission P1 at a fixed value of
x conform to the sequence of 0.1% LB~0.1% tryptone < 0.15% LB, with the notation ‘Y < Z’ meaning ‘the slope estimated in medium Y is lower than that in medium Z under given
x condition’; in the P2 emission mode, the slopes satisfy the sequence of 0.15% LB ≤ 0.1% LB ≤ 0.1% tryptone, and this sequence basically applies in the P3 emission. The respective magnitudes of the slopes relevant in P1 and P2 emissions in 0.1% and 0.15% LB media agree with the conclusions drawn from our previous work [
32] on the stringence-controlled bimodal cell response and variations thereof with changing LB concentration. Finally,
Figure 7B clearly highlights that the full suppression of peak P2 with decreasing glucose concentration occurs at a lower value of
x in 0.1% tryptone compared to that observed in 0.1–0.15% LB situations.
Figure 6.
Linear dependence of the maxima of the bioluminescence peaks P1 (
A), P2 (
B) and P3 (
C) on total Cd concentration in solution (indicated) at selected values of
x (indicated). (+) symbols: experimental data. Lines: linear regressions. Measurement conditions: nGGM media supplemented with 0.1% tryptone and different concentrations of glucose and xylose (subsumed in the variable
x). Data in this figure originate from those given in
Figure 2 (corrected for the corresponding reference measured at 0 nM Cd concentration).
Based on Equation (8), the sequence identified above for the slopes
in emission mode 1 (
Figure 7A) where the biouptake of amino acids determines light production, can be understood as follows. Whereas Cd speciation is expected to be more significant in 0.15% LB than in 0.1% LB, the rate of increase in
with
is larger in the former medium. Accordingly, we suggest from Equation (8) that it is the increase in the carrying capacity
from 0.1% to 0.15% LB that dominates the corresponding change in
rather than the expected increase in
. The latter should, if solely considered, have led to a decrease in the slope
from 0.1% to 0.15% LB (see Equation (8)). The higher is the concentration in amino acids and the lesser the rate of light production becomes limited by this resource (i.e., the carrying capacity is higher), thus leading to an increase in
even though metal ions are expected to be lesser bioavailable in 0.15% LB. The relative magnitudes of
in 0.1% LB and 0.1% tryptone are quite comparable, especially at high values of
x. Here, the loss in bioluminescence expected from the lower bioavailability of Cd ions in 0.1% LB due to a larger complexation (higher
in Equation (8)) than in 0.1% tryptone is counterbalanced by the higher quality of the provided food in the LB medium compared to that in tryptone (i.e., higher
) due to the presence of a yeast extract that contains various amino acids, vitamins and minerals [
46]. In turn, in qualitative agreement with Equation (8), both food quality and metal bioavailability features have to be advanced to understand the rather similar performance of the biosensors in 0.1% LB and 0.1% tryptone. Considering the stringence-controlled emission of light in mode 2, the sequence of slopes
is expected to be the invert of that discussed in mode 1. In line with [
32], this expectation is verified (
Figure 7B), at least for sufficiently large values of
x (>0.2–0.3) for which there is no limitation in glucose for cells to produce light. For lower values of
x where glucose-limitation clearly sets in with resulting decrease in
along with decreasing
x, differences between slopes measured in 0.1% tryptone, 0.1% LB and 0.15% LB become less pronounced as cells gradually shift the required sugar source for amino acid metabolism from glucose (P2 peak) to xylose (P3 peak). This in turn explains the opposite evolutions of
and
with decreasing
x (
Figure 7B,C), while the slope sequence versus the 0.1% tryptone, 0.1% LB, and 0.15% LB conditions in emission mode 2 is roughly the same as that in mode 3.
Figure 7.
Slopes associated with the linear regressions of
ummax,1 (
A),
ummax,2 (
B) and
ummax,3 (
C) versus
for the various
x-conditions tested in 0.1% tryptone, 0.1% LB and 0.15% LB media (specified). (+) symbols: experimental data. Lines: guides for the eyes. Data in this figure originate from those given in
Figure 2,
Figures S2 and S3 (corrected for the corresponding reference measured at 0 nM Cd concentration).
4.3. Origin of the Observed Modulations of the Bioluminescence Signal with Time an Metal Concentration: Interplay between Stringent Response and Catabolite Repression
Figure 1,
Figure 2,
Figure 3 and
Figure 4 discussed in
Section 4.1 evidence marked modulations of the time-dependent bioluminescence response with varying medium composition under a given Cd concentration condition. These changes of the biosensor signal are intimately connected to the metabolic pathway at stake over time, depending on the bioavailability and nature of the resources in solution. In the presence of amino acids (either tryptone or LB) and a significant source of carbon brought by glucose (
Figure 1A,
Figures S2A and S3A), peak P1 in the bimodal P1–P2 signal follows the uptake of amino acids. Their ensuing depletion from solution triggers a stringent cell response that leads to peak P2, as detailed elsewhere [
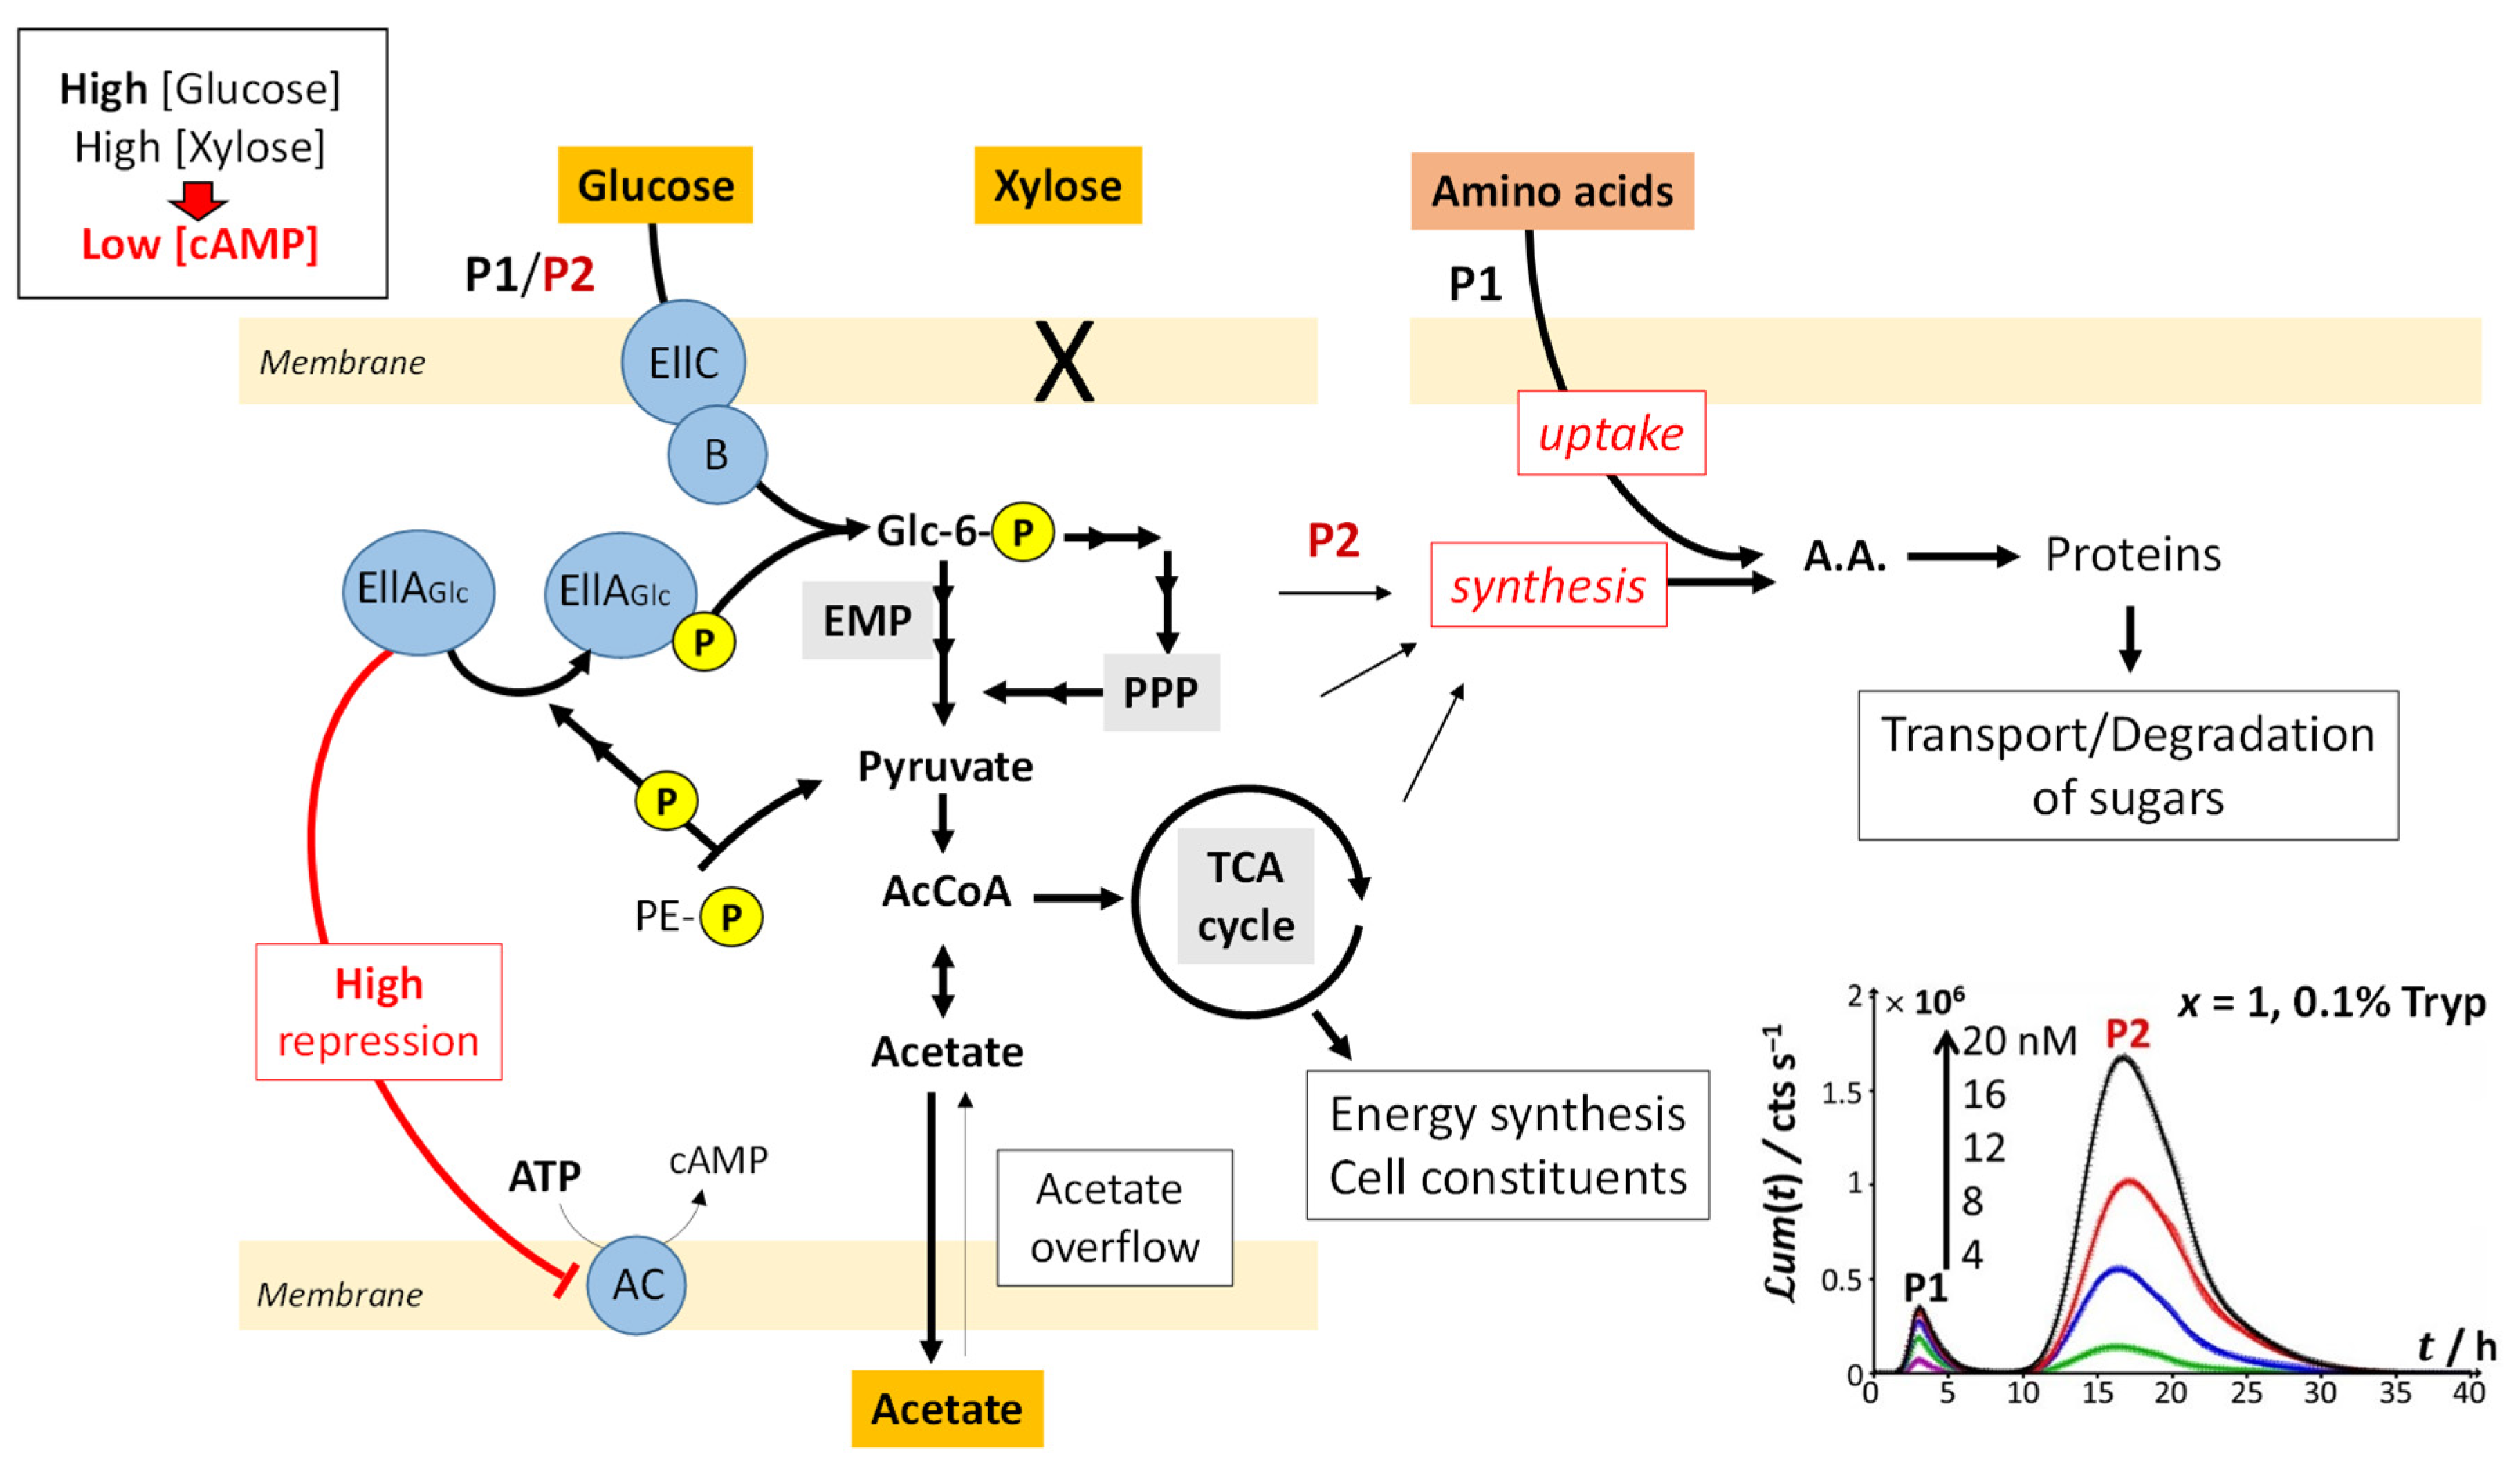
32]. In detail,
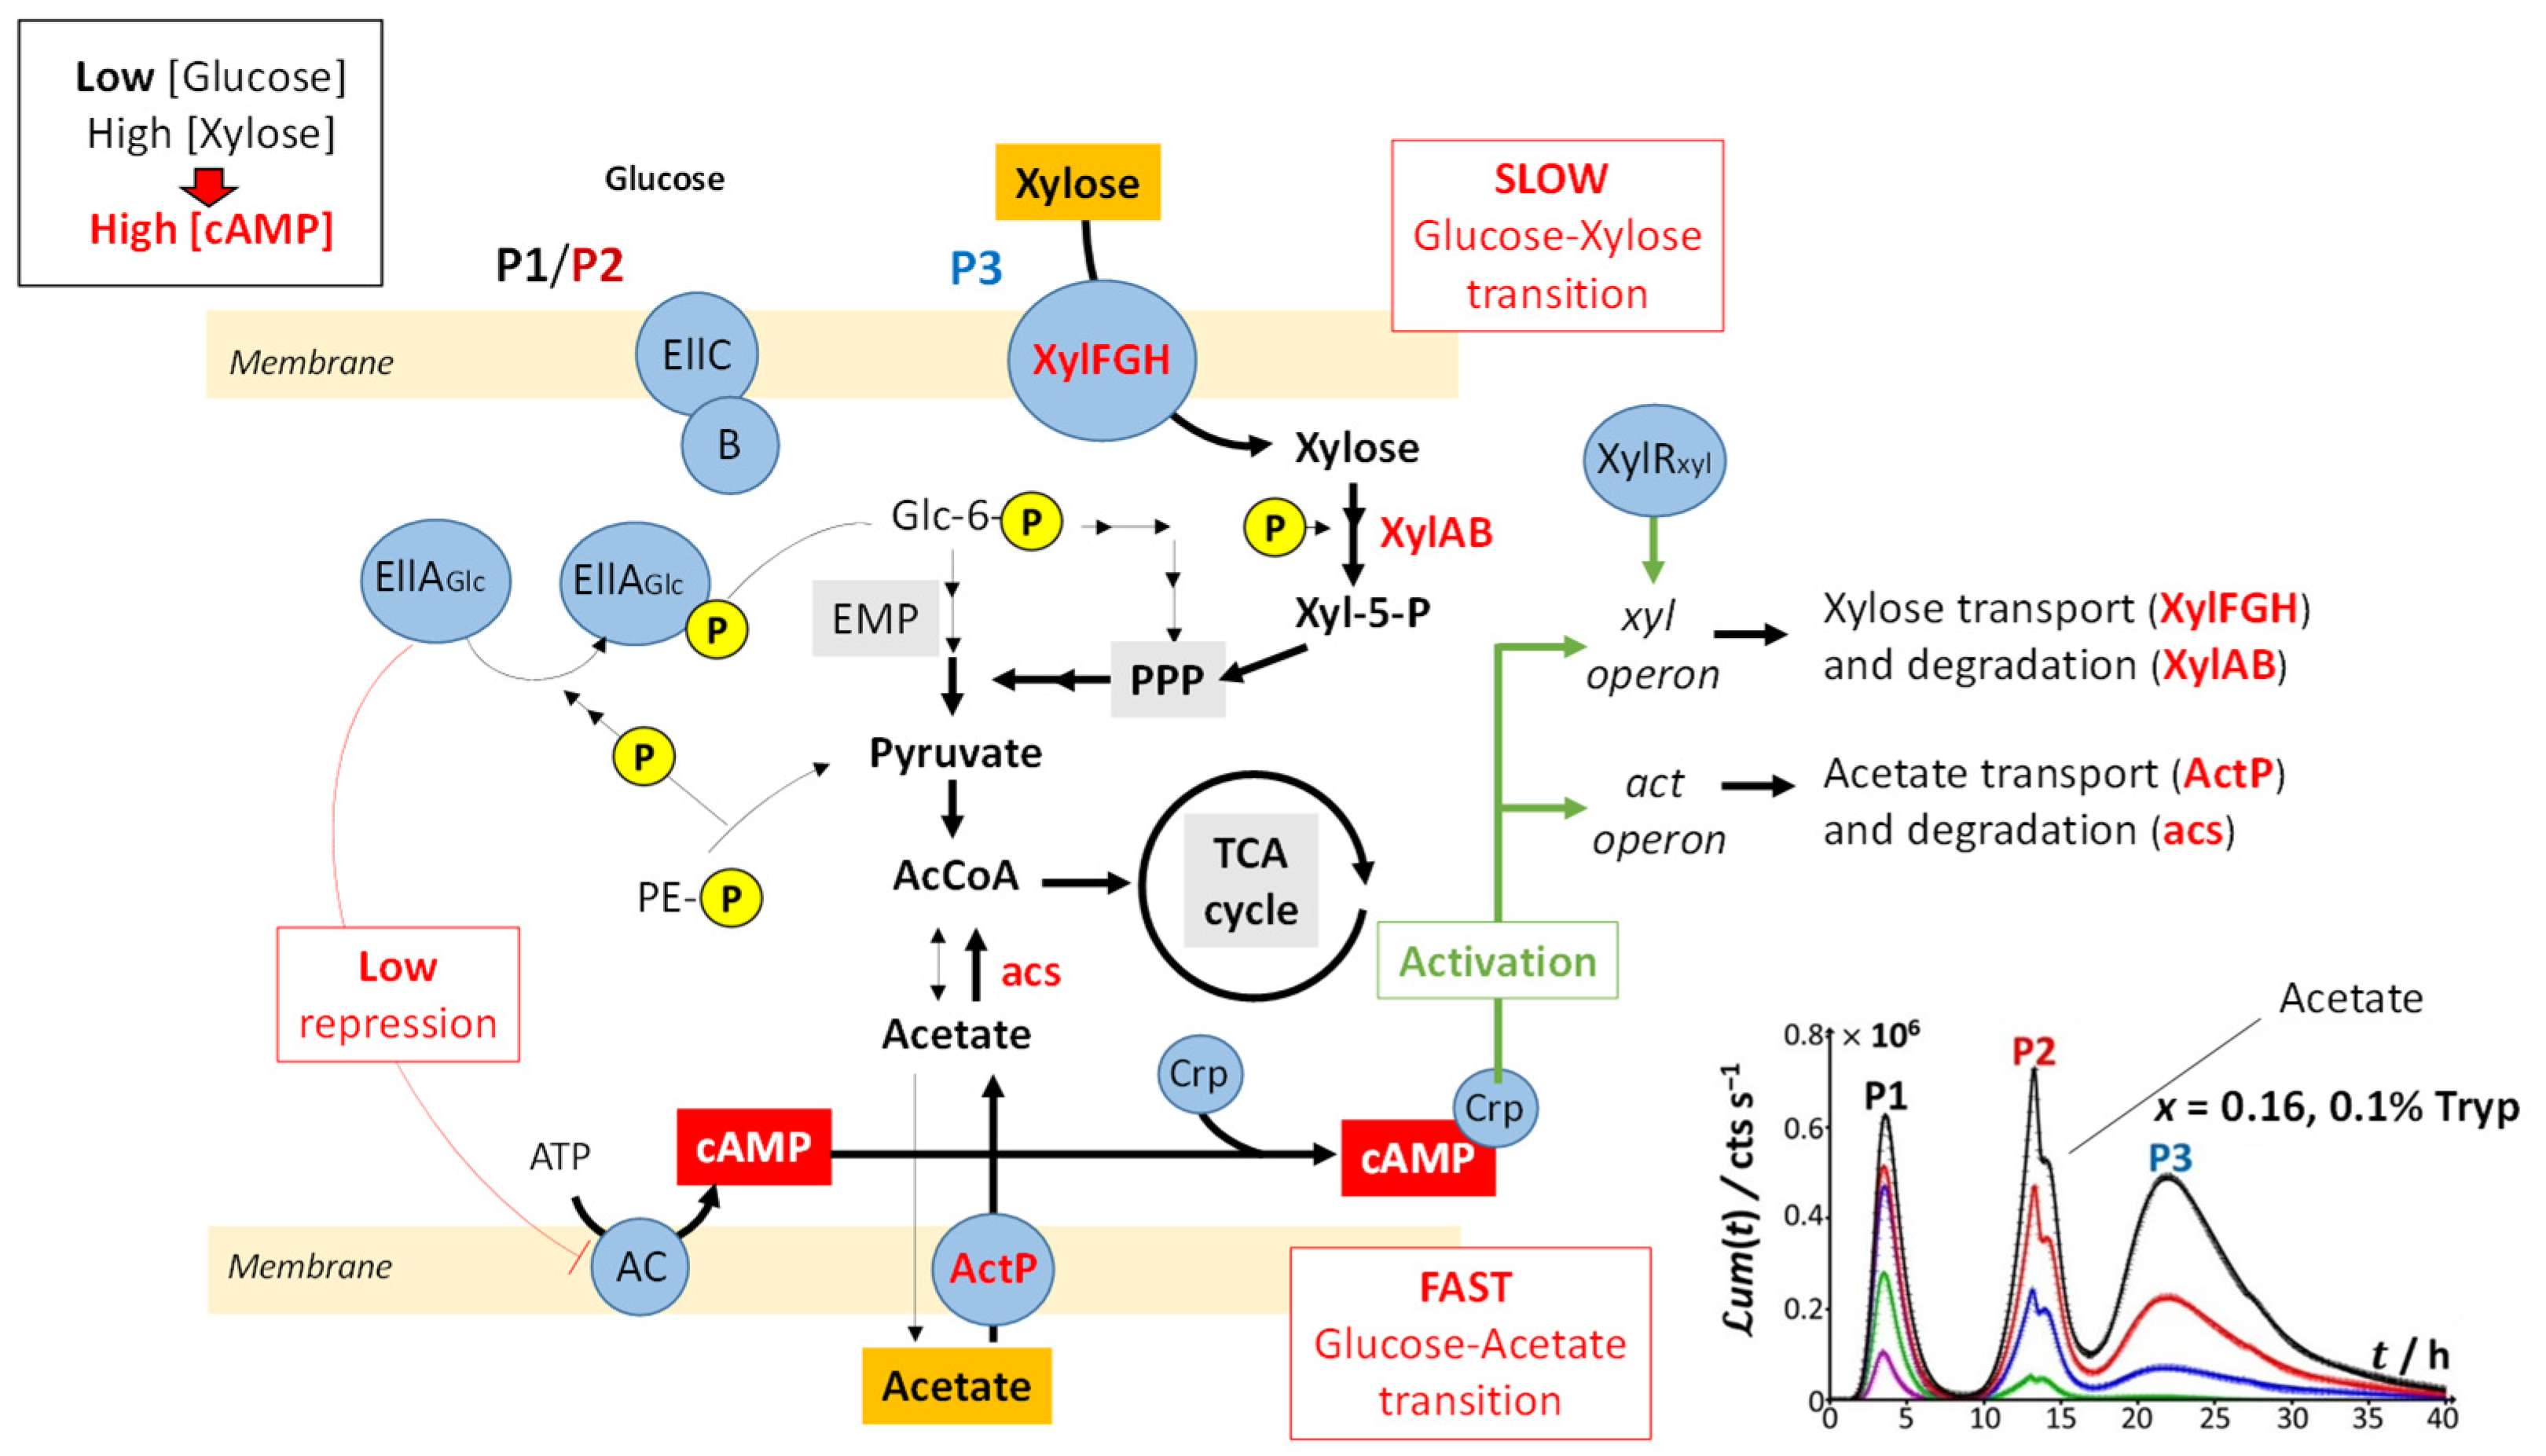
Figure 8 illustrates the processes that drive glucose transport and metabolism in E. coli together with the amino acid biosynthetic pathway. The uptake of glucose is mediated by joint action of EIIC-B proteinaceous complex (which ensures glucose transfer across the membrane) and phosphorylated EIIA proteins (that acquire their P group from phosphoenolpyruvate, denoted as PE-P in
Figure 8). EIIA-P proteins transfer a phosphate group to glucose that—after the Embden–Meyerhof–Parnas (EMP) pathway (glycolysis) or the pentose phosphate pathway (PPP)—enters the Krebs cycle (or TCA cycle), which produces the energy necessary for cells to emit light. Thus, the unphosphorylated EIIA proteins (having transferred their phosphate group) repress the adenylate cyclase (AC) and therefore inhibit the production of the cyclic adenosine monophosphate (cAMP), a mediator of the catabolite repression [
47]. In the E. coli glucose metabolic pathway, several precursors for amino acid biosynthesis are primarily generated and a large part of carbon incorporated as glucose is catabolized and excreted as acetate into the medium according to a phenomenon known as acetate overflow [
48].
Upon gradually replacing glucose by xylose (decreasing values of x), three main signal features are observed: truncation of peak P2, followed over time by the appearance of a shoulder on peak P2 and the detection of a third bioluminescence production mode (peak P3). Whereas P2 truncation originates from glucose depletion in solution (the more so as glucose concentration decreases; see
Figure 2B,C), the shoulder on peak P2 and the appearance of peak P3 are the results of catabolite repression. In detail,
Figure 9 illustrates the mechanisms underlying the catabolite glucose/acetate and glucose/xylose repressions at the origin of the shoulder on peak P2 and the appearance of peak P3, respectively. For cases where glucose deficiency is sensed by the cells and xylose is present in the medium, EIIA proteins then become mainly present in the phosphorylated form and AC repression is turned off. Thus, cAMP and Crp levels increase, which activates
act and
xyl operons via the formation of the cAMP/Crp complex. Consequently, both acetate (previously expelled by the cell) and xylose enter the cell via ActP and XylFGH proteins, respectively. Acetate reaches TCA cycle after degradation by an acetate synthetase (acs), whereas xylose successively enters the PPP, EMP pathway and TCA cycle after degradation via the enzymes XylA (xylose isomerase) and XylB (xylose kinase). This translates into the transition from truncated peak P2 (
Figure 2C) to truncated P2 peak featuring a shoulder and into the appearance of peak P3 (
Figure 2D–H) as a result of expelled acetate and xylose catabolism, respectively. It is stressed that the degradation of acetate occurs prior to that of xylose even though the expression of the
act operon is concomitant to that of
xyl operon (see the sequential appearance of the P2 shoulder and P3). This phenomenon is related to the short adaptation phase of glucose-acetate transition (i.e., 10–40 min) compared to that of the glucose-xylose (i.e., 1.8–5.8 h) in
E. coli [
49,
50]. When the glucose concentration becomes too low, the P2 peak disappears due to resulting insufficient amount of energy to sustain light production in emission mode 2. The truncation and shoulder observed previously on the P2 signal then appear on the P1 signal, which leads to a decrease in its magnitude (
Figure 2I–L). Under these conditions, the stringent response and catabolite repression occur simultaneously.
The increase in
ummax,1 with decreasing glucose concentration from
x = 1 to 0.2 and the presence of local maxima for
ummax,1 at
x = 0.16 and 0.06 (
Figure 5A) suggest that the hierarchical utilization of sugars (as possibly inferred from the sequential appearance of P2 shoulder and peak P3) does not proceed according to an ‘on/off’ process. Instead, cells likely use the different carbon sources at their disposal depending on demand and energy trade-offs (e.g., use of glucose/acetate or glucose/xylose for 0.06 <
x < 1 and use of glucose/xylose/acetate under conditions corresponding to local maxima in
ummax,1), as shown in
Figure 9. In agreement with our observations, several studies have evidenced that bacterial response to changes in energy supply should be viewed as a continuous process rather than a threshold phenomenon, especially in carbon-limited cultures [
51,
52]. When glucose concentration is sufficiently low, the cAMP level increases and the cAMP–Crp complex can then simultaneously induce the transcriptions of both acetate and xylose operons and the synthesis of the enzymes necessary for their respective catabolism. Most importantly, the rate of transcriptions of these two operons may differ (
Figure 9), which agrees with a continuous rather than an ‘on/of’ use of distinct carbon sources.
Another possibility, supported by the recent observations by Barthe et al. [
50], is the existence of subpopulations of cells during their adaptation to a transition from glucose to xylose carbon sources. The related phenotypic heterogeneity in the use of substrates during the diauxic batch culture of a monoclonal population is related to the intracellular availability of XylR that controls the length of catabolite repression phase and therefore mediates the emergence of subpopulations able to handle xylose [
50]. This mechanism leads to a transition phase where both glucose and xylose may be jointly exploited by distinct cell populations.
4.4. On the Connection between Bioluminescence Response of Metal-Sensing Cells, Cell Photoactivity and Nutrient Conditions
Using the theory detailed in
Section 3.1 and following the methodology for bioluminescence signal analysis described in
Section 3.2, the time-dependent bioluminescence response of metal-sensing cells measured in 0.1% tryptone (
Figure 2,
Figure 3 and
Figure 4) could be successfully reconstructed for all tested Cd concentrations and glucose-to-xylose concentration ratios.
Supplementary Table S1 specifies values of the root mean square error (RMSE) underlying the quality of the theoretical reconstructions of the measured bioluminescence signals for 0 <
t < 48 h at all values of
x and total Cd concentration adopted in this work. The fitting of the bioluminescence profiles to theory is reported in
Figure 2,
Figure 3 and
Figure 4 (solid lines therein), and the corresponding dependence of the dimensionless cell photoactivity on time,
(Equation (10)) as retrieved from fitting of the cell response to Equation (9), is given in
Figure 10 for each examined condition. For the sake of completeness, we mention that successful confrontations between theoretical formalism and bioluminescence signals monitored in 0.15% and 0.1% LB media were also achieved (solid lines in
Figures S2 and S3), and related time-dependent cell photoactivity patterns are shown in
Figures S7 and S8 for all tested values of
x and
. At a fixed Cd concentration and
x, the sequential appearance of
m (non-truncated and non-doubled) bioluminescence peaks (with
m = 1, 2 or 3 corresponding to peaks P1, P2 and/or P3 depending on
x) was reflected by a
that increases with time according to
m successive sigmoid-like functions. The latter functions feature non-zero plateau values marking the transition between two successive peaks, and the plateau
corresponds to the bioluminescence response at
where
. These properties are the direct consequence of the convolution product that defines
(Equation (1)), and they further agree with the
features revealed for bimodal stringent-controlled signals [
32]. This convolution product finds its physical origin in the finite timelapse (denoted as
in
Section 3), during which an excited luciferase–hydroxyflavin complex can emit photons before its rate of photon production goes to 0 [
14]. The resulting bioluminescence at time
t is then proportional to the time-dependent concentration of photon emitters between 0 and
t (emitters being operational during a timelapse
), and this concentration varies with time according to
. Of interest here is the way the truncation of peak P2 (see
Section 4.2) resulting from the glucose-mediated repression of acetate (
Section 4.3) is reflected in the
profile.
Figure 10C clearly shows that for a bimodal P1-truncated P2 signal (
Figure 2C), the truncation of peak P2 leads to a discontinuous decrease in
with time followed by a plateau value reached when bioluminescence approaches a value of 0. When there is repression of acetate by glucose and subsequent use of acetate by the cells (
Figure 2D), the corresponding truncation of peak P2 and the appearance of a shoulder in that peak give rise to a local minimum in
, as pictured in the inset of
Figure 10D. The depth of that minimum further increases with increasing
. Similar features apply for
corresponding to a truncated P1 signal (as observed at sufficiently low
x, see
Figure 2J,K and
Figure 4B,C) due to early catabolite repression (
Figure 10J,K). The effects of truncation of P2 and P1 peaks on
can be further appreciated in
Figure 10 by comparing the theoretical results derived from proper reconstruction of the bioluminescence signal (solid lines) with those generated for the scenario where peak truncation is absent. Concretely, the latter results are obtained by replacing the time component of
adopted to recover the observed truncation by a value of 0.
Now that the overall dependence of
on glucose concentration
x has been discussed in connection with time-dependent bioluminescence profiles and the modality/truncation thereof, we comment on the dependence of
on
at selected values of
t and
x. For
x ≥ 0.1, the first sigmoidal component of
corresponding to emission mode 1 (denoted as
in Equation (10)) is found to not depend on
. This finding directly follows Equations (9) and (10) for scenarios where cell photoactivity in emission mode 1 is not significantly affected by Cd ions in solution via, e.g., Cd-mediated hormetic or toxic effects. It further supports the applicability of the linear Henry regime for metal biouptake flux and that of the linear Hill regime for the production of reporter proteins, both being considered in the derivation of Equation (1) [
14]. The applicability of these regimes ensure indeed that bioluminescence at any time
t (which includes
ummax,i = 1,2,3) linearly grows with
unless
is affected by
following hormesis or toxicity effects. It is only for cases where truncation of peak P1 is observed that
is significantly impacted by
(
Figure 10J,K). For such poorly nutritive conditions marked by an early catabolite repression, the energy demands by the cells are not properly satisfied to sustain the reporter gene expression at a maximal rate, recalling that the latter increases with
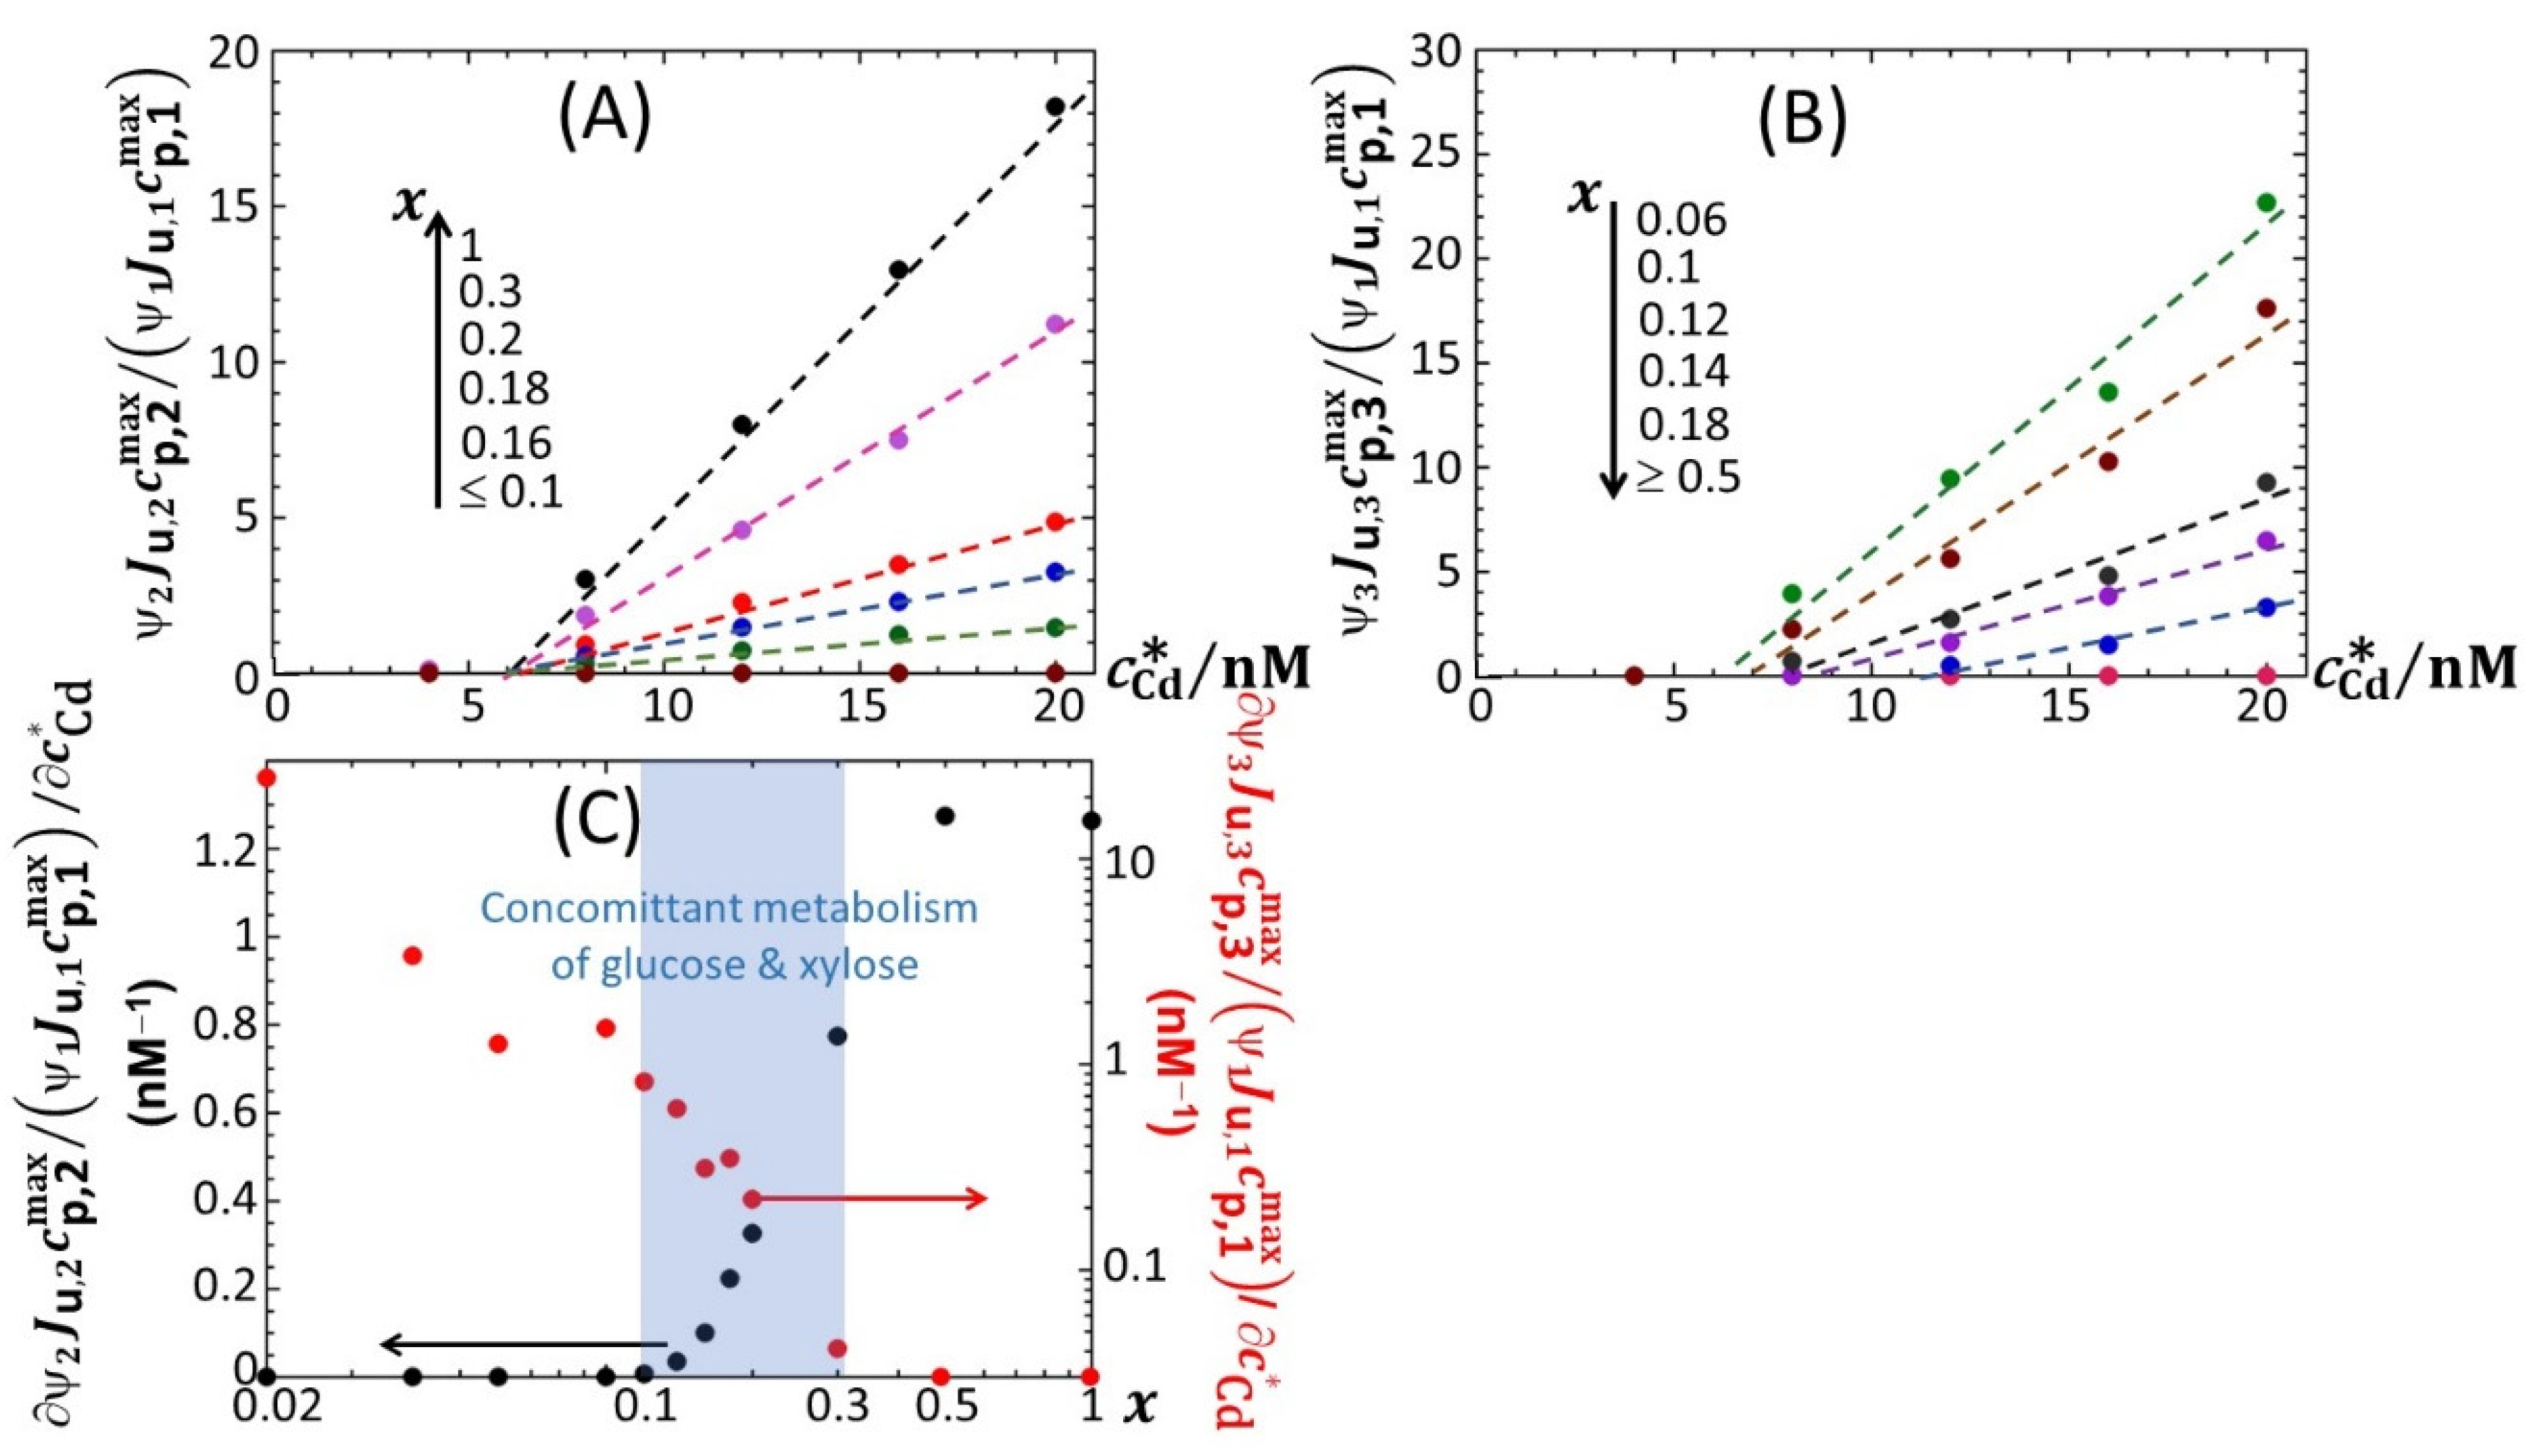
. Again, this result illustrates the subtle interplay between metal bioavailability in solution and the required bioavailability of nutrients for the cells to efficiently translate the supplied chemical information (i.e., the bioaccumulated amount of metal ions) into light. This point is further strengthened by examining the dependence of the dimensionless ratios
(Equation (10)) on
and
x (
Figure 11A,B). To simplify notations, we hereafter denote this ratio as
. Qualitatively, the changes in
with varying
x at fixed
are found to mirror those observed for
ummax,i = 1,2,3 in
Figure 6. Namely, the decrease (increase) in
(
, respectively) with decreasing
x accompanies the gradual vanishing and appearance of peaks P2 and P3, respectively, considering that the corresponding variations of bioluminescence in emission mode 1 (when it is significantly operative, i.e., for 0.06 <
x < 1) at fixed
are less pronounced than those in modes 2 and 3 (
Figure 6). We further found that
linearly increase at fixed value of
x with increasing
above the minimal Cd-concentration values required for light induction and identified in
Figure 6B,C. This result contrasts with the increase in log(
) with
measured in LB media for another
lux-CDABE biosensor constructed from the JW3596
E. coli strain [
32]. Assuming that the ratios
do not significantly depend on
(see definitions of
and
given in
Section 3), the observed linearity of
with
then necessarily stems from a linear increase in
with increasing
at fixed
x. Stated differently, the medium can sustain a maximum size of photoactive cell population (the medium carrying capacity) in emission modes 2–3 that more strongly increases with
than the carrying capacity in mode 1 does. For the sake of completeness, the
slopes are reported in
Figure 11C versus
x. As discussed in
Section 4.3, these data support the co-utilization of glucose and xylose by the biosensors in the range of 0.1 <
x < 0.3. Analogous conclusions can be drawn for 0.15% and 0.1% LB media (
Figures S9 and S10, respectively).
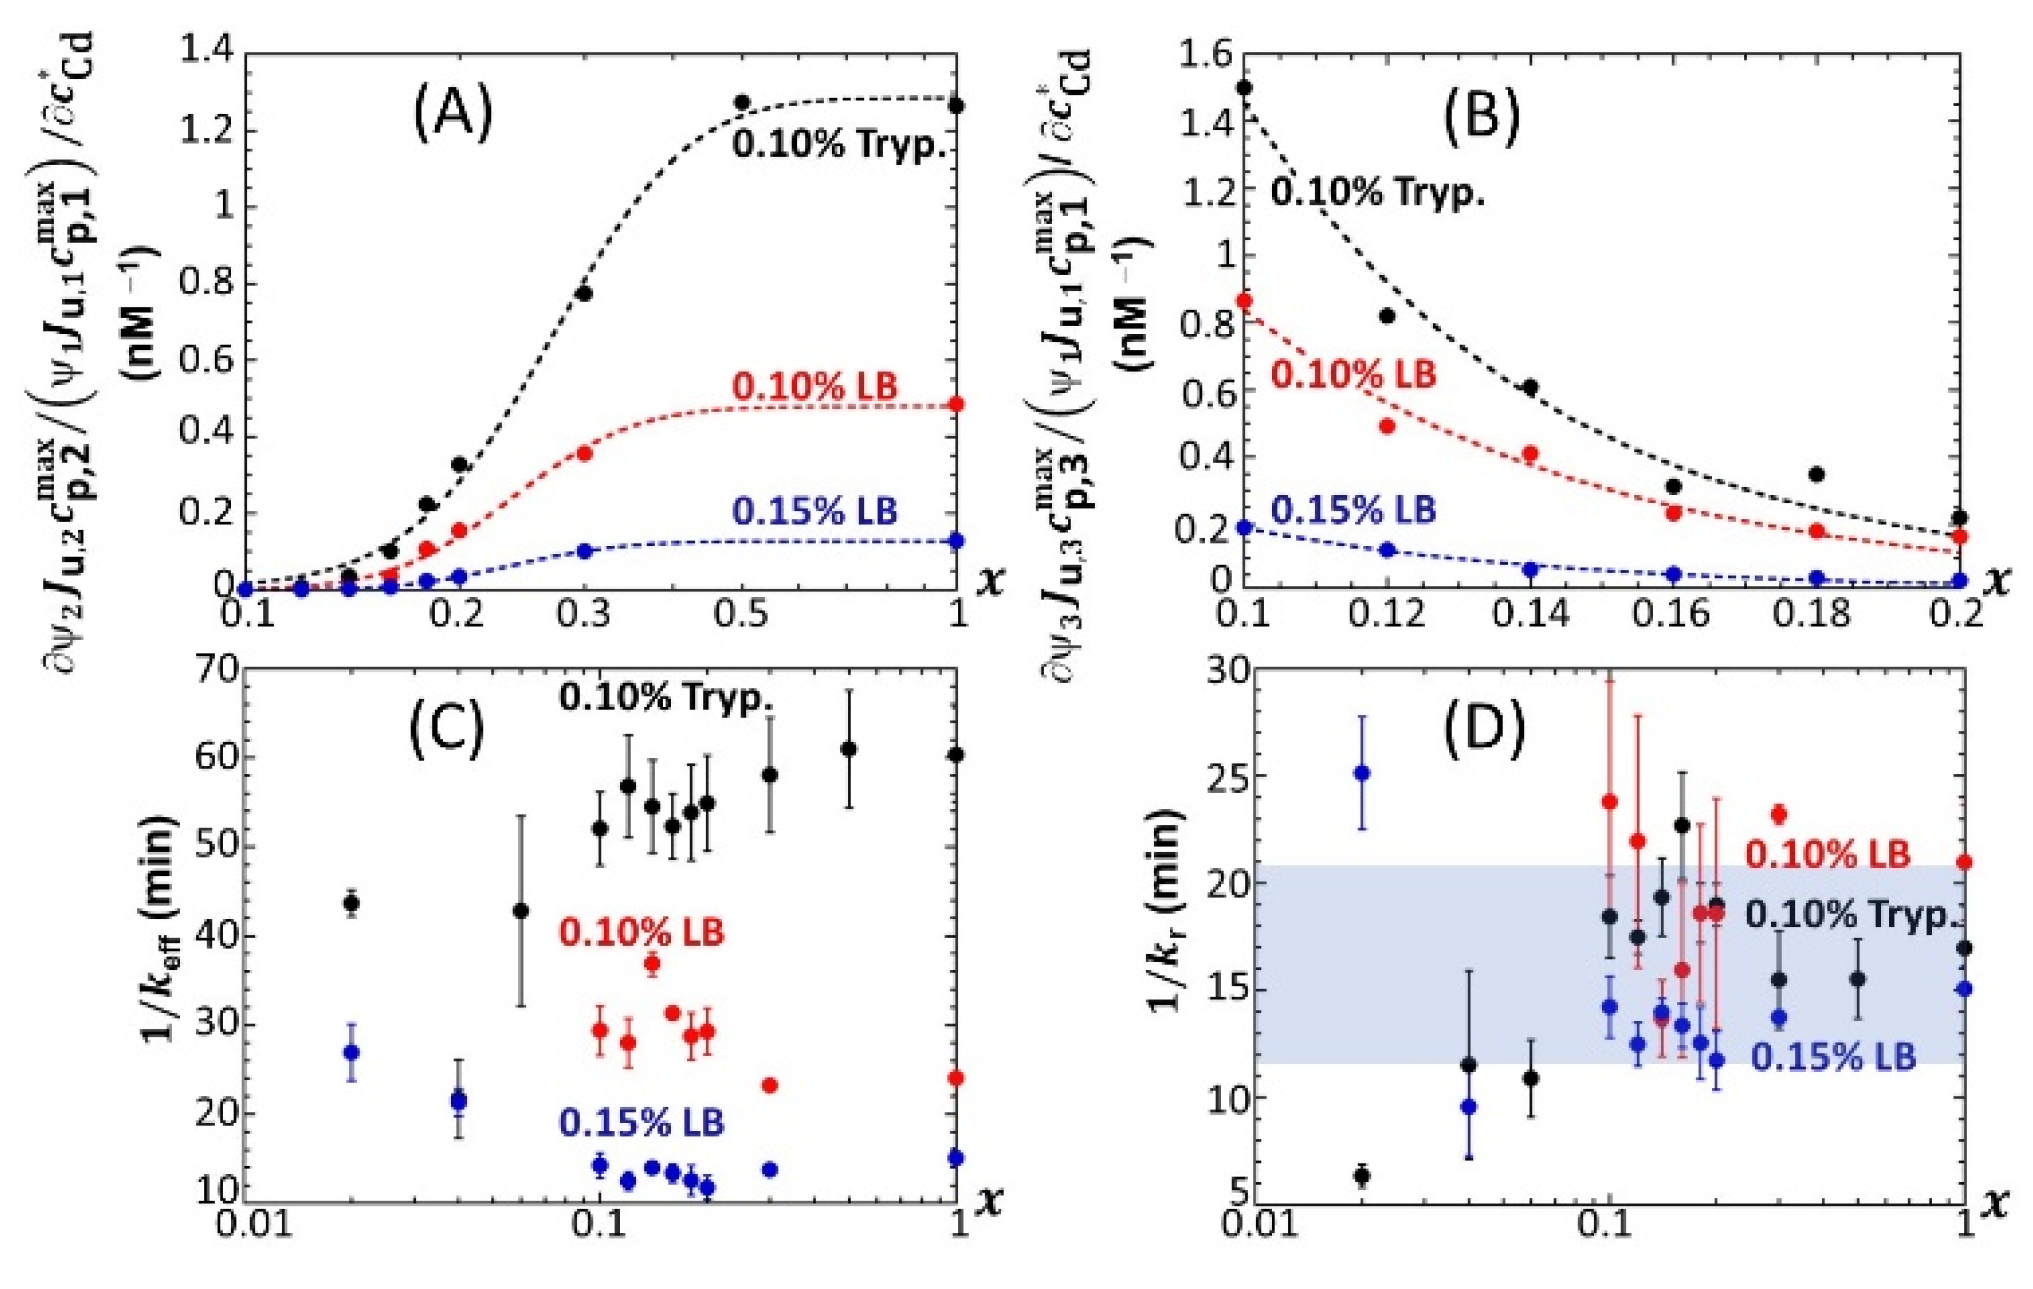
For the sake of comparison,
Figure 12A,B shows the slopes
as a function of
x for 0.1 ≤
x ≤ 1 in 0.1% tryptone, 0.1% LB and 0.15% media. The new feature revealed here is a decrease in the biosensor performance (at any
x) from mode 1 to mode 2 (
Figure 12A) and from mode 1 to mode 3 (
Figure 12B) upon replacing the 0.1% tryptone medium with a 0.1% LB or 0.15% LB medium. Among the three tested media, the 0.15% LB solution is the one with the highest nutritional quality for cells that operate in mode 1 [
46]. This is materialized by values of
that are highest in 0.15% LB under all
and
x conditions tested (
Figure 7A). As a result, unlike in 0.1% LB or 0.1% tryptone, a gain in biosensor performance when passing from mode 1 to mode 2 or to mode 3 becomes more difficult to achieve in the 0.15% LB medium that already features the best biosensor performance in mode 1. In turn, the increase in the carrying capacity ratios
with
(which determines
provided that
does not depend on
; see argument above) is more important in 0.1% tryptone than it is in 0.1% and 0.15% LB. Interestingly, the timescale
(Equation (7)) evaluated from the modeling of the bioluminescence signals (
Section 3.2) is found to significantly decrease at any
x when shifting from 0.1% tryptone to 0.15% LB (
Figure 12C), i.e., when significantly increasing the rate of light production per unit metal concentration in mode 1 (
Figure 7A) (it is in this mode that
is estimated; see
Section 3.2). This observation qualitatively conforms with the dependence
evidenced by Equation (7). Indeed, a higher rate of light production is associated with a higher rate of transcription of zntA that codes a P-type ATPase pump involved in Cd efflux. This in turn facilitates Cd excretion, which comes to effectively increase
and therefore decrease
. This feature, however, cannot explain on its own the significant decrease in
when moving from 0.1% tryptone to 0.1% LB (
Figure 12C) because the
achieved in these media is of the same order of magnitude (
Figure 7A). This latter decrease in
from the 0.1% tryptone to 0.1% LB media can be understood from Equation (7) and the dependence of
on Cd speciation features in solution via the quantity
p that ranges from unity for inert metal complexes to
for fully labile complexes. Indeed, Cd binding to charged molecules or particles is known to be essentially driven by (attractive) electrostatics, which favors the lability of complexes with faster interconversion between free and complexed metal forms [
53]. Given the respective compositions of LB and tryptone media, it is further expected that the stability constant
(which involves the concentration of ligand) would be higher in 0.1% LB than in 0.1% tryptone. In turn, the parameter
p would likely be larger in the former medium, which would lead to a lower
(see Equation (7)), in line with data in
Figure 12C. In practice, both impacts of medium composition on
and
p discussed above probably jointly determine
. This discussion, even qualitative, may suggest plausible leading-order mechanisms consistent with the
sequence displayed in
Figure 12C at fixed
x. Within the error bars,
does not significantly vary with decreasing
x from unity to 0.1, and values corresponding to
x < 0.1 should be considered with caution due to the truncation or even doubling of peak 1 (
Figure 4), which increases the required parametrization level of
at
x < 0.1. The error bars in
Figure 12C represent the dispersion in
values estimated over the 0–20 nM range in Cd concentration: no obvious dependence of
on
can be identified, and a similar conclusion holds for
, in line with results reported elsewhere [
32]. For 0.1 <
x < 1, the magnitude of
(~10–20 min) found for the three tested media is consistent with that given in our previous work conducted on another
lux-CDABE
E. coli biosensor in a medium lacking xylose [
32]. This magnitude is further in agreement with the half-life of luciferase proteins reported by Koga et al. from in vitro experiments [
54].


