Article

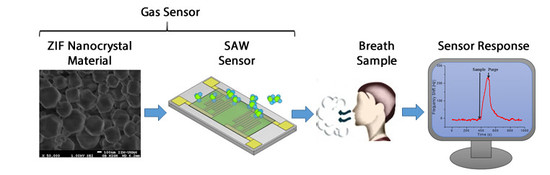
ZIF Nanocrystal-Based Surface Acoustic Wave (SAW) Electronic Nose to Detect Diabetes in Human Breath

by
Fabio A. Bahos
1,
Arianee Sainz-Vidal
1,
Celia Sánchez-Pérez
1,
José M. Saniger
1,
Isabel Gràcia
2,
María M. Saniger-Alba
3 and
Daniel Matatagui
1,4,*
1
Instituto de Ciencias Aplicadas y Tecnología (ICAT), Universidad Nacional Autónoma de México, Ciudad Universitaria, Ciudad de México 04510, Mexico
2
Instituto de Microelectrónica de Barcelona (IMB), CSIC, Campus UAB, 08193 Bellaterra, Spain
3
Instituto Nacional de la Nutrición Salvador Zubiran, Department of Neurophysiology, Tlalpan 14080, Mexico
4
SENSAVAN, Instituto de Tecnologías Físicas y de la Información (ITEFI), CSIC, Serrano 144, 28006 Madrid, Spain
*
Author to whom correspondence should be addressed.
Submission received: 7 November 2018 / Revised: 14 December 2018 / Accepted: 21 December 2018 / Published: 26 December 2018

Abstract

:
In the present work, a novel, portable and innovative eNose composed of a surface acoustic wave (SAW) sensor array based on zeolitic imidazolate frameworks, ZIF-8 and ZIF-67 nanocrystals (pure and combined with gold nanoparticles), as sensitive layers has been tested as a non-invasive system to detect different disease markers, such as acetone, ethanol and ammonia, related to the diagnosis and control of diabetes mellitus through exhaled breath. The sensors have been prepared by spin coating, achieving continuous sensitive layers at the surface of the SAW device. Low concentrations (5 ppm, 10 ppm and 25 ppm) of the marker analytes were measured, obtaining high sensitivities, good reproducibility, short time response and fast signal recovery.

Graphical Abstract

1. Introduction

One of the great challenges of contemporary science is the efficient diagnosis of diseases using non-invasive techniques. This strategy aims to provide a higher quality of life for humans and reduce the mortality rate. Additionally, early treatment of diseases and its complications has an important economic impact by helping to avoid or reduce treatment costs.
The last portion of deeply exhaled breath, representing alveolar air, can be considered the headspace gas of blood. Exhaled breath, recognized mainly through the sense of smell, is a method that has long been used for disease diagnosis. This method was abandoned due to the emergence of new accurate and effective techniques, despite being highly invasive. Over the last few decades, an important advance in gas analysis technologies has re-launched the idea of diagnosing diseases by analyzing exhaled breath. Various studies using these techniques, such as gas chromatography-mass spectrometry (GC-MS), proton transfer reaction-mass spectrometry (PTR-MS), selected ion flow tube-mass spectrometry (SIFT-MS), ion mobility and optical absorption [1,2,3,4,5], have shown a link between the chemical composition of exhaled breath and certain diseases. Chemical compounds present in exhaled breath that change due to diseases are known as markers. The conventional systems mentioned above are accurate but are also bulky, expensive, and require highly-qualified operators. This has created a demand for low-cost systems with high sensitivity and small dimensions based on solid-state chemical sensors, with different detection principles such as impedance [6], resistive [7,8], optical [9] and piezoelectric [10,11], surface acoustic wave (SAW), the last of which is one of the most sensitive piezoelectric devices [12]. The design of materials with advanced features led to a new generation of chemical sensors with enhanced sensitivity and response time [13,14,15]. Due to their unique porous structure zeolites have been used to detect gases [16]. However, in the last few years, organic zeolites such as zeolitic imidazolate frameworks (ZIFs) have attracted major attention as gas detectors [17,18,19,20,21], because they offer two primary advantages over conventional zeolites. First, they have larger pore sizes (about 1.16 nm for ZIF-8 and ZIF-67) and usually a smaller crystal size, resulting in higher surface area. Second, hydrophobic behavior is more pronounced in many ZIFs [22,23,24].
The World Health Organization (WHO) recognizes Diabetes mellitus, known as diabetes, as a serious and chronic disease that in 2012 caused 1.5 million deaths. A recent study reported in 2015 from 111 countries, estimated that there were 415 million people with diabetes aged 20–79 years, 5 million deaths attributable to diabetes, and the total global health expenditure due to diabetes was estimated to be 673 billion US dollars representing a substantial clinical and public health burden [8]. Moreover, the number of cases of diabetes among youths [25] and infancy [26] has increased in recent years but information on recent incidence trends is lacking and only statistical data for some countries are available.
The presence of ketones in exhaled breath is a warning sign of ketosis that is related to fat catabolism either due to carbohydrate deprivation or its lack of utilization in persons with diabetes. This condition is known as diabetic ketoacidosis and requires immediate treatment. One type of ketone, known as acetone, provides a non-invasive measure of ketosis through breath. The basal level of acetone in a healthy people can be around 2 ppm [5,27]. Adults following low-carbohydrate diets can have elevated levels of ketones up to 40 ppm [28,29,30], and poorly controlled diabetes can cause ketoacidosis which can increase acetone concentration up to 1250 ppm [27,31]. However, human exhaled air is a complex mixture of chemical compounds, making the detection and stage classification of a determinate disease through a unique marker difficult, so that different disease markers need to be considered as indicators. Another marker related to blood glucose concentration and present in exhaled breath is ethanol, which is not directly produced by any known mammalian cellular biochemical pathway, and may increase in exhaled gas mixtures because of alcoholic fermentation of an excessive overload of carbohydrate-rich food in conjunction with overgrowth of intestinal bacteria. Ethanol used in combination with exhaled acetone allowed the prediction of fluctuating plasma glucose concentrations in a multi-linear regression model [32,33,34,35], demonstrating that it can be helpful in determining diabetes through exhaled breath. However, diabetes is the cause of half of the cases of renal failure. Kidney failure is related with ammonia levels higher than 3 ppm in exhaled breath [5,30,36,37]. Consequently, a finger print using breath levels of acetone, ethanol and ammonia could be a non-invasive predictor of diabetes, its control, and a proxy for damage caused by the disease.
In the present work, a SAW eNose, based on ZIF nanocrystals as sensitive layers, has been tested to detect acetone, ethanol, and ammonia as a potential non-invasive system to diabetes diagnosis and control.

2. Materials and Methods

2.1. Materials

All the reagents were purchased from a commercial provider (Sigma-Aldrich, St. Louis, MO, USA) and used without further purification, including ZnCl2 (98%), CoCl2·6H2O (98%), and 2methylimidazole (99%), hydrogen tetrachloroaurate (III) hydrate (HAuCl4, 99.9%) and trisodium citrate dihydrate (HOC (COONa) (CH2COONa)2 · 2H2O).

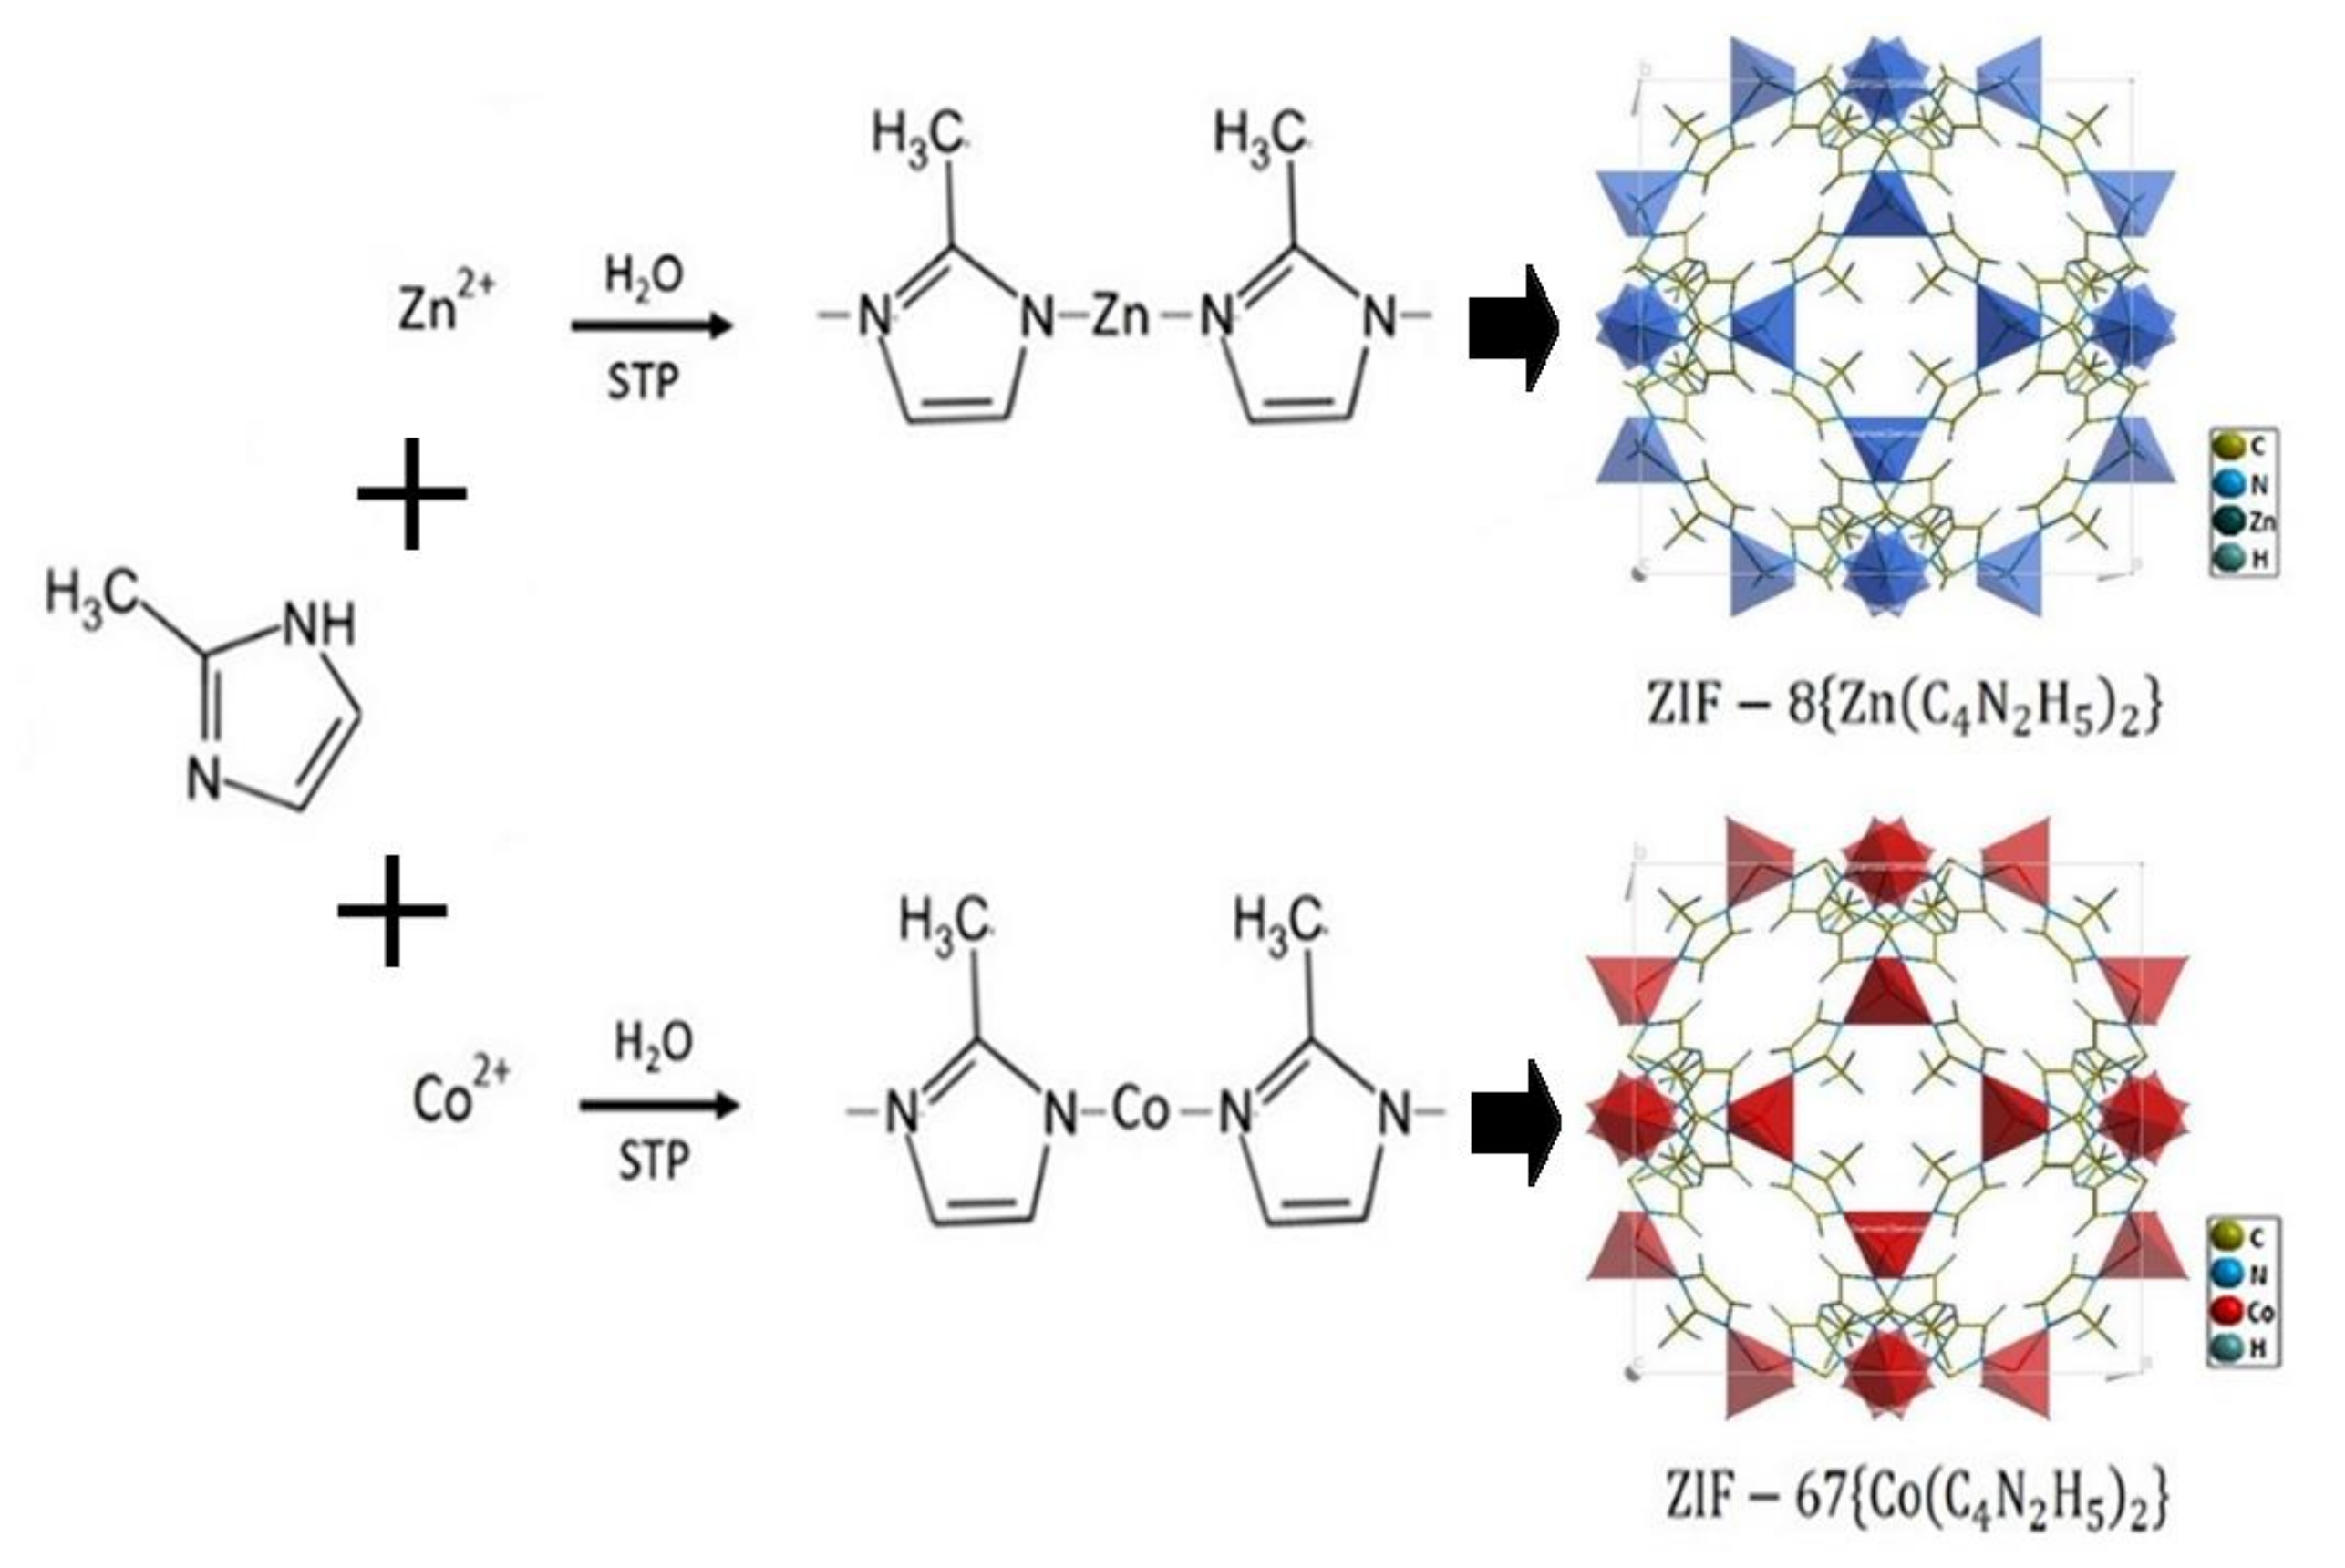
2.2. Synthesis of ZIF-8 and ZIF-67

ZIF-8 and ZIF-67 samples were synthesized using the aqueous method reported elsewhere [38]. For ZIF-8 synthesis, a solution of 1.17 g of zinc chloride dissolved in 8 mL deionized (DI) water was added into a solution of 2-methylimidazole (2MeIM) (22.70 g) dissolved in 80 mL DI water, to yield a molar ratio of 2-methylimidazole to zinc of 70:1. The mixture was stirred at room temperature for 5 min. The product was collected by centrifugation (24,000 rpm, 10 min), washed in DI water three times and dried at 65 °C for 24 h in an oven. ZIF-67 was synthesized identically to the ZIF-8 material as described above, replacing zinc chloride with the equivalent quantity of cobalt chloride hexahydrate. A scheme of the synthesis paths is described in Figure 1 [39,40].

2.3. Synthesis of Gold Nanoparticles

Gold nanoparticles (AuNP) were prepared following procedure described in reference [41]. An aqueous solution of HAuCl4 (0.001 M, 40 mL) was placed into a 250 mL round bottom flask. The solution was heated to 90 °C followed by the addition of sodium citrate aqueous solution (38.8 mM, 2 mL) into it while stirring for 15 min. After cooling down to room temperature, the solution was centrifuged three times with ethanol and three times with DI water, finally the precipitate was re-dispersed in DI water, resulting a water solution with AuNP of ~5 nm.

2.4. Zeolitic Imidazolate Framework Nanocrystal Characterization

The synthetized samples were kept at room conditions and characterized using: Fourier transform-infrared spectroscopy (FTIR), X-ray diffraction (XRD), scanning electron microscope (SEM) and energy-dispersive X-ray (EDS). FTIR spectra were recorded using a Thermo Nicolet NEXUS 670 FTIR spectrometer. The sample was diluted into KBr pellets in a 1:100 weight ratio (sample to KBr). The scanning range was 400–4000 cm−1 and the resolution was 4 cm−1. XRD powder patterns were recorded with CuKα radiation in a D8 advance diffractometer from Bruker. The morphological features were examined by SEM. The SEM and EDS analysis were performed on a JEOL JMS-7600F.

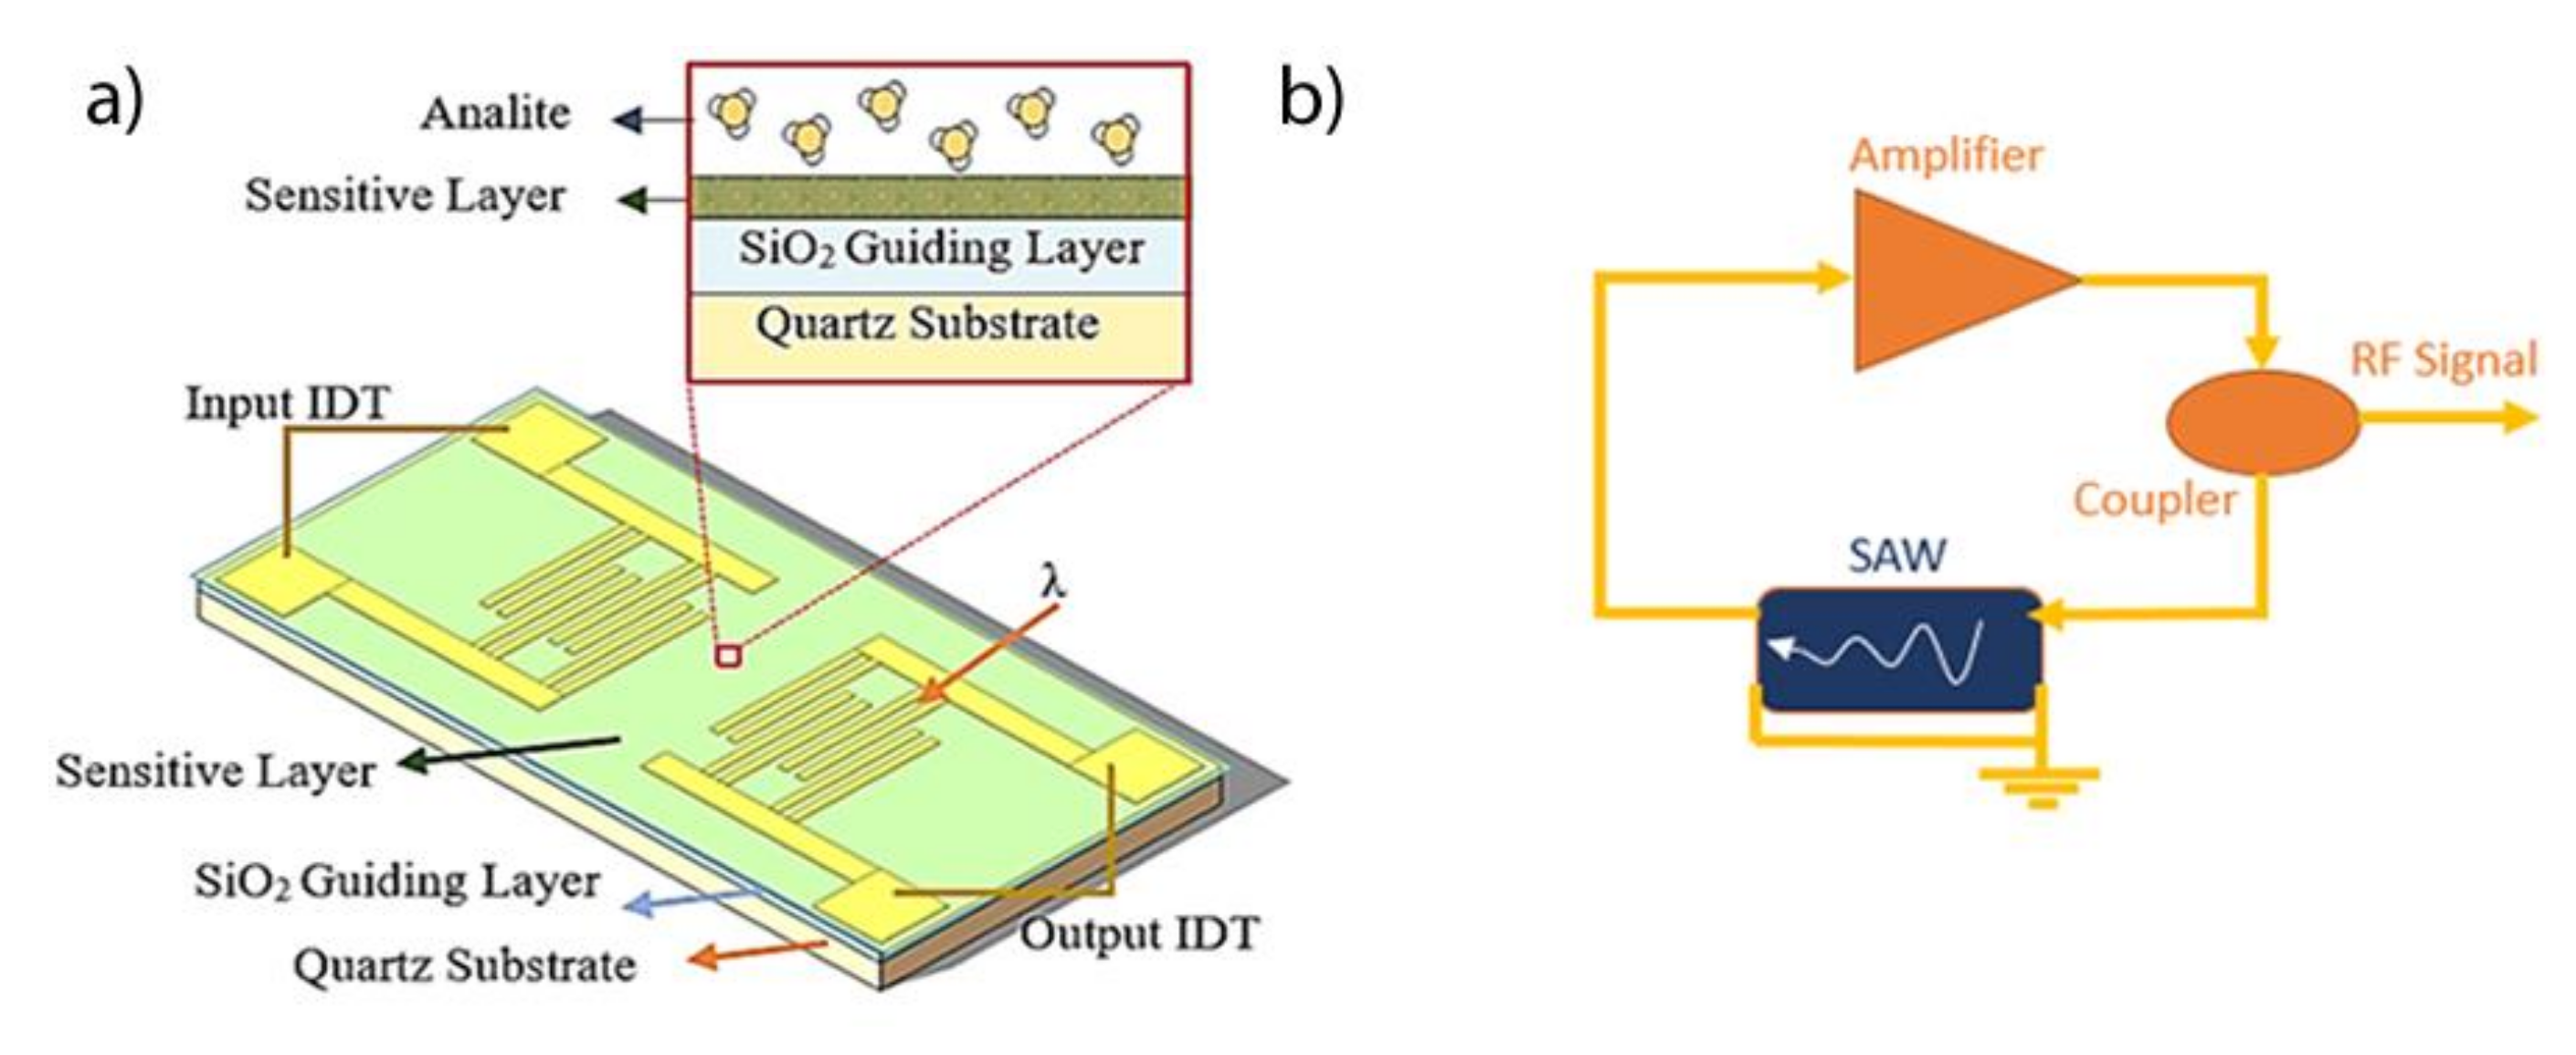
2.5. Love-Wave Sensor

Love-waves (LW) are a specific type of SAW sensors based on shear horizontal (SH) waves guided by a layer with a lower propagation velocity than that of the piezoelectric substrate. The energy of the wave is confined in the guiding layer and any perturbation in it affects the acoustic wave velocity. The LW sensors used in the present work were designed with a delay line (DL) configuration. This device is based on a micro-electromechanical system composed of a piezoelectric material (ST-Quartz) with facing input/output aluminum interdigital transducers (IDT) on its surface, working at a 28 μm wavelength (λ), with a separation between IDTs of 2100 μm (Figure 2a). The SH waves were guided by a 3.1 μm thick layer of SiO2, with the sensitive layer at its surface. An oscillator circuit consisting of a DL, with an amplification stage and a coupler were used for measuring the changes in the velocity of the waves by means of the resonant frequency (Figure 2b).

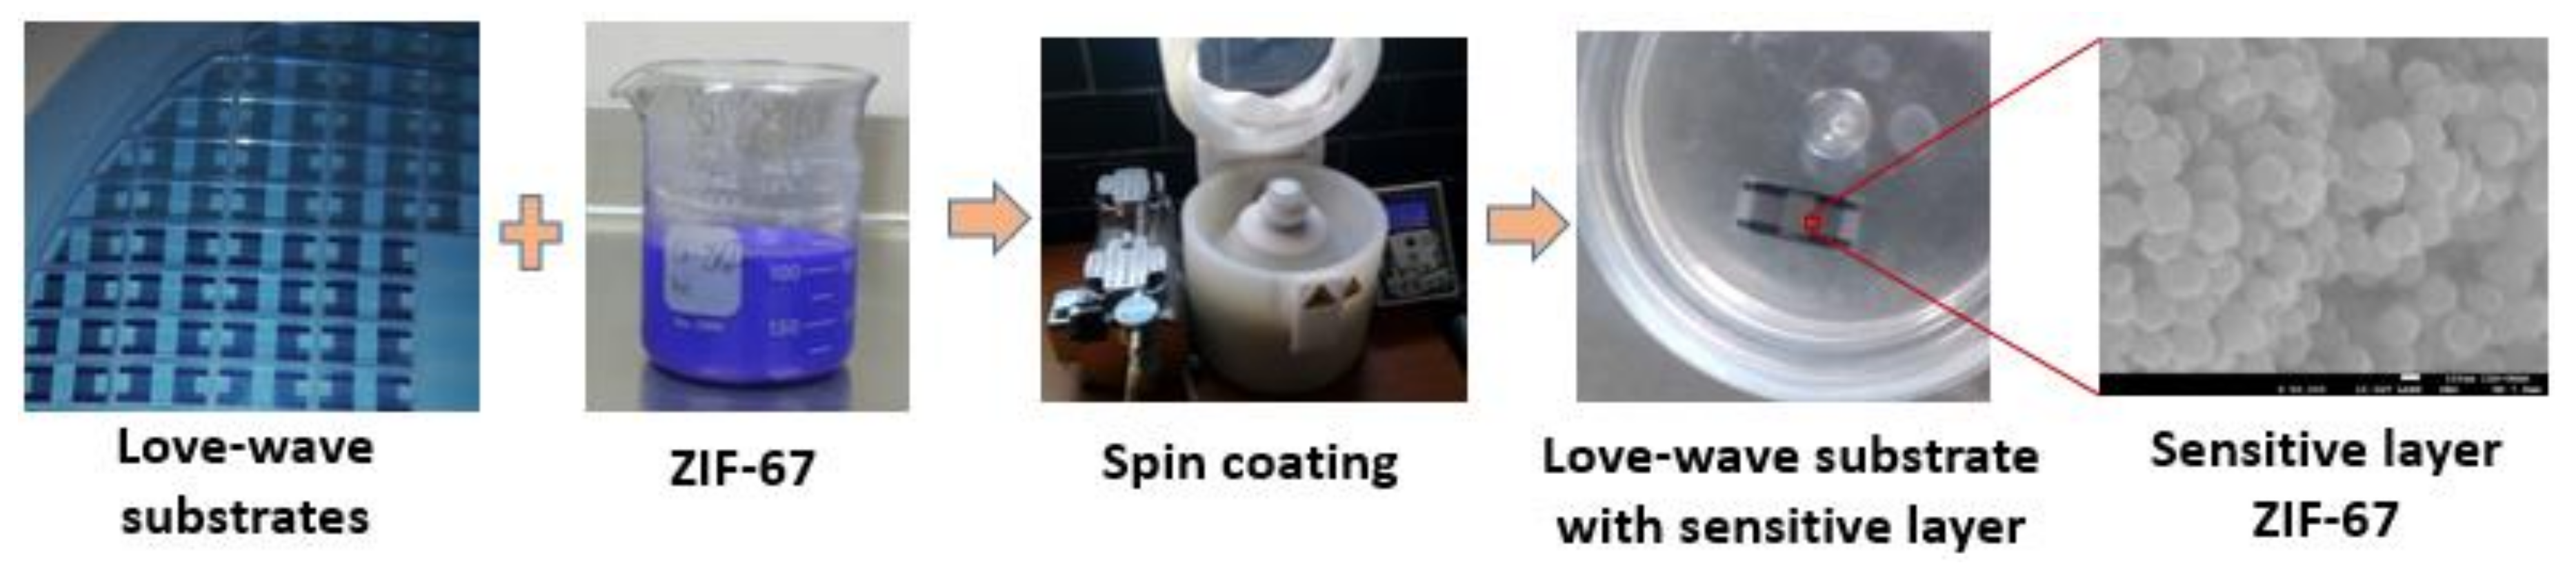
2.6. ZIF as Sensitive Layers

The eNose was based on a SAW sensor array with different sensitive layers to achieve a specific fingerprint for analytes of interest. The sensitive material samples were obtained by mixing each main solution with a volumetric proportion of 75% (solution-1) and 25% (solution-2) (Table 1). Spin coating was used to deposit a thin layer of the sensitive material. The process consisted of putting 25 µL of sample directly on the SiO2 guiding layer, completely covering the IDTs surface and the area between them, and then spinning the assemblage at a speed of 3000 rpm for one minute, ensuring that the sensing area remained constant from sensor to sensor (Figure 3). A suitable thickness for each sensor is obtained after depositing four times in a multilayer configuration achieving an optimal sensitivity for sensors. After ZIFs deposition process a thermal treatment at 180 °C with 50 mL/min nitrogen flow in a tubular oven was applied during four hours for extracting the excess of the 2MeIM organic ligand in the sensitive layer.

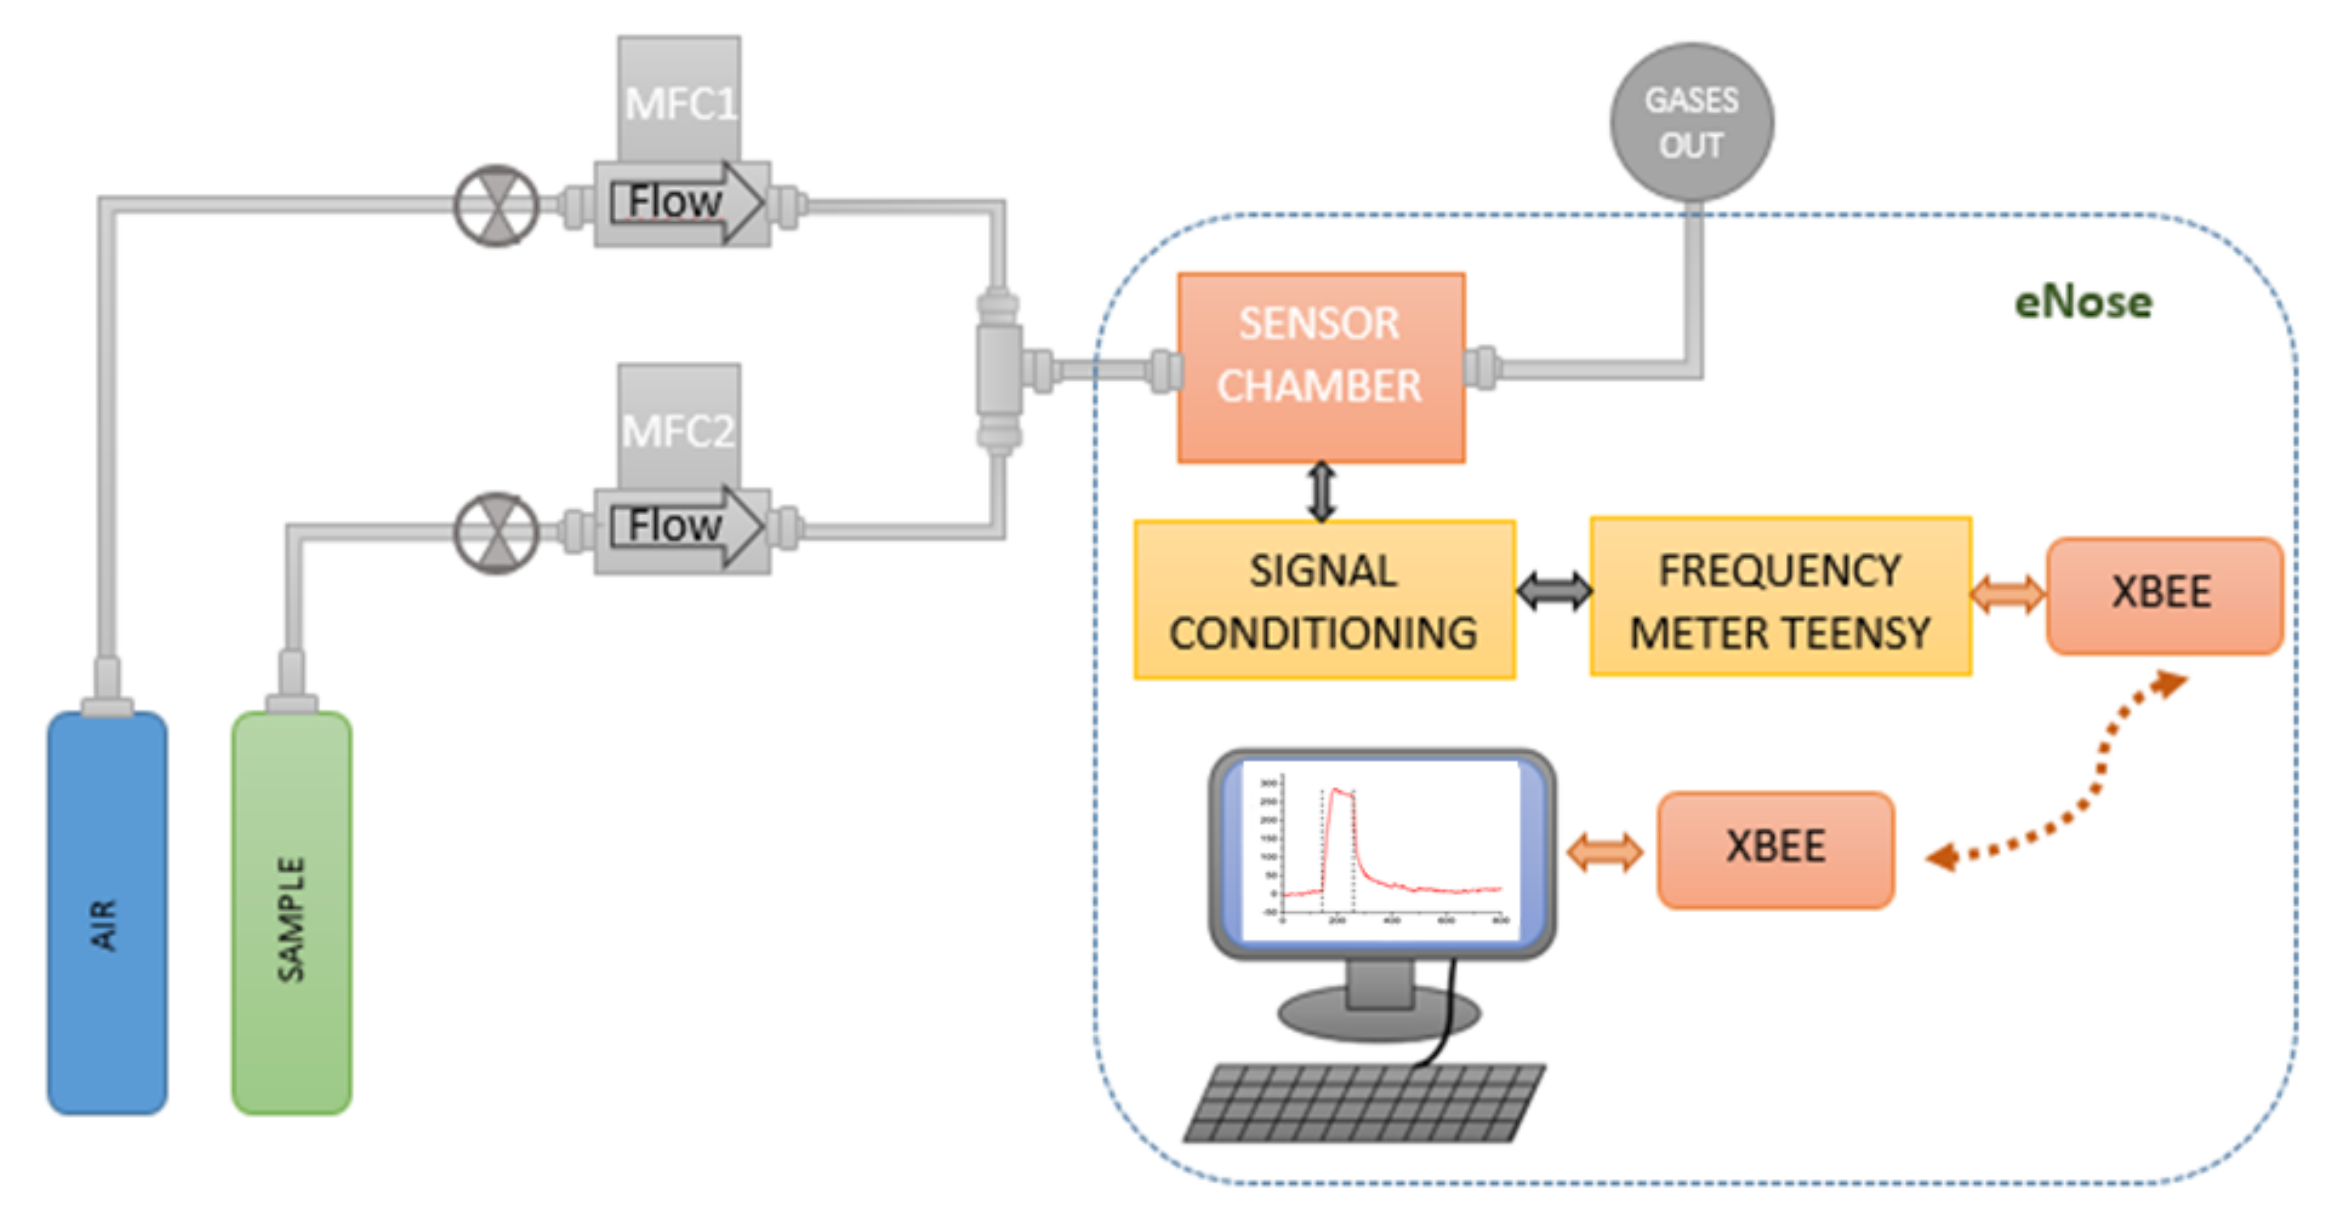
2.7. Experimental Setup

The sensor array was tested for acetone, ethanol, and ammonia gas analytes diluted in synthetic dry air to obtain concentrations of: 5 ppm, 10 ppm, and 25 ppm. The gas sample generator (Figure 4) consists of two mass flow controllers which were used to obtaining concentrations at a constant flow of 100 ml/min. Each array sensor works in an oscillator circuit, which includes an amplifier and a directional coupler. Therefore, when the sensor is perturbed, the oscillating frequency is shifted. A heterodyne configuration was used for signal acquisition, mixing the signal of the oscillator coupled to a reference sensor of the array (local oscillator) with the signal from an oscillator coupled to a selected ZIF nanocrystal-based SAW sensor (input signal). The frequencies obtained from the mixer were lower than 1 MHz and were acquired by a microcontroller programed as a frequency counter. For the detection, a sensing system composed of a measuring instrument (eNose) manufactured to be operated with a SAW sensor array was used. Finally, the sensor array response was acquired by a micro-frequency counter, and the information was transmitted wirelessly by a radio module to a PC with a custom application developed to display and store experimental the sensor data in real time.

3. Results and Discussion

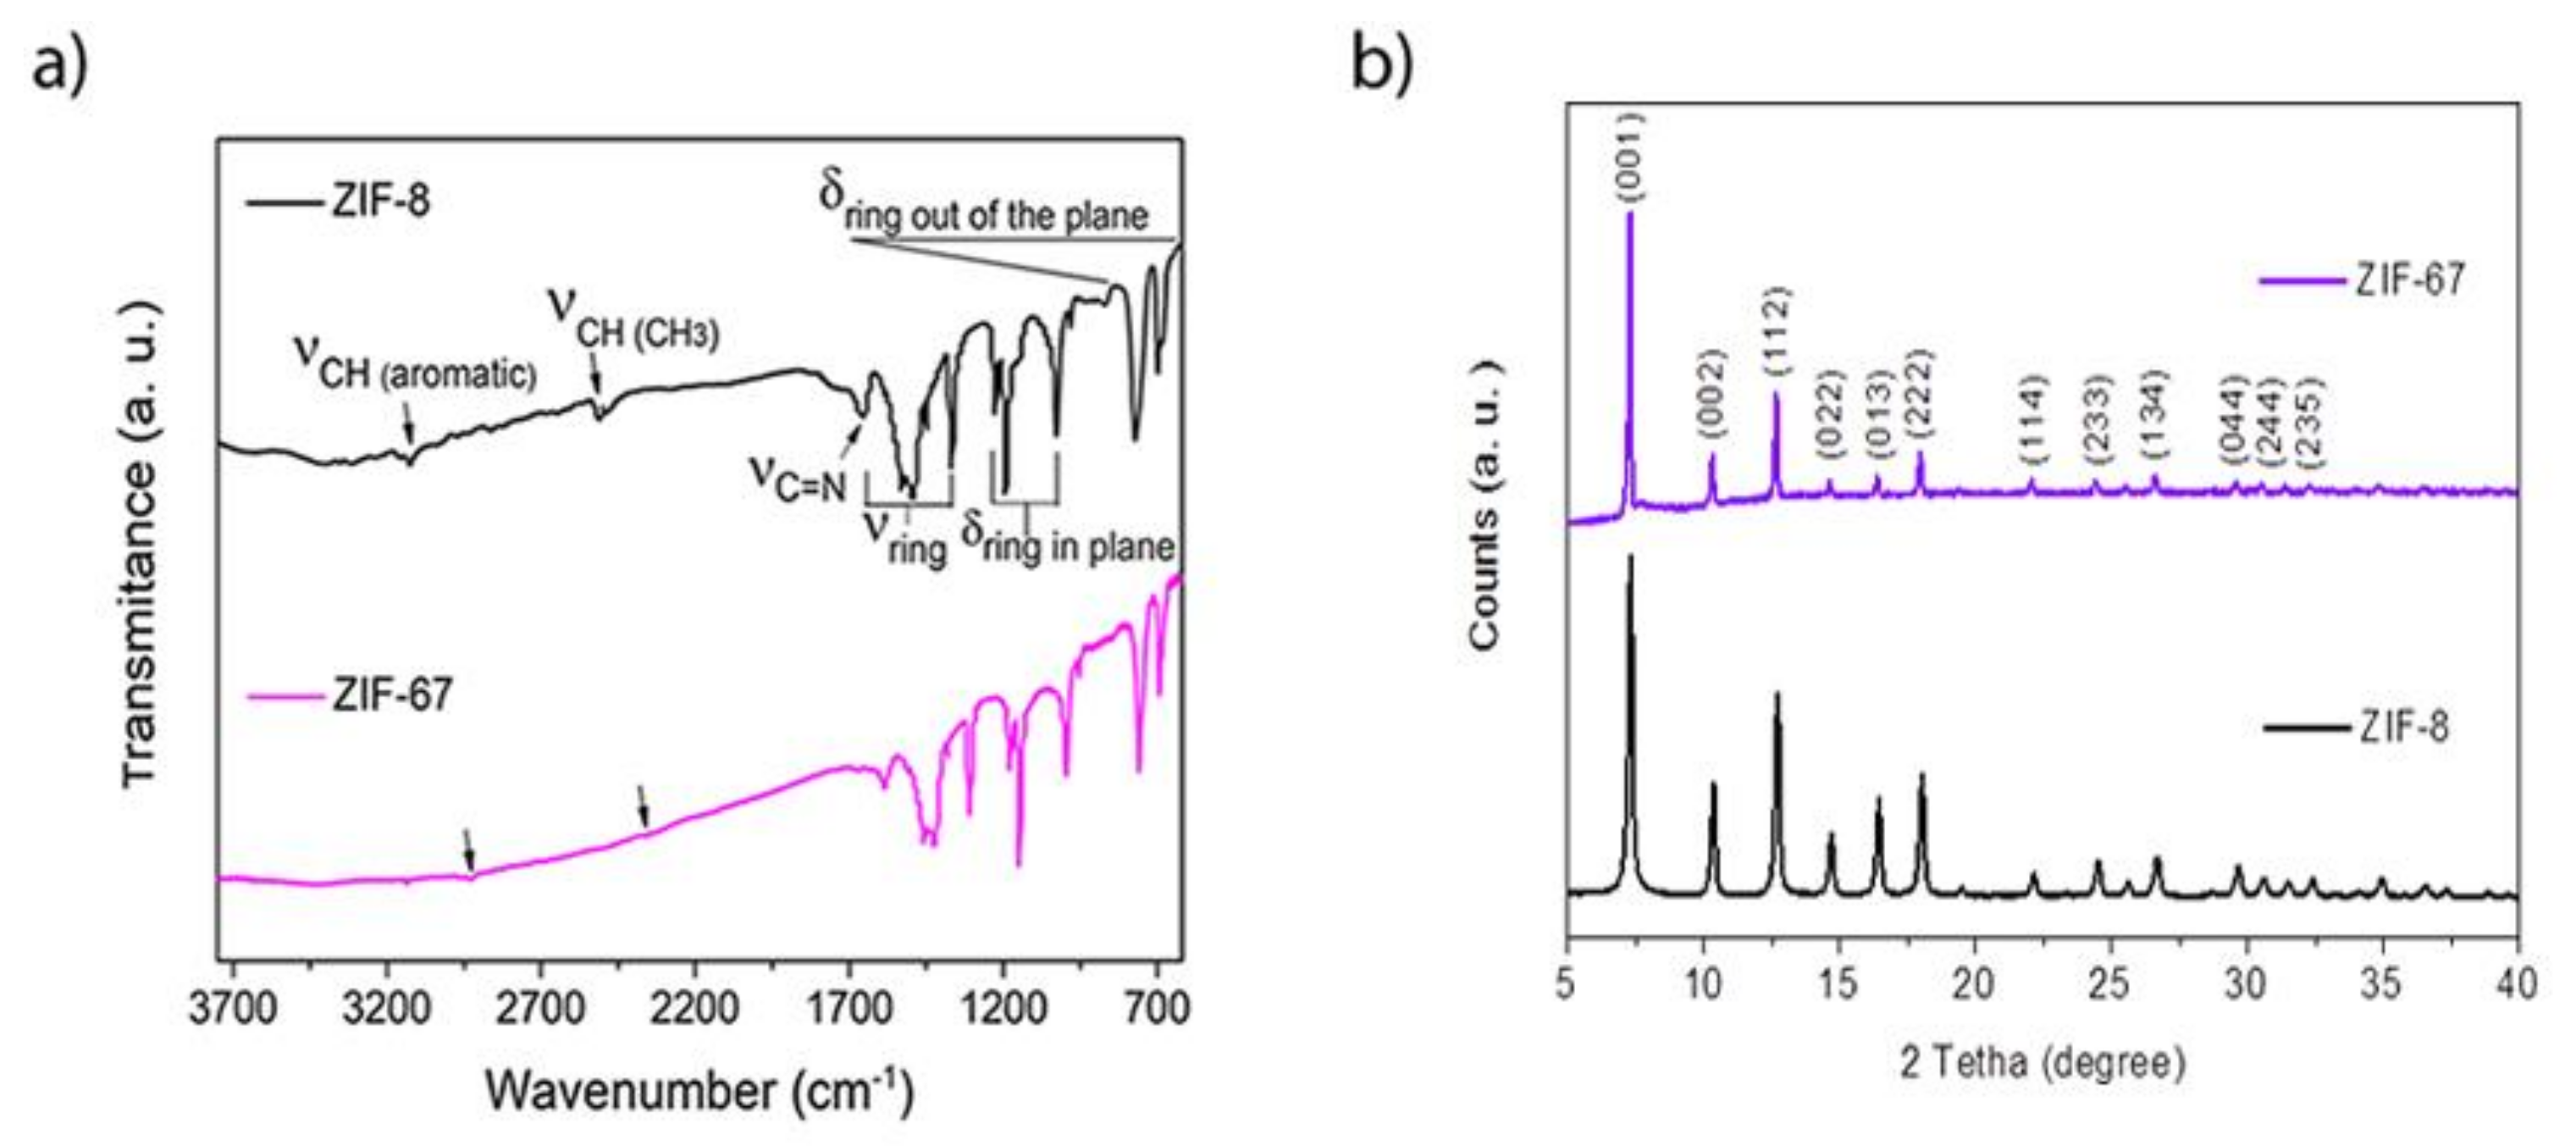
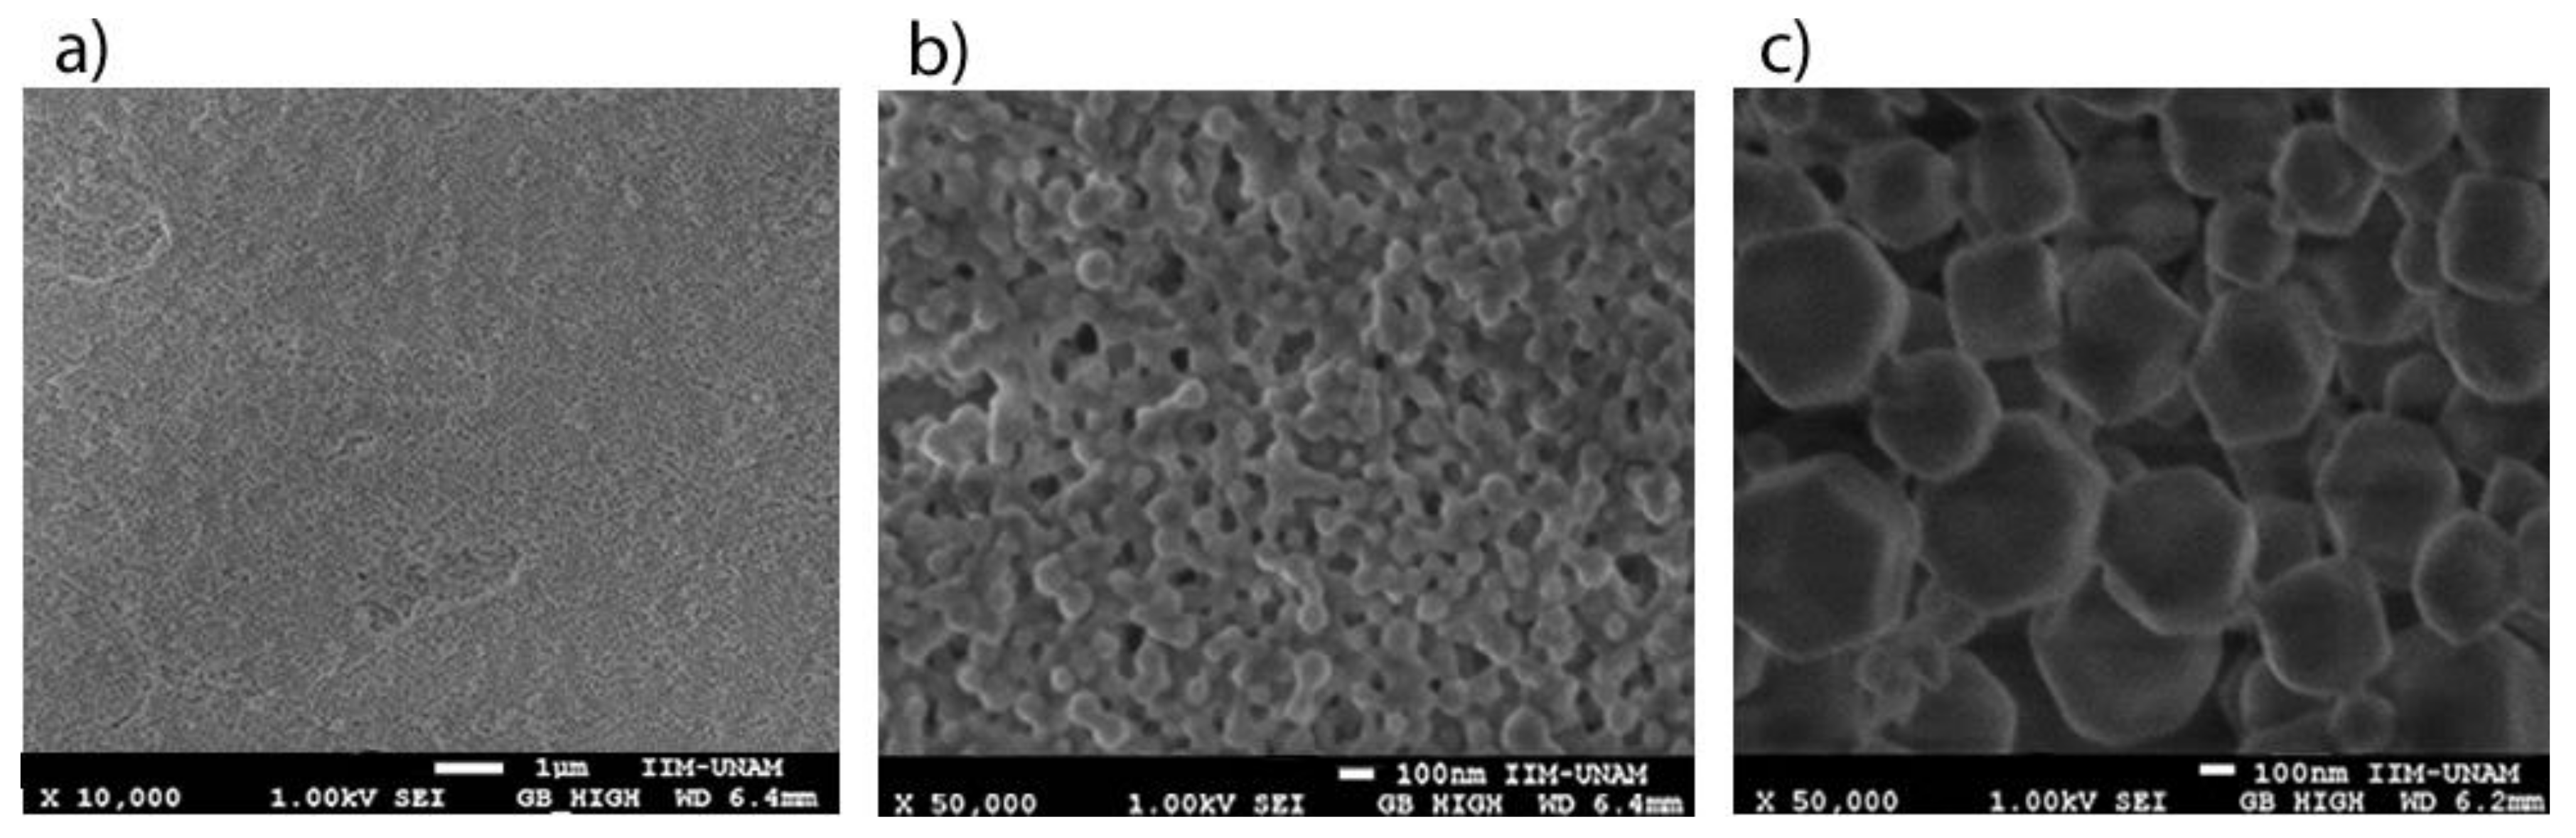
3.1. Structural and Morphological Characterization of ZIFs

The FTIR spectra of KBr diluted ZIF-8 and ZIF-67 samples show the characteristic adsorption bands of 2meImidazole ring vibrations, reported for these structures in previous works [42] (Figure 5a). The XRD patterns of both ZIFs samples show evidence for the formation of a largely crystalline structure with long-range order (Figure 5b). The position and relative intensity of the diffraction maxima are in agreement with the literature for ZIF-8 and ZIF-67 frameworks [38,39,42].
SEM images from the ZIFs layers show that the nanocrystals were configured as a continuous layer with very small particles (Figure 6a). This fact is important because nanostructured layers have two main advantages: first, the surface area of interaction with the gaseous environment is higher; and second, the SAW propagates in a continuous layer with very low scattering losses because to its wavelength (28 μm) is much larger than the diameter of the nanocrystals. The micrographs also showed hexagonal shaped nanocrystals of 50 nm approximately for the ZIF-8 samples (Figure 6b) and 200 nm approximately for the ZIF-67 samples (Figure 6c).

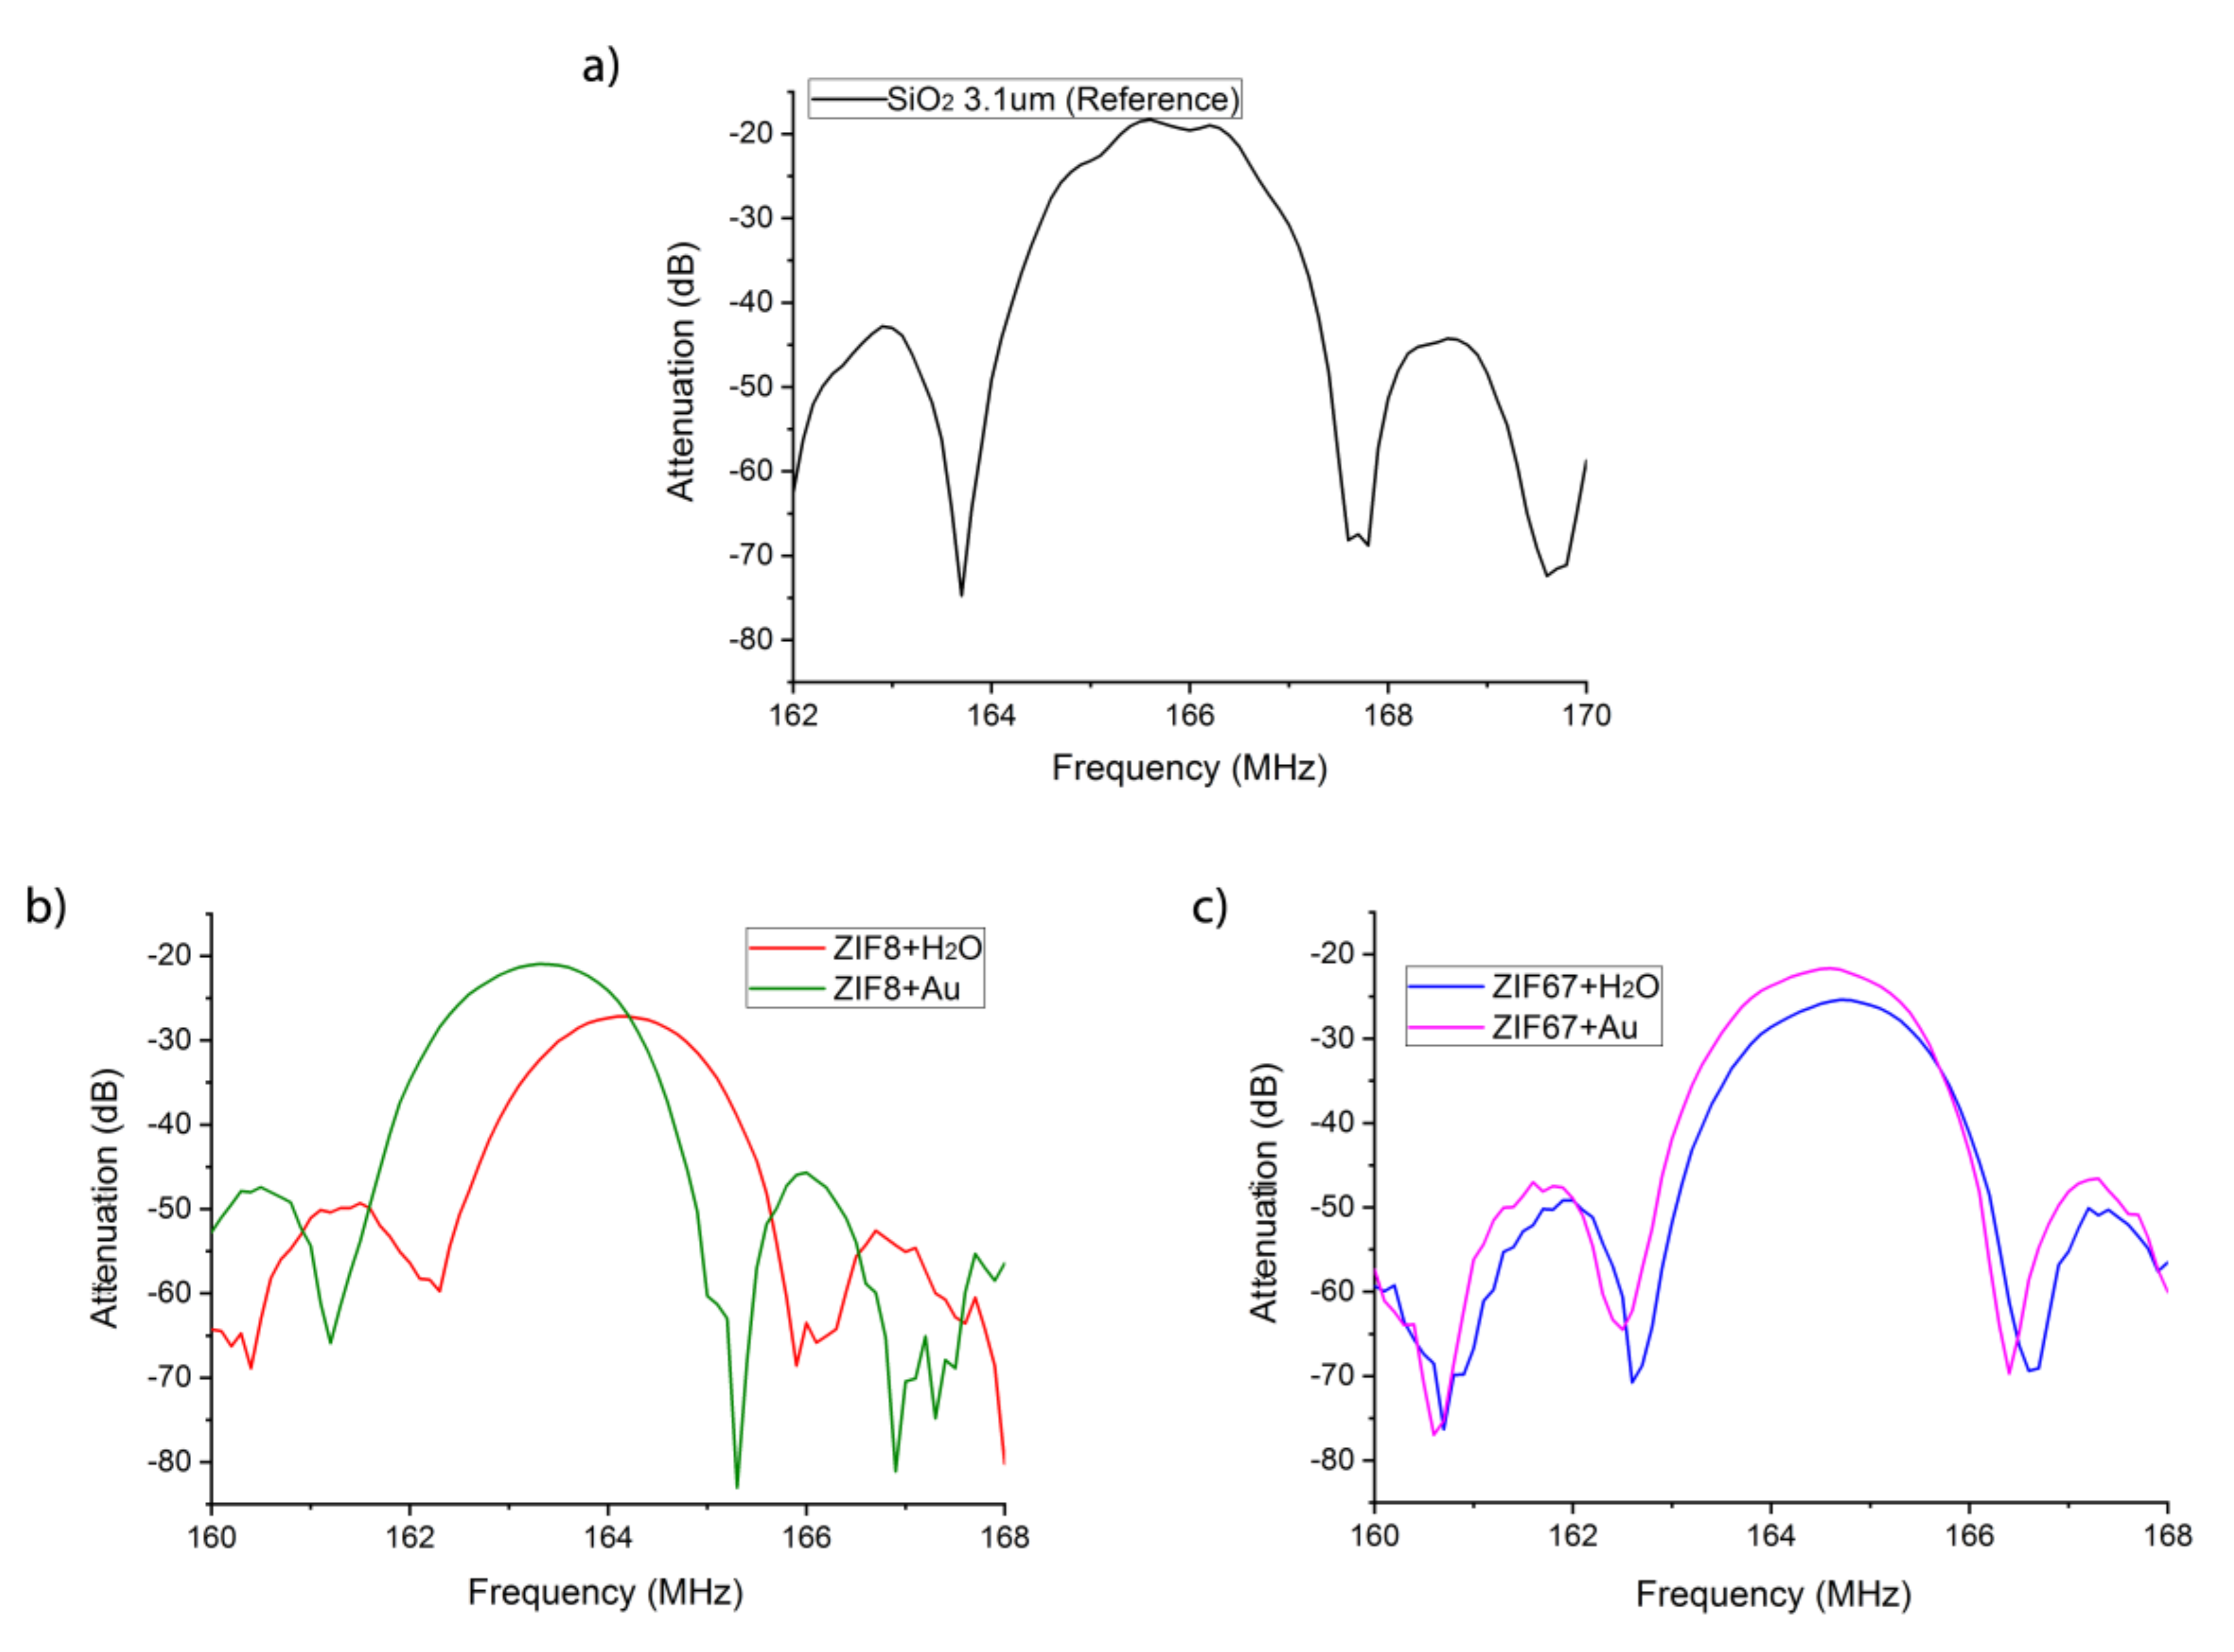
3.2. Electrical Characterization of the Love-Wave Sensors

The LW sensors were characterized before and after depositing the ZIF nanocrystal sensitive layers. In the array, a reference device without a sensitive layer was used (Figure 7a) to compensate sensor responses for undesirable changes in temperature and pressure. The sensors were characterized by means of the automatic network analyzer (ANA Wiltron 360B, WILTRON CO., Ltd., Incheon, Korea) and the S21 parameter was used to measure insertion loss transmission. The frequency response of each sensor exhibited a frequency shift of the minimum insertion loss caused by the mass loading of the sensitive material (Figure 7b,c). On the other hand, increases of insertion losses (Table 2) were a consequence of the scattering due to the propagation of the SAW wave in the sensitive material.

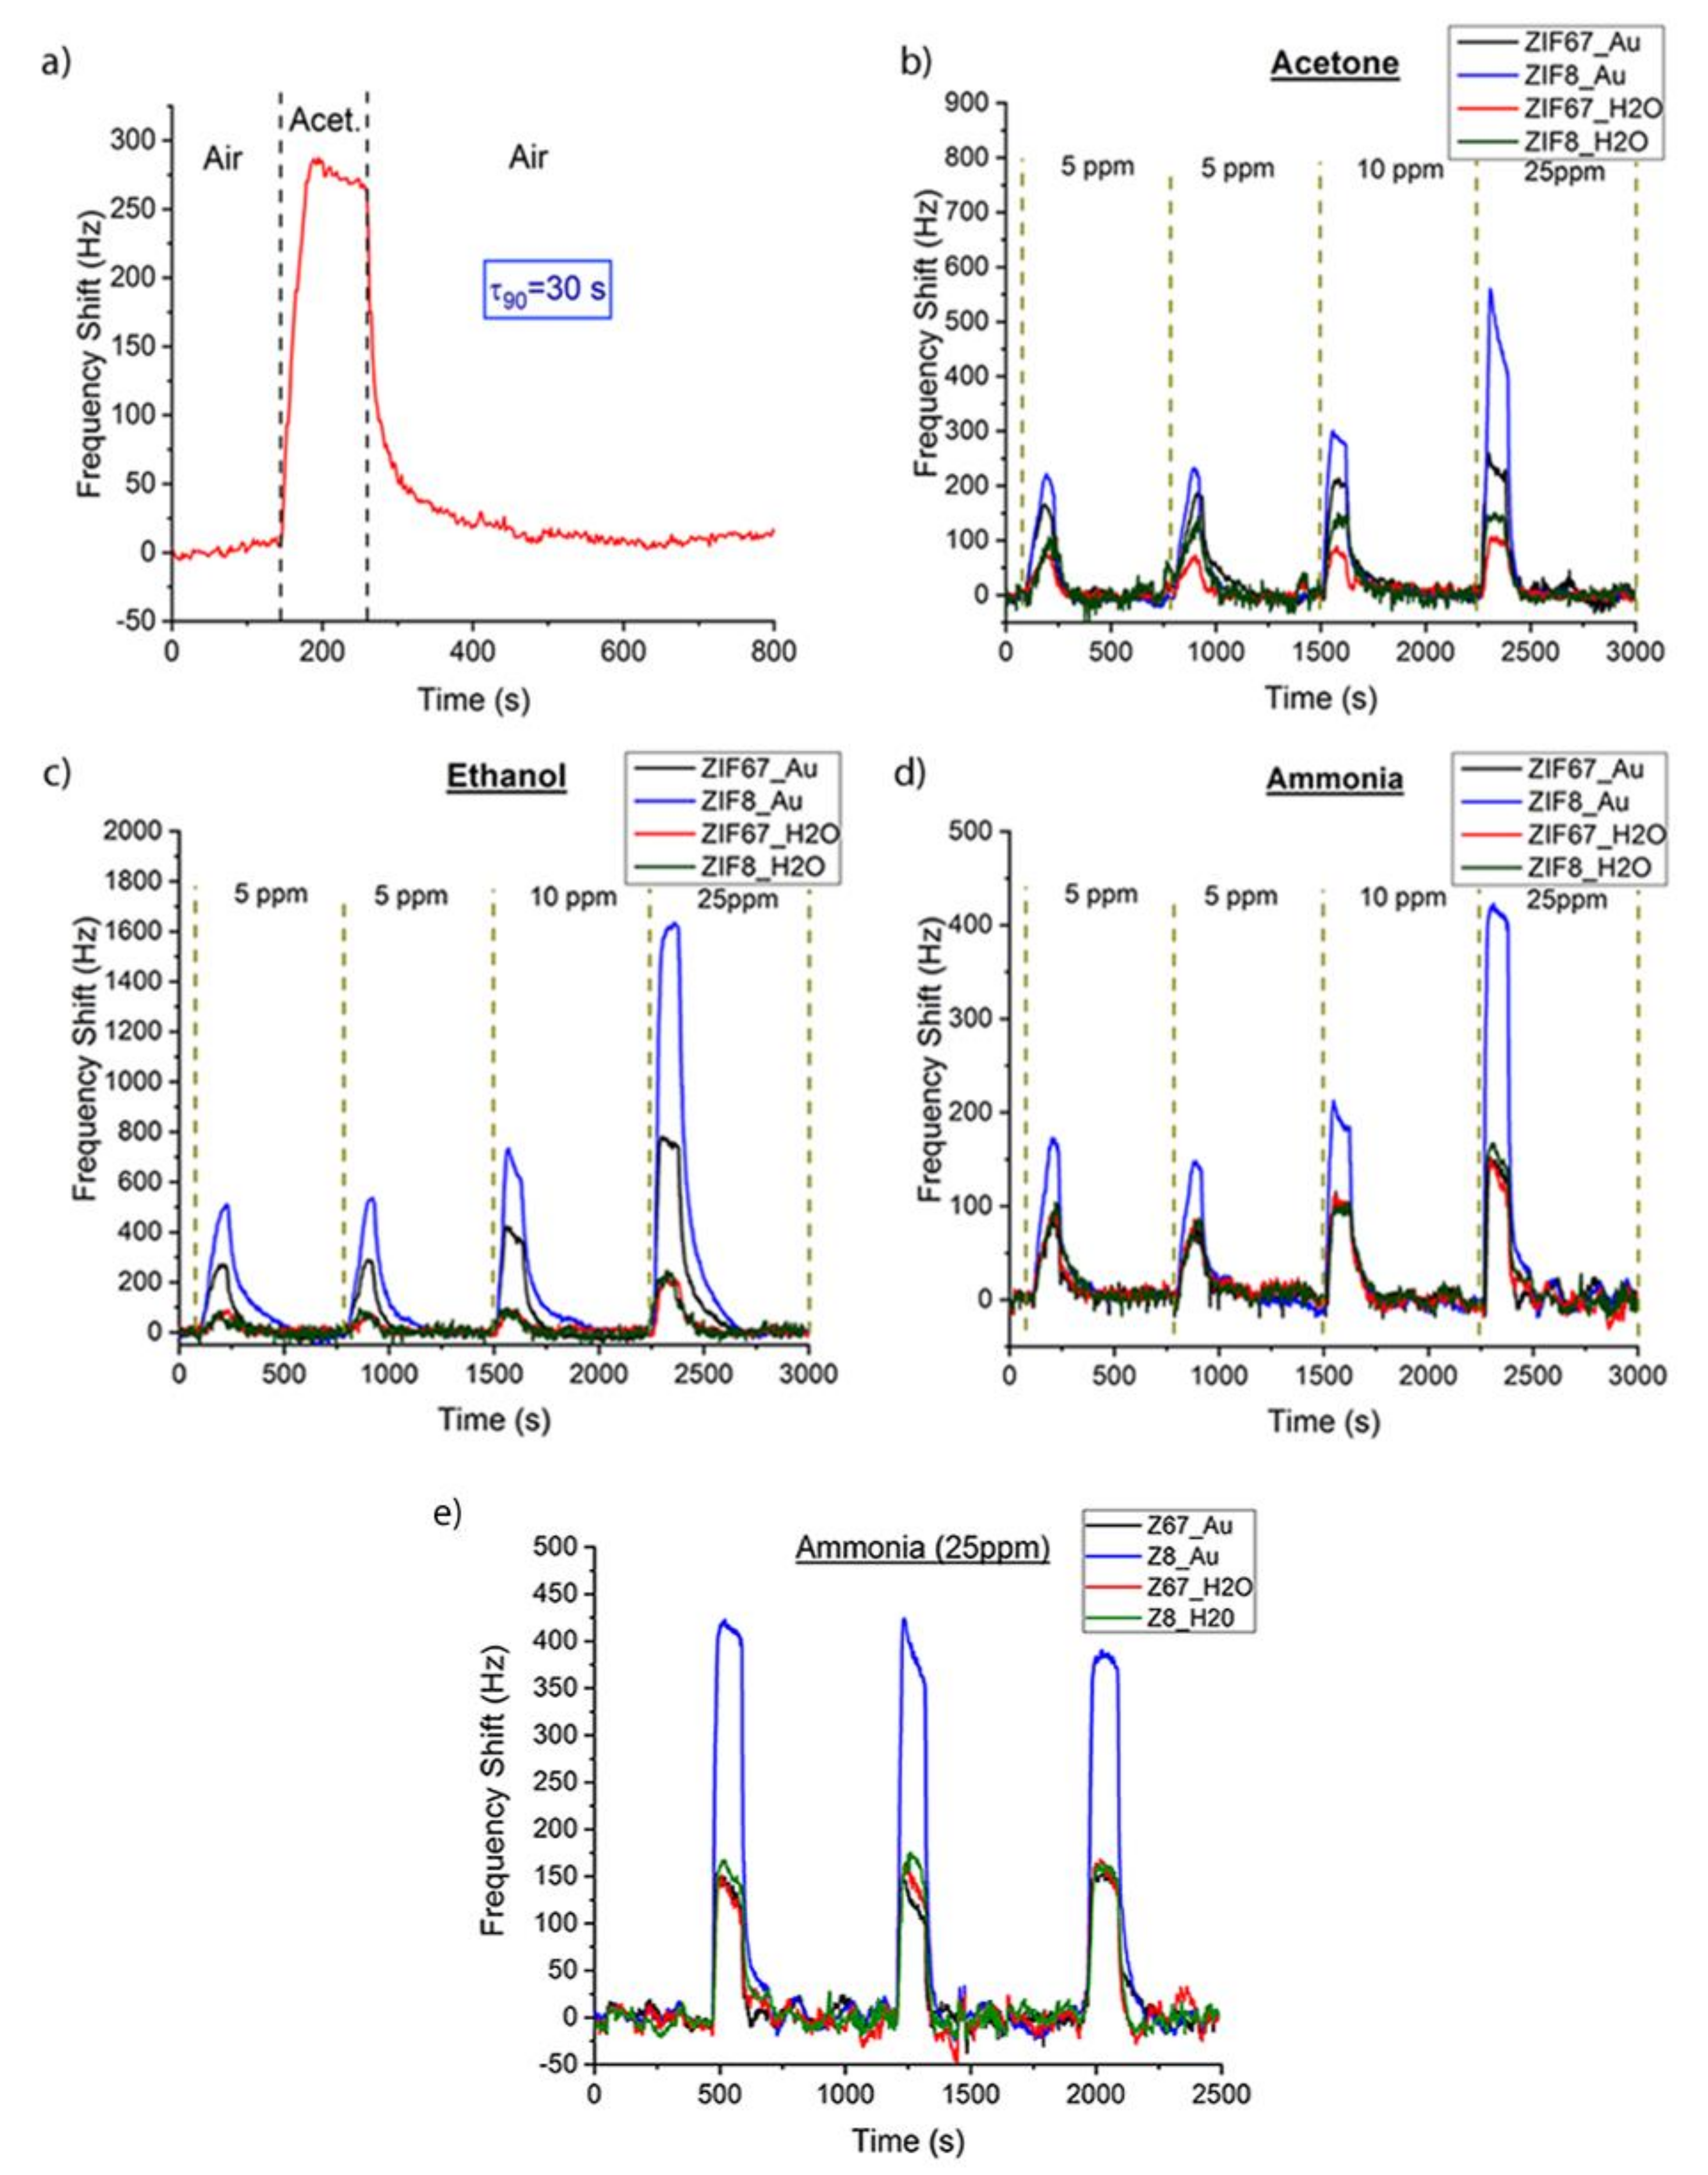
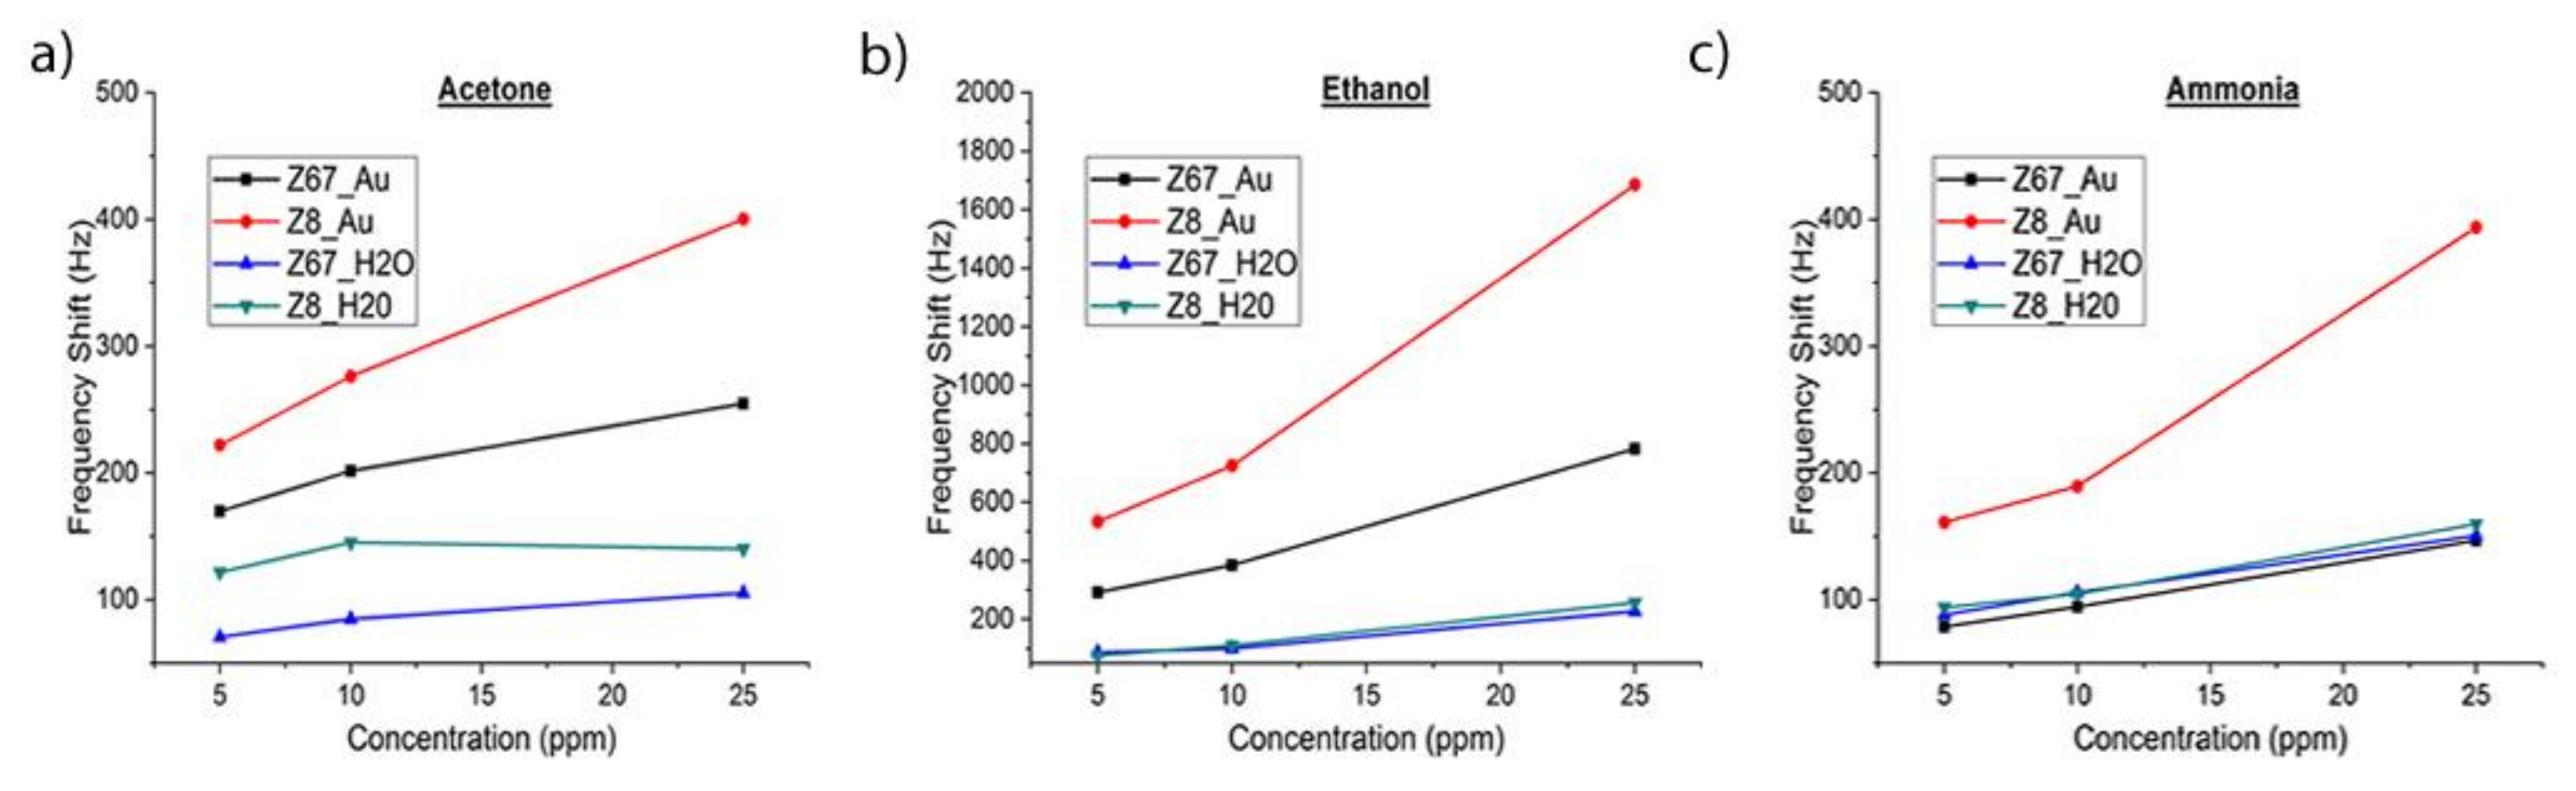
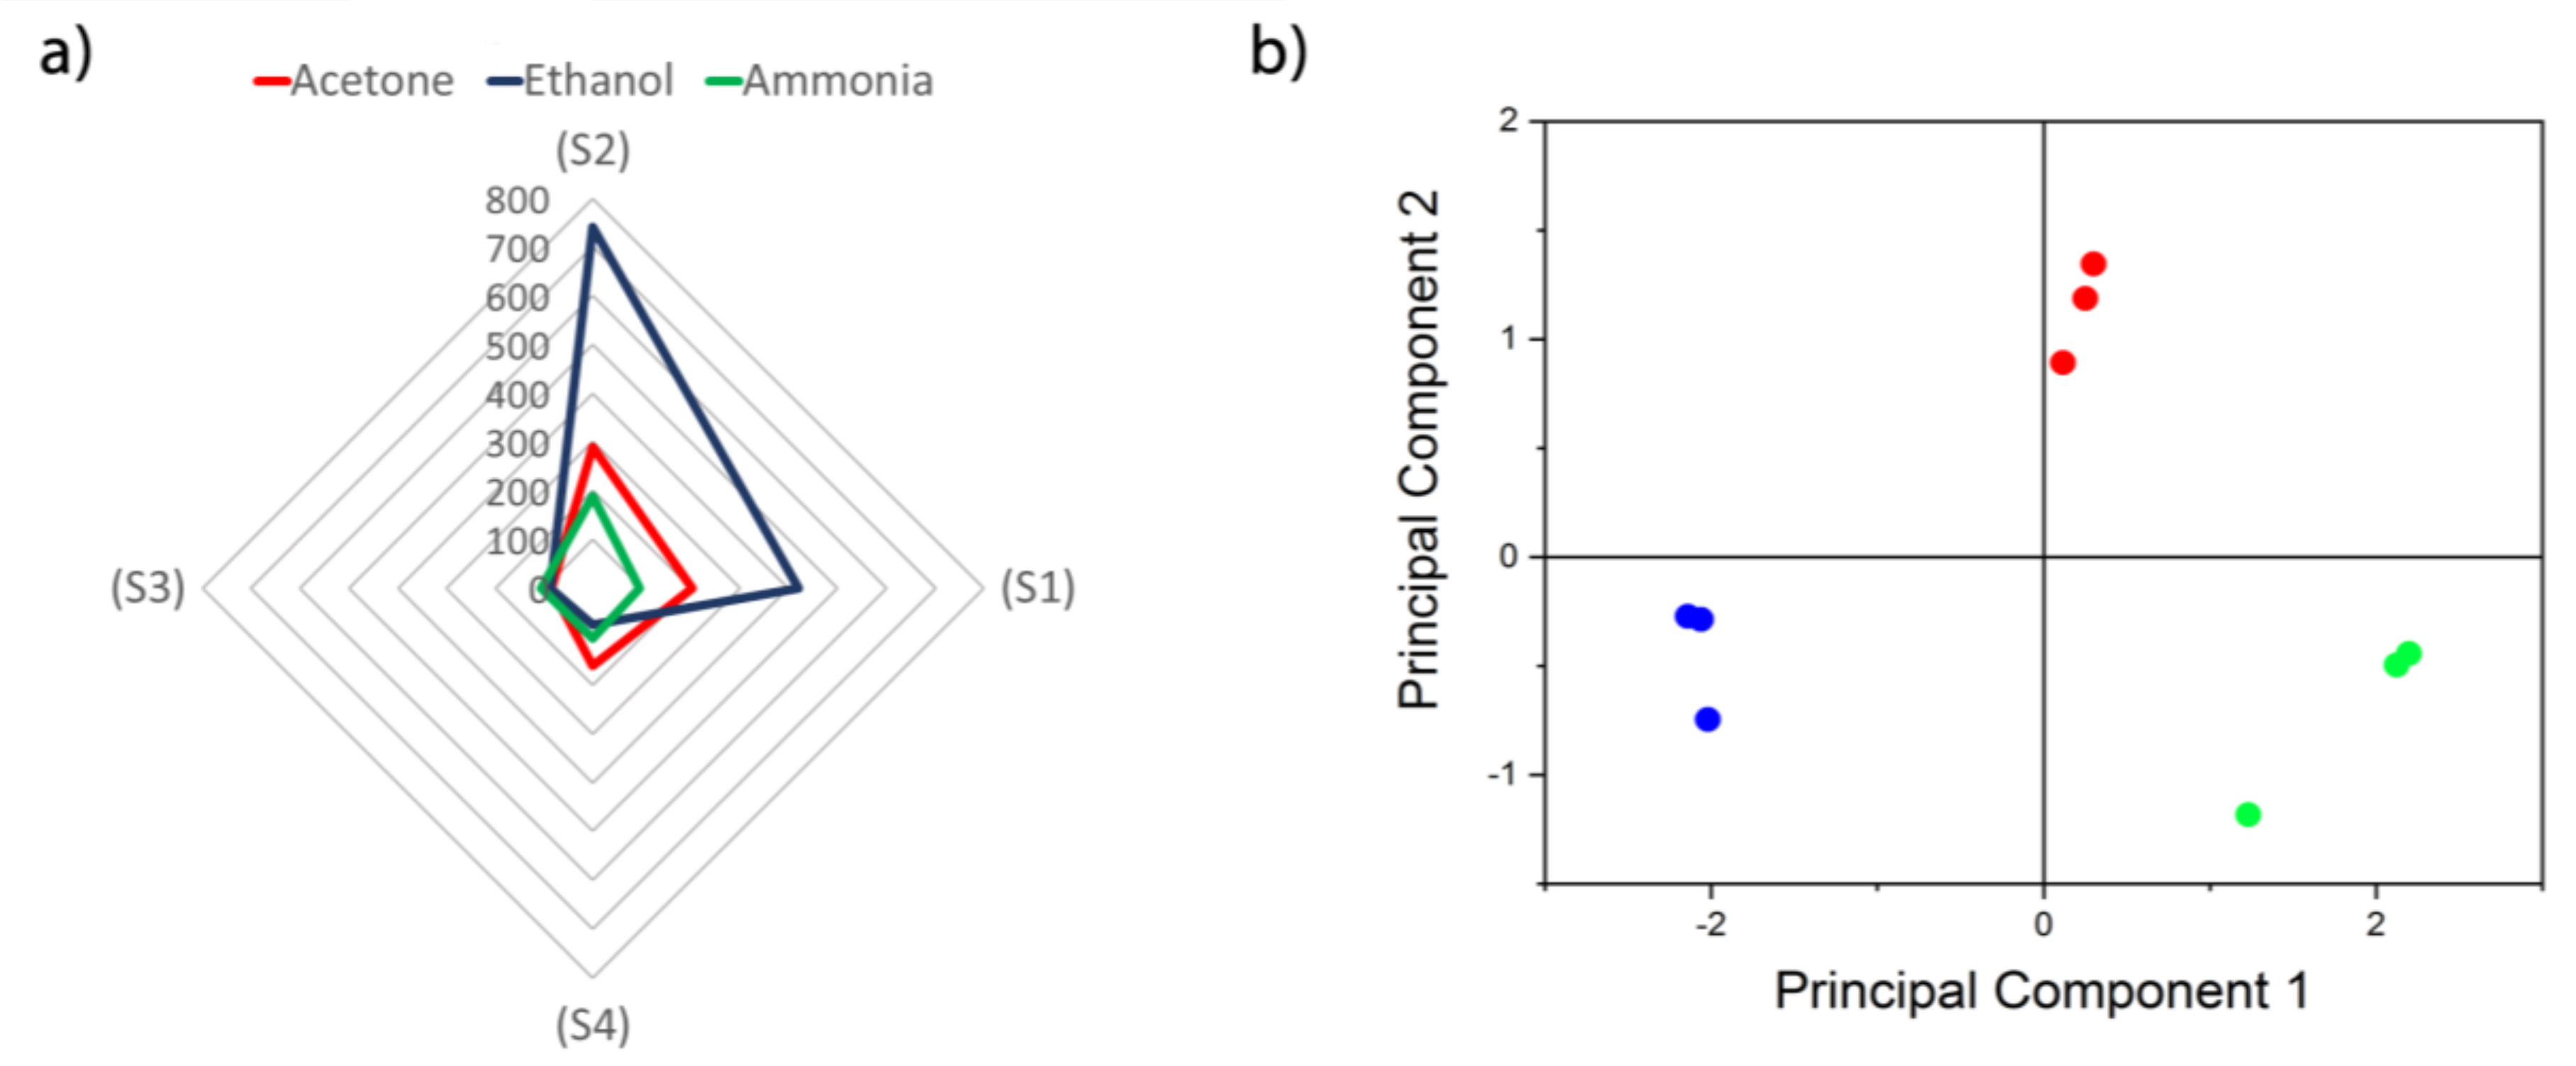
3.3. Gas Characterization

The SAW eNose based on a LW sensor array with ZIFs nanocrystals was tested with acetone, ethanol and ammonia markers related to diabetes mellitus disease. The sensors were exposed for two minutes to each analyte at concentrations of 5 ppm, 10 ppm and 25 ppm, and then the array was purged with dry synthetic air for 10 min. The LW sensors showed a notable and fast response, e.g., for 10 ppm of acetone a frequency shift of 275 Hz and a τ90, around 30 s, with a complete recovery achieved after 10 min (Figure 8a), τ90 being defined as the time taken to reach 90% of the frequency shift. The response of the sensor array to different concentrations of acetone (Figure 8b), ethanol (Figure 8c), and ammonia (Figure 8d) showed a high frequency shift for the different sensitive layers tested, obtaining best sensitivities for S2 (ZIF8_Au). The measurement reproducibility was tested in two different forms; first, the lowest concentration (5 ppm) was measured twice in continuous cycles, during which a similar frequency shift was obtained; and second, the measurement with 25 ppm of ammonia was repeated three times, as a control test (Figure 8e), showing similar values of frequency shifts. Therefore, the eNose can be used for measurements in a few seconds and repetitions or new measurements can be carried out after ten minutes.
The reference sensor helped to compensate in the sensor array the pressure and temperature changes due to external factors, measuring only variations related to the interaction of the analytes with the sensitive layers (Table 3). The frequency shifts at the end of the exposure time were taken as responses and calibration curves were obtained (Figure 9). The responses of the sensors were found to increase with higher concentrations.
The ZIFs/AuNP layers deposited on SiO2 showed better mechanical properties than the ZIFs layers. In spite of a larger shift of the SAW response towards a lower frequency, they had lower insertion losses, which explains the enhanced gas-sensing properties of ZIFs/AuNP layers for the three samples. However, in the cases of acetone and ethanol, the ZIFs/AuNP layers had a significantly increased sensitivity that can be attributed to the strong interaction Au-gas molecule [43]. On the other hand, the greater sensitivity of the ZIFs/AuNP layers for ethanol can be associated with the well-known catalytic activity of <5 nm sized AuNPs for selective oxidation of alcohols [44]. Ethanol adsorbed on the AuNPs surface can then be oxidized, even at room conditions, to acetaldehyde which is detected with enhanced sensitivity by the ZIFs [21,45].
The present sensor array with nanocrystalline ZIFs as sensitive materials allows detection and discrimination of acetone, ammonia, and ethanol, as sensor responses show in the radial surface analysis to 10 ppm of the three markers (Figure 10a). In order to make discrimination and classification more feasible in a real case, for a given marker concertation the response for each sensor was normalized to the sum of the responses of the different sensors. By doing so, the information in the data of all sensors is conserved. Principal component analysis (PCA) was applied to this data and a total separation is observed among the markers (Figure 10b). This shows that the SAW eNose presented can be used to relate specific fingerprints to diabetes.
The present sensors have some significant advantages over the chemoresistive sensors based on ZIFs. First, SAW sensors show high sensitivity towards acetone, ethanol and ammonia at room temperature and chemoresistive sensors possess good sensitivity at high temperatures but poor sensitivity at room temperature [21,38,45]. Second, ZIF-8 has a high electrical resistance, requiring its combination with other materials to develop chemoresistive sensors [21,38]. Finally, a chemoresistive sensor based on ZnO nanorods showed gas selective of gases when combined with ZIF–8 shell [21], decreasing sensitivity towards acetone, ethanol or ammonia; however, SAW devices with ZIF sensitive layers combined with nanoparticles improve the sensitivity towards acetone and ethanol.

4. Conclusions

A SAW eNose based on Love-wave sensors combined with ZIF-8, ZIF-67, ZIF-8/AuNP and ZIF-67/AuNP as sensitive layers was tested to three breath markers of Diabetes mellitus: acetone, ethanol and ammonia at concentrations of 5 ppm, 10 ppm and 25 ppm.
It has been shown that the SAW/ZIF eNose is effective in obtaining high sensitivity, selectivity, and reproducibility. Fast detection and recovery responses have been achieved as well, detecting concentrations as low as 5 ppm of ammonia. Finally, the efficiency of the system to discriminate Diabetes mellitus markers has been demonstrated using principal component analysis.
In conclusion, tests carried out in this work exhibited a properly performance of the SAW/ZIF eNose to be proved in future works as a prototype for a noninvasive system contributing to the diagnosis and control of Diabetes mellitus in real cases.

Author Contributions

F.A.B. and D.M. designed and developed the instrumentation, and they measured the disease markers. A.S.V. and J.M.S. designed and synthesized the nanomaterials. C.S.P., J.M.S. and D.M. designed and directed the research. I.G. fabricated the SAW devices. M.M.S.A. provided a medical overview focus on the application of the eNose for the diabetes diagnosis and control. All authors have participated in the discussions of the results and have approved the final version of the manuscript.

Funding

This work has been supported by Universidad Nacional Autónoma de México via Grants DGAPA-UNAM-PAPIIT TA100118 and DGAPA-UNAM-PAPIIT IT100518, the Fundación General CSIC via Programa ComFuturo, and the Spanish Ministry of Science and Innovation via Grant TEC2016-79898-C6-(AEI/FEDER,EU). This research has used the Spanish ICTS Network MICRONANOFABS (partially funded by MINECO).

Acknowledgments

F.A.B. thanks to CONACYT-México for his master. A.S.V. thanks to CONACYT- México by her posdoctoral grant. A.S.V. acknowledge CONACYT project 2014-Fronteras 2016-01 for the postdoctoral fellowship. F.A.B., A.S.V., J.M.S. and D.M. thank to the Laboratorio Universitario de Caracterización Espectrocópica (LUCE) by the use of its facilities and Selene Islas, V. Maturano, M. E. Mata Zamora and J.O. Flores-Flores for their technical assistance, as well as to Antonio Morales for the DRX measurements at the IF-UNAM and to Omar Novelo for the SEM and EDS measurements at the IIM-UNAM.

Conflicts of Interest

There are no conflicts of interest.

References

  1. Dummer, J.; Storer, M.; Swanney, M.; McEwan, M.; Scott-Thomas, A.; Bhandari, S.; Chambers, S.; Dweik, R.; Epton, M. Analysis of biogenic volatile organic compounds in human health and disease. TrAC Trends Anal. Chem. 2011, 30, 960–967. [Google Scholar] [CrossRef]
  2. Cikach, F.S.; Dweik, R.A. Cardiovascular Biomarkers in Exhaled Breath. Prog. Cardiovasc. Dis. 2012, 55, 34–43. [Google Scholar] [CrossRef] [PubMed] [Green Version]
  3. Miekisch, W.; Schubert, J.K. From highly sophisticated analytical techniques to life-saving diagnostics: Technical developments in breath analysis. TrAC Trends Anal. Chem. 2006, 25, 665–673. [Google Scholar] [CrossRef]
  4. Das, S.; Pal, S.; Mitra, M. Significance of Exhaled Breath Test in Clinical Diagnosis: A Special Focus on the Detection of Diabetes Mellitus. J. Med. Biol. Eng. 2016, 36. [Google Scholar] [CrossRef] [PubMed]
  5. Diskin, A.M.; Španěl, P.; Smith, D. Time variation of ammonia, acetone, isoprene and ethanol in breath: A quantitative SIFT-MS study over 30 days. Physiol. Meas. 2003, 24, 107–119. [Google Scholar] [CrossRef] [PubMed]
  6. Rheaume, J.M.; Pisano, A.P. A review of recent progress in sensing of gas concentration by impedance change. Ionics 2011, 17, 99–108. [Google Scholar] [CrossRef] [Green Version]
  7. Santos, J.P.; Fernández, M.J.; Fontecha, J.L.; Matatagui, D.; Matatagui, D.; Sayago, I.; Horrillo, M.C.; Gracia, I. Nanocrystalline tin oxide nanofibers deposited by a novel focused electrospinning method. Application to the detection of TATP precursors. Sensors 2014, 14, 24231–24243. [Google Scholar] [CrossRef]
  8. Nayak, A.K.; Ghosh, R.; Santra, S.; Guha, P.K.; Pradhan, D. Hierarchical nanostructured WO3–SnO2 for selective sensing of volatile organic compounds. Nanoscale 2015, 7, 12460–12473. [Google Scholar] [CrossRef]
  9. Hodgkinson, J.; Tatam, R.P. Optical gas sensing: A review. Meas. Sci. Technol. 2013, 24, 012004. [Google Scholar] [CrossRef]
  10. Hromadka, J.; Tokay, B.; Correia, R.; Morgan, S.P.; Korposh, S. Highly sensitive volatile organic compounds vapour measurements using a long period grating optical fibre sensor coated with metal organic framework ZIF-8. Sens. Actuators B Chem. 2018, 260, 685–692. [Google Scholar] [CrossRef] [Green Version]
  11. Fragoso-Mora, J.R.; Matatagui, D.; Bahos, F.A.; Fontecha, J.; Fernandez, M.J.; Santos, J.P.; Sayago, I.; Gràcia, I.; Horrillo, M.C. Gas sensors based on elasticity changes of nanoparticle layers. Sens. Actuators B Chem. 2018, 268, 93–99. [Google Scholar] [CrossRef]
  12. Ballantine, D.S.; Martin, S.J.; Ricco, A.J.; Frye, G.C.; Wohltjen, H.; White, R.M.; Zellers, E.T. Chapter 3-Acoustic Wave Sensors and Responses. In Applications of Modern Acoustics; Ballantine, D.S., Martin, S.J., Ricco, A.J., Frye, G.C., Wohltjen, H., White, R.M., Zellers, E.T., Eds.; Academic Press: Burlington, NJ, USA, 1997; pp. 36–149. ISBN 978-0-12-077460-9. [Google Scholar]
  13. Kannan, P.K.; Late, D.J.; Morgan, H.; Rout, C.S. Recent developments in 2D layered inorganic nanomaterials for sensing. Nanoscale 2015, 7, 13293–13312. [Google Scholar] [CrossRef] [PubMed]
  14. Jiménez-Cadena, G.; Riu, J.; Rius, F.X. Gas sensors based on nanostructured materials. Analyst 2007, 132, 1083–1099. [Google Scholar] [CrossRef] [PubMed]
  15. Comini, E. Metal oxide nanowire chemical sensors: Innovation and quality of life. Mater. Today 2016, 19, 559–567. [Google Scholar] [CrossRef]
  16. Xu, X.; Wang, J.; Long, Y.; Xu, X.; Wang, J.; Long, Y. Zeolite-based Materials for Gas Sensors. Sensors 2006, 6, 1751–1764. [Google Scholar] [CrossRef] [Green Version]
  17. Kreno, L.E.; Leong, K.; Farha, O.K.; Allendorf, M.; Van Duyne, R.P.; Hupp, J.T. Metal–Organic Framework Materials as Chemical Sensors. Chem. Rev. 2012, 112, 1105–1125. [Google Scholar] [CrossRef] [PubMed]
  18. DMello, M.E.; Sundaram, N.G.; Kalidindi, S.B. Assembly of ZIF-67 Metal-Organic Framework over Tin Oxide Nanoparticles for Synergistic Chemiresistive CO 2 Gas Sensing. Chem. A Eur. J. 2018, 24, 9220–9223. [Google Scholar] [CrossRef]
  19. Paschke, B.; Wixforth, A.; Denysenko, D.; Volkmer, D. Fast Surface Acoustic Wave-Based Sensors to Investigate the Kinetics of Gas Uptake in Ultra-Microporous Frameworks. ACS Sens. 2017, 2, 740–747. [Google Scholar] [CrossRef]
  20. Devkota, J.; Kim, K.-J.; Ohodnicki, P.R.; Culp, J.T.; Greve, D.W.; Lekse, J.W. Zeolitic imidazolate framework-coated acoustic sensors for room temperature detection of carbon dioxide and methane. Nanoscale 2018, 10, 8075–8087. [Google Scholar] [CrossRef] [Green Version]
  21. Tian, H.; Fan, H.; Li, M.; Ma, L. Zeolitic Imidazolate Framework Coated ZnO Nanorods as Molecular Sieving to Improve Selectivity of Formaldehyde Gas Sensor. ACS Sens. 2016, 1, 243–250. [Google Scholar] [CrossRef]
  22. Zhang, K.; Lively, R.P.; Zhang, C.; Chance, R.R.; Koros, W.J.; Sholl, D.S.; Nair, S. Exploring the Framework Hydrophobicity and Flexibility of ZIF-8: From Biofuel Recovery to Hydrocarbon Separations. J. Phys. Chem. Lett. 2013, 4, 3618–3622. [Google Scholar] [CrossRef]
  23. Eum, K.; Jayachandrababu, K.C.; Rashidi, F.; Zhang, K.; Leisen, J.; Graham, S.; Lively, R.P.; Chance, R.R.; Sholl, D.S.; Jones, C.W.; et al. Highly Tunable Molecular Sieving and Adsorption Properties of Mixed-Linker Zeolitic Imidazolate Frameworks. J. Am. Chem. Soc. 2015, 137, 4191–4197. [Google Scholar] [CrossRef]
  24. Tao, J.; Wang, X.; Sun, T.; Cai, H.; Wang, Y.; Lin, T.; Fu, D.; Ting, L.L.Y.; Gu, Y.; Zhao, D. Hybrid Photonic Cavity with Metal-Organic Framework Coatings for the Ultra-Sensitive Detection of Volatile Organic Compounds with High Immunity to Humidity. Sci. Rep. 2017, 7. [Google Scholar] [CrossRef] [PubMed]
  25. Mayer-Davis, E.J.; Lawrence, J.M.; Dabelea, D.; Divers, J.; Isom, S.; Dolan, L.; Imperatore, G.; Linder, B.; Marcovina, S.; Pettitt, D.J.; et al. Incidence Trends of Type 1 and Type 2 Diabetes among Youths, 2002–2012. N. Engl. J. Med. 2017, 376, 1419–1429. [Google Scholar] [CrossRef] [PubMed] [Green Version]
  26. Letourneau, L.R.; Carmody, D.; Wroblewski, K.; Denson, A.M.; Sanyoura, M.; Naylor, R.N.; Philipson, L.H.; Greeley, S.A.W. Diabetes Presentation in Infancy: High Risk of Diabetic Ketoacidosis. Diabetes Care 2017, 40, e147–e148. [Google Scholar] [CrossRef] [PubMed] [Green Version]
  27. Anderson, J.C.; Lamm, W.J.E.; Hlastala, M.P. Measuring airway exchange of endogenous acetone using a single-exhalation breathing maneuver. J. Appl. Physiol. 2006, 100, 880–889. [Google Scholar] [CrossRef] [PubMed] [Green Version]
  28. Freund, G.; Weinsier, R.L. Standardized ketosis in man following medium chain triglyceride ingestion. Metabolism 1966, 15, 980–991. [Google Scholar] [CrossRef]
  29. Saslow, L.R.; Kim, S.; Daubenmier, J.J.; Moskowitz, J.T.; Phinney, S.D.; Goldman, V.; Murphy, E.J.; Cox, R.M.; Moran, P.; Hecht, F.M. A Randomized Pilot Trial of a Moderate Carbohydrate Diet Compared to a Very Low Carbohydrate Diet in Overweight or Obese Individuals with Type 2 Diabetes Mellitus or Prediabetes. PLoS ONE 2014, 9. [Google Scholar] [CrossRef]
  30. Phinney, S.D.; Bistrian, B.R.; Wolfe, R.R.; Blackburn, G.L. The human metabolic response to chronic ketosis without caloric restriction: Physical and biochemical adaptation. Metabolism 1983, 32, 757–768. [Google Scholar] [CrossRef]
  31. Sulway, M.J.; Malins, J.M. ACETONE IN DIABETIC KETOACIDOSIS. Lancet 1970, 296, 736–740. [Google Scholar] [CrossRef]
  32. Minh, T.D.C.; Oliver, S.R.; Ngo, J.; Flores, R.; Midyett, J.; Meinardi, S.; Carlson, M.K.; Rowland, F.S.; Blake, D.R.; Galassetti, P.R. Noninvasive measurement of plasma glucose from exhaled breath in healthy and type 1 diabetic subjects. Am. J. Physiol. Endocrinol. Metab. 2011, 300, E1166–E1175. [Google Scholar] [CrossRef] [PubMed] [Green Version]
  33. Galassetti, P.R.; Novak, B.; Nemet, D.; Rose-Gottron, C.; Cooper, D.M.; Meinardi, S.; Newcomb, R.; Zaldivar, F.; Blake, D.R. Breath Ethanol and Acetone as Indicators of Serum Glucose Levels: An Initial Report. Diabetes Technol. Ther. 2005, 7, 115–123. [Google Scholar] [CrossRef] [PubMed] [Green Version]
  34. Lee, J.; Ngo, J.; Blake, D.; Meinardi, S.; Pontello, A.M.; Newcomb, R.; Galassetti, P.R. Improved predictive models for plasma glucose estimation from multi-linear regression analysis of exhaled volatile organic compounds. J. Appl. Physiol. 2009, 107, 155–160. [Google Scholar] [CrossRef] [PubMed] [Green Version]
  35. Qin, T.; Xu, X.; Polák, T.; Pacáková, V.; Štulík, K.; Jech, L. A simple method for the trace determination of methanol, ethanol, acetone and pentane in human breath and in the ambient air by preconcentration on solid sorbents followed by gas chromatography. Talanta 1997, 44, 1683–1690. [Google Scholar] [CrossRef]
  36. Turner, C.; Španěl, P.; Smith, D. A longitudinal study of ammonia, acetone and propanol in the exhaled breath of 30 subjects using selected ion flow tube mass spectrometry, SIFT-MS. Physiol. Meas. 2006, 27, 321–337. [Google Scholar] [CrossRef] [PubMed]
  37. Schmidt, F.M.; Vaittinen, O.; Metsälä, M.; Lehto, M.; Forsblom, C.; Groop, P.-H.; Halonen, L. Ammonia in breath and emitted from skin. J. Breath Res. 2013, 7. [Google Scholar] [CrossRef] [PubMed]
  38. Matatagui, D.; Sainz-Vidal, A.; Gràcia, I.; Figueras, E.; Cané, C.; Saniger, J.M. Chemoresistive gas sensor based on ZIF-8/ZIF-67 nanocrystals. Sens. Actuators B Chem. 2018, 274, 601–608. [Google Scholar] [CrossRef]
  39. Pan, Y.; Liu, Y.; Zeng, G.; Zhao, L.; Lai, Z. Rapid synthesis of zeolitic imidazolate framework-8 (ZIF-8) nanocrystals in an aqueous system. Chem. Commun. 2011, 47, 2071–2073. [Google Scholar] [CrossRef]
  40. Gross, A.F.; Sherman, E.; Vajo, J.J. Aqueous room temperature synthesis of cobalt and zinc sodalite zeolitic imidizolate frameworks. Dalt. Trans. 2012, 41, 5458–5460. [Google Scholar] [CrossRef]
  41. Sahu, S.R.; Devi, M.M.; Mukherjee, P.; Sen, P.; Biswas, K. Optical Property Characterization of Novel Graphene-X (X = Ag, Au and Cu) Nanoparticle Hybrids. J. Nanomater. 2013, 2013, 1–9. [Google Scholar] [CrossRef]
  42. Park, K.S.; Ni, Z.; Côté, A.P.; Choi, J.Y.; Huang, R.; Uribe-Romo, F.J.; Chae, H.K.; O’Keeffe, M.; Yaghi, O.M. Exceptional chemical and thermal stability of zeolitic imidazolate frameworks. Proc. Natl. Acad. Sci. USA 2006, 103, 10186–10191. [Google Scholar] [CrossRef] [PubMed] [Green Version]
  43. Xia, J.; Diao, K.; Zheng, Z.; Cui, X. Porous Au/ZnO nanoparticles synthesised through a metal organic framework (MOF) route for enhanced acetone gas-sensing. RSC Adv. 2017, 7, 38444–38451. [Google Scholar] [CrossRef]
  44. Sharma, A.S.; Kaur, H.; Shah, D. Selective oxidation of alcohols by supported gold nanoparticles: Recent advances. RSC Adv. 2016, 6, 28688–28727. [Google Scholar] [CrossRef]
  45. Chen, E.-X.; Yang, H.; Zhang, J. Zeolitic Imidazolate Framework as Formaldehyde Gas Sensor. Inorg. Chem. 2014, 53, 5411–5413. [Google Scholar] [CrossRef] [PubMed]
Figure 1. Representative synthesis and crystal structures of ZIF-8 and ZIF-67 used as the sensitive layers of gas sensors.
Biosensors 09 00004 g001
Figure 2. (a) Scheme representation of LW sensor and layer composition. (b) Oscillator circuit used to read the resonant frequency.
Biosensors 09 00004 g002
Figure 3. Process sequence of sensitive layer deposition on LW devices using the spin coating technique.
Biosensors 09 00004 g003
Figure 4. Experimental setup for the eNose characterization.
Biosensors 09 00004 g004
Figure 5. (a) FTIR spectra of the ZIF-8 and ZIF-67 samples diluted in KBr. (b) 2- XRD Powder Pattern of the ZIF-8 and ZIF-67 samples.
Biosensors 09 00004 g005
Figure 6. SEM image with magnification of (a) 10,000× for a continuous layer of ZIF-8 nanocrystals, (b) 50,000× for a layer of ZIF-8 nanocrystals and (c) 50,000× for a layer of ZIF-67 nanocrystals.
Biosensors 09 00004 g006
Figure 7. Spectral response of the LW sensors (a) without (b) with ZIF8 and (c) with ZIF67 layers.
Biosensors 09 00004 g007
Figure 8. (a) SAW eNose response to 10 ppm of acetone. Experimental response for 5 ppm, 10 ppm and 25 ppm of (b) acetone, (c) ethanol and (d) ammonia with S1, S2, S3, and S4 sensitive layers. (e) Three consecutive measurements for 25 ppm of ammonia.
Biosensors 09 00004 g008
Figure 9. Calibration curves of the sensors S1, S2, S3 and S4 for (a) acetone, (b) ethanol and (c) ammonia.
Biosensors 09 00004 g009
Figure 10. (a) Radial representation of the sensor array responses to 10 ppm of acetone, ethanol and ammonia. (b) Principal components analysis applied to data for discrimination of acetone (red), ethanol (blue) and ammonia (green).
Biosensors 09 00004 g010
Table 1. Different composition of the sensitive layers used in the SAW sensors included in the eNose.
SamplesSolution-1 (750 µL)Solution-2 (250 µL)
S1ZIF-67Au-NPs
S2ZIF-8Au-NPs
S3ZIF-67H2O-DI
S4ZIF-8H2O-DI
Table 2. Insertion loss and frequency shift with respect to the reference sensor, 165 MHz and 18.3 dB.
SensorsSensitive LayerAttenuation (dB)Frequency Shift (Hz)
S1ZIF-67 + AuNPs3.41100
S2ZIF-8 + AuNPs2.62400
S3ZIF-67 + H2O7.1900
S4ZIF-8 + H2O8.71500
Table 3. Sensitivity, limit of detection and response time of the sensors S1, S2, S3 and S4 obtained from responses of 10 ppm.
SensorSensitivity (Hz/ppm)Limit of Detection (ppm)Response Time (s)
Acet.Etha.Ammo.Acet.Etha.Ammo.Acet.Etha.Ammo.
S1203891.50.83.2333024
S22872191.10.51.6304027
S3810113.63.02.9363838
S41511102.12.82.9443641

