
Exploration of Trends in Antimicrobial Use and Their Determinants Based on Dispensing Information Collected from Pharmacies throughout Japan: A First Report

 , , , ,
Abstract
:1. Introduction
2. Materials and Methods
2.1. Data Sources
2.2. Calculation of AMU
received per month × 1000
2.3. Statistical Analysis
3. Results
3.1. Characteristics of Participating Pharmacies
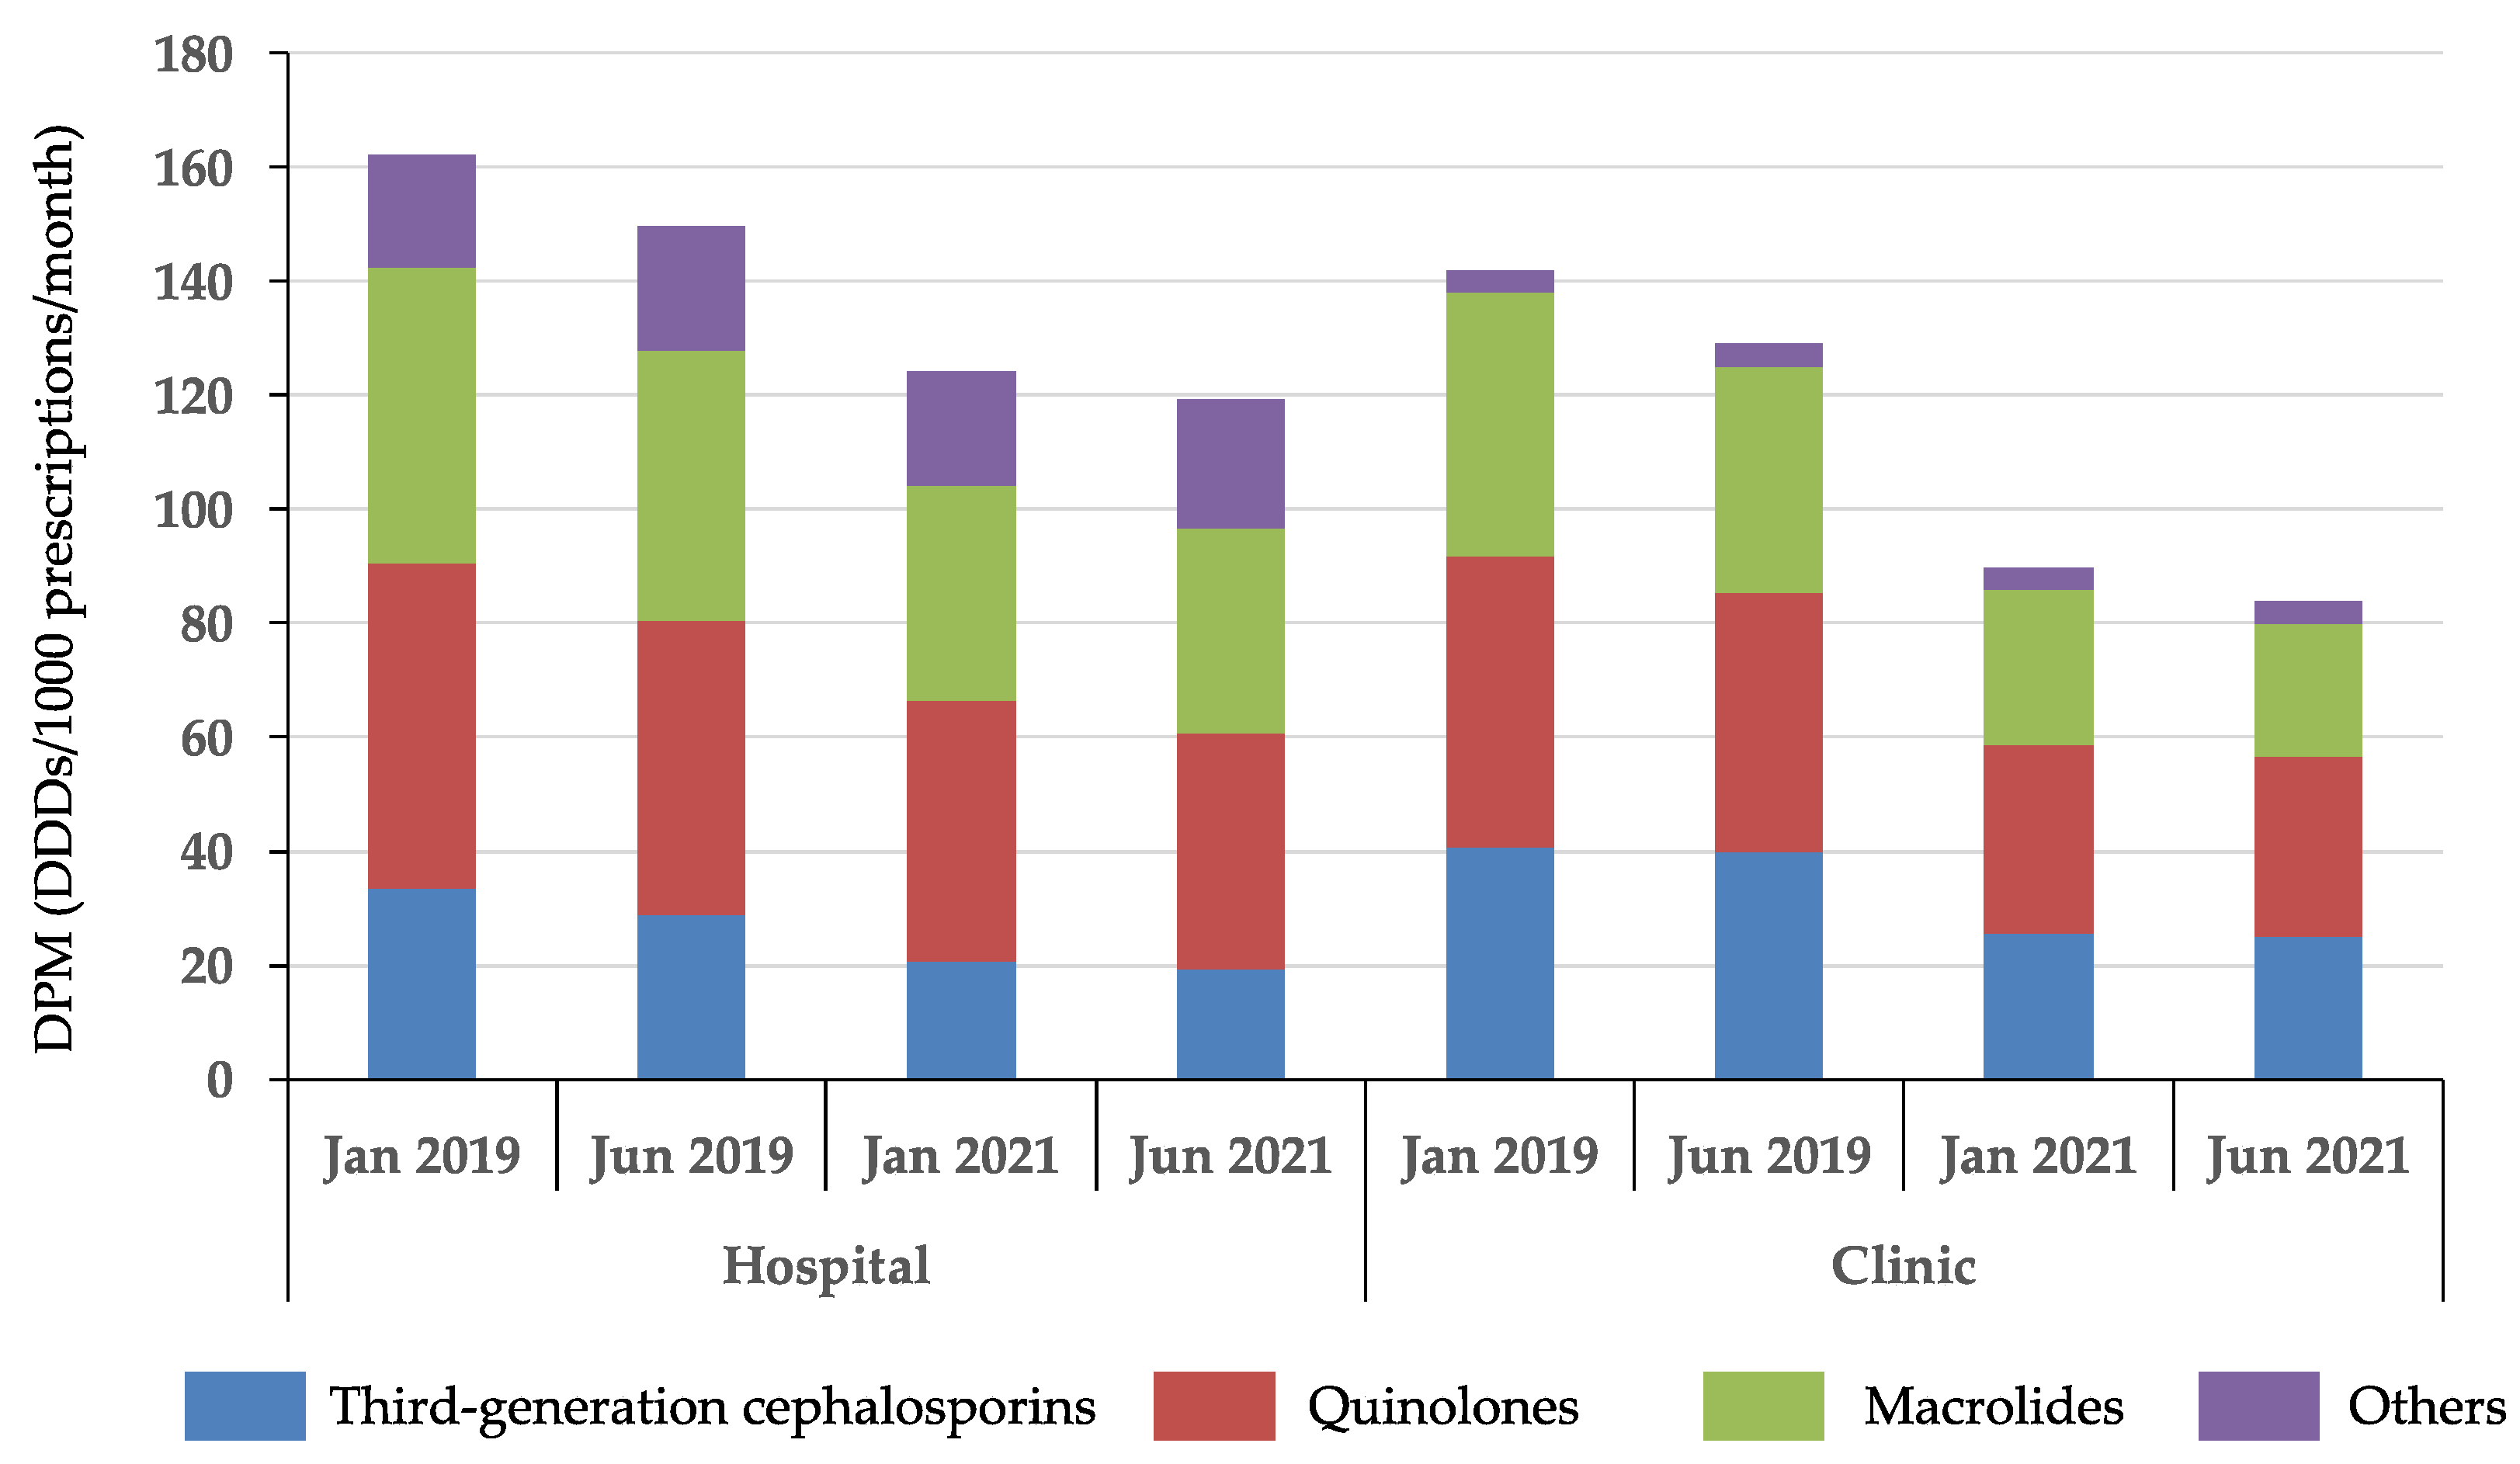
3.2. Trends in Antimicrobial Use Based on Dispensing Information
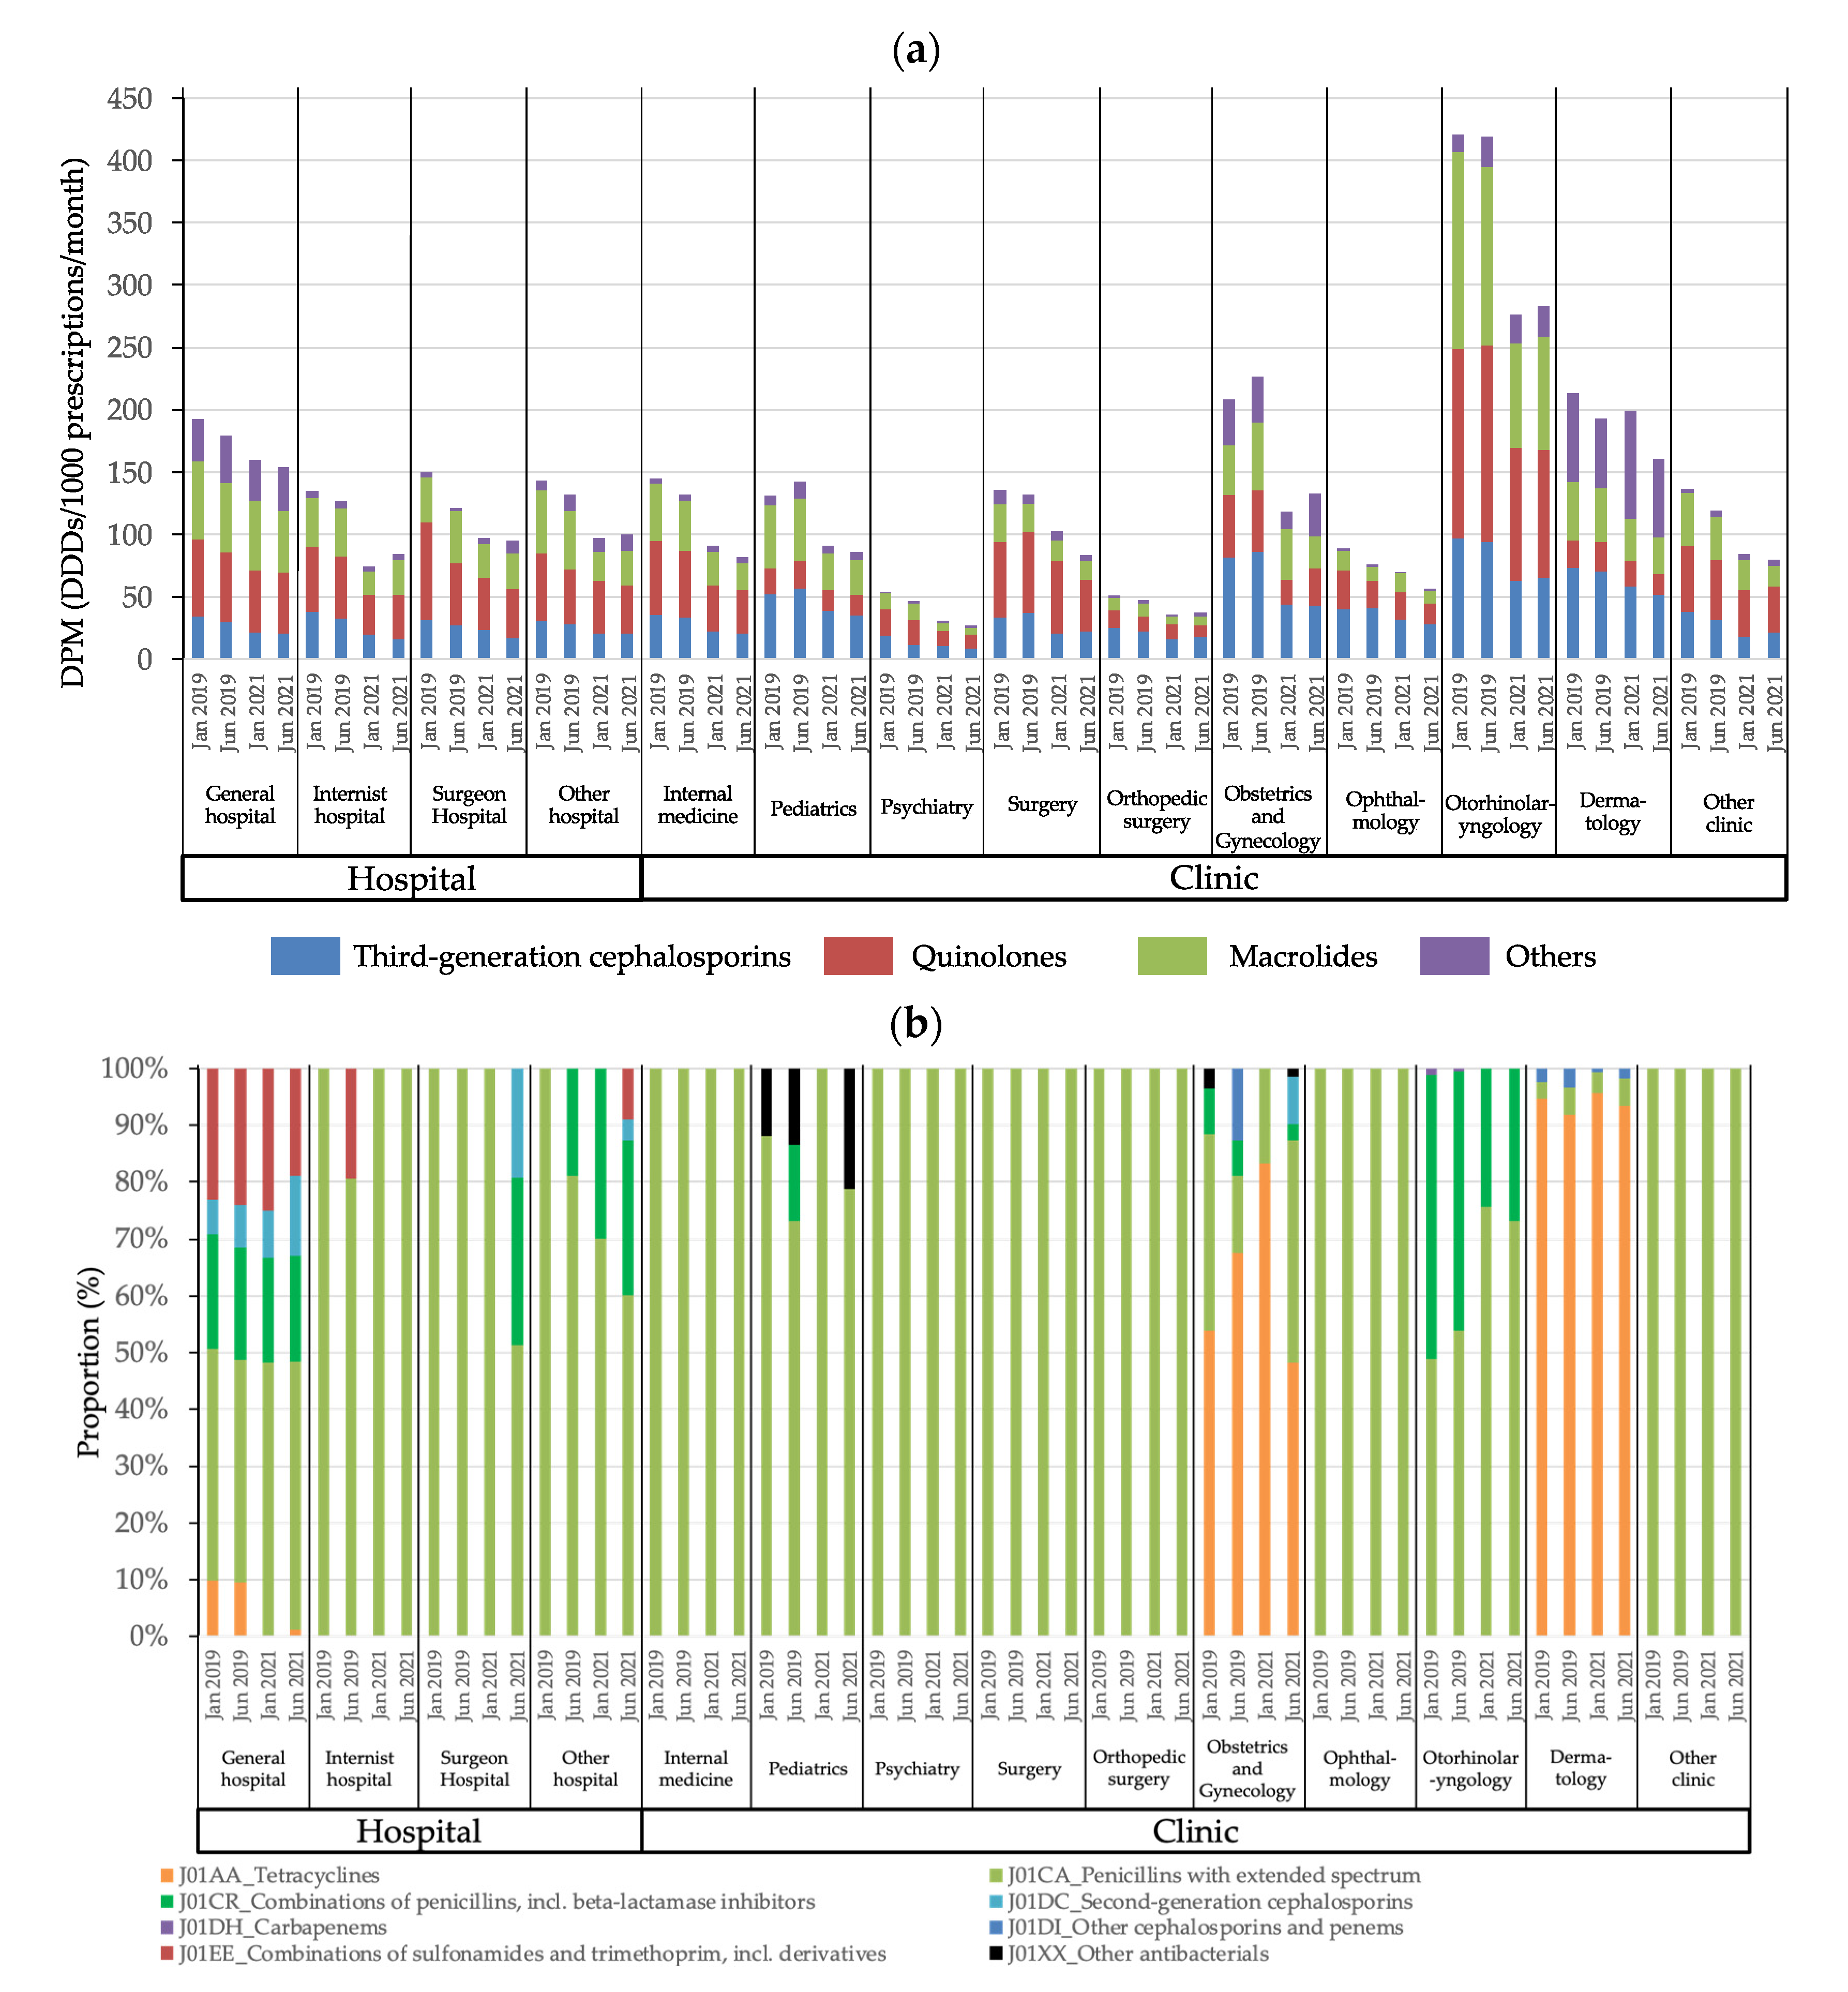
3.3. Trends in Antimicrobial Use According to Hospital or Clinic Characteristics
3.4. Trends in Antimicrobial Use Based on Dispensing Information
4. Discussion
5. Conclusions
Author Contributions
Funding
Institutional Review Board Statement
Informed Consent Statement
Data Availability Statement
Conflicts of Interest
Appendix A

| Hospital | Clinic | |||||||
|---|---|---|---|---|---|---|---|---|
| Jan-19 DPM, Median (IQR) | Jun-19 DPM, Median (IQR) | Jan-21 DPM, Median (IQR) | Jun-21 DPM, Median (IQR) | Jan-19 DPM, Median (IQR) | Jun-19 DPM, Median (IQR) | Jan-21 DPM, Median (IQR) | Jun-21 DPM, Median (IQR) | |
| J01AA Tetracyclines | 0 (0–15.6) | 0 (0–19.1) | 0 (0–17.9) | 0 (0–21.3) | 0 (0–7.0) | 0 (0–7.6) | 0 (0–7.7) | 0 (0–9.7) |
| J01BA Amphenicols | 0 (0–0) | 0 (0–0) | 0 (0–0) | 0 (0–0) | 0 (0–0) | 0 (0–0) | 0 (0–0) | 0 (0–0) |
| J01CA Penicillins with extended spectrum | 10.7 (1.6–25.6) | 11.8 (1.9–26.8) | 11.8 (2.8–27.2) | 13.0 (2.9–25.9) | 3.7 (0–14.6) | 4.1 (0–16.3) | 3.9 (0–14.9) | 4.2 (0–13.6) |
| J01CE Beta-lactamase sensitive penicillins | 0 (0, 0) | 0 (0, 0) | 0 (0, 0) | 0 (0, 0) | 0 (0, 0) | 0 (0, 0) | 0 (0, 0) | 0 (0, 0) |
| J01CR Combinations of penicillins, incl. beta-lactamase inhibitors | 4.74 (0–10.9) | 5.4 (0–12.9) | 4.4 (0–13.3) | 5.1 (0–13.4) | 0 (0–4.3) | 0 (0–5.6) | 0 (0–4.3) | 0 (0–4.9) |
| J01DB First-generation cephalosporins | 0 (0–0.2) | 0 (0–1.5) | 0 (0–3.0) | 0 (0–3.0) | 0 (0–0) | 0 (0–0) | 0 (0–0) | 0 (0–0) |
| J01DC Second-generation cephalosporins | 0 (0–8.2) | 0 (0–9.6) | 0 (0–9.9) | 1.6 (0–13.9) | 0 (0–1.6) | 0 (0–2.5) | 0 (0–2.6) | 0 (0–3.1) |
| J01DD Third-generation cephalosporins | 33.4 (16.7–55.5) | 28.9 (13.7–51.1) | 20.8 (8.6–37.0) | 19.2 (7.8–37.4) | 40.8 (17.0–90.6) | 40.0 (16.1–84.1) | 25.7 (9.9–59.4) | 25.1 (9.0–56.7) |
| J01DH Carbapenems | 0 (0–0) | 0 (0–0) | 0 (0–0) | 0 (0–0) | 0 (0–0) | 0 (0–0) | 0 (0–0) | 0 (0–0) |
| J01DI Other cephalosporins and penems | 0 (0–1.6) | 0 (0–1.4) | 0 (0–0) | 0 (0–1.1) | 0 (0–0) | 0 (0–0) | 0 (0–0) | 0 (0–0) |
| J01EB Short-acting sulfonamides | 0 (0–0) | 0 (0–0) | 0 (0–0) | 0 (0–0) | 0 (0–0) | 0 (0–0) | 0 (0–0) | 0 (0–0) |
| J01EC Intermediate-acting sulfonamides | 0 (0–0) | 0 (0–0) | 0 (0–0) | 0 (0–0) | 0 (0–0) | 0 (0–0) | 0 (0–0) | 0 (0–0) |
| J01ED Long-acting sulfonamides | 0 (0–0) | 0 (0–0) | 0 (0–0) | 0 (0–0) | 0 (0–0) | 0 (0–0) | 0 (0–0) | 0 (0–0) |
| J01EE Combinations of sulfonamides and trimethoprim, including derivatives | 4.1 (0–18.5) | 4.74 (0–21.3) | 3.8 (0–22.5) | 2.9 (0–18.7) | 0 (0–3.1) | 0 (0–3.4) | 0 (0–4.5) | 0 (0–4.0) |
| J01FA Macrolides | 52.0 (20.4–108.0) | 47.4 (18.9–97.1) | 37.9 (10.3–97.9) | 36.0 (8.7–92.9) | 46.3 (16.1–115.0) | 39.7 (13.3–100.3) | 27.3 (5.7–66.6) | 23.1 (4.8–56.4) |
| J01FF Lincosamides | 0 (0–0) | 0 (0–0) | 0 (0–0) | 0 (0–0) | 0 (0–0) | 0 (0–0) | 0 (0–0) | 0 (0–0) |
| J01MA Quinolones | 57.1 (27.3–96.4) | 51.5 (23.9–91.2) | 45.6 (18.3–82.8) | 41.5 (17.4–73.2) | 51.0 (18.2–111.7) | 45.2 (16.0–104.8) | 32.9 (10.6–74.7) | 31.5 (9.5–65.0) |
| J01MB Other quinolones | 0 (0–0) | 0 (0–0) | 0 (0–0) | 0 (0–0) | 0 (0–0) | 0 (0–0) | 0 (0–0) | 0 (0–0) |
| J01XX Other antibacterials | 0 (0–1.6) | 0 (0–2.0) | 0 (0–1.0) | 0 (0–1.5) | 0 (0–1.9) | 0 (0–2.5) | 0 (0–0.7) | 0 (0–1.3) |
References
- Ministry of Health, Labor and Welfare. Manual of Antimicrobial Stewardship (1st Edition). Available online: https://www.mhlw.go.jp/file/06-Seisakujouhou-10900000-Kenkoukyoku/0000193504.pdf (accessed on 16 April 2022).
- Bell, B.G.; Schellevis, F.; Stobberingh, E.; Goossens, H.; Pringle, M. A systematic review and meta-analysis of the effects of antibiotic consumption on antibiotic resistance. BMC Infect. Dis. 2014, 14, 13. [Google Scholar] [CrossRef] [Green Version]
- World Health Organization. Global Action Plan on Antimicrobial Resistance. Available online: https://www.who.int/publications/i/item/9789241509763 (accessed on 16 April 2022).
- Ministry of Health, Labor and Welfare. National Action Plan on Antimicrobial Resistance (AMR) (2016–2020). Available online: https://www.mhlw.go.jp/file/06-Seisakujouhou-10900000-Kenkoukyoku/0000138942.pdf (accessed on 16 April 2022).
- Muraki, Y.; Yagi, T.; Tsuji, Y.; Nishimura, N.; Tanabe, M.; Niwa, T.; Watanabe, T.; Fujimoto, S.; Takayama, K.; Murakami, N.; et al. Japanese antimicrobial consumption surveillance: First report on oral and parenteral antimicrobial consumption in Japan (2009–2013). J. Glob. Antimicrob. Resist. 2016, 7, 19–23. [Google Scholar] [CrossRef]
- Kusama, Y.; Tsuzuki, S.; Muraki, Y.; Koizumi, R.; Ishikane, M.; Ohmagari, N. The effects of Japan’s National Action Plan on Antimicrobial Resistance on antimicrobial use. Int. J. Infect. Dis. 2021, 103, 154–156. [Google Scholar] [CrossRef]
- National Center for Global Health and Medicine, AMR Clinical Reference Center. Surveillance of Antibiotic Sales in Japan. Available online: https://amrcrc.ncgm.go.jp/surveillance/020/file/Sales_2013-2021_Eng_2.pdf (accessed on 8 May 2022).
- Yamasaki, D.; Tanabe, M.; Muraki, Y.; Kato, G.; Ohmagari, N.; Yagi, T. The first report of Japanese antimicrobial use measured by national database based on health insurance claims data (2011–2013): Comparison with sales data, and trend analysis stratified by antimicrobial category and age group. Infection 2018, 46, 207–214. [Google Scholar] [CrossRef] [Green Version]
- Ministry of Health, Labour and Welfare. An Outline of the Japanese Medical System. Available online: https://www.mhlw.go.jp/bunya/iryouhoken/iryouhoken01/dl/01_eng.pdf (accessed on 8 May 2022).
- Japan Pharmaceutical Association. Annual Report of JPA 2020–2021. Available online: https://www.nichiyaku.or.jp/assets/uploads/about/anuual_report2020j.pdf (accessed on 8 May 2022).
- Holstiege, J.; Schulz, M.; Akmatov, M.K.; Kern, W.V.; Steffen, A.; Bätzing, J. The decline in outpatient antibiotic use. Dtsch. Arztebl. Int. 2020, 117, 679–686. [Google Scholar] [CrossRef]
- Hek, K.; Ramerman, L.; Weesie, Y.M.; Lambooij, A.C.; Lambert, M.; Heins, M.J.; Hendriksen, J.M.T.; Verheij, R.A.; Cals, J.W.L.; van Dijk, L. Antibiotic Prescribing in Dutch Daytime and Out-of-Hours General Practice during the COVID-19 Pandemic: A Retrospective Database Study. Antibiotics 2022, 11, 309. [Google Scholar] [CrossRef]
- Colliers, A.; De Man, J.; Adriaenssens, N.; Verhoeven, V.; Anthierens, S.; De Loof, H.; Philips, H.; Coenen, S.; Morreel, S. Antibiotic Prescribing Trends in Belgian Out-of-Hours Primary Care during the COVID-19 Pandemic: Observational Study Using Routinely Collected Health Data. Antibiotics 2021, 10, 1488. [Google Scholar] [CrossRef]
- Kamara, I.F.; Kumar, A.M.V.; Maruta, A.; Fofanah, B.D.; Njuguna, C.K.; Shongwe, S.; Moses, F.; Tengbe, S.M.; Kanu, J.S.; Lakoh, S.; et al. Antibiotic Use in Suspected and Confirmed COVID-19 Patients Admitted to Health Facilities in Sierra Leone in 2020–2021: Practice Does Not Follow Policy. Int. J. Environ. Res. Public Health 2022, 19, 4005. [Google Scholar] [CrossRef]
- Rachina, S.; Kozlov, R.; Kurkova, A.; Portnyagina, U.; Palyutin, S.; Khokhlov, A.; Reshetko, O.; Zhuravleva, M.; Palagin, I.; on behalf of Russian Working Group of the Project. Antimicrobial Dispensing Practice in Community Pharmacies in Russia during the COVID-19 Pandemic. Antibiotics 2022, 11, 586. [Google Scholar] [CrossRef]
- National Center for Global Health and Medicine, AMR Clinical Reference Center. Japan-Surveillance for Infection Prevention and Healthcare Epidemiology, Annual Report 2020. Available online: https://j-siphe.ncgm.go.jp/files/JSIPHE_AnnualReport_2020en.pdf (accessed on 8 May 2022).
- Barlam, T.F.; Cosgrove, S.E.; Abbo, L.M.; MacDougall, C.; Schuetz, A.N.; Septimus, E.J.; Srinivasan, A.; Dellit, T.H.; Falck-Ytter, Y.T.; Fishman, N.O.; et al. Implementing an antibiotic stewardship program: Guidelines by the Infectious Diseases Society of America and the Society for Healthcare Epidemiology of America. Clin. Infect. Dis. 2016, 62, e51–e77. [Google Scholar] [CrossRef]
- Mita, Y.; Inose, R.; Goto, R.; Kusama, Y.; Koizumi, R.; Yamasaki, D.; Ishikane, M.; Tanabe, M.; Ohmagari, N.; Muraki, Y. An alternative index for evaluating AMU and anti-methicillin-resistant Staphylococcus aureus agent use: A study based on the National Database of Health Insurance Claims and Specific Health Checkups data of Japan. J. Infect. Chemother. 2021, 27, 972–976. [Google Scholar] [CrossRef] [PubMed]
- Koizumi, R.; Kusama, Y.; Muraki, Y.; Ishikane, M.; Yamasaki, D.; Tanabe, M.; Ohmagari, N. Effect of population inflow and outflow between rural and urban areas on regional antimicrobial use surveillance. PLoS ONE 2021, 16, e0248338. [Google Scholar] [CrossRef] [PubMed]
- World Health Organization. Anatomical Therapeutic Chemical (ATC) Classification. Available online: https://www.who.int/tools/atc-ddd-toolkit/atc-classification (accessed on 16 April 2022).
- WHO Collaborating Center for Drug Statistics Methodology. ATC/DDD Index 2022. Available online: https://www.whocc.no/atc_ddd_index/ (accessed on 16 April 2022).
- Boeijen, J.A.; van der Velden, A.W.; Hullegie, S.; Platteel, T.N.; Zwart, D.L.M.; Damoiseaux, R.A.M.J.; Venekamp, R.P.; van de Pol, A.C. Common Infections and Antibiotic Prescribing during the First Year of the COVID-19 Pandemic: A Primary Care-Based Observational Cohort Study. Antibiotics 2021, 10, 1521. [Google Scholar] [CrossRef] [PubMed]
- Barbieri, E.; Liberati, C.; Cantarutti, A.; Di Chiara, C.; Lupattelli, A.; Sharland, M.; Giaquinto, C.; Hsia, Y.; Doná, D. Antibiotic Prescription Patterns in the Paediatric Primary Care Setting before and after the COVID-19 Pandemic in Italy: An Analysis Using the AWaRe Metrics. Antibiotics 2022, 11, 457. [Google Scholar] [CrossRef]
- Zayet, S.; Klopfenstein, T. Antibiotics and Therapeutic Agent Prescription in COVID-19 Management. Antibiotics 2022, 11, 423. [Google Scholar] [CrossRef]
- Chitungo, I.; Dzinamarira, T.; Nyazika, T.K.; Herrera, H.; Musuka, G.; Murewanhema, G. Inappropriate Antibiotic Use in Zimbabwe in the COVID-19 Era: A Perfect Recipe for Antimicrobial Resistance. Antibiotics 2022, 11, 244. [Google Scholar] [CrossRef]
- Ministry of Health, Labor and Welfare. Pharmacy Vision for Patients, Overview. Available online: https://www.mhlw.go.jp/file/05-Shingikai-11121000-Iyakushokuhinkyoku-Soumuka/0000153586.pdf (accessed on 16 April 2022).
- Hashimoto, H.; Matsui, H.; Sasabuchi, Y.; Yasunaga, H.; Kotani, K.; Nagai, R.; Hatakeyama, S. Antibiotic prescription among outpatients in a prefecture of Japan, 2012–2013: A retrospective claims database study. BMJ Open 2019, 9, e026251. [Google Scholar] [CrossRef] [Green Version]
- Amaha, N.D.; Weldemariam, D.G.; Abdu, N.; Tesfamariam, E.H. Prescribing practices using WHO prescribing indicators and factors associated with antibiotic prescribing in six community pharmacies in Asmara, Eritrea: A cross-sectional study. Antimicrob. Resist. Infect. Control 2019, 8, 163. [Google Scholar] [CrossRef]
- Ono, A.; Ishikane, M.; Kusama, Y.; Tanaka, C.; Ono, S.; Tsuzuki, S.; Muraki, Y.; Yamasaki, D.; Tanabe, M.; Ohmagari, N. The first national survey of antimicrobial use among dentists in Japan from 2015 to 2017 based on the national database of health insurance claims and specific health checkups of Japan. PLoS ONE 2020, 15, e0244521. [Google Scholar] [CrossRef]
- Head, K.; Chong, L.Y.; Piromchai, P.; Hopkins, C.; Philpott, C.; Schilder, A.G.; Burton, M.J. Systemic and topical antibiotics for chronic rhinosinusitis. Cochrane Database Syst. Rev. 2016, 4, CD011994. [Google Scholar] [CrossRef] [Green Version]
- Mittal, R.; Lisi, C.V.; Gerring, R.; Mittal, J.; Mathee, K.; Narasimhan, G.; Azad, R.K.; Yao, Q.; Grati, M.; Yan, D.; et al. Current concepts in the pathogenesis and treatment of chronic suppurative otitis media. J. Med. Microbiol. 2015, 64, 1103–1116. [Google Scholar] [CrossRef] [PubMed]
- Barlam, T.F.; Soria-Saucedo, R.; Cabral, H.J.; Kazis, L.E. Unnecessary antibiotics for acute respiratory tract infections: Association with care setting and patient demographics. Open Forum Infect. Dis. 2016, 23, ofw045. [Google Scholar] [CrossRef] [PubMed] [Green Version]
- The Japanese Association for Infectious Diseases/Japanese Society of Chemotherapy. The JAID/JSC Guide to Clinical Management of Infectious Diseases 2019, 1st ed.; Life Science Publishing Co., Ltd.: Tokyo, Japan, 2019; pp. 58–75. (In Japanese) [Google Scholar]
- Armstrong, A.W.; Hekmatjah, J.; Kircik, L.H. Oral tetracyclines and acne: A systematic review for dermatologists. J. Drugs Dermatol. 2020, 19, s6–s13. [Google Scholar] [PubMed]
- Jin, X.X.; Wang, X.; Shan, Y.; Li, S.Z.; Xu, Q.; Jin, H.Z.; Zuo, Y.G. Efficacy and safety of tetracyclines for pemphigoid: A systematic review and meta-analysis. Arch. Dermatol. Res. 2022, 314, 191–201. [Google Scholar] [CrossRef]
- Shah, R.A.; Hsu, J.I.; Patel, R.R.; Mui, U.N.; Tyring, S.K. Antibiotic resistance in dermatology: The scope of the problem and strategies to address it. J. Am. Acad. Dermatol. 2021, 86, 1337–1345. [Google Scholar] [CrossRef]
- Limper, A.H.; Knox, K.S.; Sarosi, G.A.; Ampel, N.M.; Bennett, J.E.; Catanzaro, A.; Davies, S.F.; Dismukes, W.E.; Hage, C.A.; Marr, K.A.; et al. An official American Thoracic Society statement: Treatment of fungal infections in adult pulmonary and critical care patients. Am. J. Respir. Crit. Care Med. 2011, 183, 96–128. [Google Scholar] [CrossRef] [Green Version]
- Itoh, N.; Akazawa, N.; Kanawaku, E.; Murakami, H.; Ishibana, Y.; Kawamura, D.; Kawabata, T.; Mori, K.; Komada, E.N.; Ohmagari, N. Effects of infectious disease consultation and antimicrobial stewardship program at a Japanese cancer center: An interrupted time-series analysis. PLoS ONE 2022, 17, e0263095. [Google Scholar] [CrossRef]
- Kagami, K.; Ishiguro, N.; Yamada, T.; Niinuma, Y.; Iwasaki, S.; Taki, K.; Fukumoto, T.; Hayasaka, K.; Nishida, M.; Sugita, J.; et al. Clinical outcomes of intervention for carbapenems and anti-methicillin-resistant Staphylococcus aureus antibiotics by an antimicrobial stewardship team. Am. J. Infect. Control 2021, 49, 1493–1498. [Google Scholar] [CrossRef]
- Maeda, M.; Muraki, Y.; Kosaka, T.; Yamada, T.; Aoki, Y.; Kaku, M.; Seki, M.; Tanabe, Y.; Fujita, N.; Niki, Y.; et al. Impact of health policy on structural requisites for antimicrobial stewardship: A nationwide survey conducted in Japanese hospitals after enforcing the revised reimbursement system for antimicrobial stewardship programs. J. Infect. Chemother. 2021, 27, 1–6. [Google Scholar] [CrossRef]
- Gu, Y.; Fujitomo, Y.; Soeda, H.; Nakahama, C.; Hasegawa, N.; Maesaki, S.; Maeda, M.; Matsumoto, T.; Miyairi, I.; Ohmagari, N. A nationwide questionnaire survey of clinic doctors on antimicrobial stewardship in Japan. J. Infect. Chemother. 2020, 26, 149–156. [Google Scholar] [CrossRef] [Green Version]
- Morioka, S.; Gu, Y.; Tsuzuki, S.; Fujitomo, Y.; Soeda, H.; Nakahama, C.; Hasegawa, N.; Maesaki, S.; Maeda, M.; Matsumoto, T.; et al. Determinants of clinic doctors’ attitudes concerning antimicrobial prescription for patients with common colds or bronchitis: Additional analysis of a nationwide survey conducted by the Japanese Society of Chemotherapy and the Japanese Association for Infectious Diseases. J. Infect. Chemother. 2021, 27, 131–138. [Google Scholar] [PubMed]
- Kono, M.; Sugita, G.; Itahashi, K.; Sasagawa, Y.; Iwama, Y.; Hiraoka, S.; Ohtani, M.; Hotomi, M. Improvement in the appropriate antimicrobial usage for treating pediatric acute otitis media in Japan: A descriptive study using nation-wide electronic medical record data. J. Infect. Chemother. 2021, 27, 1413–1422. [Google Scholar] [CrossRef] [PubMed]
- Kinoshita, N.; Komura, M.; Tsuzuki, S.; Shoji, K.; Miyairi, I. The effect of preauthorization and prospective audit and feedback system on oral antimicrobial prescription for outpatients at a children’s hospital in Japan. J. Infect. Chemother. 2020, 26, 582–587. [Google Scholar] [CrossRef] [PubMed]
- Okubo, Y.; Nishi, A.; Michels, K.B.; Nariai, H.; Kim-Farley, R.J.; Arah, O.A.; Uda, K.; Kinoshita, N.; Miyairi, I. The consequence of financial incentives for not prescribing antibiotics: A Japan’s nationwide quasi-experiment. Int. J. Epidemiol. 2022, 30, dyac057. [Google Scholar] [CrossRef] [PubMed]
- Muraki, Y.; Kusama, Y.; Tanabe, M.; Hayakawa, K.; Gu, Y.; Ishikane, M.; Yamasaki, D.; Yagi, T.; Ohmagari, N. Impact of antimicrobial stewardship fee on prescribing for Japanese pediatric patients with upper respiratory infections. BMC Health Serv. Res. 2020, 20, 399. [Google Scholar] [CrossRef]


| January 2019 | June 2019 | January 2021 | June 2021 | p | |
|---|---|---|---|---|---|
| Number of monthly prescriptions received per pharmacy per month * | 1324.5 | 1206.5 | 1018.0 | 1152.0 | <0.001 |
| (880.0, 1902.0) | (812.0, 1790.8) | (689.3, 1515.0) | (780.0, 1710.0) | ||
| Number of medical facilities/departments from which the prescriptions were received, per pharmacy per month * | 39 | 40 | 39 | 42 | <0.001 |
| (25, 61) | (25, 63) | (26, 63) | (28, 67) | ||
| The concentration rate, % * | 85.0 | 83.6 | 81.3 | 81.7 | <0.001 |
| (61.1, 93.4) | (59.2, 92.7) | (57.0, 91.7) | (56.2, 92.0) | ||
| Source of the prescription, n | >0.999 | ||||
| General hospital | 432 | 437 | 450 | 453 | |
| Internist hospital | 90 | 90 | 92 | 91 | |
| Surgeon hospital | 20 | 20 | 20 | 19 | |
| Other hospital | 55 | 58 | 57 | 57 | |
| Internal medicine | 992 | 979 | 1016 | 1011 | |
| Pediatrics | 153 | 151 | 143 | 152 | |
| Psychiatry | 83 | 86 | 95 | 90 | |
| Surgery | 31 | 32 | 32 | 32 | |
| Orthopedic surgery | 123 | 131 | 136 | 134 | |
| Obstetrics and gynecology | 10 | 11 | 9 | 10 | |
| Ophthalmology | 86 | 91 | 92 | 94 | |
| Otorhinolaryngology | 168 | 169 | 169 | 169 | |
| Dermatology | 149 | 158 | 167 | 170 | |
| Other clinic | 125 | 130 | 133 | 138 |
| Factors | January 2019 (Winter) | June 2019 (Summer) | January 2021 (Winter) | June 2021 (Summer) | ||||||||||||
|---|---|---|---|---|---|---|---|---|---|---|---|---|---|---|---|---|
| β | 95%CI | p | β | 95%CI | p | β | 95%CI | p | β | 95%CI | p | |||||
| Constant term | 12.6 | −117.5 | 142.7 | 0.849 | 27.6 | −65.7 | 121.0 | 0.562 | 31.8 | −1.7 | 65.3 | 0.063 | 26.3 | −21.3 | 74.0 | 0.279 |
| Over 70% of prescriptions received from a specific medical institution | 15.6 | −24.4 | 55.5 | 0.445 | 3.9 | −25.0 | 32.7 | 0.792 | 4.0 | −6.2 | 14.1 | 0.445 | −1.1 | −15.6 | 13.5 | 0.887 |
| Number of prescriptions received (increments of 1000) | −0.1 | −17.6 | 17.4 | 0.991 | −2.2 | −15.2 | 10.8 | 0.739 | 1.4 | −4.0 | 6.8 | 0.617 | 2.2 | −4.9 | 9.2 | 0.544 |
| Number of medical institutions from which prescriptions were received (increments of 50) | −2.1 | −20.3 | 16.1 | 0.821 | −0.5 | −14.8 | 13.9 | 0.951 | 1.5 | −3.8 | 6.8 | 0.582 | −0.9 | −8.0 | 6.2 | 0.805 |
| Pharmacy that prescriptions were received mainly from a clinic | 23.2 | −39.9 | 86.2 | 0.472 | 15.7 | −29.7 | 61.1 | 0.497 | 1.3 | −15.1 | 17.6 | 0.881 | 4.5 | −18.8 | 27.8 | 0.704 |
| Most common source of the prescriptions | ||||||||||||||||
| General hospital | −1.0 | −75.7 | 73.8 | 0.980 | −7.5 | −61.4 | 46.4 | 0.785 | −12.2 | −31.6 | 7.2 | 0.217 | −6.4 | −34.1 | 21.3 | 0.650 |
| Internal medicine hospital | −1.0 | −97.3 | 95.4 | 0.984 | −3.9 | −73.8 | 65.9 | 0.912 | −2.4 | −27.3 | 22.5 | 0.850 | 1.6 | −34.3 | 37.5 | 0.931 |
| Surgery hospital | −15.4 | −213.5 | 182.7 | 0.879 | −20.1 | −163.5 | 123.3 | 0.783 | −6.9 | −58.8 | 44.9 | 0.793 | −4.9 | −80.9 | 71.1 | 0.899 |
| Other hospitals | 5.5 | −126.6 | 137.7 | 0.934 | 2.1 | −91.5 | 95.7 | 0.965 | −4.6 | −38.7 | 29.5 | 0.791 | −0.2 | −48.8 | 48.3 | 0.992 |
| Pediatrics | 149.2 | 73.2 | 225.2 | <0.001 | 126.4 | 70.8 | 182.0 | <0.001 | 60.8 | 40.3 | 81.2 | <0.001 | 76.9 | 48.5 | 105.4 | <0.001 |
| Psychiatry | −33.4 | −135.7 | 68.9 | 0.522 | −31.0 | −103.7 | 41.8 | 0.404 | −21.3 | −46.3 | 3.8 | 0.096 | −18.8 | −55.6 | 17.9 | 0.315 |
| Surgery | −26.3 | −186.3 | 133.7 | 0.747 | −7.2 | −121.2 | 106.8 | 0.901 | 1.8 | −39.4 | 43.0 | 0.933 | 13.0 | −46.0 | 72.1 | 0.665 |
| Orthopedic surgery | −25.7 | −109.3 | 57.9 | 0.546 | −24.6 | −83.5 | 34.3 | 0.413 | −13.4 | −34.3 | 7.5 | 0.209 | −11.9 | −42.0 | 18.3 | 0.440 |
| Obstetrics and gynecology | 70.2 | −205.2 | 345.6 | 0.617 | 71.8 | −118.6 | 262.2 | 0.460 | 61.9 | −13.9 | 137.6 | 0.109 | 121.1 | 17.7 | 224.5 | 0.022 |
| Ophthalmology | −10.9 | −108.3 | 86.6 | 0.827 | −9.3 | −78.4 | 59.7 | 0.791 | 4.2 | −20.6 | 28.9 | 0.741 | 6.8 | −28.4 | 42.0 | 0.706 |
| Otorhinolaryngology | 126.5 | 53.0 | 199.9 | 0.001 | 105.4 | 52.2 | 158.6 | <0.001 | 63.6 | 44.5 | 82.7 | <0.001 | 83.8 | 56.4 | 111.2 | <0.001 |
| Dermatology | 28.2 | −49.3 | 105.7 | 0.476 | 68.2 | 12.7 | 123.7 | 0.016 | 33.9 | 14.5 | 53.3 | 0.001 | 34.4 | 6.5 | 62.3 | 0.016 |
| Other clinics | 9.3 | −73.6 | 92.2 | 0.826 | 4.7 | −54.4 | 63.8 | 0.875 | 8.8 | −12.3 | 29.9 | 0.413 | 19.1 | −10.7 | 48.8 | 0.209 |
| Factors | January 2019 (Winter) | June 2019 (Summer) | January 2021 (Winter) | June 2021 (Summer) | ||||||||||||
|---|---|---|---|---|---|---|---|---|---|---|---|---|---|---|---|---|
| β | 95%CI | p | β | 95%CI | p | β | 95%CI | p | β | 95%CI | p | |||||
| Constant term | 198.8 | −125.6 | 523.2 | 0.230 | 158.5 | −7.7 | 324.6 | 0.062 | 100.7 | 39.9 | 161.6 | 0.001 | 110.2 | −79.2 | 299.7 | 0.254 |
| Over 70% of prescriptions received from a specific medical institution | 67.0 | −32.6 | 166.7 | 0.187 | 17.5 | −33.8 | 68.8 | 0.503 | 21.0 | 2.5 | 39.5 | 0.026 | −27.5 | −85.3 | 30.3 | 0.351 |
| Number of prescriptions received (increments of 1000) | −0.2 | −43.7 | 43.4 | 0.993 | 9.1 | −14.0 | 32.2 | 0.439 | 11.8 | 2.0 | 21.7 | 0.018 | 12.9 | −15.2 | 40.9 | 0.369 |
| Number of medical institutions from which prescriptions were received (increments of 50) | −8.6 | −53.9 | 36.7 | 0.710 | −5.2 | −30.8 | 20.4 | 0.691 | 0.7 | −9.0 | 10.3 | 0.892 | −16.9 | −45.1 | 11.3 | 0.239 |
| Pharmacy that prescriptions were received mainly from a clinic | −42.7 | −200.0 | 114.6 | 0.594 | −23.6 | −104.4 | 57.1 | 0.566 | −26.2 | −55.9 | 3.6 | 0.085 | −15.0 | −107.8 | 77.7 | 0.751 |
| Most common source of the prescriptions | ||||||||||||||||
| General hospital | −108.4 | −294.8 | 77.9 | 0.254 | −84.8 | −180.8 | 11.2 | 0.083 | −34.1 | −69.3 | 1.1 | 0.058 | −11.9 | −122.0 | 98.1 | 0.832 |
| Internal medicine hospital | −64.9 | −305.2 | 175.4 | 0.596 | −34.6 | −158.9 | 89.7 | 0.585 | −15.0 | −60.3 | 30.2 | 0.515 | −14.7 | −157.3 | 128.0 | 0.840 |
| Surgery hospital | −893.3 | −577.3 | 410.7 | 0.741 | −78.9 | −334.0 | 176.2 | 0.544 | −26.9 | −121.0 | 67.2 | 0.575 | −22.2 | −324.3 | 279.9 | 0.885 |
| Other hospitals | −135.6 | −465.1 | 193.9 | 0.420 | −92.8 | −259.3 | 73.8 | 0.275 | −36.3 | −98.2 | 25.5 | 0.249 | −25.3 | −218.3 | 167.8 | 0.798 |
| Pediatrics | −101.5 | −291.0 | 88.0 | 0.294 | −85.0 | −183.9 | 13.9 | 0.092 | −33.1 | −70.1 | 4.0 | 0.080 | −29.0 | −142.2 | 84.2 | 0.616 |
| Psychiatry | −123.2 | −378.3 | 131.9 | 0.344 | −100.5 | −230.0 | 28.9 | 0.128 | −53.9 | −99.3 | −8.5 | 0.020 | −46.2 | −192.3 | 100.0 | 0.536 |
| Surgery | −93.9 | −492.9 | 305.1 | 0.644 | −54.9 | −257.7 | 147.9 | 0.596 | −13.5 | −88.3 | 61.3 | 0.723 | −20.8 | −255.5 | 213.8 | 0.862 |
| Orthopedic surgery | −117.8 | −326.3 | 90.8 | 0.268 | −101.7 | −206.5 | 3.1 | 0.057 | −49.8 | −87.7 | −11.9 | 0.010 | −41.8 | −161.5 | 77.9 | 0.494 |
| Obstetrics and gynecology | −78.8 | −765.6 | 608.0 | 0.822 | −65.5 | −404.2 | 273.3 | 0.705 | −45.1 | −182.6 | 92.5 | 0.520 | −3.0 | −414.0 | 408.0 | 0.989 |
| Ophthalmology | −94.4 | −337.3 | 148.5 | 0.446 | −89.2 | −212.0 | 33.7 | 0.155 | −32.5 | −77.5 | 12.4 | 0.156 | −37.9 | −177.8 | 102.0 | 0.595 |
| Otorhinolaryngology | 286.1 | 103.0 | 469.2 | 0.002 | 147.3 | 52.7 | 241.9 | 0.002 | 112.5 | 77.8 | 147.1 | <0.001 | 293.8 | 185.0 | 402.6 | <0.001 |
| Dermatology | −97.4 | −290.7 | 95.8 | 0.323 | −76.7 | −175.4 | 22.1 | 0.128 | −36.7 | −72.0 | −1.4 | 0.042 | −40.5 | −151.6 | 70.5 | 0.474 |
| Other clinics | −50.4 | −257.1 | 156.2 | 0.632 | −31.4 | −136.6 | 73.8 | 0.558 | −4.5 | −42.7 | 33.8 | 0.820 | 12.6 | −105.6 | 130.7 | 0.835 |
| Factors | January 2019 (Winter) | June 2019 (Summer) | January 2021 (Winter) | June 2021 (Summer) | ||||||||||||
|---|---|---|---|---|---|---|---|---|---|---|---|---|---|---|---|---|
| β | 95%CI | p | β | 95%CI | p | β | 95%CI | p | β | 95%CI | p | |||||
| Constant term | 103.1 | −93.0 | 299.3 | 0.302 | 120.6 | 21.4 | 219.8 | 0.017 | 90.9 | 38.3 | 143.5 | 0.001 | 76.4 | 27.7 | 125.1 | 0.002 |
| Over 70% of prescriptions received from a specific medical institution | 27.1 | −33.1 | 87.4 | 0.377 | 6.3 | −24.3 | 37.0 | 0.685 | 3.5 | −12.5 | 19.5 | 0.668 | 1.6 | −13.3 | 16.4 | 0.838 |
| Number of prescriptions received (increments of 1000) | 4.1 | −22.2 | 30.4 | 0.760 | 6.3 | −7.5 | 20.1 | 0.372 | 9.0 | 0.5 | 17.5 | 0.039 | 5.6 | −1.6 | 12.8 | 0.126 |
| Number of medical institutions from which prescriptions were received (increments of 50) | −8.0 | −35.4 | 19.4 | 0.565 | −6.2 | −21.5 | 9.1 | 0.426 | −3.9 | −12.3 | 4.4 | 0.356 | −4.3 | −11.6 | 2.9 | 0.240 |
| Pharmacy that prescriptions were received mainly from a clinic | 2.2 | −92.9 | 97.3 | 0.964 | −15.9 | −64.2 | 32.3 | 0.517 | −19.6 | −45.3 | 6.1 | 0.135 | −17.2 | −41.0 | 6.7 | 0.159 |
| Most common source of the prescriptions | ||||||||||||||||
| General hospital | 20.0 | −92.7 | 132.6 | 0.728 | −2.6 | −59.9 | 54.7 | 0.929 | 33.1 | 2.6 | 63.6 | 0.033 | 43.7 | 15.4 | 72.0 | 0.002 |
| Internal medicine hospital | −11.8 | −157.0 | 133.5 | 0.874 | 0.1 | −74.1 | 74.3 | 0.997 | 6.3 | −32.8 | 45.4 | 0.753 | 25.4 | −11.3 | 62.1 | 0.175 |
| Surgery hospital | −66.4 | −365.0 | 232.3 | 0.663 | −46.7 | −199.0 | 105.7 | 0.548 | −27.9 | −109.3 | 53.4 | 0.501 | −15.0 | −92.7 | 62.6 | 0.704 |
| Other hospitals | −61.6 | −260.8 | 137.6 | 0.544 | −52.8 | −152.2 | 46.7 | 0.298 | −28.2 | −81.6 | 25.3 | 0.302 | −14.1 | −63.7 | 35.6 | 0.578 |
| Pediatrics | −47.3 | −161.9 | 67.3 | 0.418 | −19.0 | −78.1 | 40.1 | 0.529 | −1.1 | −33.1 | 31.0 | 0.948 | 1.8 | −27.3 | 30.9 | 0.904 |
| Psychiatry | −77.9 | −232.1 | 76.3 | 0.322 | −56.2 | −133.5 | 21.1 | 0.154 | −29.7 | −69.0 | 9.5 | 0.138 | −20.3 | −57.9 | 17.3 | 0.290 |
| Surgery | −69.7 | −310.9 | 171.4 | 0.571 | −56.7 | −177.8 | 64.4 | 0.359 | −33.3 | −97.9 | 31.4 | 0.313 | −22.2 | −82.6 | 38.1 | 0.470 |
| Orthopedic surgery | −89.0 | −215.1 | 37.0 | 0.166 | −74.2 | −136.8 | −11.6 | 0.020 | −40.3 | −73.0 | −7.5 | 0.016 | −28.8 | −59.5 | 2.0 | 0.067 |
| Obstetrics and gynecology | −11.7 | −426.8 | 403.5 | 0.956 | −12.8 | −215.0 | 189.5 | 0.902 | −6.7 | −125.6 | 112.2 | 0.912 | 5.7 | −100.0 | 111.4 | 0.916 |
| Ophthalmology | −74.1 | −220.9 | 72.7 | 0.322 | −61.9 | −135.3 | 11.5 | 0.098 | −20.8 | −59.6 | 18.1 | 0.294 | −19.1 | −55.1 | 16.8 | 0.297 |
| Otorhinolaryngology | 183.5 | 72.9 | 294.2 | 0.001 | 177.1 | 120.6 | 233.6 | <0.001 | 119.8 | 89.8 | 149.7 | <0.001 | 153.4 | 125.4 | 181.4 | <0.001 |
| Dermatology | −7.5 | −124.3 | 109.4 | 0.900 | 12.1 | −46.9 | 71.1 | 0.687 | 30.8 | 0.3 | 61.3 | 0.048 | 28.7 | 0.1 | 57.2 | 0.049 |
| Other clinics | −47.5 | −172.4 | 77.4 | 0.456 | −35.6 | −98.4 | 27.2 | 0.266 | −6.3 | −39.4 | 26.8 | 0.707 | 3.0 | −27.4 | 33.4 | 0.846 |
Publisher’s Note: MDPI stays neutral with regard to jurisdictional claims in published maps and institutional affiliations. |
© 2022 by the authors. Licensee MDPI, Basel, Switzerland. This article is an open access article distributed under the terms and conditions of the Creative Commons Attribution (CC BY) license (https://creativecommons.org/licenses/by/4.0/).
Share and Cite
Muraki, Y.; Maeda, M.; Inose, R.; Yoshimura, K.; Onizuka, N.; Takahashi, M.; Kawakami, E.; Shikamura, Y.; Son, N.; Iwashita, M.; et al. Exploration of Trends in Antimicrobial Use and Their Determinants Based on Dispensing Information Collected from Pharmacies throughout Japan: A First Report. Antibiotics 2022, 11, 682. https://0-doi-org.brum.beds.ac.uk/10.3390/antibiotics11050682
Muraki Y, Maeda M, Inose R, Yoshimura K, Onizuka N, Takahashi M, Kawakami E, Shikamura Y, Son N, Iwashita M, et al. Exploration of Trends in Antimicrobial Use and Their Determinants Based on Dispensing Information Collected from Pharmacies throughout Japan: A First Report. Antibiotics. 2022; 11(5):682. https://0-doi-org.brum.beds.ac.uk/10.3390/antibiotics11050682
Chicago/Turabian StyleMuraki, Yuichi, Masayuki Maeda, Ryo Inose, Koki Yoshimura, Naoki Onizuka, Masao Takahashi, Eiji Kawakami, Yoshiaki Shikamura, Naotaka Son, Makoto Iwashita, and et al. 2022. "Exploration of Trends in Antimicrobial Use and Their Determinants Based on Dispensing Information Collected from Pharmacies throughout Japan: A First Report" Antibiotics 11, no. 5: 682. https://0-doi-org.brum.beds.ac.uk/10.3390/antibiotics11050682