Tribological Behavior of Ni-Based Coatings Deposited via Spray and Fuse Technique

1
Research Group in Energy and Materials (REM), Faculty FIMEB, Universidad Antonio Nariño, Bogotá 110231, Colombia
2
Department of Mechanical Engineering and Mechatronics, Universidad Nacional de Colombia, Bogotá 111321, Colombia
3
Ciencia de Materiales y Superficies, Physics Department, Universidad Nacional de Colombia, Street 45, 26-85, Bogotá 111321, Colombia
*
Author to whom correspondence should be addressed.
Coatings 2020, 10(11), 1080; https://doi.org/10.3390/coatings10111080
Submission received: 22 September 2020
/
Revised: 18 October 2020
/
Accepted: 27 October 2020
/
Published: 10 November 2020
(This article belongs to the Special Issue Selection of Lubricants and Coatings for Engine Components Using Machine Learning)
Abstract
:The tribological behavior of Ni-based coatings was analyzed. The coatings were deposited on grey cast iron substrates in a spray and fuse process using Superjet Eutalloy deposition equipment, varying the oxygen flow conditions in the flame. By means of the X-ray diffraction (XRD) technique, the crystal structure of the coatings was determined. The XRD patterns show the crystalline phases with principal reflections for Ni in the planes (111) and (222). Crystalline properties such as the orientation coefficient, crystallite size, and macrostrain showed the relationship with tribological and mechanical properties such as the dry wear rate and the microhardness. The microhardness was analyzed on the surface and on cross sections of the coatings by means of a Knoop microhardness tester. The topography and the morphological characteristics of the coatings and the tribo-surfaces were exanimated using scanning electron microscopy (SEM) and confocal microscopy, while the chemical composition was measured by means of energy-dispersive X-ray spectroscopy (EDS). The tribological behavior of the coatings was examined via the scratch cohesion–adhesion test, using cross sections of the coatings. Furthermore, adhesion and abrasion wear tests were carried out, using the pin-on-disk method, under the ASTM G99 standard and the ASTM G65 standard, respectively. The wear rate of the coatings showed a strong relation to the porosity in the metal matrix, which was previously determined via electrochemical characterization techniques.
1. Introduction
Thermal spray techniques have been widely used for depositing protective coatings, because of their relatively low-cost production, versatility, and the different types of substrates that can be used [1]. The spray and fuse technique is a two-step deposition process that falls under the thermal spray techniques. This technique is an economical process for applying protective coatings with a relatively low degree of porosity (approximately 10–20%) and good adhesion [1,2,3].
Nickel-based coatings have been widely used, mainly as protection in corrosive environments. However, for applications in industries such as shipbuilding, in which corrosive–erosive effects occur, it is necessary to know the mechanical properties of the coatings and their response to erosive environments. Tribological studies are of great interest for understanding and predicting the behavior of coatings in erosive-corrosive environments so as to estimate the useful lifetime and the type of protection provided by coatings for the surface to be protected. Several authors, such as Fazel, Sugiarti, Wang, and Lee, among others, have studied the mechanical, tribological, and microstructural properties of Ni-based coatings. In their reports, these authors showed the advantages of the use of Ni coatings as a metal matrix in which some composites can be aggregated in order to increase the performance of these coatings, for example in abrasive environments [4,5,6,7].
The fusion process in the spray and fuse technique has been shown to reduce porosity to 0.3–0.5%. The porosity of the coatings has been shown to strongly influence the wear and tribological properties of the coatings deposited via thermal spray techniques. The degree of porosity depends on the deposition conditions of the coatings, such as the temperature of the torch, velocity of the particles, spray distance, and rate of feedstock. Therefore, the porosity can be controlled with the right variation of the deposition parameters and by using post-deposition thermal treatments on the coatings [1,2,3].
In the present study, Ni-based coatings were deposited by means of the spray and fuse technique onto grey cast iron substrates. The oxygen flow in the flame of the torch varied from fuel flame conditions to oxidizing flame conditions in order to analyze the effect of the deposition temperature on the wear resistance of the coatings. Two wear tests were carried out: First an adhesive wear test using a pin-on-disk tribometer, and then an abrasive wear test using an ASTM standard G65 abrasion wear test [8]. A scratch test and microhardness measurements were also carried out. The results showed that the degree of porosity exerted a strong influence on the wear resistance of the coatings.
2. Materials and Methods
Using the spray and fuse thermal spray technique, Ni-based coatings were deposited onto grey cast iron cylindrical substrates of 41 mm in diameter and 4 mm in thickness. A commercial powder called NiTec (Ni + 5% Fe, B, Si) was used as filler material. In the deposition process of the coatings, the grey cast iron substrate was preheated to a temperature of between 500 and 600 °C, and then the filler material was sprayed onto the substrate. Subsequently, this material was melted onto the substrate, thereby forming the coating. The preheating is carried out so that the filler material is adsorbed on the surface of the substrate before being melted on it, a surface that has not been preheated does not guarantee the formation of a uniform coating, likewise an excess of heating of the substrate can cause deterioration of the substrate itself. The deposition conditions are summarized in Table 1.
The flow of combustion gases is particularly relevant because this parameter defines the molar relationship between oxygen and fuel gas, and consequently the temperature and type of flame (fuel-neutral-oxidant) with which the deposit process is carried out. The gas mixture combusts at the edge of the tank system nozzle, which is the same drift channel through which the particles that make up the filler material are injected into the flame, the heat power dissipated by the flame depends on the fuel/oxidant ratio and the fuel gas feed rate, , as the limiting factor in combustion is , it can be said that heat power is proportional to the oxygen flow.
The crystal structure of the coatings was analyzed using the X-ray diffraction (XRD) technique. The XRD spectrums were obtained with Panalytical equipment (X Pert Pro, Almelo, The Netherlands) in Bragg-Brentano geometry with CuKα radiation of λ = 1.5406 Å and a step of 0.02°. To determine the components of the coatings, the X’Pert HighScore computer program was used. Using scanning electron microscopy (SEM) (FEI Quanta 200-r, Waltham, MA, USA) and confocal laser microscopy (Nikon C1 Plus ECLIPSE Ti, Tokyo, Japan), the details of the morphology and topography of the coatings were analyzed, as well as the wear tracks, in order to determine the wear mechanisms of the coatings. The chemical analysis of the surface and the wear tracks was done by means of energy-dispersive X-ray spectroscopy (EDS) using FEI Quanta 200-r equipment.
Microhardness measurements were carried out using a Knoop scale LECO microindenter, with a 300 gf load and 15 s dwell time. The scratch test was performed using a CSM Revetest Xpres scratch tester (CSM instruments, Peseux, Switzerland). with a diamond Rockwell C indenter, with loads of 5, 10, and 15 N and with a 4 min/min test speed along 3 mm of scratch distance.
The wear tests consisted of a ASTM G99-04 test [9] using a pin-on-disk CETR-UMT-2-110 tester (UMT TriboLab, Billerica, MA, USA), working at room temperature with a test time of 600 s and a load of 400 g, using a steel ball of hardness 838 HV, 10 mm in diameter at a test speed of 10 cm/s, as well as an ASTM G-65 test under the B procedure (load of 130 N and 2000 revolutions of the wheel to obtain ~1436 m of wear distance). These wear tests were carried out to analyze the response of the coatings to dry wear and wear with a lubrication medium, each one of the wear tests were carried out three times to verify the repeatability of the results.
3. Results and Discussion
3.1. Crystallographic Characterization
NiTec powder and coatings deposited at different oxygen flow conditions were structurally analyzed in a previous paper [10], where we showed that the powder is largely replicated when it is deposited on the substrate, and the peak corresponding to Ni (111) orientation showed the greatest intensity. In spray and fuse coatings, we can use the model of minimization of the elastic energy deformation to analyze the preferred orientation. This model proposes that the preferential orientation is determined by competition between two thermodynamic parameters, surface energy and deformation energy. For thin films, the crystallographic texture defines the surface energy, considering the contribution of broken bonds. However, with an increase in the thickness of the coating, the surface energy is kept constant while the deformation energy increases and depends on the elastic modulus, and then acts in the (hkl) crystallographic plane. The spatial alignment that the individual crystal exhibits in polycrystalline materials determines the preferred orientation, which can be quantified using the crystallographic orientation coefficient (Co), defined as:
where Ihkl represents the relative intensity of the peaks with orientation (hkl), I0 is the reference intensity of the powder pattern taken from the diffraction letters of the X’Pert HighScore analysis program, and n is the number of diffraction peaks analyzed. Figure 1 shows the Co variation as a function of the oxygen flow [11]. The preferential orientation of the (111) plane is related to the microhardness of the coatings.
3.2. Microhardness
The microhardness values showed a non-homogeneous distribution on the surface, mainly due to defects such as pores, un-melted particles, or micro cracks. For these reasons, the microhardness values found are below the value reported by the supplier of the flux powder for deposits of NiTec. Coatings deposited at an oxygen flow of 14.72 SCFH had the highest average microhardness value. Table 2 shows the average microhardness values found on the surface of the coatings and the reported by the manufacturer of the NiTec flux powder and the substrate.
As reported by Byung-Koog et al., the average value of the microhardness of the coatings is seriously influenced by their porosity [12]. These authors showed that the Martens hardness value of ZrO2 coatings decreases for higher values of porosity. They also found that the hardness tends to be greater in the cross sections of the coatings than on the surface. This behavior has been reported by other authors, such as Balak Jang et al. [13]. The porosity of the coatings was determined by means of electrochemical methods, using the procedure described in a previous paper [10].
As described by Paneto et al. [14], the porosity of the coatings reduces the average volume resistant to mechanical stress, which decreases the microhardness of the deposits. The interdependence of microhardness and porosity is universally known and is given by the exponential relationship:
where H is the microhardness of the material, H0 is the microhardness of the 100% dense material, b is a pre-exponential constant, and P is the porosity of the material. Figure 2 shows the relationship between the natural logarithm of the microhardness and the natural logarithm of the porosity index of NiTec coatings. Using the natural logarithm allows making a linearization of the data, obtaining the H0 and the pre-exponential constant b in this process. The value obtained for H0 was 1474 MPa, lower than the hardness reported for NiTec (see Table 2), which demonstrates that the microhardness of the coatings is influenced by other factors such as a crystallographic orientation and defects like un-melted particles and oxide formation. Furthermore, the value obtained for b was 0.08649; the value of this factor depends on the composition of the coating. Paneto et al. [14] showed that the pre-exponential constant b varies between 2 and 8 in ceramic materials and attains its highest value when the ceramic content is greater. The low value of b recorded for NiTec coatings could be a demonstration of the metallic character of these coatings.
Figure 2 makes evident the fact that coatings with a lower degree of porosity have higher microhardness, the coatings deposited at the highest oxygen flow conditions (16.56 SCFH) presented the highest degree of porosity, these coatings presented the lowest degree of hardness too, this behavior is evident in Figure 2. The anisotropy of the microhardness depends not only on the porosity of the deposits but also on factors such as the columnar structure of the deposits, which is directly related to the crystallographic orientation of the material [11]. Luo et al. report that a strong crystallographic orientation can favor the microhardness of deposits [15]. These results agree with the reports of Roa et al., who found that preferential orientation of the plane (111) of metastable stainless steel led to higher microhardness values of the material [16].
Figure 3 relates the microhardnes with the crystallographic orientation coefficient Co for plane (111) of the NiTec coatings. In the figure, the dependence of the microhardness on Co is clear. This means that for the crystals oriented in the (111) plane, more stress is required to activate dislocations in the crystalline lattice, which coincides with the fact that NiTec coatings with the higher density of dislocations recorded a higher average microhardness [16]. The dislocation density is given by the relation , where represents the dislocation density calculated from the broadening by microdeformation of the lattice and is the dislocation density calculated from the particle size (crystallite size). Here, and , where ε is the lattice microstrain, b is the Burguer vector, F is an interaction factor, which is assumed to be 1, K is a factor that is associated with the dislocation energy and whose value for cubic crystals varies from 14.1 for BCC structures to 16.1 in FCC structures, D represents the crystallite size, and finally n are the dislocations per face of the block, which are assumed to be 1, based on the assumption that the metal is divided into blocks and the dislocations are in the boundaries between the blocks. Thus, the value 1 can be used as a supposition that leads to thinking of a minimum dislocation density [15,16]. Figure 4 shows the microhardness as a function of dislocation density of the NiTec coatings.
3.3. Scratch Test Results
To determine the degree of adhesion/cohesion of the coatings, a scratch test was carried out using a CSM Revetest Xpres Scaratch Tester [17], which has a conical Rockwell C type diamond indenter with an apical angle of 120° and a radius of 200 μm. In the test, carried out at room temperature, loads of 5, 10, and 15 N were used at a displacement speed of 4 mm/min and a scratch distance of 3 mm. The track of the scratch test was generated from the substrate to the surface of the coating.
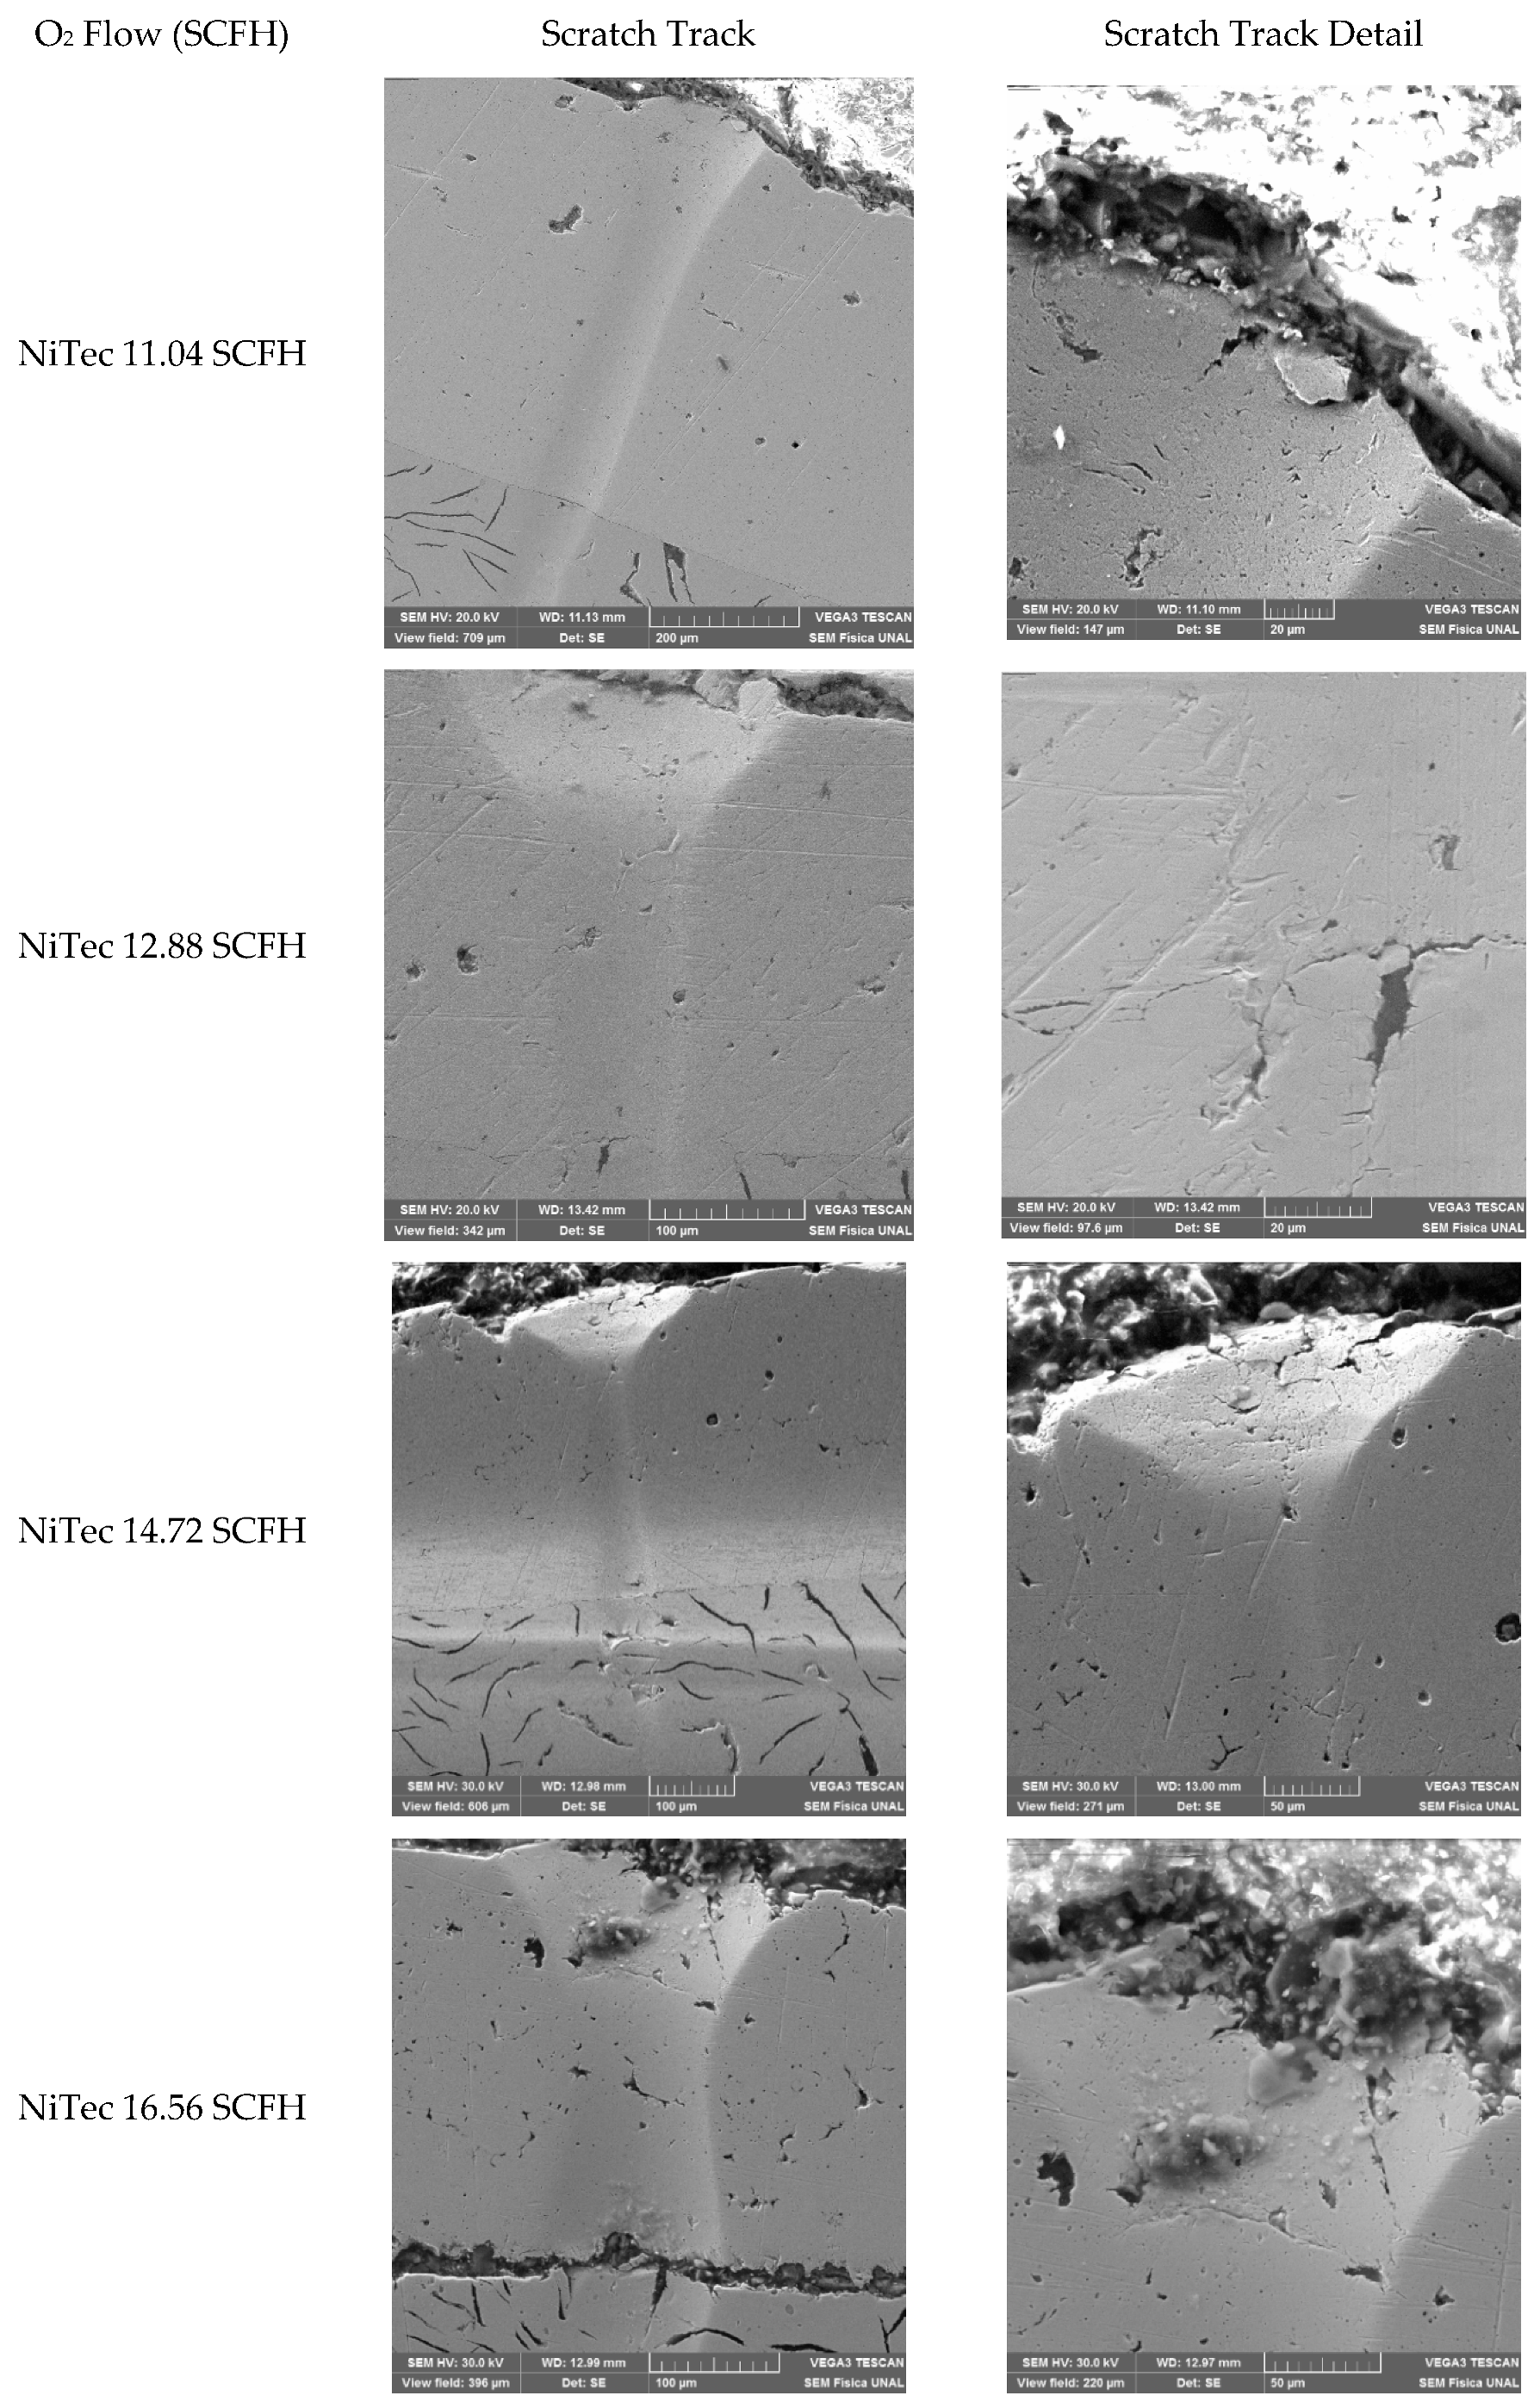
The scratch tests were carried out on cross sections of the coatings and not on their surface, due to the thickness, porosity, and roughness of the coatings and in accordance with what is recommended by the literature for coatings obtained by thermal spray techniques [17,18]. The scratch test loads were 5, 10, and 15 N. In the Figure 5 the results of the scratch test, at 15 N of load are presented, showing the entire scratch track, cone area, and cone area detail for each coating.
In the scratch tests, two cones are usually recorded, one at the substrate-coating interface and another at the upper border of the coating. The first cone provides information regarding cohesion, while the second one characterizes the adhesion of the coating. Figure 5 shows the tracks for the scratch tests performed on the NiTec coatings, obtained by means of SEM. The area of the cones was obtained via optical microscopy with an image analyzer. The scratch resistance values obtained under ISO/WD 27,307 standard [17] are shown in Table 3. The coefficient of variation (Cv) is determined according to:
where σ represents the standard deviation and μ is the average value of the cone area [18].
The scratch tracks on the NiTec coatings did not generate a defined cone in the substrate interface, except for the coatings deposited at 16.56 SCFH oxygen flow (see Figure 5). This indicates that the coatings exhibited a cohesive-type failure, and the coating deposited at 16.56 SCFH exhibited an adhesive/cohesive type failure. In this coating, the formation of cracking at the substrate-coating interface was made evident by the scratch test at 15 N load. The scratch tracks also showed porosities in the form of buckled cracks and conformal- and Hertzian-type cracks as a failure mechanism, in addition to the formation of micro cracks by the action of defects in the coating such as unmelted particles and pores.
The microhardness of the coatings by itself cannot predict the adhesive/cohesive strength in Ni-based coatings deposited via thermal spraying; it is necessary to consider parameters such as the porosity of the coatings and the tensile strength. However, for coatings that exhibit high cohesion with low porosity and low defects in their matrix, high microhardness could be related to a high level of adhesive/cohesive strength. Likewise, microcracks, like pores, can induce macroscopic faults when a sufficiently high load is applied. It can also be seen that small cracks around the scratch path can decrease the cohesive resistance in the scratch test. These results agree with the reports made by Vencl et al. [17].
3.4. Adhesive Wear
Figure 6 shows the coefficient of friction (COF) curves for NiTec coatings deposited under different oxygen flow conditions, as well as for the gray cast iron substrate, the graphs respond to the curve that is closest, for each coating, to the average data of the adhesive wear test. In the first 100 s of the test, a period called initial adjustment; a progressive increase in the coefficient of friction is seen. This is due to the interaction of the pin and the sample. During this period, a deformation or even wear of the superficial roughness of the coating can result, producing a better coupling of the tribological pair. Likewise, the surface layers of oxide that protect the Ni from oxidation can be worn, and, through the temperature effect reached in the test, new layers of oxide can even be generated. These processes can cause the production of wear particles and adhesive processes between the pin and the sample. After this initial adjustment, the curves show that the friction force is stabilized. The average value of the coefficient of dynamic friction measured during this stabilization time is taken as the coefficient of friction for the tribological couple. Since the friction test consists of repetitive cycles on the sliding track, this track could be degraded due to depletion of the coating or excessive accumulation of wear particles, which can lead to an abrupt increase in the coefficient of friction that entails severe damage to the surface tested [19,20,21,22].
Figure 7 shows SEM micrographs of the wear traces of NiTec coatings for the pin-on-disk test. A presence of compact transfer layers and loose debris on the tribo-surface of the disk, along with the wear marks, was detected.
Figure 8 shows the wear tracks of the NiTec coatings deposited at 11.04 SCFH oxygen flow. In the Figure 8 3 specific zones on this tracks are remarked. The chemical composition of this zones, obtained by EDS, are presented in the Table 4. Figure 8 show a flat area associated with oxide formation (zone 1, Figure 8), the grooves area generated by the wear test (zone 2, Figure 8), and the area of the particles or rough debris products of the tribological test (zone 3, Figure 8).
In the zone 1 of the Figure 8, flat debris adhered to the surface of the disk is evident. The chemical analysis of the flat areas, performed using the EDS technique, showed a higher concentration of oxygen in these regions compared to other areas of the wear footprint, which suggests that the oxidation of the debris from the coating occurred in the area where these flat areas were formed. The wear marks do not show signs of oxidation.
This evidence allows one to postulate a mechanism of wear by oxidation. This mechanism is mainly due to the high dependence shown by the COF on the sliding speed. The COF decays when increasing the sliding speed. This is due to the combination of two principal factors: Local heating, a product of the wear test, which decreases the average shear stress on the surface of the sample analyzed, and the formation of fine layers of oxide generated by high contact temperatures, according to reports by Mohanty et al. [23].
Considering that the initial real contact between the surfaces of the tribological pair is estimated at a fraction of 1/100 of the apparent contact area, the sliding of these surfaces leads to plastic deformation and an intermetallic adhesion, forming cold welding joints between the rough surfaces in contact with the tribological pair. The strength of these joints is determined by the shape of the surfaces and the solubility of the materials in contact, so that most metals show a considerable tendency to adhesion. On observing the traces of wear regions with a flattened and elongated morphology in the direction of sliding, the occurrence of a plastic deformation of the surface subjected to the test is suggested, which is evidence of a mechanism of adhesive wear.
By means of SEM, the average width of the wear tracks was measured, in order to determine the worn volume and the wear coefficient for the NiTec coatings. Table 5 shows the results obtained for the coefficient of friction (COF) of the tribological coating-pin, worn volume Vdes, and the wear coefficient K for the NiTec coatings subjected to the pin-on-disk tests. The coefficient of wear is the ratio between the worn volume and the normal load applied in the distance traveled in the test, as follows:
It is possible to use this equation since the wear occurred in the sample and not on the pin, as Figure 9 shows, which shows an image obtained by laser profilometry, of the wear trace of the NiTec coatings, in this image it is clearly appreciated that the pin produces a defined groove on the surface of the coatings when performing the wear test.
As the wear mechanism of this test is a conjunction of several mechanisms in themselves, the relationship between surface parameters such as roughness, mechanical such as hardness, or environmental such as temperature with the parameters of the pin-on-disk test such as the volume worn, the coefficient of friction or the coefficient or rate of wear are not necessarily unique or easily predictable. Thus, for example, authors such as Gopi et al., Showed that the friction coefficient remained constant for different hardness values of Cu–Al alloys, while Trevisol et al. Report a decrease in the friction coefficient with increasing hardness in 35NCD16 steels [24,25]. This disparity of reports only demonstrates the complexity of the wear mechanism. The fact that the NiTec coating deposited at an oxygen flow of 11.04 SCFH shows the maximum coefficient of friction but at the same time presents one of the highest harnesses, only confirms that this coefficient of friction is closely linked not only to hardness if not also to factors such as average surface roughness. Figure 10 shows the microhardness as a function of wear coefficient of NiTec coatings. The average surface roughness registered the highest value for NiTec coatings deposited at 11.04 SCFH, obtaining a value of 0.84 ± 0.01 micrometers, while for coatings deposited at oxygen flow conditions of 12.88, 14.72, and 16.56 SCFH, the average surface roughness registered values. 0.62 ± 0.01, 0.45 ± 0.02, and 0.58 ± 0.01 micrometers respectively. The relationship between the average surface roughness and the coefficient of friction is evidenced in Figure 11 which shows that high values of average surface roughness produce high coefficients of friction in the coatings. These results show that even a coating with a high relative hardness with respect to the ores produced under different oxygen conditions can have a high coefficient of friction when these in turn have a high roughness.
According to what is reported in the literature, for dry sliding conditions of a tribological pair, the COF (coefficient of friction) is controlled by a third body, which differs in microstructure and composition from the first bodies of the tribological pair; this third body separates the initial tribological couple and transmits the mechanical load between them. A way of describing the dry sliding phenomenon was proposed by Berthier, when introducing the concept of internal and external flow sources: Internal flow sources , are formed by the detachment of particles due to surface tribological transformations, subsurface cracking and creating links. On the other hand, external flow sources depend on the addition of an artificial interfacial medium [21], this explain that the increase in consumption could be accompanied by a decrease in COF.
The results of the pin-on-disk tests show that the increase in the microhardness of the coatings coincides with a low rate of wear, which agrees with the reports of Trevisol et al. [24,25]. In Figure 10 is clear that a lower friction coefficient is registered in the coatings with high microhardness values, in the same way, in Figure 11 which relate the coefficient of friction (COF) with the surface roughness of the coatings, high values of average surface roughness, which was determined by confocal laser microscopy, are correlated with high values of the friction coefficient. This behavior is mainly since upon contacting the tribological couple pin-coating, the pin, which is harder than the coatings, deforms or displaces the peaks of the coating. This produces particles that act as an abrasive, generating a wear phenomenon on the three bodies, which directly affects the coefficient of friction of the tribological pair. This phenomenon stabilizes within the duration of the test [22].
The adhesion coefficient between a tribological couple decreases with the increase of the surface energy of the preferential crystallographic planes of the surfaces in contact, because the plastic deformation of the surfaces occurs at the interface. The amount of stress accumulated in plane (111) is lower than for other crystallographic planes, which indicates that for a given load, the real area of contact for orientation (111) could be smaller than for the other planes. These results agree with the fact that the coatings of NiTec deposited at an oxygen flow of 14.72 SCFH, which exhibited the highest degree of orientation in the preferred plane (111), exhibited the lowest coefficient of friction and wear [26].
3.5. Abrasive Wear
The abrasive wear tests of the NiTec coatings were carried out following procedure B of the ASTM G-65 standard. In this procedure, a load of 130 N is specified on the sample, with 2000 wheel revolutions, which generates a wear distance of 1436 m and using Ottawa sand as abrasive. Figure 12 shows the wear tracks of NiTec coatings obtained via SEM at a scale of 300 μm. The wear traces did not show substantial changes between the coatings deposited under the different oxygen flow conditions. In the images, mainly grooves characteristic of a mechanism of micro-ploughing are shown. In some regions, accumulation of material worn by the formation of a micro-wedge can be seen, as well as, although at a lower density, displacement of material by the mechanism of microcut and plastic deformation of the surface. The appearance of pores due to the detachment of non-molten particles from the matrix of the coatings was also recorded.
For ductile materials like NiTec coatings, the wear mechanism is due to several mechanisms that interact during the test. Thus, in the process of micro-ploughing, material moves from the grooves to the periphery, which can occur at light loads without necessarily representing a significant loss of material. However, during the test time, this process leads to a loss of material by microfatigue. The detached material can move toward the periphery of the groove or be dragged by the abrasive through the same groove. When the relationship between the contact shear strength as a function of the shear force of the system increases to more than 50%, the amount of material displaced in the groove is greater than the material displaced to the periphery of the groove, causing the formation of a wedge. Wedge formation can lead to a cutting wear mechanism, which occurs during the removal process of the debris from the wear interface. The cutting process depends on the geometry of the particle that causes it, there being critical angles for the surface of these particles, which induce the transition from a micro-ploughing mechanism to a microcut mechanism. In this case, the mechanism exhibits a primary dependence on the orientation of the abrasion grains and the worn material. So, for example, for copper, critical angles close to 45° have been determined, while for materials such as aluminum, this angle has been determined to be on the order of 85° [27].
Table 6 shows the calculation of wear parameters for gray cast substrates and NiTec coatings. In the table it is evident that the coatings have a lower wear coefficient than the gray cast iron substrate. Likewise, the coatings deposited at flow conditions of 14.72 SCFH show the lowest worn volume and the lowest wear coefficient. This fact is explained by the relationship reported by several authors, such as N.M. Melendez et al. [28], between the wear rate and the microhardness of the sample. The wear rate W relates the lost volume to the applied load and the sliding distance, as follows:
where ΔV is the lost volume, P represents the load applied in the test, and s is the sliding distance for the test. Some authors have shown that the increase in microhardness of the tested sample leads to a subsequent decrease in the wear rate [28].
Likewise, Zhang et al. found that high porosity leads to an increase in the wear rate of the coatings [29]. Figure 13 shows the relationship between the microhardness and the wear rate and the degree of porosity of the NiTec coatings. The results indicate that an increase in the wear rate of the coatings produces a decrease in the microhardness, which is in accordance with Archard’s theory and is comparable to the results published by authors such as Melendez et al. and Sandeep Nair et al. [27,30].
4. Conclusions
Using the spray and fuse technique. Ni-based coatings were deposited varying oxygen flow. The results allowed established that:
- The coefficient of crystallographic orientation has the same value that the powder in all planes and have little variations with the oxygen flux.
- The values of surface microhardness have fluctuations with the oxygen flux that can be explain it for defects such as pores.
- Calculations that include the porosity shows that dislocation density determined the microhardness.
- The scratch test shows that the coatings deposited at high flux has adhesive–cohesive failure.
- Pin-on-disk tests, allowed determined that the worn volume, friction coefficient and wear coefficient are fluctuating with the oxygen flux.
Author Contributions
J.H. conducting a research and investigation process, specifically performing the experiments and data/evidence collection; O.J.J. ideas, formulation or evolution of overarching research goals and aims, disccus of the results, conceived and designed the experiment; A.J.E. result analisys and writting of the paper preparation, creation and/or presentation of the published work by those from the original research group, specifically critical review, commentary or revision – including pre- or post-publication stages. All authors have read and agreed to the published version of the manuscript.
Funding
This research received no external funding.
Acknowledgments
The authors would like to acknowledge to National University of Colombia by financial support.
Conflicts of Interest
The authors declare no conflict of interest.
References
- Kim, H.J.; Hwang, S.Y.; Lee, C.H.; Juvanon, P. Assessment of wear performance of flame sprayed and fused Ni-based coatings. Surf. Coat. Technol. 2003, 172, 262–269. [Google Scholar] [CrossRef]
- Giacomantonio, M.; Gulizia, S.; Jahedi, M.; Wong, Y.; Moore, R.; Valimbert, M. Heat treatment of thermally sprayed Ni-based wear and corrosion coatings. Mater. Forum 2011, 35, 48–55. [Google Scholar]
- Jing, Y.; Bo, S. Friction and wear behavior of a Ni-based alloy coating fabricated using a multistep induction cladding technique. Results Phys. 2018, 11, 105–111. [Google Scholar]
- Fazel, M.; Jazi, M.G.; Bahramzadeh, S.; Bakhshi, S.R.; Ramazani, M. Effect of solid lubricant particles on room and elevated temperature tribological properties of Ni–SiC composite coating. Surf. Coat. Technol. 2014, 254, 252–259. [Google Scholar] [CrossRef]
- Sugiarti, E.; Destyorini, F.; Zaini, K.A.; Wang, Y.; Hashimoto, N.; Ohnuki, S.; Hayashi, S. Characterization of Ni-based coatings on carbon steel by electron microscopy. Surf. Coat. Technol. 2015, 265, 68–77. [Google Scholar] [CrossRef]
- Wang, C.; Gao, Y.; Zeng, Z.; Fu, Y. Effect of rare-earth on friction and wear properties of laser cladding Ni-based coatings on 6063Al. J. Alloy. Compd. 2017, 727, 278–285. [Google Scholar] [CrossRef]
- Lee, L.; Behera, P.; Sriraman, K.R.; Chromik, R.R. The effect of contact stress on the sliding wear behaviour of Zn-Ni electrodeposited coatings. Wear 2018, 400, 82–92. [Google Scholar] [CrossRef]
- ASTM G65, Standard Test Method for Measuring Abrasion Using the Dry Sand/Rubber Wheel Apparatus, Active Standard ASTM G65 | Developed by Subcommittee: G02.30 Book of Standards Volume: 03.02. Available online: https://www.astm.org/Standards/G65 (accessed on 22 September 2020).
- ASTM G99–04, Standard Test Method for Wear Testing with a Pin-on-Disk Apparatus. Available online: https://reference.globalspec.com/standard/3815788/astm-g99-04 (accessed on 22 September 2020).
- Jiménez, H.; Olaya, J.J.; Alfonso, J.E.; Pineda-Vargas, C.A. Corrosion resistance of Ni-based coatings deposited by spray and fuse technique varying oxygen flow. Surf. Coat. Technol. 2017, 321, 341–349. [Google Scholar] [CrossRef]
- Rusu, D.I.; Rusu, G.G.; Luca, D. Structural characteristics and optical properties of thermally oxidized Zinc films. Acta Phys. Pol. A 2011, 119, 850–856. [Google Scholar] [CrossRef]
- Jang, B.K.; Matsubara, H. Influence of porosity on hardness and Young’s modulus of nanoporous EB-PVD TBCs by nanoindentation. Mater. Lett. 2005, 59, 3462–3466. [Google Scholar] [CrossRef]
- Balak, Z.; Zakeri, M.; Rahimipur, M.R.; Salahi, E.; Nasiri, H. Effect of open porosityon flexural strength and hardness of ZrB2-based composites. Ceram. Int. 2015, 41, 8312–8319. [Google Scholar] [CrossRef]
- Paneto, F.J.; Pereira, J.L.; Lima, J.O.; Jesus, E.J.; Silva, L.A.; Lima, E.S.; Cabral, R.F.; Santos, C. Effect of porosity on hardness of Al2O3–Y3Al5O12 ceramic composite. Int. J. Refract. Met. Hard Mater. 2015, 48, 365–368. [Google Scholar] [CrossRef]
- Sheng-Nian Luo, J.G.; Swadener, C.M.; Oliver, T. Examining crystallographic orientation dependence of hardness of silica stishovite. Phys. B 2007, 399, 138–142. [Google Scholar]
- Roa, J.J.; Fargas, G.; Mateo, A.; Jiménez-Piqué, E. Dependence of nanoindentation hardness with crystallographic orientation of austenite grains in metastable stainless steels. Mater. Sci. Eng. A 2015, 645, 188–195. [Google Scholar] [CrossRef]
- Vencl, A.; Arostegui, S.; Favaro, G.; Zivic, F.; Mrdak, M.; Mitrović, S.; Popovic, V. Evaluation of adhesion/cohesion bond strength of the thick plasmas pray coatings by scratch testing on coatings cross-sections. Tribol. Int. 2011, 44, 1281–1288. [Google Scholar] [CrossRef]
- Nohava, J. Characterization of Thermal Spray Coatings by Instrumented Indentation and Scratch Testing: Part I; CSM Instruments: Peseux, Switzerland, 2009. [Google Scholar]
- Saastamoinen, A.; Kaijalainen, A.; Porter, D.; Suikkanen, P.; Yang, J.R.; Tsai, Y.T. The effect of finish rolling temperature and tempering on the microstructure, mechanical properties and dislocation density of direct quenched Steel. Mater. Charact. 2018, 139, 1–10. [Google Scholar] [CrossRef]
- He, S.H.; He, B.B.; Zhu, K.Y.; Huang, M.X. Evolution of dislocation density in bainitic steel: Modeling and experiments. Acta Mater. 2018, 149, 46–56. [Google Scholar] [CrossRef]
- Rodrigues, A.C.P.; Yonamine, T.; Sinatora, A.; Azevedo, C.R.F. Pin-on-disc tribotests with the addition of Cu particles as an interfacial media: Characterization of disc tribo surfaces using SEM-FIB techniques. Tribol. Int. 2016, 100, 351–359. [Google Scholar] [CrossRef]
- Rahaman, M.L.; Zhang, L.; Liu, M.; Liu, W. Surface roughness effect on the friction and wear of bulk metallic glasses. Wear 2015, 332–333, 1231–1237. [Google Scholar] [CrossRef]
- Mohanty, M.; Smith, R.W.; de Bonte, M.; Celis, L.P.; Lugscheider, E. Sliding wear behavior of thermally sprayed 75/25 Cr3C2/NiCr wear resistant coatings. Wear 1996, 198, 251–266. [Google Scholar] [CrossRef]
- Gopi, V.; Sellamuthu, R.; Arul, S. Measurement of hardness, wear rate and coefficient of friction of surface refined Al-Cu alloy. Procedia Eng. 2014, 97, 1355–1360. [Google Scholar] [CrossRef] [Green Version]
- Trevisiol, C.; Jourani, A.; Bouvier, S. Effect of hardness, microstructure, normal load and abrasive size on friction and on wear behaviour of 35NCD16 steel. Wear 2017, 388–389, 101–111. [Google Scholar] [CrossRef]
- Buckley, D.H. The Influence of Crystal Structure, Orientation and Solubility on the Adhesion and Sliding Friction of Various Metal Single Crystals in Vacumm; NASA Technical Memorándum: Hampton, Virginia, 1966. [Google Scholar]
- Kovaříková, I.; Szewczyková, B.; Blaškoviš, P.; Hodúlová, E.; Lechovič, E. Study and Characteristic of Abrasive Wear Mechanisms; Institute of Production Technologies, Faculty of Materials Science and Technology, Slovak University of Technology: Bratislava, Slovakia, 2009. [Google Scholar]
- Melendez, N.M.; Narulkar, V.V.; Fisher, G.A.; McDonald, A.G. Effect of reinforcing particles on the wear rate of low-pressure cold-sprayed WC-based MMC coatings. Wear 2013, 306, 185–195. [Google Scholar] [CrossRef]
- Zhang, L.; Qu, X.H.; Duan, B.H.; He, X.B.; Qin, M.L. Effect of porosity on wear resistance of SiCp/Cu composites prepared by pressureless infiltration. Trans. Nonferrous Met. Soc. China 2008, 18, 1076–1082. [Google Scholar] [CrossRef]
- Nair, S.; Sellamuthu, R.; Saravanan, R. Effect of nickel content on hardness and wear rate of surface modified cast aluminium bronze alloy. Mater. Proc. 2018, 5, 6617–6625. [Google Scholar]
Figure 1.
Crystallographic orientation coefficient of NiTec powder and coatings deposited under different oxygen flow conditions.
Figure 1.
Crystallographic orientation coefficient of NiTec powder and coatings deposited under different oxygen flow conditions.

Figure 2.
Ln microhardness vs. Ln porosity of NiTec coatings.

Figure 3.
Microhardness vs. crystallographic orientation coefficient Co of NiTec coatings.

Figure 4.
Microhardness as a function of dislocation density of NiTec coatings.

Figure 5.
Scratch test tracks of NiTec coatings.

Figure 6.
Friction coefficient of (COF) as a function of the time of NiTec coatings.

Figure 7.
SEM micrographs Pin on disk wear tracks of NiTec coatings deposited at 11.04 SCFH.

Figure 8.
Chemical analysis of pin on disk wear tracks of NiTec coatings deposited at 11.04 SCFH.

Figure 9.
Pin-on-disk wear tracks of NiTec coatings deposited at 11.04 SCFH obtained by laser profilometry.
Figure 9.
Pin-on-disk wear tracks of NiTec coatings deposited at 11.04 SCFH obtained by laser profilometry.

Figure 10.
Microhardness vs. wear coefficient of NiTec coatings.

Figure 11.
Friction coefficient vs. roughness surface of NiTec coatings.

Figure 12.
Abrasive wear tracks of NiTec coatings deposited at 14.72 SCFH.

Figure 13.
Microhardness and porosity as a function of wear rate of NiTec, coatings as a function of microhardness and porosity.
Figure 13.
Microhardness and porosity as a function of wear rate of NiTec, coatings as a function of microhardness and porosity.


Table 1.
Deposition conditions of the coatings.
| Torch | SuperJet Eutalloy | |||
|---|---|---|---|---|
| O2 Pressure (Psi) | 39 | |||
| C2H2 Pressure (Psi) | 7 | |||
| O2 Flow (SCFH) | 11.04 | 12.88 | 14.72 | 16.56 |
| C2H2 Flow (SCFH) | 14.64 | |||
| Powder composition | Ni + 5% Fe, B, Si | |||
| Powder code | Eutalloy 10,224 (NiTec) | |||
| Powder size (µm) | 140 + 120 | |||
| Spray-Fuse distances (mm) | 150–50 | |||
| Nozzle | B2 | |||
Table 2.
Average surface microhardness of NiTec coatings.
| Sample | Average Microhardness (MPa) |
|---|---|
| Substrate | 3475.48 ± 54.21 |
| NiTec (reported hardness) | 2354 * |
| (11.04 SCFH) | 2104.72 ± 42.16 |
| (12.88 SCFH) | 2055.26 ± 48.32 |
| (14.72 SCFH) | 2128.91 ± 51.15 |
| (16.56 SCFH) | 1708.54 ± 47.43 |
* Hardness reported by Castolin Eutectic.
Table 3.
Scratch test parameters of NiTec coatings.
| O2 Flow (SCFH) | Scratch Test Load (N) | Cone Projected Area Ac (µm2) | Coefficient of Variation Cv (%) | Kind of Failure |
|---|---|---|---|---|
| 11.04 | 5 | 8379 | 16.12 | Cohesive |
| 10 | 15,361.5 | 18.16 | Cohesive | |
| 15 | 19,511 | 19.21 | Cohesive | |
| 12.88 | 5 | 13,857.5 | 18.33 | Cohesive |
| 10 | 20,570 | 20.12 | Cohesive | |
| 15 | 32,448 | 16.42 | Cohesive | |
| 14.72 | 5 | 5675.8 | 20.1 | Cohesive |
| 10 | 13,050 | 19.62 | Cohesive | |
| 15 | 27,072 | 14.85 | Cohesive | |
| 16.56 | 5 | 18,447.5 | 21.33 | Adhesive-cohesive |
| 10 | 28,318.5 | 18.85 | Adhesive-cohesive | |
| 15 | 30,846 | 19.33 | Adhesive-cohesive |
Table 4.
Chemical composition of the wear tracks of NiTec in zones 1, 2, and 3 of the Figure 8.
Table 4.
Chemical composition of the wear tracks of NiTec in zones 1, 2, and 3 of the Figure 8.
| Zone | Element | Unn. C. (wt.%) | Norm. C. (wt.% ) | Atom. C. (at.% ) | (1. Sigma) (wt.% ) |
|---|---|---|---|---|---|
| 1 | Ni | 78.17 | 83.52 | 61.18 | 2.03 |
| O2 | 12.14 | 12.97 | 34.87 | 2.76 | |
| Fe | 1.74 | 1.86 | 1.43 | 0.10 | |
| Si | 1.54 | 1.65 | 2.52 | 0.15 | |
| 2 | Ni | 83.28 | 94.92 | 87.58 | 2.17 |
| Si | 2.88 | 3.28 | 6.32 | 0.22 | |
| O2 | 1.58 | 1.80 | 6.10 | 0.78 | |
| 3 | Ni | 68.29 | 85.33 | 65.20 | 1.78 |
| O2 | 8.61 | 10.76 | 30.17 | 2.12 | |
| Fe | 1.64 | 2.04 | 1.64 | 0.10 | |
| Si | 1.50 | 1.87 | 2.98 | 0.15 |
Table 5.
Pin on disk test parameters of NiTec coatings.
| Muestra | Vdes (mm3) | K | COF |
|---|---|---|---|
| NiTec (11.04 SCFH) | 0.156 ± 0.012 | 7.32 × 10⁻⁷ ± 0.03 | 0.713 ± 0.013 |
| NiTec (12.88 SCFH) | 0.166 ± 0.051 | 8.15 × 10⁻⁷ ± 0.12 | 0.692 ± 0.021 |
| NiTec (14.72 SCFH) | 0.021 ± 0.042 | 1.02 × 10⁻⁷ ± 0.16 | 0.564 ± 0.015 |
| NiTec (16.56 SCFH) | 0.195 ± 0.033 | 9.57 × 10⁻⁷ ± 0.17 | 0.604 ± 0.006 |
Table 6.
Abrasive wear test parameters of NiTec coatings.
| Sample | Mass Loss (g) | Wear Volume (mm3) | Wear Coefficient K (×10−3) | Wear Rate W (×10−4 mm3/Nm) |
|---|---|---|---|---|
| Substrate | 1.6082 ± 0.0064 | 223.36 ± 0.02 | 2.7 | - |
| NiTec (11.04 SCFH) | 1.8401 ± 0.0025 | 206.75 ± 0.06 | 1.5 | 7.2 ± 0.3 |
| NiTec (12.88SCFH) | 1.8634 ± 0.0037 | 209.37 ± 0.01 | 1.5 | 7.3 ± 0.1 |
| NiTec (14.72 SCFH) | 1.6665± 0.0152 | 187.25 ± 0.02 | 1.4 | 6.5 ± 0.1 |
| NiTec (16.56 SCFH) | 2.3186± 0.0108 | 260.52 ± 0.04 | 1.6 | 9.2 ± 0.2 |
Publisher’s Note: MDPI stays neutral with regard to jurisdictional claims in published maps and institutional affiliations. |
© 2020 by the authors. Licensee MDPI, Basel, Switzerland. This article is an open access article distributed under the terms and conditions of the Creative Commons Attribution (CC BY) license (http://creativecommons.org/licenses/by/4.0/).
Share and Cite
MDPI and ACS Style
Hernando, J.; Jairo, O.J.; Edgar, A.J. Tribological Behavior of Ni-Based Coatings Deposited via Spray and Fuse Technique. Coatings 2020, 10, 1080. https://0-doi-org.brum.beds.ac.uk/10.3390/coatings10111080
AMA Style
Hernando J, Jairo OJ, Edgar AJ. Tribological Behavior of Ni-Based Coatings Deposited via Spray and Fuse Technique. Coatings. 2020; 10(11):1080. https://0-doi-org.brum.beds.ac.uk/10.3390/coatings10111080
Chicago/Turabian StyleHernando, Jiménez, Olaya Jhon Jairo, and Alfonso José Edgar. 2020. "Tribological Behavior of Ni-Based Coatings Deposited via Spray and Fuse Technique" Coatings 10, no. 11: 1080. https://0-doi-org.brum.beds.ac.uk/10.3390/coatings10111080
Note that from the first issue of 2016, this journal uses article numbers instead of page numbers. See further details here.