Insights and Findings Following 11 Years of Test Road Exploitation


1
Road Research Institute, Vilnius Gediminas Technical University, Linkmenų str. 28, 08217 Vilnius, Lithuania
2
Department of Roads, Vilnius Gediminas Technical University, Saulėtekio av. 11, 10223 Vilnius, Lithuania
*
Author to whom correspondence should be addressed.
Coatings 2020, 10(12), 1161; https://0-doi-org.brum.beds.ac.uk/10.3390/coatings10121161
Submission received: 30 October 2020
/
Revised: 24 November 2020
/
Accepted: 25 November 2020
/
Published: 28 November 2020
(This article belongs to the Collection Pavement Surface Coatings)
Abstract
:Road pavement is one of the most important components of road structure. Long-term monitoring changes in the state of road pavement under real conditions of load and climate allows to determine surface degradation mechanisms, select sustainable road building materials and their mixes, rationally employ asphalt paving technologies, and improve quality control. For a number of years, road pavement structures have been studied that should best meet the Lithuanian climate conditions and withstand the increasing impact of vehicle load. Thus, for that purpose, specially designed, constructed and tested roads or road sections for different pavement structures are most appropriate. One of those was constructed in 2007. The experimental road (hereinafter, the Test Road) consisted of 27 different pavement structures (PSs) produced of various materials. The study aims to evaluate the effect of different materials on variations in the bearing capacity of the pavement structure (PS), the sustainability of the structure, and the formation of ruts in 2007–2018. In this way, difference in bearing capacity, rutting depth between sections, and loaded and unloaded lanes was estimated. Further, the statistical analysis of these factors was conducted. Investigations have shown that the minimum bearing capacity of 754 MPa established after 11 years did not affect the formation of rut depth that was less than 1.0 cm. The PSs covered with the used asphalt granules, a larger asphalt base course on gravel, the sand mix base course, and granite aggregate mixed with sand base course were accepted as one of the PSs with the highest bearing capacity with PSs exceeding 929 MPa. The bearing capacity of the PS containing a 20 cm aggregate base course is on average higher by 30 MPa than PS holding a 15 cm aggregate base course.
1. Introduction
Scientists have been studying PS, materials used for their installation (their mechanical and physical properties) for many years [1,2,3,4,5,6,7,8,9]. During their experiments, apply destructive, nondestructive, and other research methods [10,11,12,13,14,15,16], and look for solutions to ensure a sustainable life cycle of roads. The pursuit of scientists, designers, and builders is in many cases is safe, sustainable, and cost-effective road. To this purpose, local materials [1,2,3,4,17,18,19] and their interaction with other substances or additives are investigated in order to use them as widely and efficiently as possible. According to Sybilski [4], if the local material does not meet requirements for its intended application, ways to improve properties should be developed.
Road pavement structures have been under investigation for several years, which should best suit the climatic conditions of Lithuania and withstand the increasing impact of vehicle loads. One of those was created in 2007—The Test Road [17], and is still operating and under investigation covering the following types of measurement like traffic monitoring, temperature and moisture content at a different depth of the road PS, roughness, rutting, longitudinal gradient and cross fall, visual assessment of distress on the road PS, deflection, and skid resistance.
Geologists mine these materials in Lithuania, i.e., sand, gravel, granite, limestone, clay, sapropel, dolomite, peat, oil, and fresh and mineral groundwater [20]. For road construction, sand, gravel, granite, dolomite, and petroleum (bitumen) are applied. According to the annual report [20], the exploitation of mineral resources in 2018 made up to 2200 thousands m3 of dolomite, 7700 thousands m3 of gravel, 2500 thousands m3 of sand, and 55.8 thousands m3 of oil. Valuable crude oil extracted from deposits provides around 5% of the country’s needs annually. According to the data provided from the quarries mining useful fossils, dolomite resources will last for 55–60 years and those of sand and gravel for 100 years.
Granite aggregate is often used for the asphalt wearing course in Lithuania. However, his magmatic rock is imported from other countries. Dolomite is one of the most available sedimentary rocks in Lithuania and quarries contain hundreds of millions of tons of this material. Either, high-quality dolomite produced applying special extraction technology, and the mechanical properties of this material are similar to those of granite. According to the carried-out research [3], asphalt concrete (AC) mix AC11 having high-quality dolomite aggregate could be used for the wearing course of the asphalt pavement with the ESAL ≤ 3.0 million during the design period. In addition, the use of stone mastic asphalt (SMA) mix SMA11 with high-quality dolomite aggregate for the asphalt wearing course should be evaluated additionally taking into account changes in the physical and mechanical properties of high-quality dolomite aggregate during road maintenance.
The bearing capacity and durability of the road structure is subject to the design solution, load conditions, environmental factors, employed materials, and the quality of installation. Within the road operation process, the pavement suffers from frequently occurring cracks, pits, settlements, ruts, etc. Unstable subgrade having insufficient bearing capacity is one of the causes of deformation and the initial failure in the road pavement structure. When the subgrade has insufficient or significantly changing (over the years) bearing capacity, the structure degrades much faster than expected thus resulting in various defects.
The study is aimed at evaluating strain behavior in asphalt base course, bearing capacity, and rut formation during the road exploitation period in 2007–2018, in PSs constructed with the different materials. To achieve this goal, the Test Road containing of 27 PSs with the different materials was constructed in 2007. Strain measurements of the asphalt base course were measured by sensors of loaded lane in each PS. Bearing capacity (E0) was calculated according to the formulas after measured deflections by nondestructive method using Falling Weight Deflectometer (FWD). Deflections were measured in 4 points of loaded lane right wheel path (LLRWP), loaded lane track (LLT), unloaded lane right wheel pats (ULRWP), and unloaded lane track (ULT) of each PS. Rut depths were measured in LLRWP, loaded lane left wheel path (LLLWP), ULRWP, and unloaded lane left wheel path (ULLWP) of each PS. According to the results, 5 PSs with the highest and lowest bearing capacity results were elected. Detailed conclusions according to the results are represented at the end of the paper.
Based on research data, several proposals have already been submitted to the Lithuanian Road Administration regarding the change of information and requirements in regulatory documents. Some of them have already been implemented. Like, Road Design Regulations new edition were supplemented including a new pavement design class with design load from 1.0 to 1.8 million, and coating class III coatings for the design to provide a design load of 1.8 to 3.0 million was provided to PS class identified III. In addition, the selected five PSs with the highest bearing capacity were suggested widely to apply for Lithuanian roads and streets (during construction and reconstruction process) when design load A ranges from 1.8 to 3.0 million.
2. The Test Road
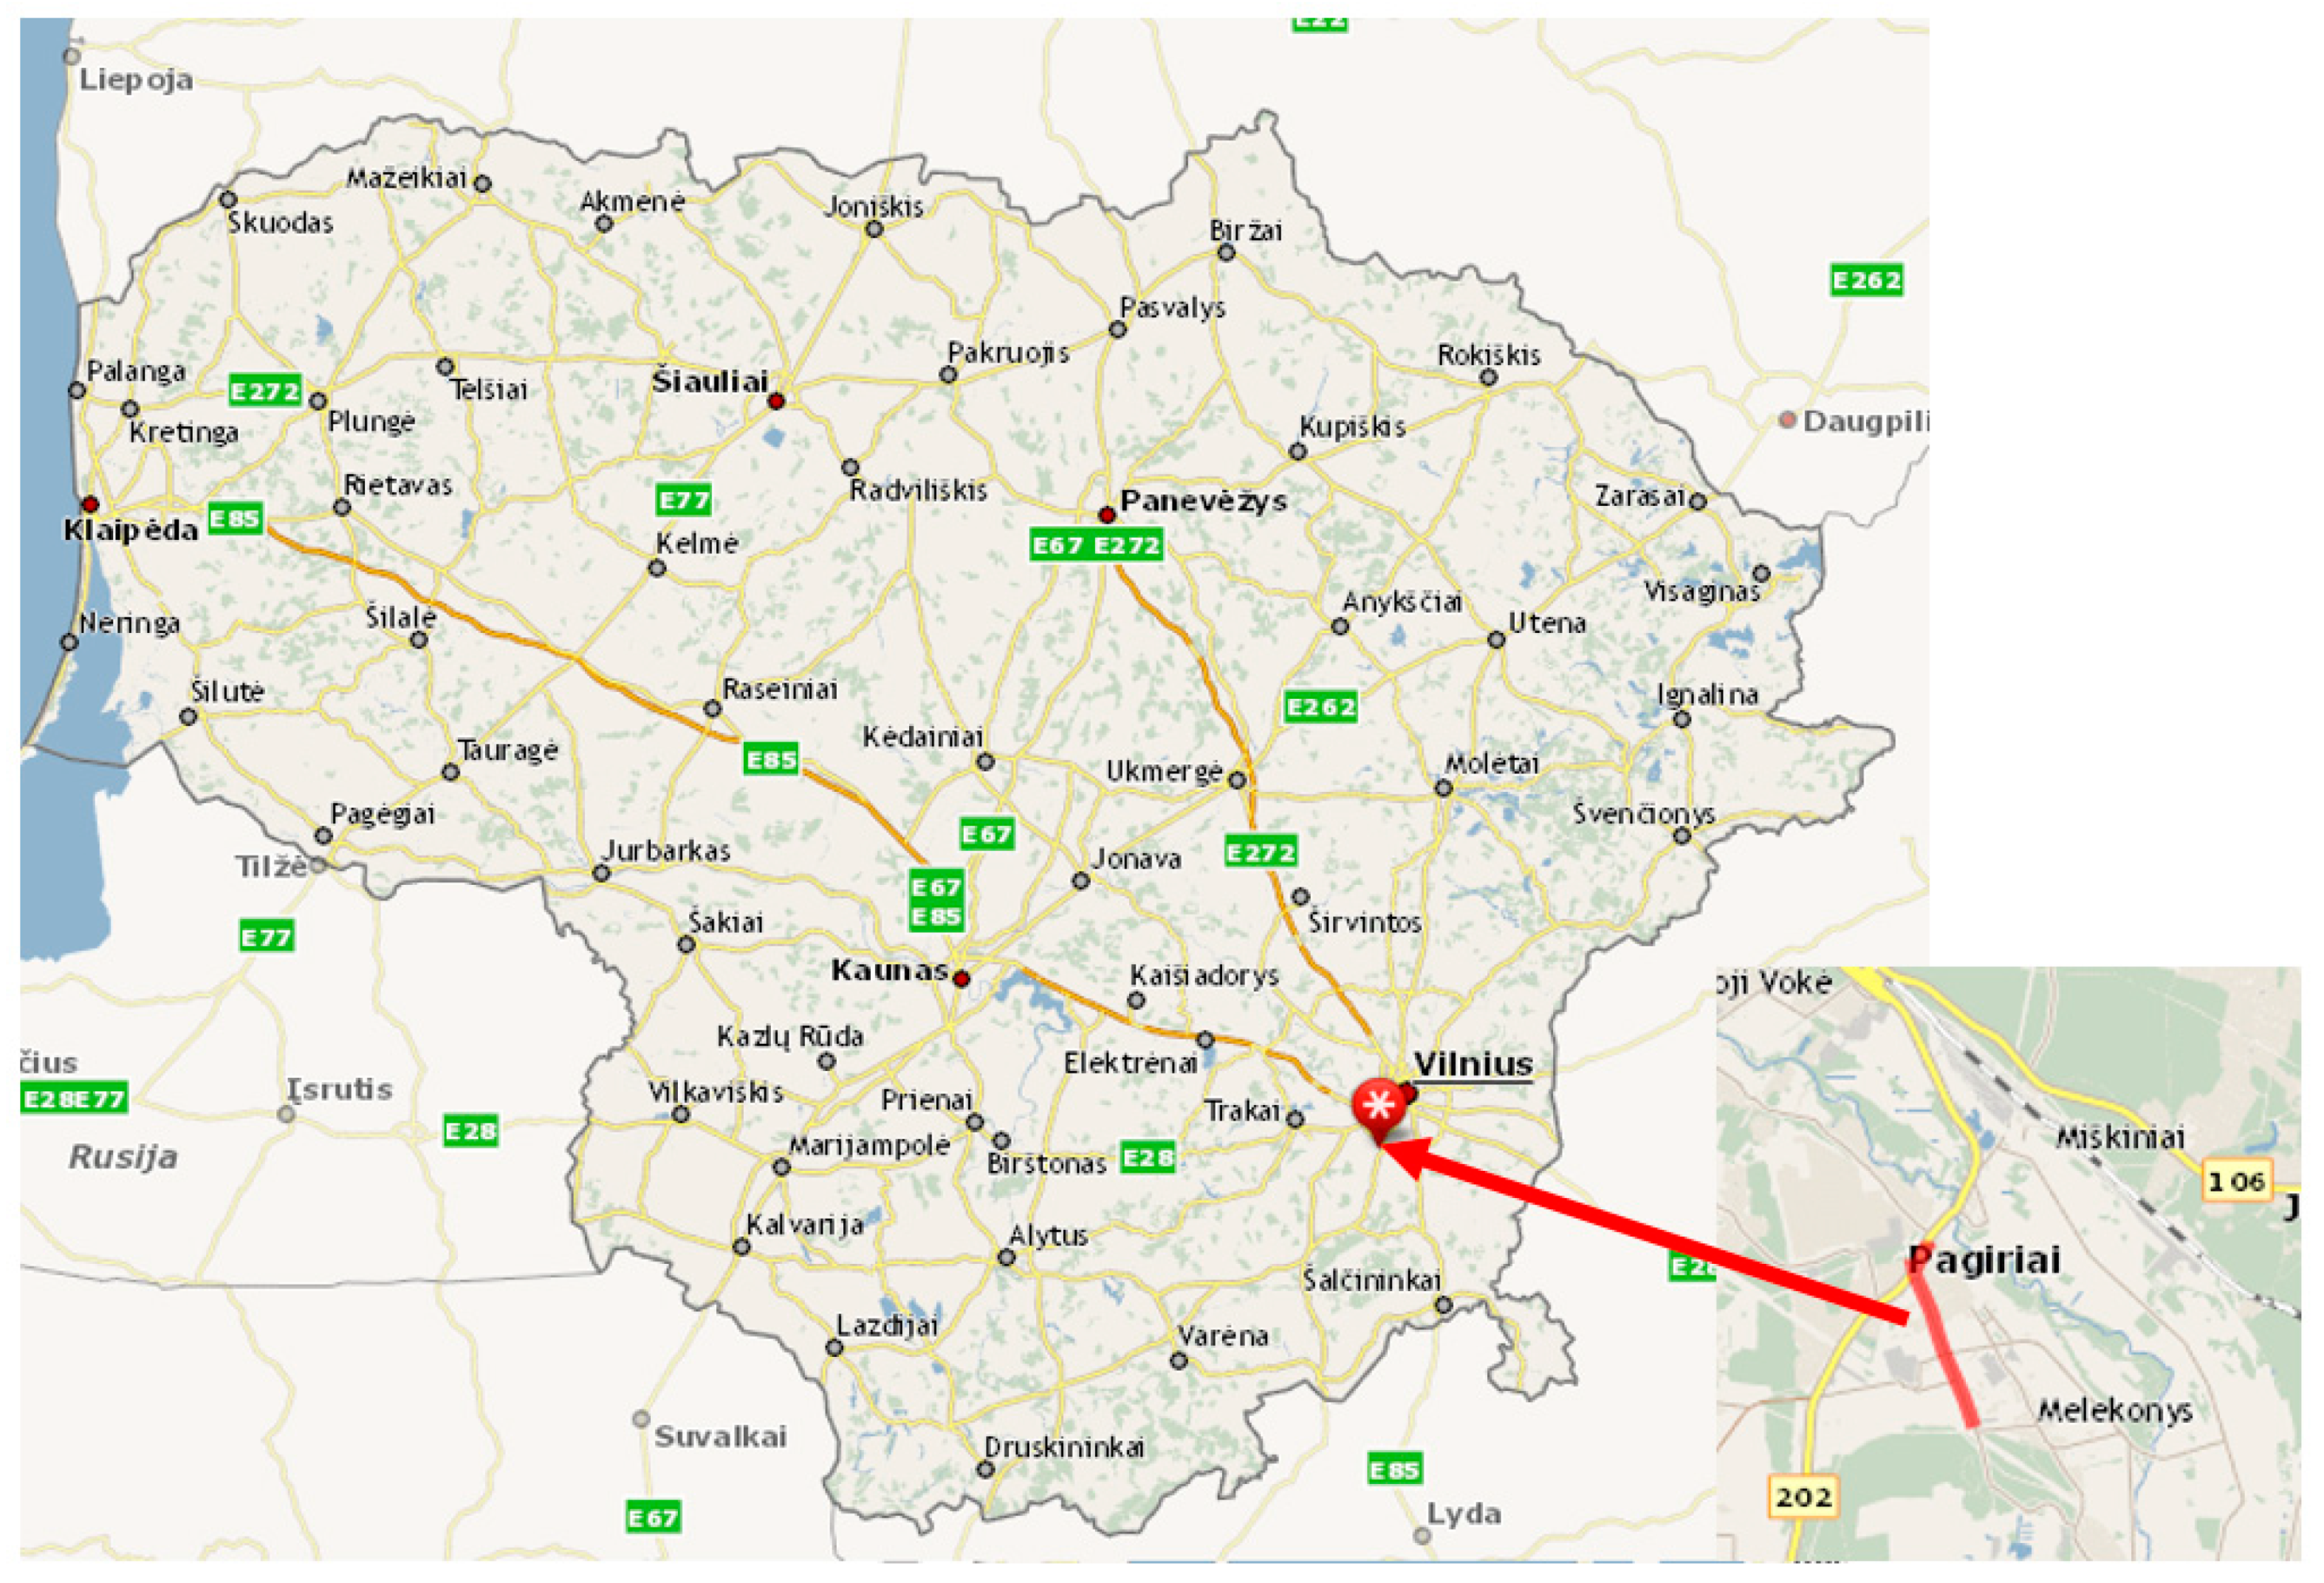
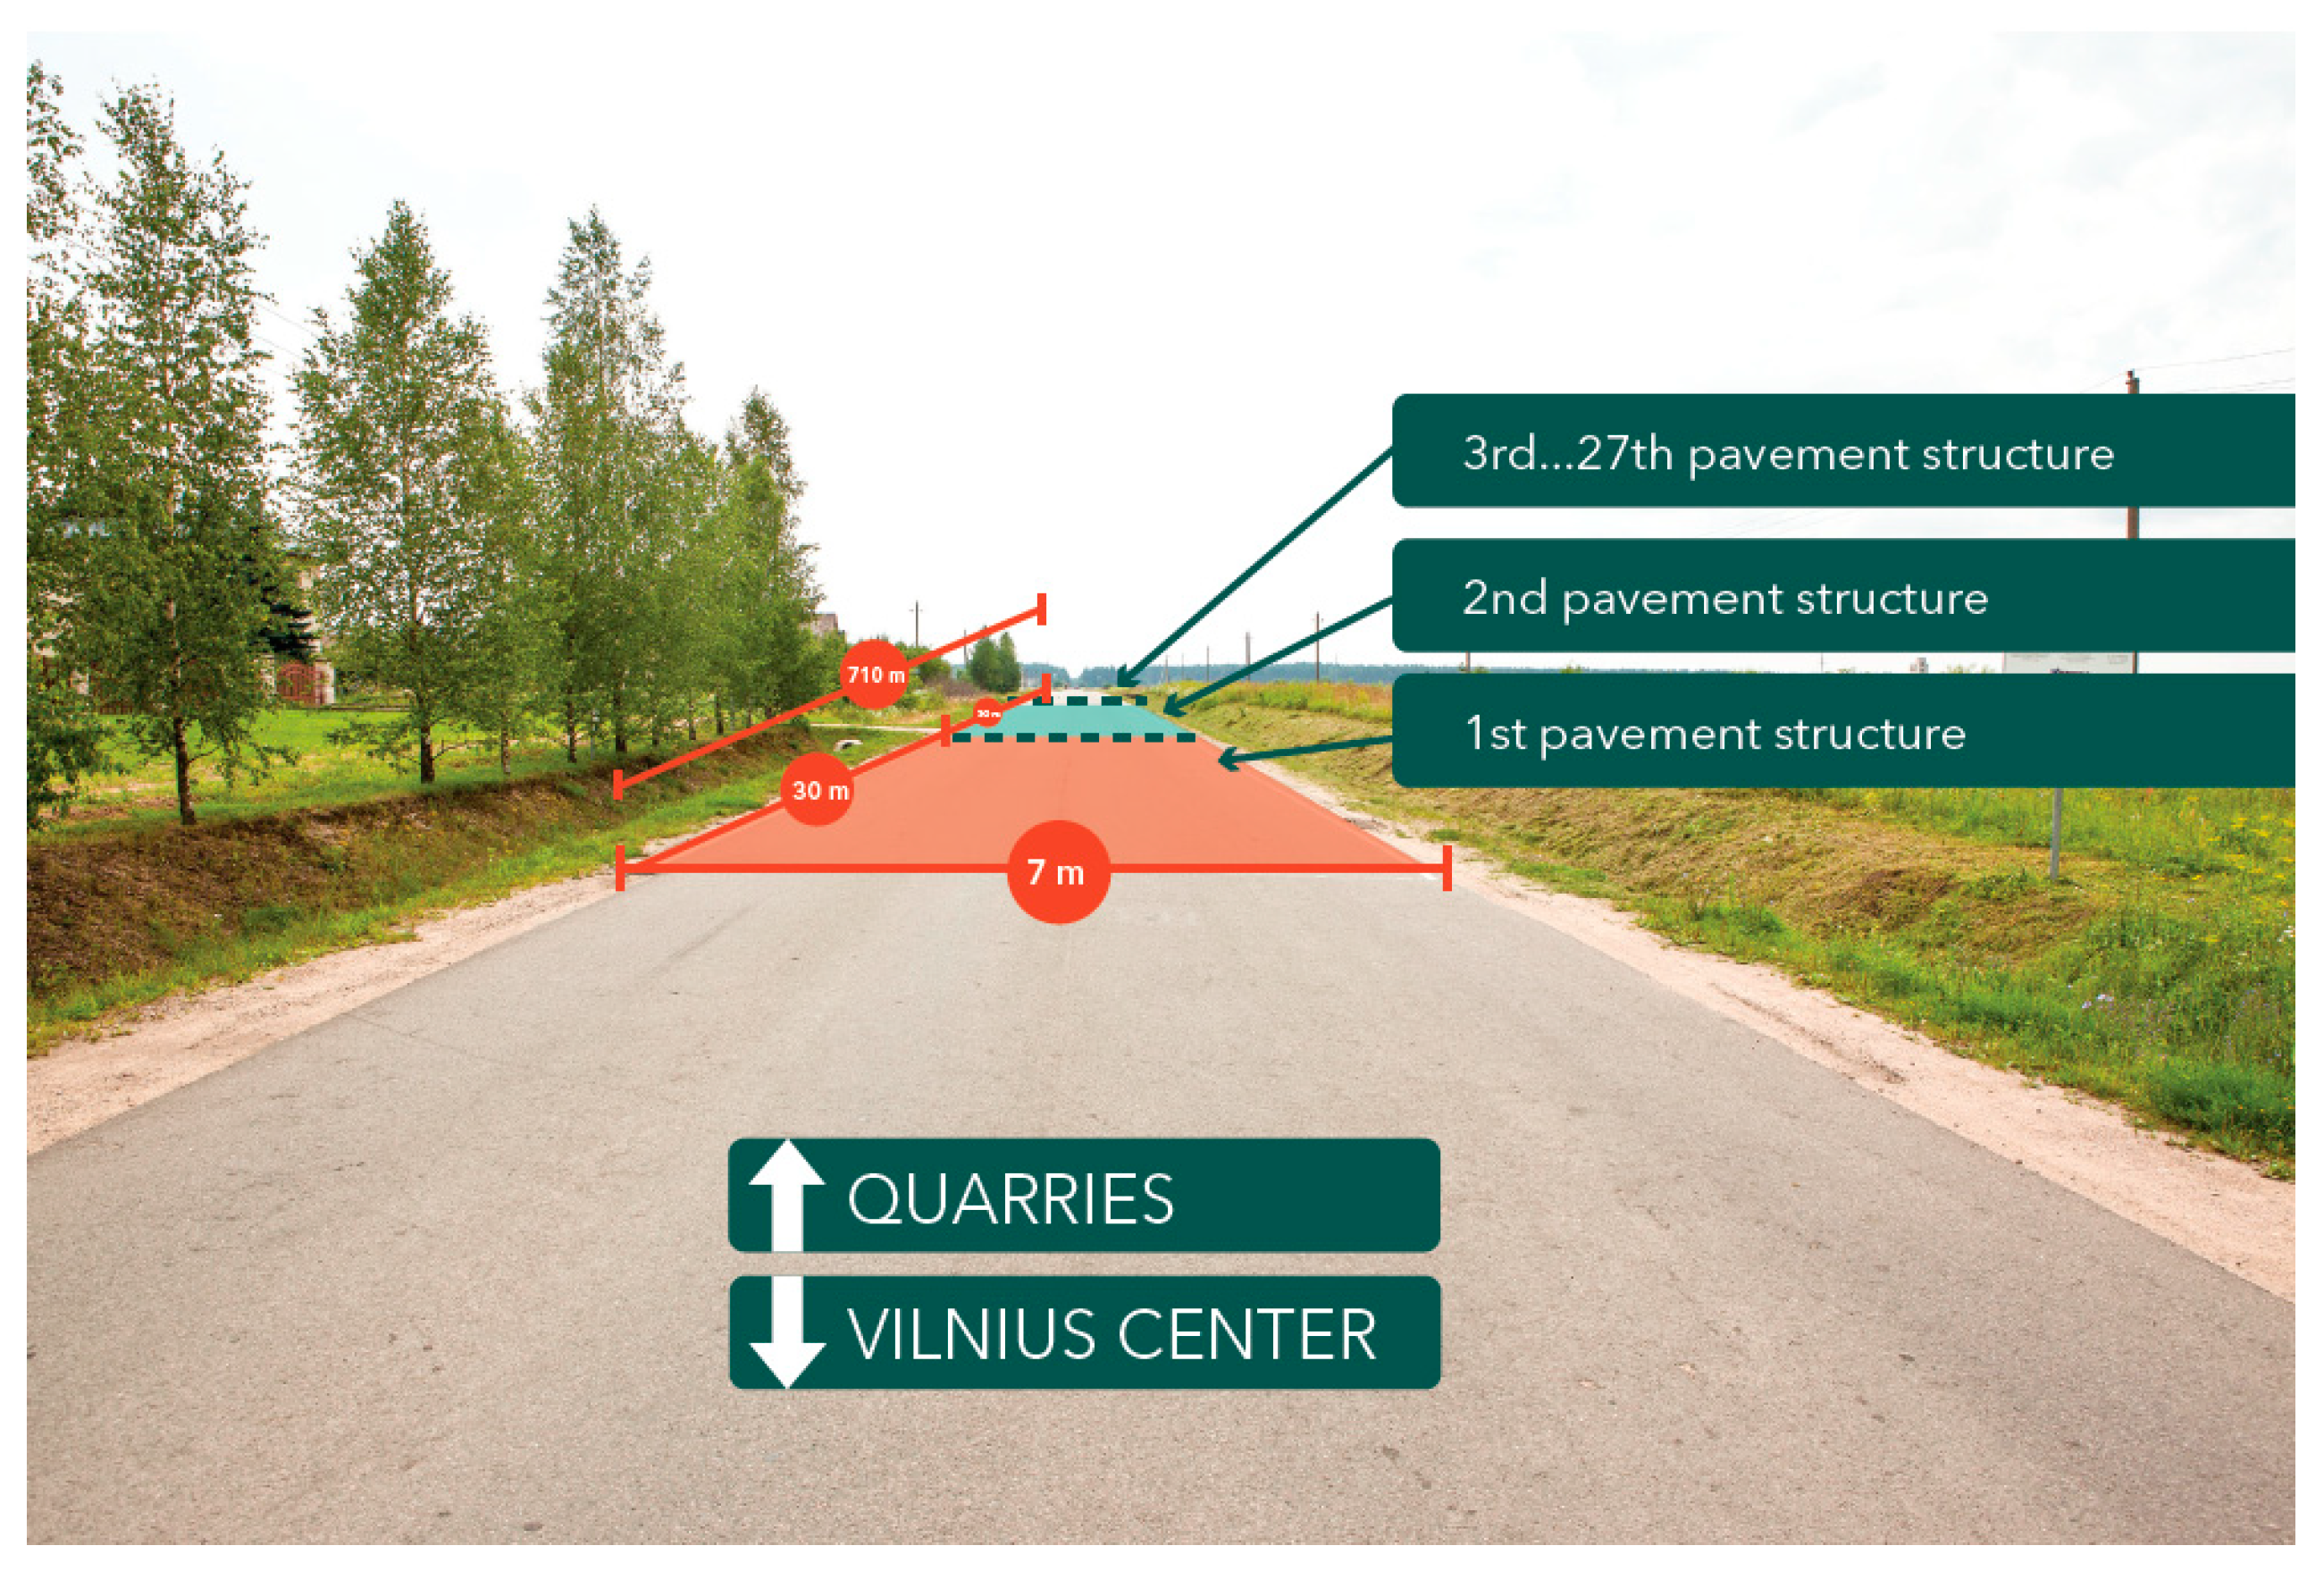
The location in Pagiriai (around 20 km from Vilnius, the capital city of Lithuania) was selected for constructing the Test Road section (Figure 1 and Figure 2). The location fulfills all conditions required for the experiment: it has a sufficient heavy traffic volume, is located in an open terrain, has no horizontal plan curves or vertical curves in the longitudinal section, and distinguished by the same humidity conditions within the whole route of the road section. The road leads to gravel quarries where one traffic line is used by loaded and another by unloaded traffic [17,18,19].
According to Technical Construction Regulation STR 2.06.03:2001 Automobile Roads, parameters for the transverse profile of the Test Road correspond to the 3rd category (2 traffic lanes, pavement width—7 m, and roadside width—1 m) and the 3rd class of the PS (ESAL of 100 kN = (0.8–3.0 million). The length of the Test Road makes 710 m in total and consists of 27 different PSs [17,18,19].
Various materials were used for a number of the layers of the Test Road structures (Table 1). The thickness of every PS was selected according to the reference PS made of 4 cm asphalt wearing course AC 11, 4 cm asphalt binder course AC 16, 10 cm asphalt base course AC 32, a 20 cm base course produced of crushed dolomite (0/56) and a 47 cm frost blanket course produced of sand (0/11) (No. 19). Asphalt wearing course include AC 11, SMA 11, SMA 11 PMB (polymer-modified bitumen), and Confalt, where AC 11 is an asphalt wearing course affected by heavy loads; AC16—an asphalt binder course affected by heavy loads, AC 32—an asphalt base course affected by heavy loads, and SMA 11 PMB—stone mastic asphalt wearing course with polymer-modified bitumen and affected by heavy loads [17,18,19].
Bitumen types B 70/100 (in PSs No. 1–8, No. 10 and No. 13–27) and PMB 45/80-55 (in PS No. 11–12) were used for the asphalt wearing course, B 50/70 (in PSs No. 1–10 and No. 12–27) and PMB 45/80-55 (in PS No. 11) were used for the asphalt binder course, and B 50/70 (in PSs No. 1–27) was used for the asphalt base course. The resistance to fragmentation category (Sz) of the aggregates (crushed gravel, dolomite, and granite) used for installation of asphalt layers corresponds to Sz18, Sz22, and Sz26. The values of the resistance to fragmentation of aggregates used during installation were, respectively, set [21] at a maximum of 17% to crushed granite, 21.6% to crushed dolomite, and 22.3% to crushed gravel.
3. Test Plan and Methods
The paper presents the results of measuring different pavement structures (Figure 3).
Traffic data have been collected continuously since 17 October 2007 using in-road traffic sensors (inductive loops) and vehicle classifier (Loop Profiler). The system is installed at the beginning of the Test Road. The vehicle classifier records data of every detected vehicle and classifies it to one of 10 classes (established by the manufacturer—motorcycle, car/light van, car or light van + trailer, heavy van, light goods vehicle, rigid, rigid + trailer, articulated heavy goods vehicles, minibus, and coach). Traffic volume is important in determining more accurate traffic load (ESAL). The ESAL was determined using the 4th power law formula [22]. Lithuanian specifications use a standard 100 kN single axle load. Other value axle loads need to be converted. This study presents ESAL results recalculated based on measured traffic volume (Section 4.1).
Strain sensors (transducers) are installed at the bottom of the asphalt wearing, binder, and base courses and in the middle of each PS [17]. Layout of strain sensors in each PS is the same as in Figure 4. Strain measurements were performed as follows—two-axle vehicle with tandem axle wheels (having a load equal to 50 kN and tire pressure of 0.65 MPa and moving at a speed of 50 km/h) passed through strain sensors. The voltage obtained from the sensor was converted to relative voltage according to the equation specified by the manufacturer [18,19].
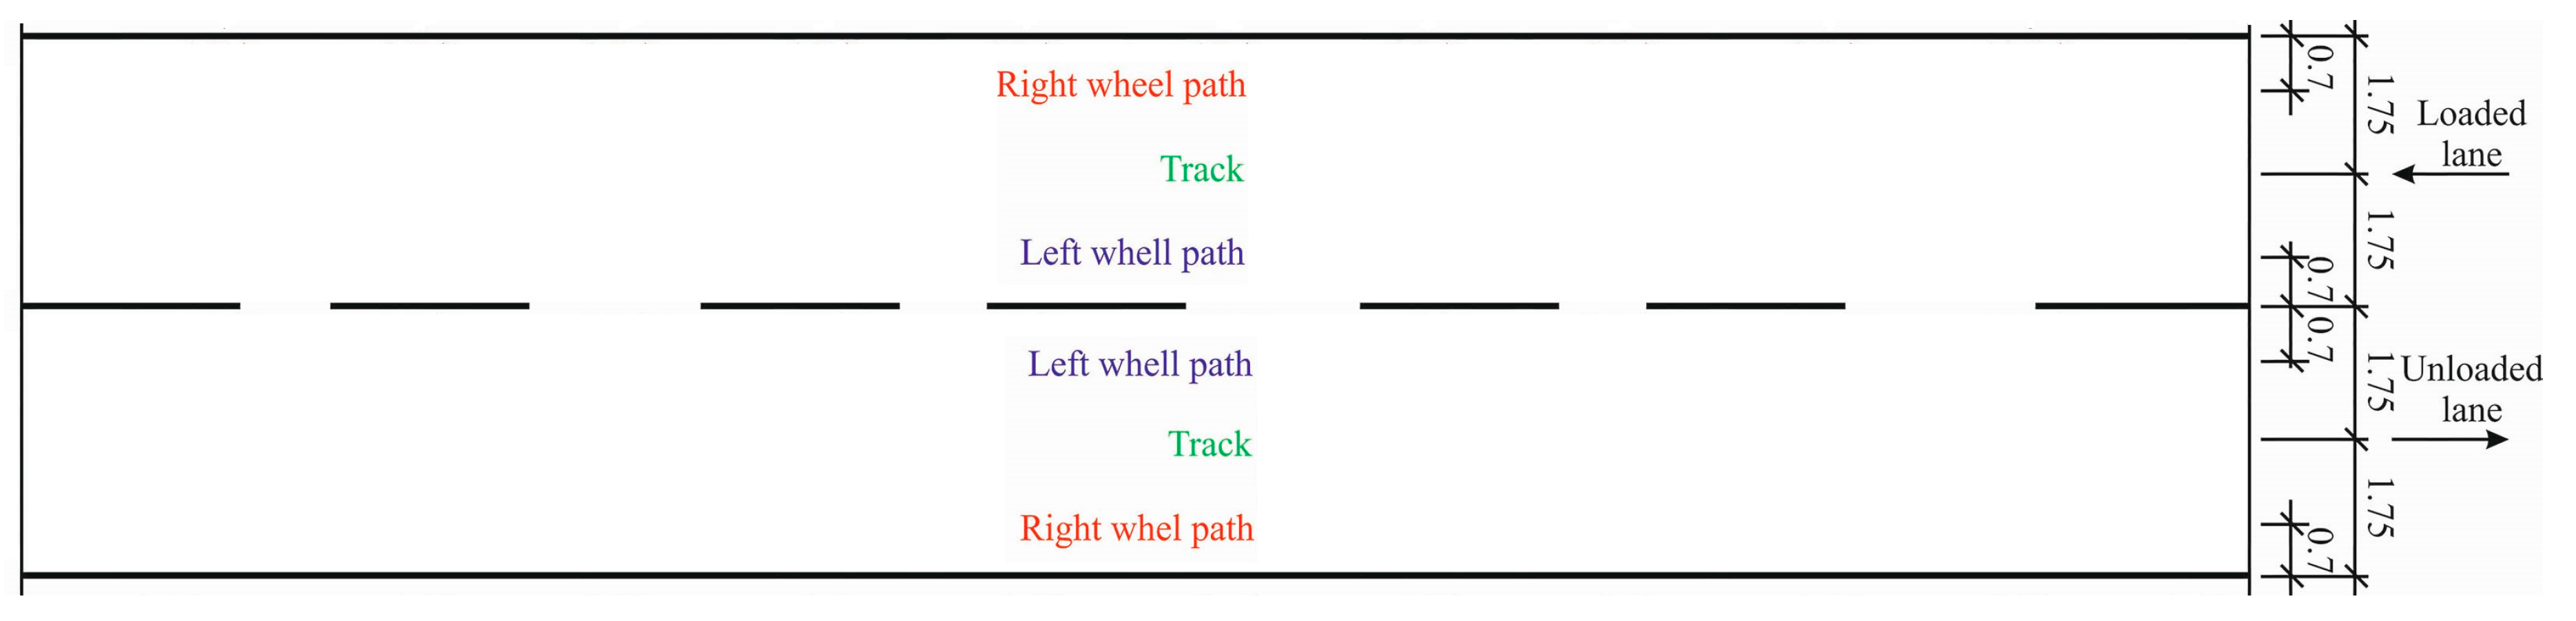
Bearing capacity (E0) was calculated according to formulas given in [6], measured by deflections. Measurements were applied by nondestructive method—FWD (PRIMAX 2500, Sweco, Copenhagen, Denmark). FWD deflection measurements were performed on each PS by measuring 4 points on the right wheel path and track of loaded and unloaded lanes (Figure 5). Measurements were performed at a distance 5, 11, 19, and 25 m in right wheel path (and 0.7 m from the shoulder) and 8, 13, 17, and 22 m in track from the beginning of each PS (Figure 2 and Figure 5). E0 was calculated by the measured deflection reduced to 50 kN load and a standard temperature of +20 °C [6].
Road pavement parameters (as rut depth) were measured using mobile laboratory RST-28. Rut depth measurements were performed every 1 m in right and left wheel paths of loaded and unloaded lanes (Figure 5). A total of 30 values for each rut of the PS. The average depth of the right and left rut was calculated for each PS of loaded and unloaded lanes (Section 4.3).
The above studies were conducted twice a year in each PS and in both lanes from 2007 to 2018. A huge amount of data were accumulated. Accordingly, the analysis focused on measurements in autumn 2007 (at the beginning of the Test Road exploitation), 2008 (following 1 year of exploitation), 2009 (following 2 years of exploitation), and 2018 (following 11 years of exploitation). Road behavior was observed during the first year of material compaction and followed by changes after 11 years of operation.
4. Results
4.1. Heavy Traffic Volume and the ESAL
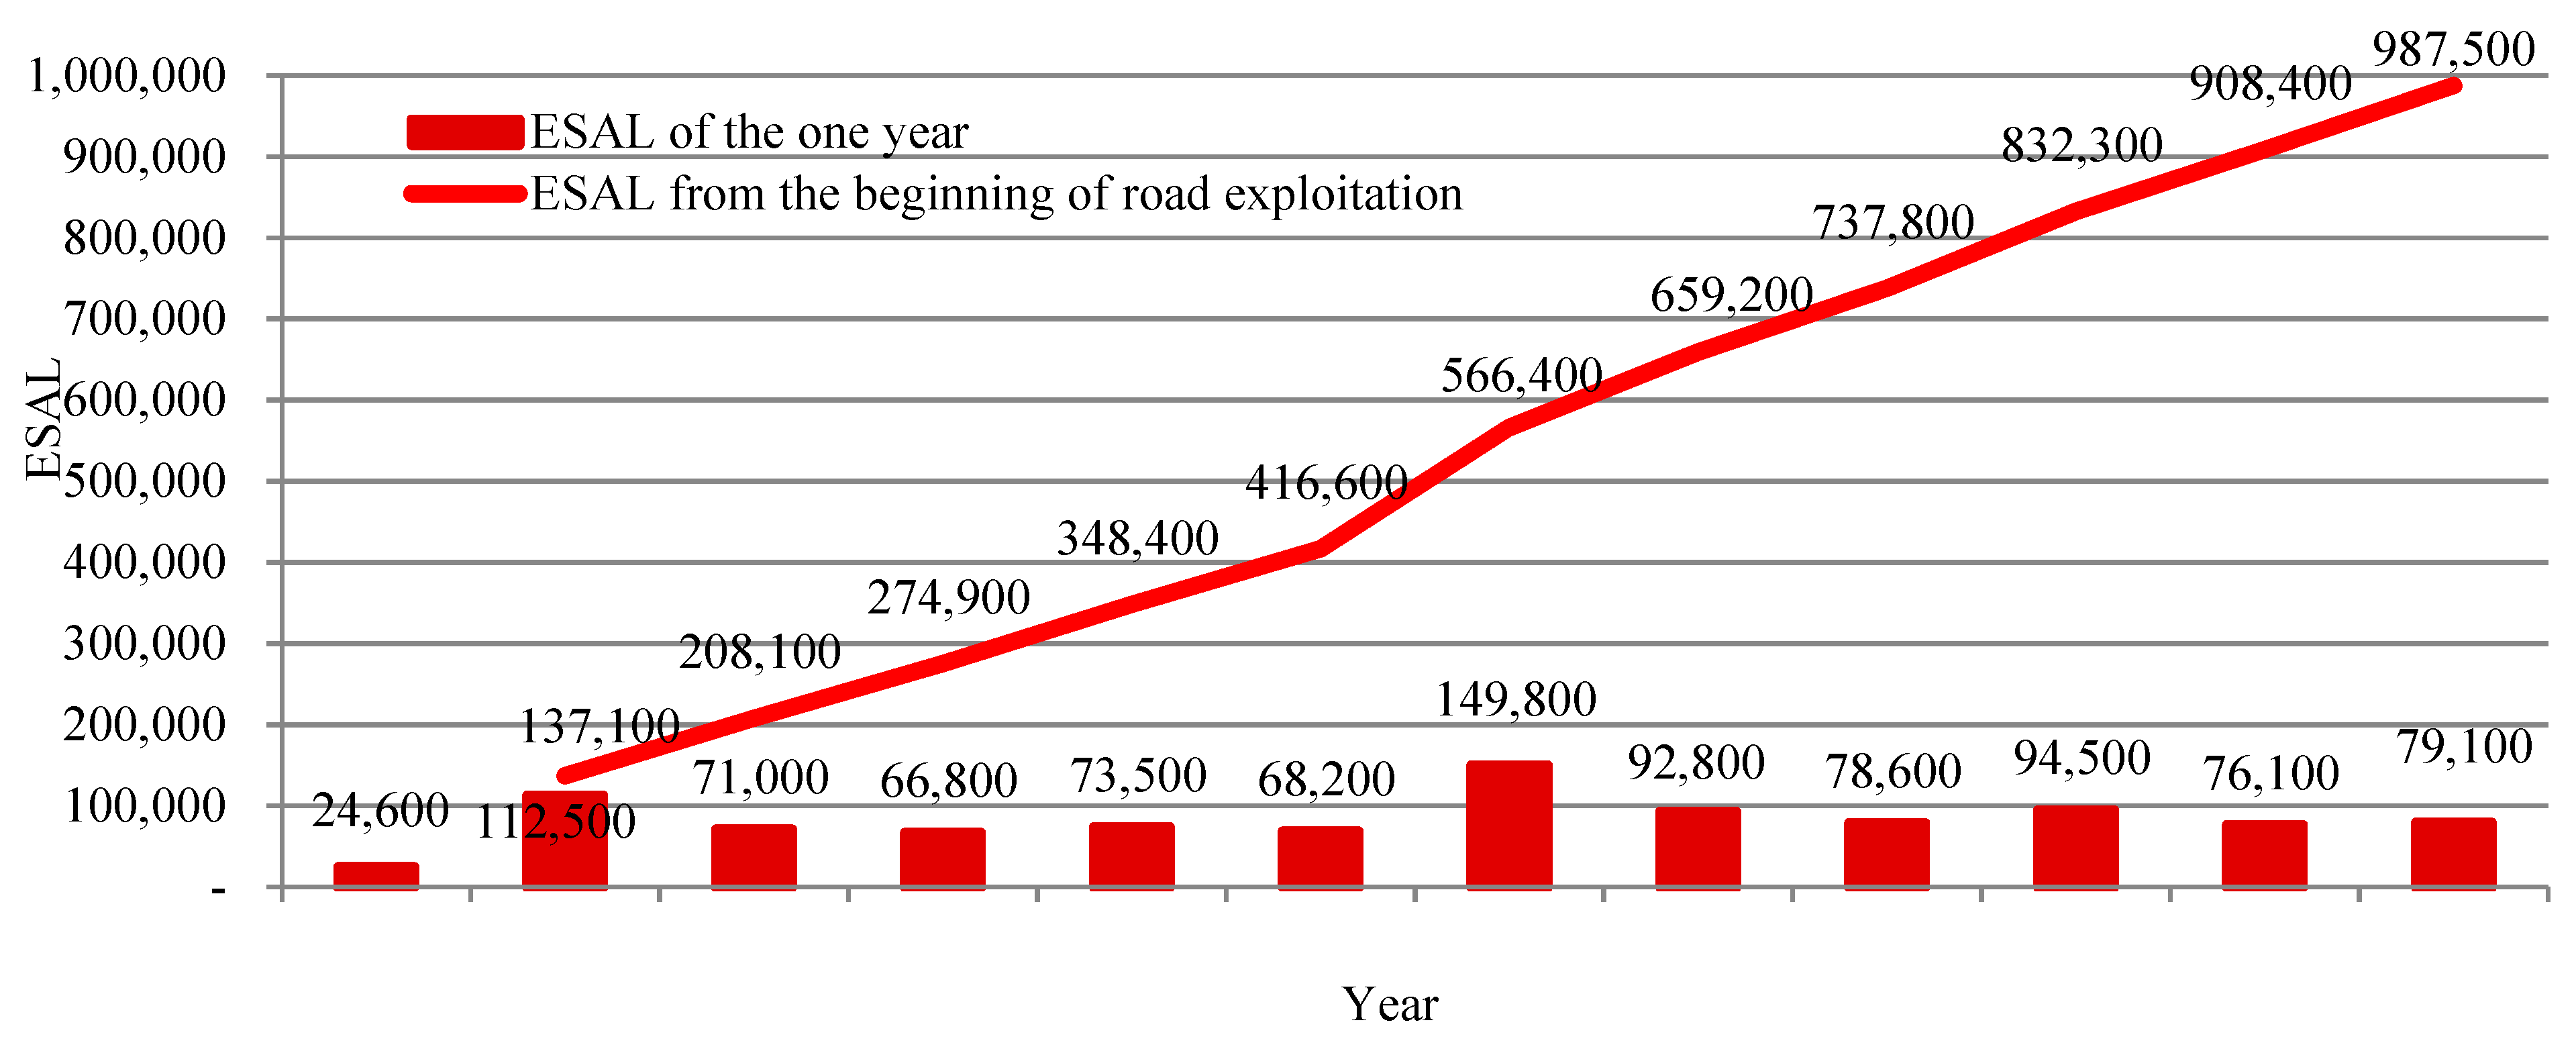
During the 11 years of operation, 5.63 million vehicles passed the Test Road in that number 1.07 million vehicles consisted of the heavy volume. The average number of heavy vehicles passing through each year was 90,000 ESAL, and the total ESAL to the end of 2018 was 987,900 (Figure 6). It is noticeable that ESAL of heavy vehicles was slightly more than doubled in 2013. This was due to extremely large construction projects nearby, which involved transport of construction materials from two quarries located outside the Test Road.
The projected critical number is 3.0 million. A critical 3.0 million ESAL is expected to be reached in the 20th–22nd year of the Test Road operation.
4.2. Strains in the Asphalt Base Course
Climate, including weather and pavement temperature, different seasons, and moisture content of bulk materials in layers, have a significant effect on strain measurement results. These factors are very important in measuring strain s. Strain measurements were performed under the asphalt surface temperatures of +5.0 and +48.0 °C for the period of 2007–2018.
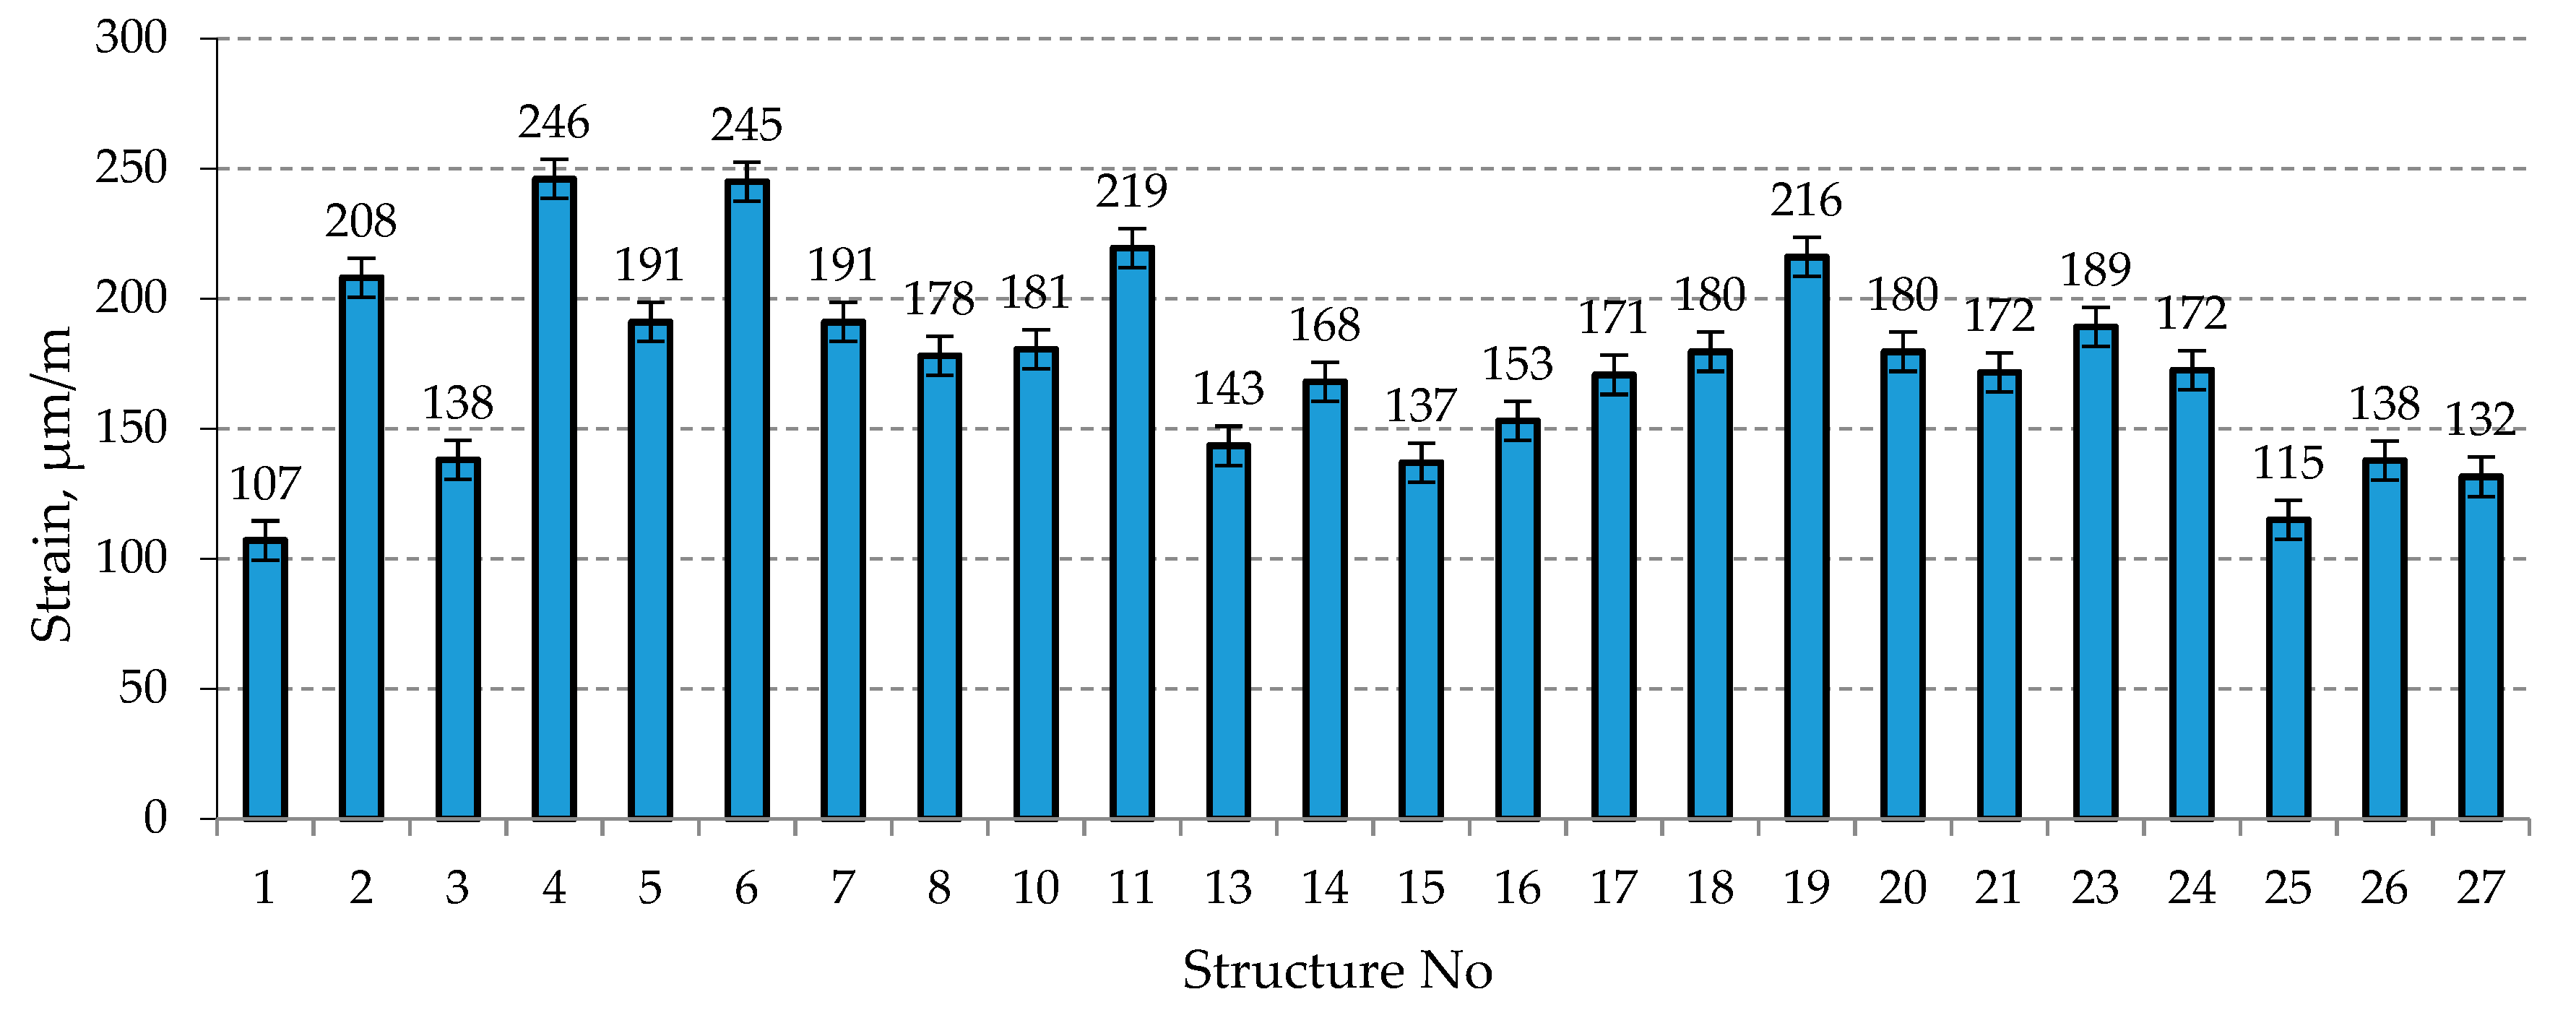
The highest strain values of PSs asphalt base courses were determined during the first year of operation of the Test Road (in 2008, when the temperature of the asphalt surface was +27.5 °C and higher). Higher strain values (exceeding 150 µm/m) were determined at the asphalt surface temperature of ≥+23.0 °C in each PS.
The highest strain values of PS asphalt base courses (Figure 7) were determined in PS No. 2 (208 µm/m), No. 4 (246 µm/m), No. 6 (245 µm/m), and No. 11 (219 µm/m). The lowest strain values of PS asphalt base courses (Figure 7) were established in PS with thicker asphalt layers (22 cm in total), i.e., No. 1 (107 µm/m) and No. 25 (115 µm/m, PS with a geosynthetics (20/20 kN/m) between sub-base and frost blanket course).
4.3. Increment of Bearing Capacity
Bearing capacity and its specific numerical value are accepted as the main indicators of PS durability. It ensures the resistance of the PS to the effects of traffic loads.
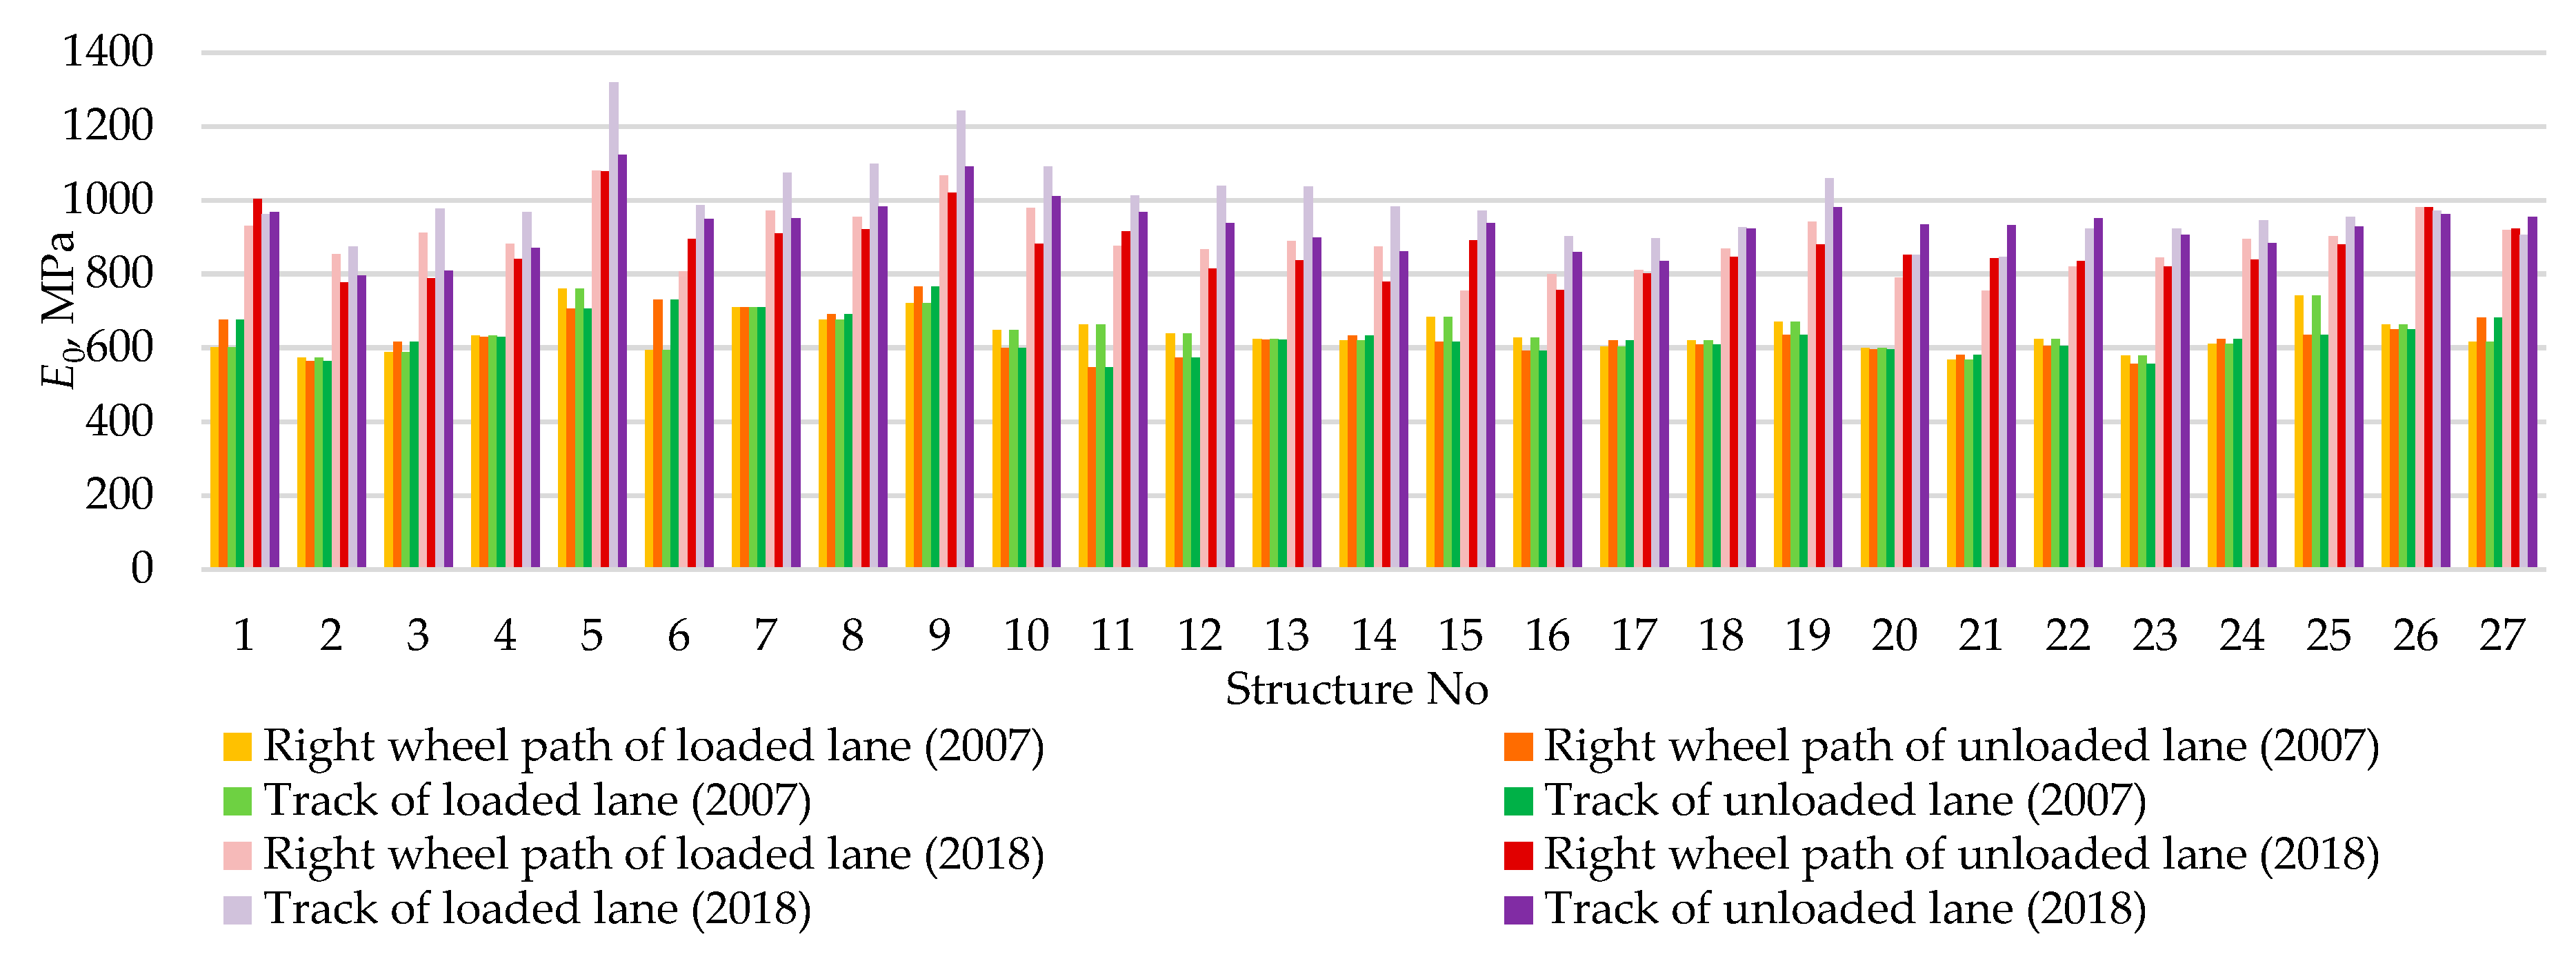
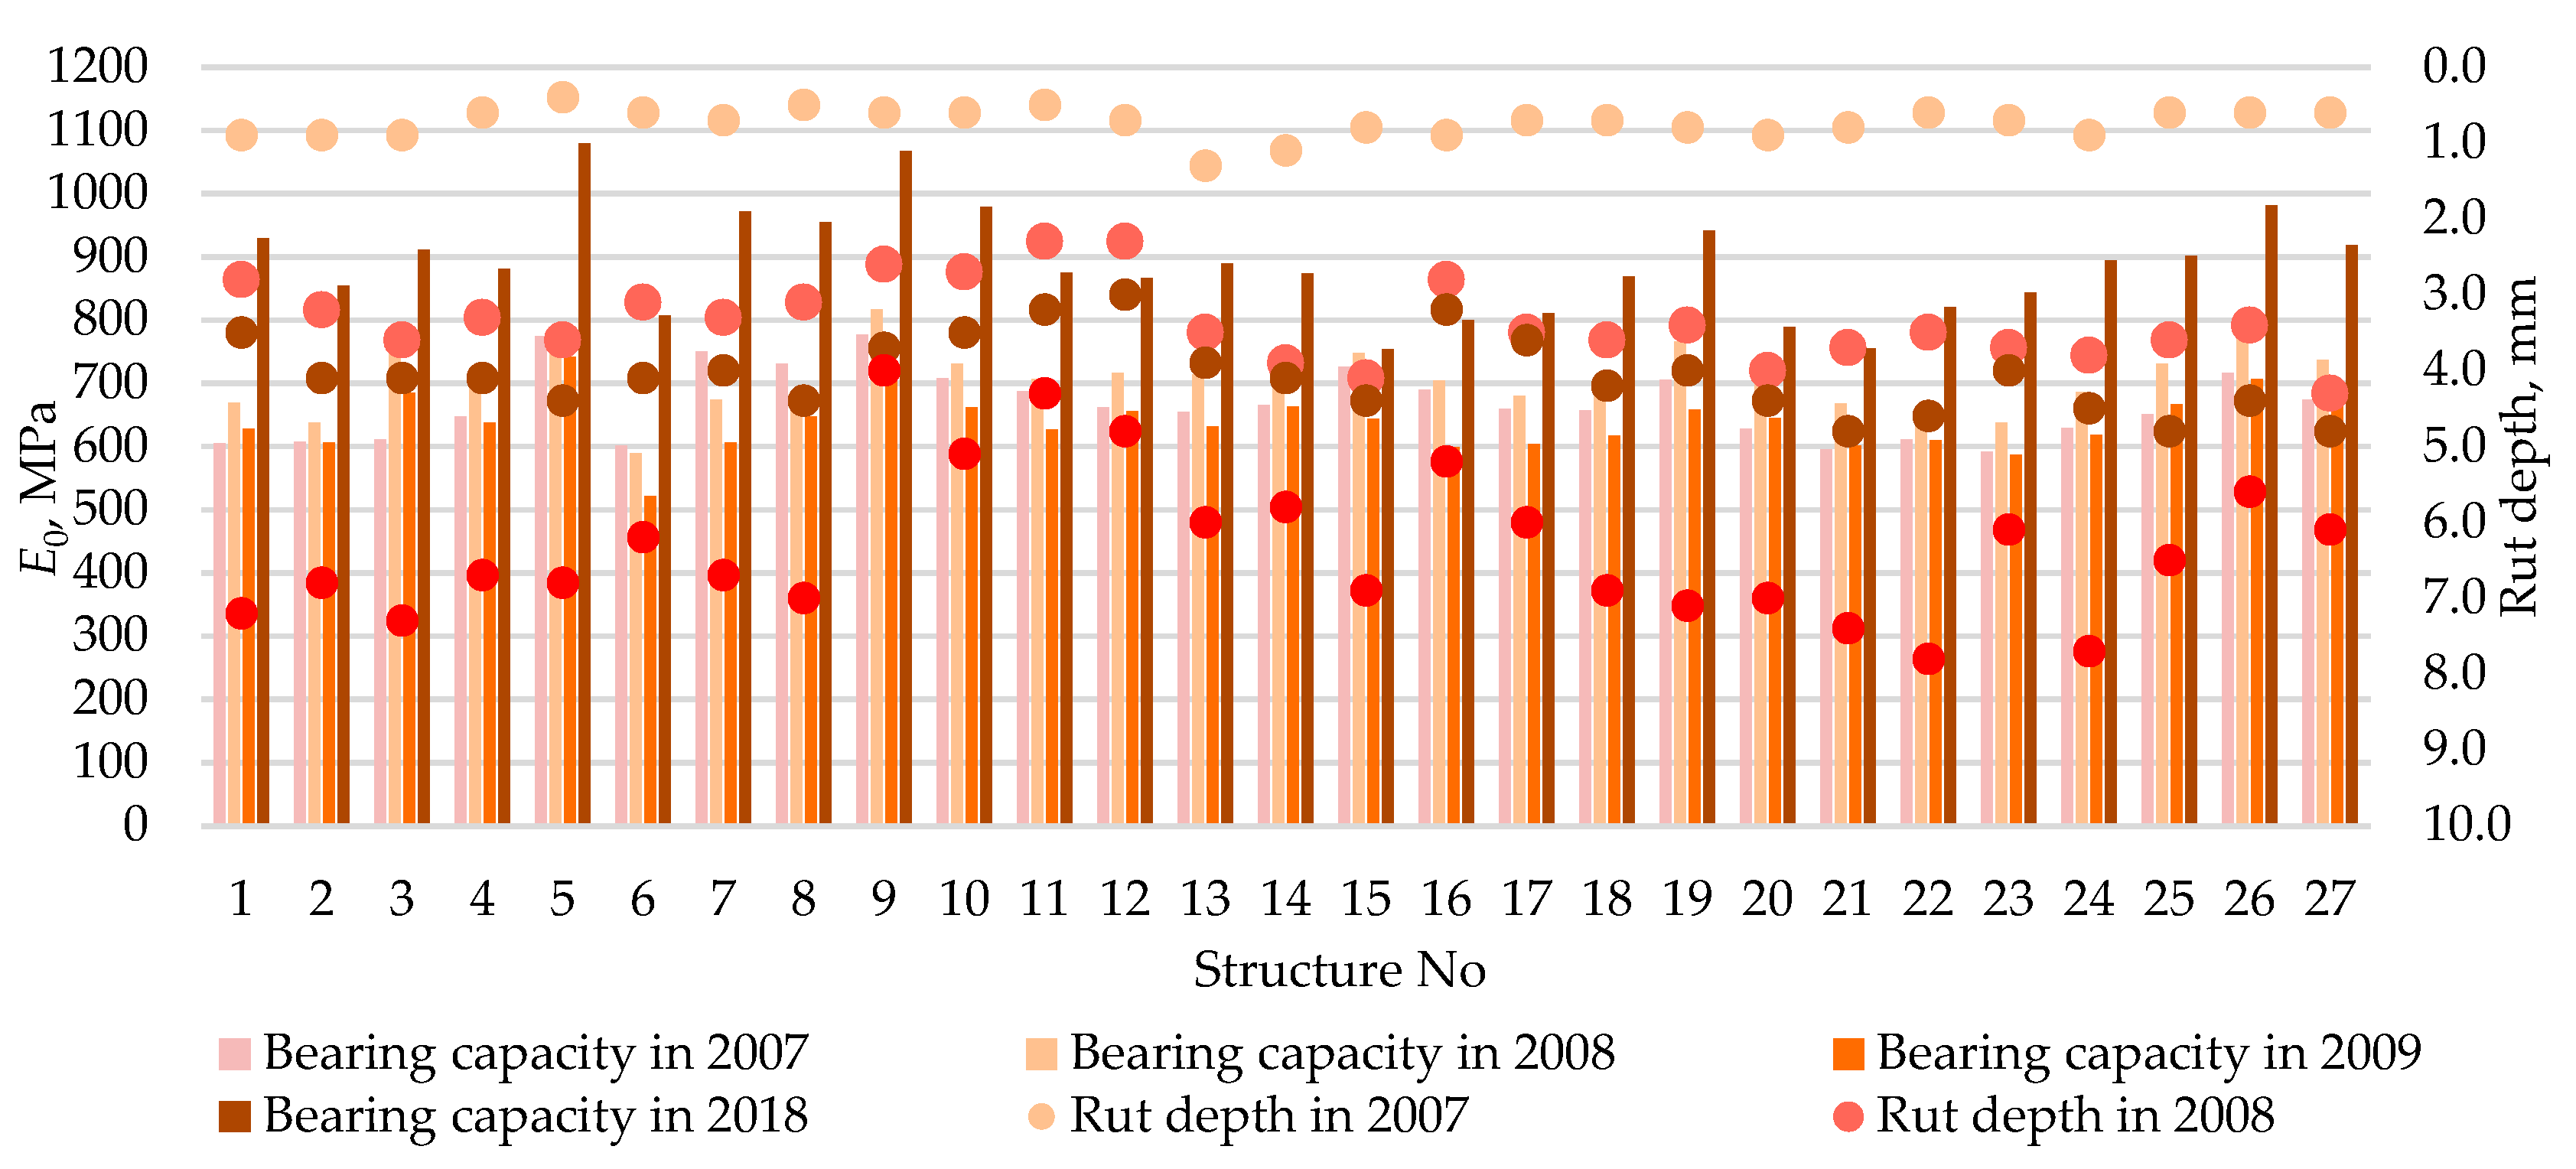
The bearing capacity analysis was performed based on the average right wheel path and track input data provided in Table 2 and Figure 8. The analysis was performed by comparison:
- data on the LLRWP and ULRWP of each PS;
- data on the LLT and ULT of each PS;
- data on the LLT and LLRWP of each PS;
- data on the ULT and ULRWP of each PS.
The bearing capacity of PSs were found to be lower in most LLRWP of different PSs (up to 23% in 2007, up to 16% in 2008, up to 30% in 2009, and up to 18% in 2018) than those in ULRWP. The findings of LLRWP were found by 7%–11% (2008–2018) lower than those in LLT. When the bearing capacity of LLRWP was found to be on average 21% lower than that of ULRWP, analysis of further experimental studies is performed by data of LLRWP. It follows that traffic loads that were constantly changing affected measured inputs. Heavy vehicles driving to quarries (by unloaded lane) caused less negative impact (bearing capacity results were higher) on PSs than those turning from quarries (by loaded lane, where bearing capacity results were lower). The use of different materials (Table 1) in each PS has also a great impact on bearing capacity inputs. Other factors, as temperature and drainage conditions, quality of work during construction period of the Test Road, and etc., were assumed to be constant, when comparing the bearing capacity data between loaded and unloaded lanes of the same PS.
The base course of larger fraction (0/56) crushed aggregate creates conditions for achieving a higher PS bearing capacity of 50 MPa on average than the aggregate base course containing 0/32 gravel-sand mix.
The bearing capacity of all PSs of the Test Road is sufficient for suppressing the effect of traffic loads up to designed load A of 3.0 million. Thus, the established lowest 754 MPa bearing capacity of the PS No. 15 in LLRWT (containing 50% of dolomite aggregate and 50% of fine gravel aggregate in the asphalt binder course) after 11 years of the Test Road exploitation (Figure 8) is accepted as sufficient at a temperature of +20 °C. This PS has no cracks (Figure 9), and the rut depth was determined just up to 7 mm (Figure 10).
PS based on base course of 10 cm aggregate—milled asphalt concrete and 10 cm 0/32 crushed dolomite (No. 5, Table 1) have an average of 15% higher bearing capacity (Figure 8) than other PS. This trend is observed when comparing the annual bearing capacity data.
Given the observed difference between all sections, the results show that traffic volume and load can potentially affect bearing capacity.
4.4. Rut Development
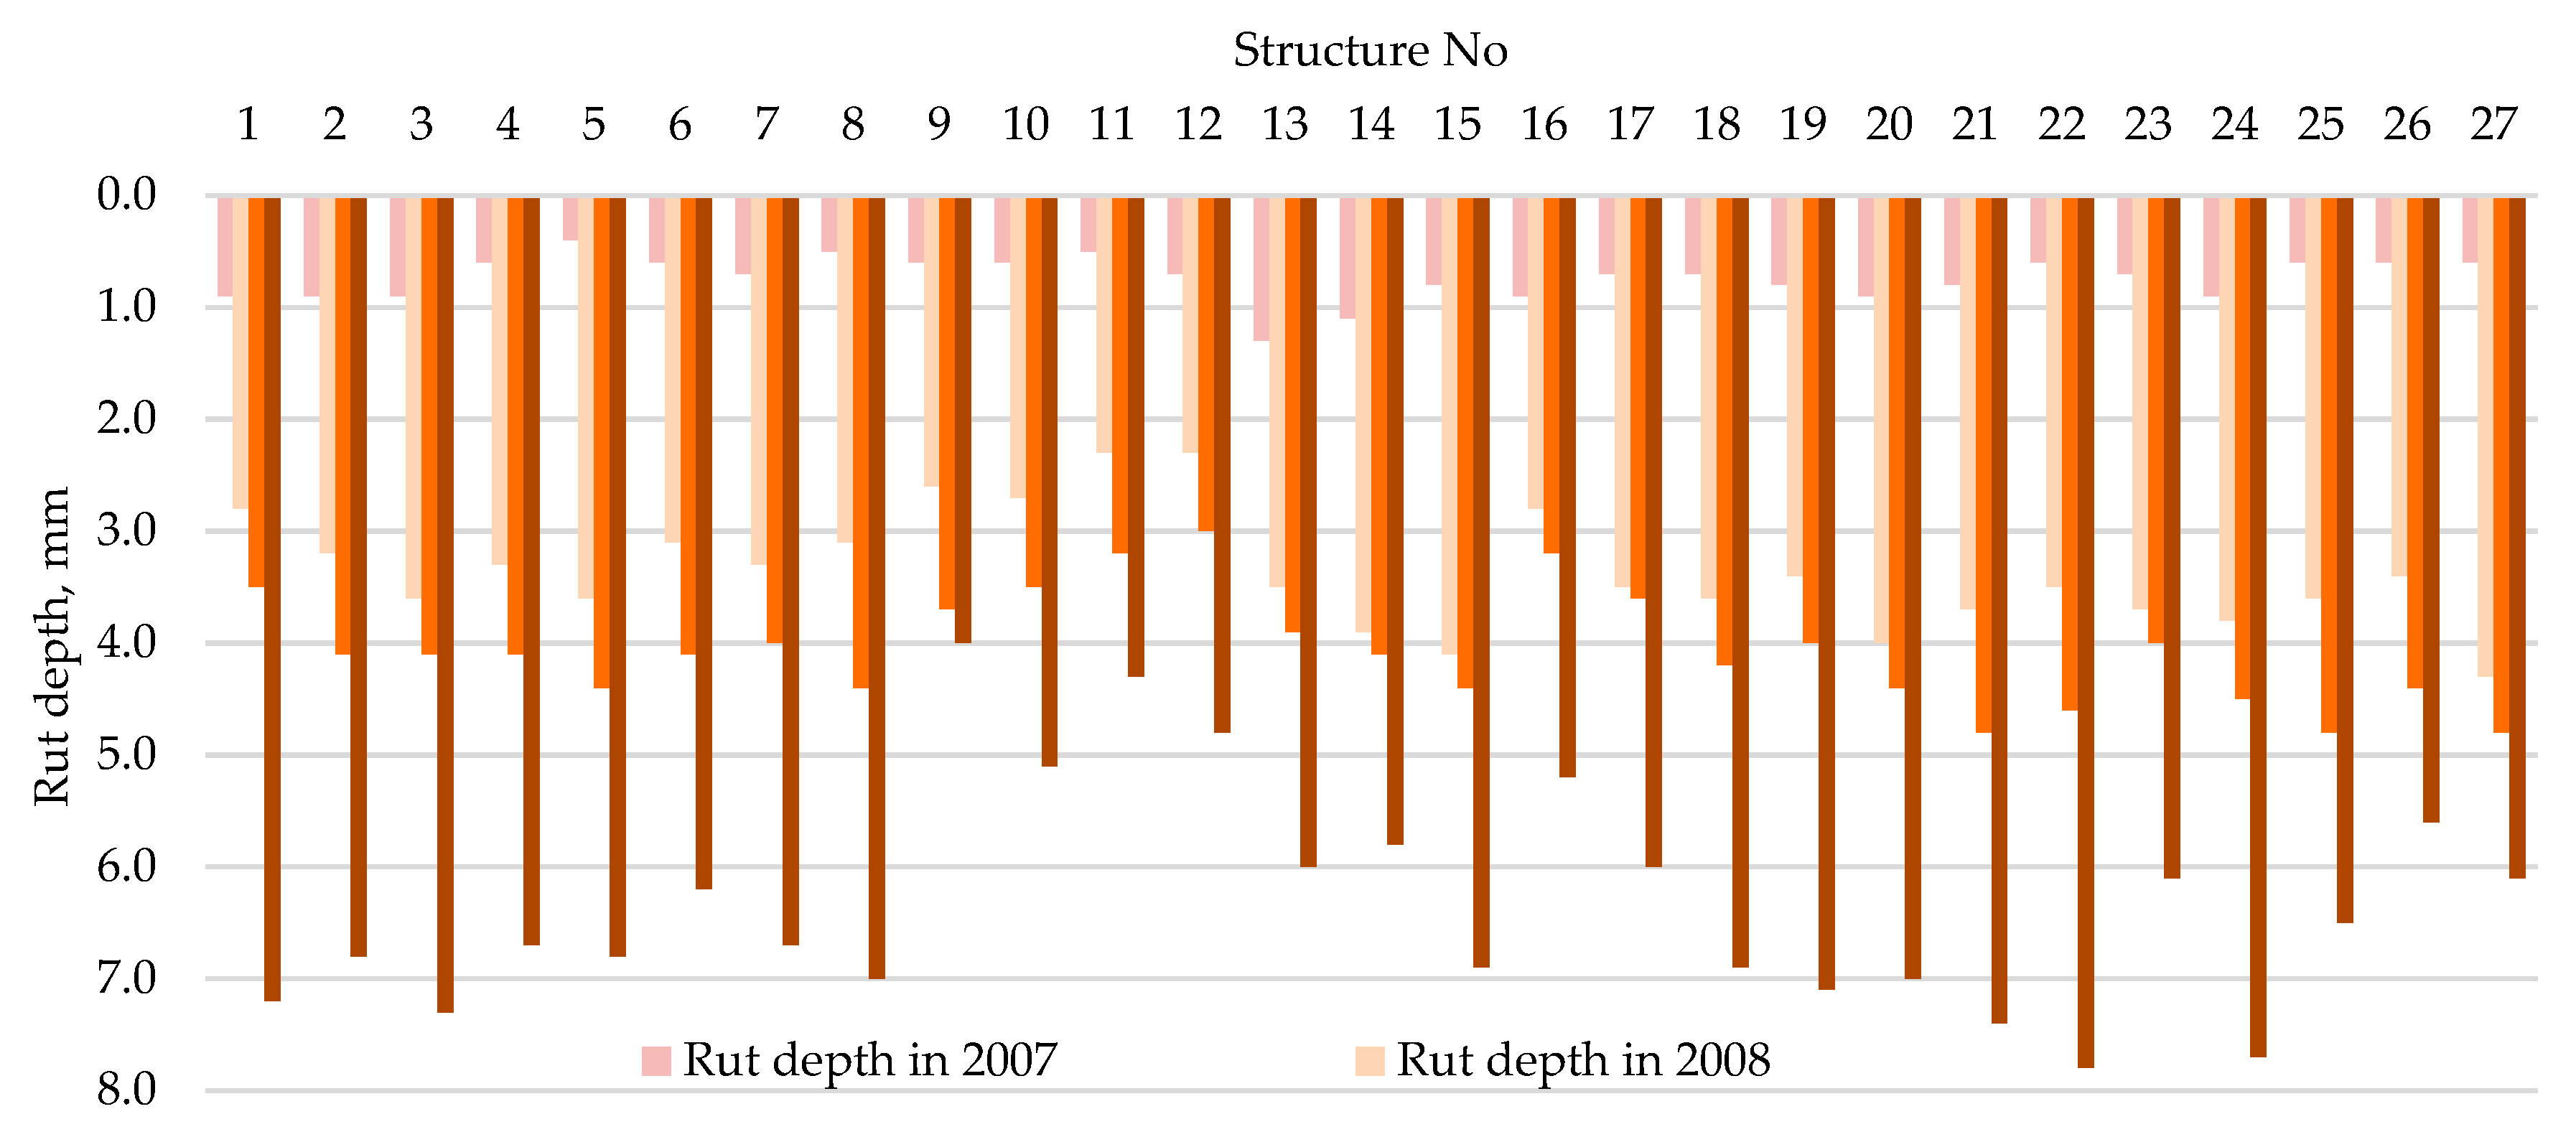
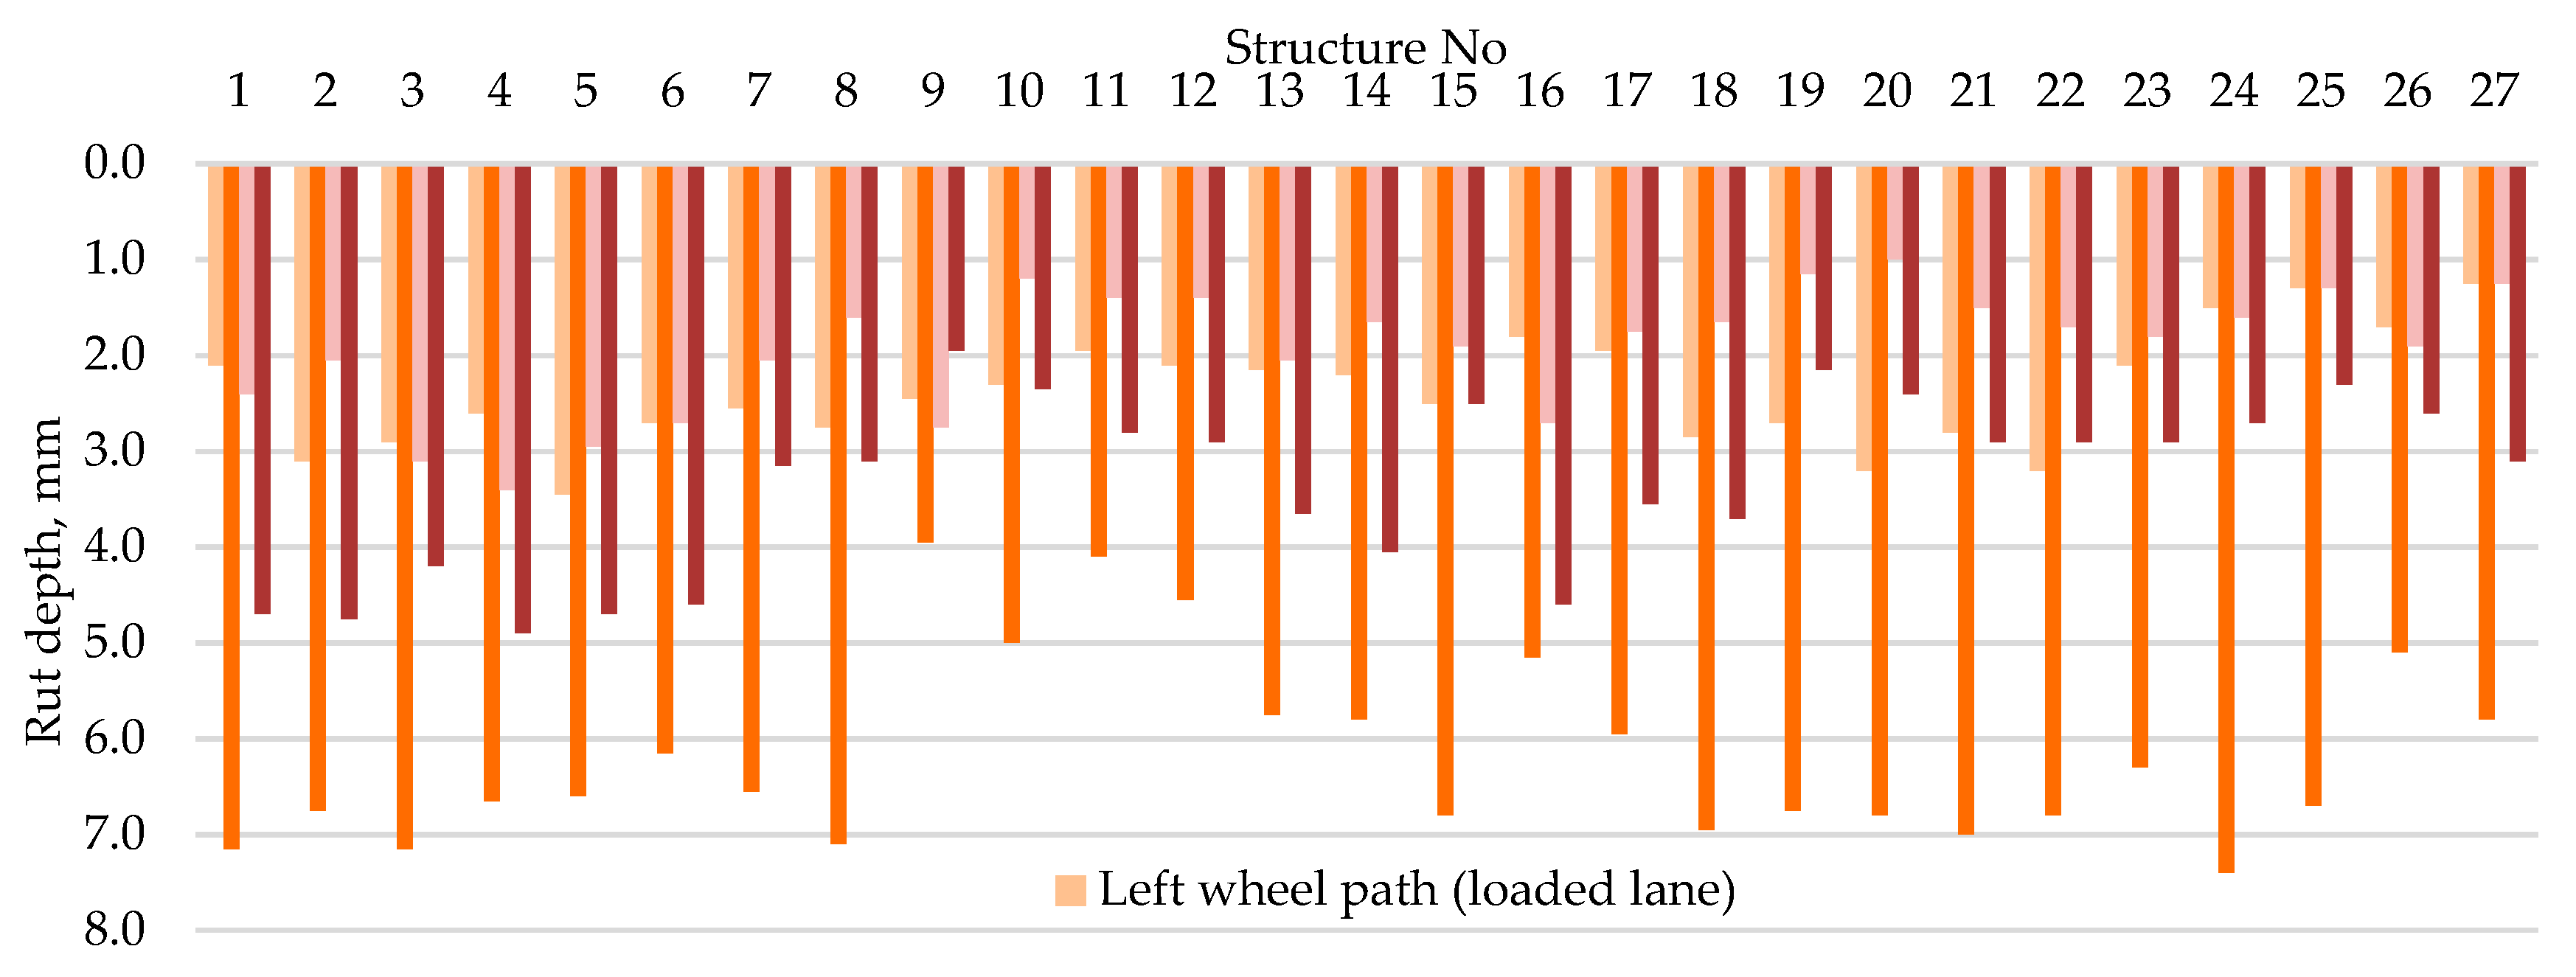
The results of the rutting tests performed by the mobile laboratory RST-28 showed that the rutting depth was less than 1.0 cm during the operation period. The maximum average rut depth was set up to 8.0 mm after 11 years. (Figure 10). After analysis of each PS, the data were compared as follows (Figure 11):
- the average rut depth of LLRWP with the average rut depth of LLLWP;
- the average rut depth of LLRWP with the average rut depth of ULRWP;
- the average rut depth of LLLWP with the average rut depth of ULLWP.
The results in Figure 11 present that the mean LLRWP rut depth was 60%–400% (PS No. 9 and No. 25, respectively) greater than the LLLWP rut depth and 10%–70% (PS No. 16 and No. 19, respectively) greater than the ULRWP rut depth. The average LLLWP rut depth was 5%–70% (PS No. 13 and No. 20, respectively) greater than the ULLWP rut depth (Figure 11). It follows that heavy vehicles driving to quarries (by unloaded lane) were less loaded (rut results were lower) on PSs than those turning from quarries (by loaded lane, where rut results were greater). The use of different materials (Table 1) on each PS has also a great impact on rut depth formation. Other factors were assumed to be constant (Section 4.3).
Following the first year of the road operation, the determined rut depth made 2.0–4.0 mm on average in LLRWP (Figure 11). The measured data (in 2018 autumn) of asphalt wearing course LLRWP rut depth was detected greater on average 3.4 mm (including AC11 asphalt mix) and 2.7 mm (including SMA11 and SMA11 mixed with PMB) since 2007. Subsequently, rut depth increased from 0.1–1.0 mm each year. It was observed that ruts formed during the first year of operation of the Test Road. The depth of ruts formed during the first year was 30%–50% of rut depths set in 2018. This indicates a high material compaction during the first few years of operation and, it can be concluded that the asphalt wearing course may be subject to a higher requirements, i.e., the limit value of the compression ratio should be 98% instead of 97% or for designing the mixes of the asphalt wearing course, Marshall specimens should be formed with a higher number of hits on both sides, i.e., 2 times for 75 hits instead of 2 times for 50 hits.
Plastic deformations were found to be first occurred in the 5th year of road exploitation and were affected by the density of materials and a different composition of PSs. At the 11th year of the Test Road exploitation, the established plastic deformations were higher by 30% on average compared to those of the 5th year (in 2018, the fixed rut depth varied from 4.0 to 7.4 mm, and in 2013—from 2.8 to 5.4 mm).
The formation of the lowest rut depths was mainly influenced by the asphalt wearing course constructed from Confalt, SMA, and SMA with PMB), and the asphalt binder course made of AC16, AC16 containing PMB, AC16 and a mix of 50% of crushed granite and 50% of sand, asphalt base course AC32 embracing 100% of crushed gravel, and a base course produced of a mix of 0/56 crushed dolomite were applied.
The highest rut depths were found in PSs that did not employ PMB, i.e., (AC11), the asphalt binder course made of AC16 containing 100% of crushed gravel, the crushed gravel base course produced of gravel, sand mix 0/32, a mix of 30 cm thick crushed dolomite 0/56, and crushed granite mix 0/56, where geosynthetic materials were used for reinforcing the asphalt binder course and base course and for separating layers (frost blanket course and base course).
4.5. Statistical Analysis
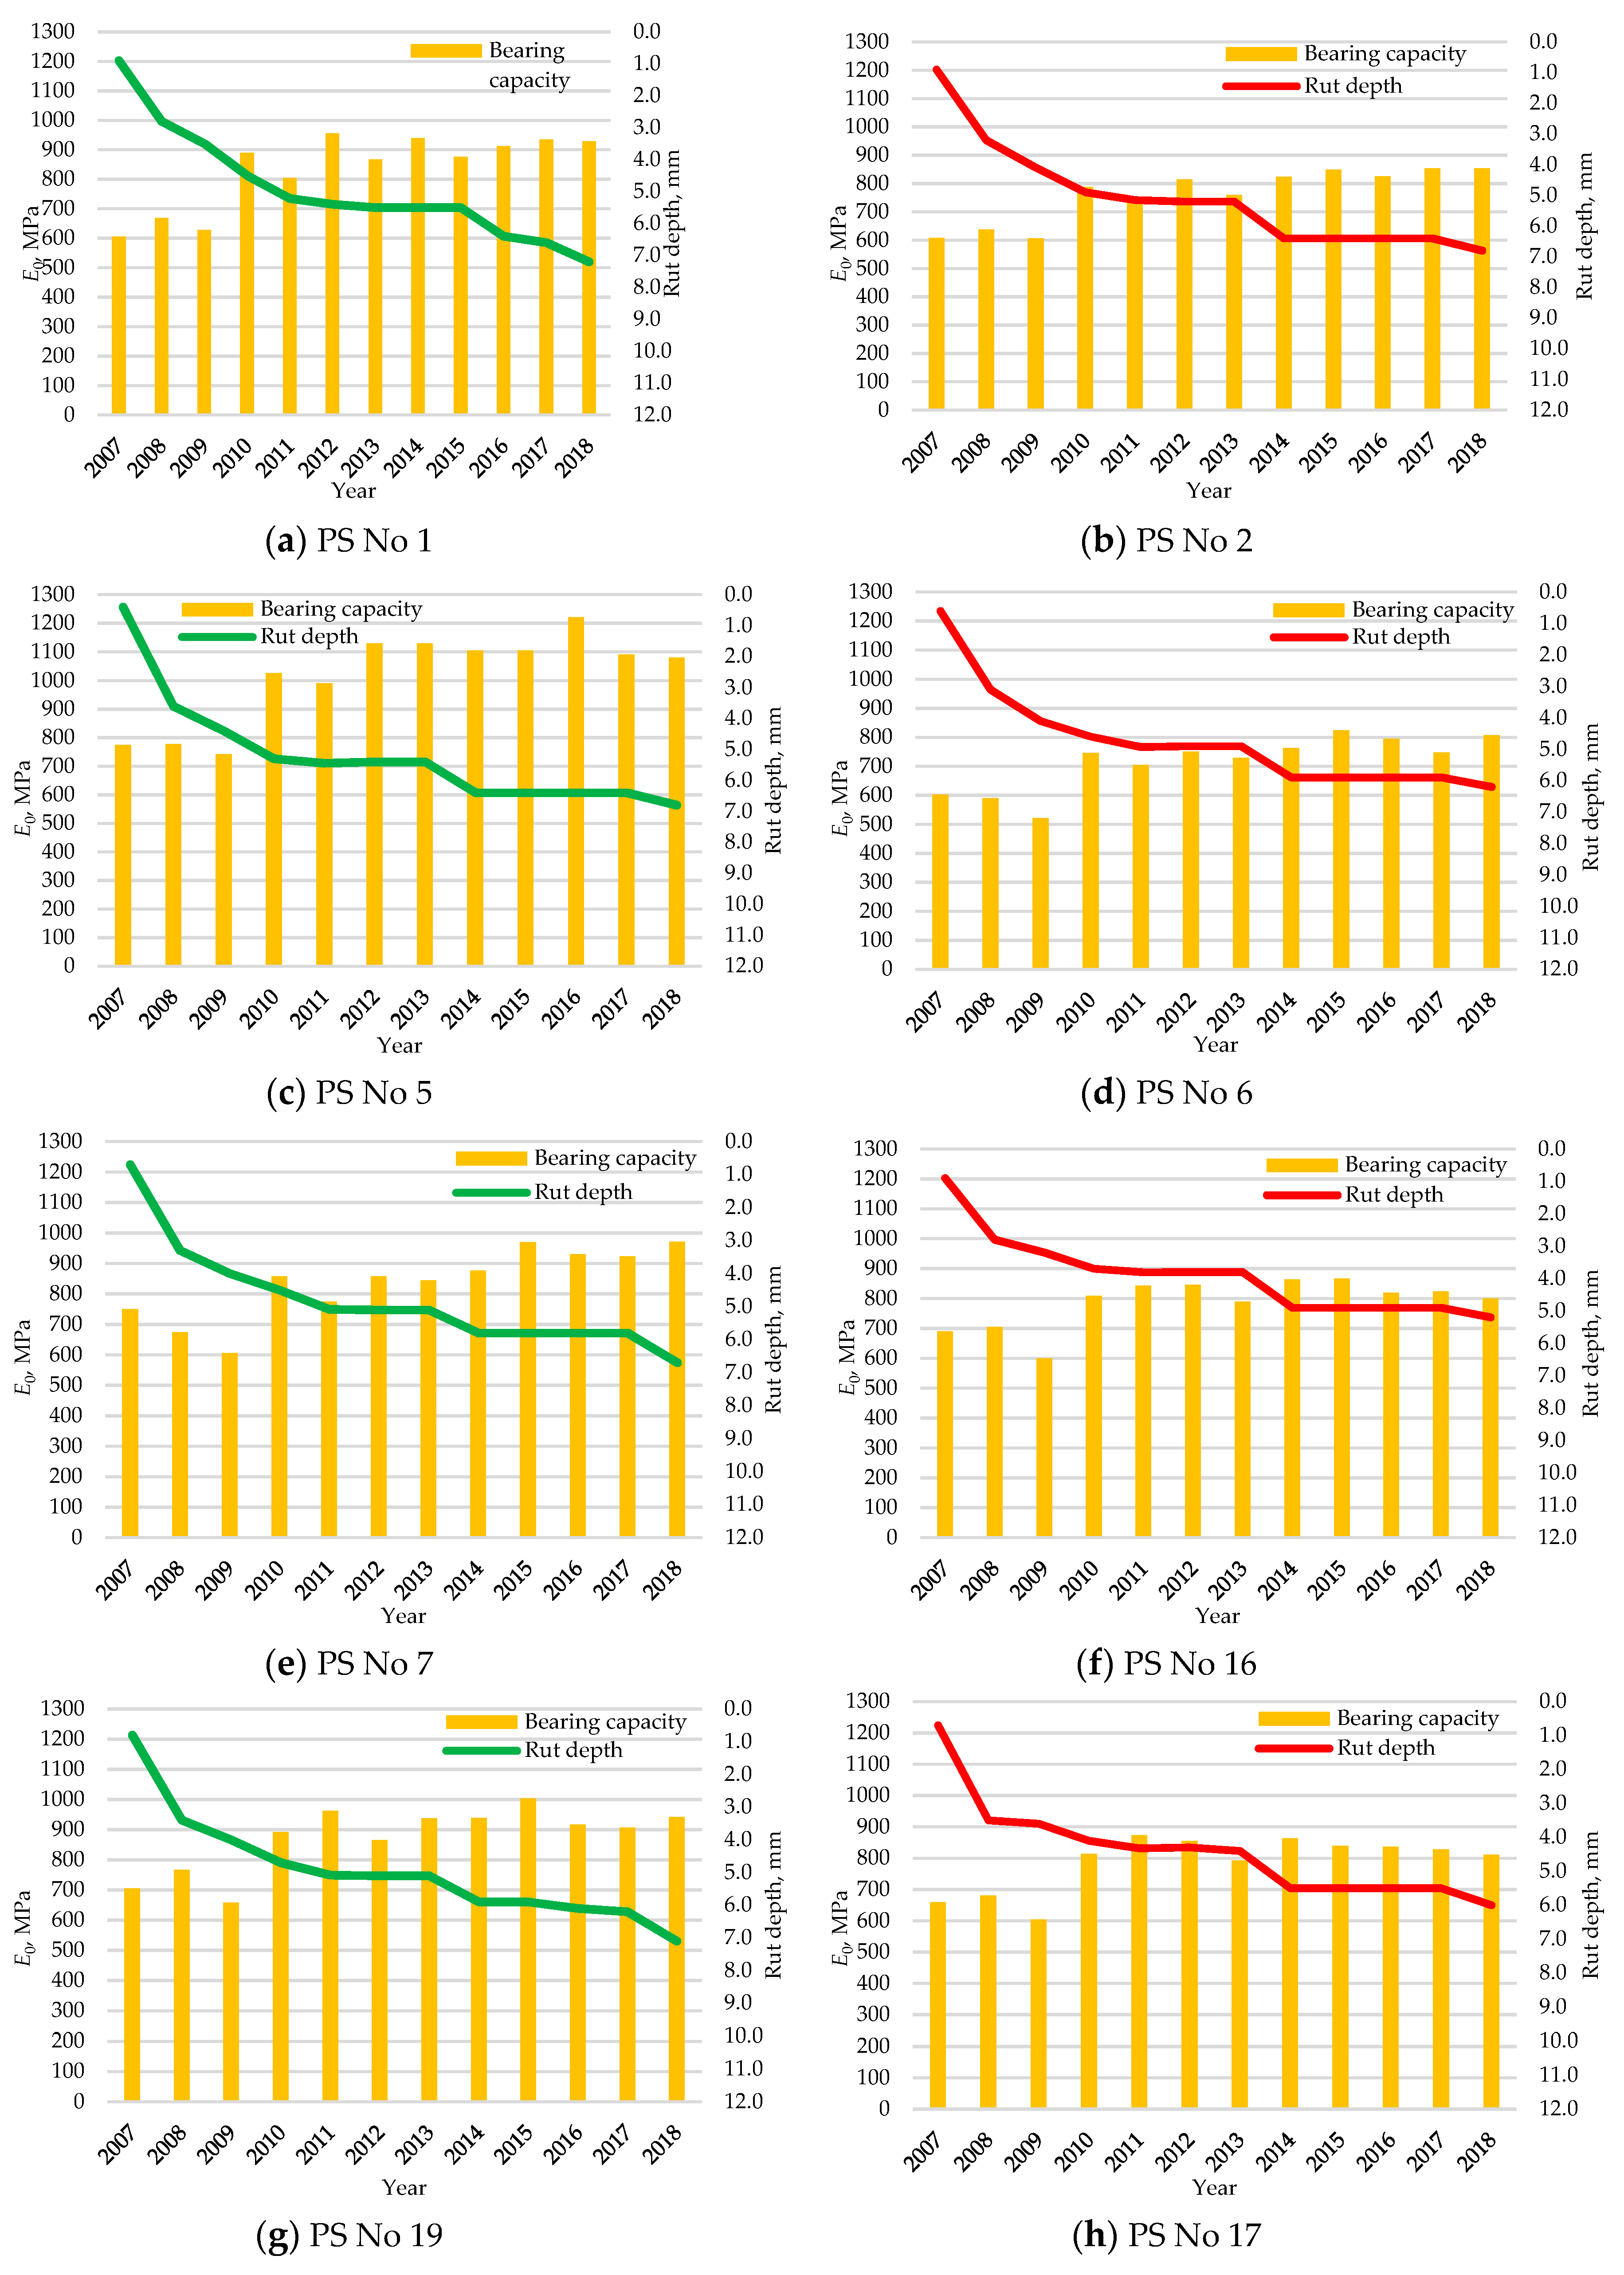
The statistical analysis of the complete measurement results of bearing capacity and rut depth of LLRWP (Figure 12) has distinguished 5 the highest (Figure 13) and 5 the lowest (Figure 13) PSs of bearing capacity. The significance of their assessment was determined for the given indicators, including bearing capacity making 70% and rut depth—30%. The results of bearing capacity were the main criterion for selecting structures.
The difference of E0 modulus between five highest and five lowest bearing capacity results was established up to 20% (average of E0 modulus of the PSs with the highest bearing capacity was 980 MPa in 2018, while with the lowest one was equal to 828 MPa) (Figure 13). The difference of E0 modulus between five highest and five lowest bearing capacity of the structures identified in 2008 was up to 12% (average of E0 modulus of the PSs with the highest bearing capacity was 733 MPa in 2008, while with the lowest one was equal to 660 MPa).
The bearing capacity of the subgrade course, susceptibility to hydrothermal influence, the overall thickness of the PS, and the total thickness of the layers with bituminous binders have the greatest influence on the bearing capacity of the PS [11,21]. Bearing capacity is slightly affected by the unbound base layers and asphalt layers using bituminous binders (Table 1, Figure 12 and Figure 13).
The conducted investigations showed that following 11 years of the Test Road exploiting the structure, the lowest established bearing capacity of 754 MPa hardly affected rut depth, which is clearly evident from Figure 13 showing 5 structures having the highest and 5 structures having the lowest bearing capacity with the resulting rut depth. Meanwhile, in 2007, the initial bearing capacity of the structures was 560–600 MPa (780 MPa at maximum).
As the heavy traffic loads were slightly more than doubled in 2013 (Figure 6, Section 4.1), the average rut depth of LLRWP of each PS deepened up to 1.2 mm (from 5.2 to 6.4 mm, Ps No. 2, Figure 13). Meanwhile, the average rut depth has deepened up to 0.5 mm every year or remained unchanged.
The bearing capacity of the PS containing aggregate–milled AC (PS No. 5, Table 1), thicker asphalt base course constructed on the gravel-sand mix base course (PS No. 1, Table 1), and a base course of crushed granite and sand mix (PS No. 7, Table 1) are accepted as the highest ones exceeding 929 MPa.
The use of a coarse granulometric material having a frost blanket course (PS No. 1) ensures a binder base course of the PS with higher bearing capacity, which creates conditions for achieving larger deformation modulus Ev2 of the aggregate base course. The bearing capacity of the PS containing the designed 20 cm crushed dolomite base course is higher by 30 MPa on average compared to that of the 15 cm crushed dolomite base course.
5. Conclusions
The results of the performance test can be summarized as follows:
- For the 11-year period of exploiting the Test Road, the passing heavy vehicles caused an impact of 987,900 ESAL. Considering historical data and anticipated trends towards an increase in traffic, the average annual growth rate of ESAL makes 90,000. It is expected that the critical ESAL level of 3.0 million can be achieved during the period of the 20th–22nd years of the Test Road.
- Strain measurement results are significantly influenced by the temperature of the pavement due to the temperature of the air, different seasons, and moisture content of bulk materials in the layers. Therefore, these factors are very important for measurements. Higher strain values (exceeding 150 µm/m) were detected at the asphalt surface temperature of ≥+23.0 °C in each PS.
- Bearing capacity and its value are accepted as the main indicators of PS durability, which ensures the resistance of the PS to the effects of vehicle loads. The bearing capacity of all PSs of the Test Road is sufficient for suppressing the effect of traffic loads up to designed load A of 3.0 million. Thus, the established lowest 754 MPa bearing capacity of the PS No. 15 (containing 50% of crushed dolomite and 50% of fine gravel aggregate in the asphalt binder course) is accepted as sufficient at a temperature of +20 °C.
- The findings of bearing capacity of LLRWP were found by 7%–11% lower (2008–2018) than those in LLT and by 21% lower compared to bearing capacity of ULRWP.
- The base course of larger fraction (0/56) crushed aggregate creates conditions for achieving a higher PS bearing capacity of 50 MPa on average than the aggregate base course containing 0/32 gravel-sand mix.
- Following 11 years of operation, the average rut depth of each PS made less than 1.0 cm (maximum average rut depth was set up to 8.0 mm). Investigations showed that following 11 years of operation of the Test Road, the lowest established bearing capacity of 754 MPa hardly affected rut depth.
- The findings of the average rut depth were found by 60%–400% greater in LLRWP (after 11 years of operation) than those in LLLWP and by 10%–70% greater than the ULRWP rut depth. Rut depth formation was affected by heavy vehicle axle load and materials used for constructing the Test Road PSs.
- The lowest rut depths were formed in the PSs containing the wearing course made of Confalt, SMA11, and SMA11 with PMB.
- The biggest rut depths occurred in the PSs that did not apply PMB.
- According to a high material compaction during the first few years of operation, the asphalt wearing course may be subject to a higher requirements, i.e., the limit value of the compression ratio should be 98% instead of 97% or for designing the mixes of the asphalt wearing course, Marshall specimens should be formed with a higher number of hits on both sides, i.e., 2 times for 75 hits instead of 2 times for 50 hits.
- The bearing capacity of the PSs containing milled asphalt granules (PS No. 5), a larger asphalt wearing course and base course made of the gravel-sand mix (Ps No. 1), and the base course of granite aggregate and sand mix (Ps No. 7) are accepted as the highest ones exceeding 929 MPa.
- The bearing capacity of the subgrade course, susceptibility to hydrothermal influence, the overall thickness of the PS, and the total thickness of the layers with bituminous binders have the greatest influence on the bearing capacity of the PS. Bearing capacity is slightly affected by the unbound base layers and the mixes of the pavement and base layer using bituminous binders.
- The use of a coarse granulometric material having a frost blanket course (PS No. 1) ensures the binder base course of the PS with higher bearing capacity, which creates conditions for achieving larger deformation modulus Ev2 of the aggregate base course. The bearing capacity of the PS containing the 20 cm crushed dolomite base course is higher by 30 MPa on average compared to that comprising a 15 cm crushed dolomite base course.
- Thus, it is recommended that solutions to the PS of this Test Road, the selected 5 best pavement structures, in particular, should be widely applied in the construction and reconstruction of Lithuanian motorways and streets when design load A ranges from 1.8 to 3.0 million.
Author Contributions
Conceptualization, A.V.; methodology, A.V. and L.Ž.; software, L.Ž.; validation, L.Ž. and A.V.; formal analysis, D.Č. and L.Ž.; investigation, L.Ž. and A.V.; resources, A.V. and D.Č.; data curation, A.V.; writing—original draft preparation, L.Ž.; writing—review and editing, A.V. and L.Ž.; visualization, A.V.; supervision, A.V. and D.Č.; project administration, A.V.; funding acquisition, D.Č. All authors have read and agreed to the published version of the manuscript.
Funding
This research was funded by the Lithuanian Road Administration under the Ministry of Transport and Communications fund.
Conflicts of Interest
The authors declare no conflict of interest.
References
- Haritonovs, V.; Tihonovs, J.; Smirnovs, J. High modulus asphalt concrete with dolomite aggregates. Transp. Res. Proc. 2016, 14, 3485–3492. [Google Scholar] [CrossRef] [Green Version]
- Zaumanis, M.; Haritonovs, V. Long term monitoring of full scale pavement test section with eight different asphalt wearing courses. Mater. Struct. 2016, 49, 1817–1828. [Google Scholar] [CrossRef]
- Šernas, O.; Vorobjovas, V.; Šneideraitienė, L.; Vaitkus, A. Evaluation of asphalt mix with dolomite aggregates for wearing layer. Transp. Res. Proc. 2016, 14, 732–737. [Google Scholar] [CrossRef] [Green Version]
- Sybilski, D.; Bankowski, W.; Krajewski, M. High modulus asphalt concrete with limestone aggregate. Int. J. Pavement Res. Technol. 2010, 3, 96–101. [Google Scholar]
- Ferne, B.W.; Langdale, P.; Roundm, N.; Faircloughm, R. Development of a calibration procedure for the U.K. highways agency traffic speed deflectometer. Transp. Res. Rec. 2009, 2093, 111–117. [Google Scholar] [CrossRef]
- Motiejūnas, A.; Paliukaitė, M.; Vaitkus, A.; Čygas, D.; Laurinavičius, A. Research on the dependence of asphalt pavement stiffness upon the temperature of pavement layers. Balt. J. Road Bridge Eng. 2010, 5, 50–54. [Google Scholar] [CrossRef]
- Madabhushi, S.; Haigh, S. Investigating the changing deformation mechanism beneath shallow foundations. Géotechnique 2015, 65, 684–693. [Google Scholar] [CrossRef]
- Osman, A.S.; Boulton, M.D. Simple plasticity-based prediction of the undrained settlement of shallow circular foundations on clay. Géotechnique 2005, 55, 435–447. [Google Scholar] [CrossRef] [Green Version]
- Hopkins, T.C. Bearing Capacity Analysis of Pavements, Transportation Kentucky Transportation Center Research; Report KTC-91-8; University of Kentucky: Lexington, KY, USA, 1991; p. 200. [Google Scholar]
- Tigdemir, M.; Kalyoncuoglu, S.F.; Kalyoncuoglu, U.Y. Application of ultrasonic method in asphalt concrete testing for fatigue life estimation. NDT E Int. 2004, 37, 597–602. [Google Scholar] [CrossRef]
- Norambuena-Contrerasa, J.; Castro-Fresnoa, D.; Vega-Zamanillob, A.; Celayac, M.; Lombillo-Vozmedianod, I. Dynamic modulus of asphalt mixture by ultrasonic direct test. NDT E Int. 2010, 43, 629–634. [Google Scholar] [CrossRef]
- Ferne, B.W.; Langdale, P.; Roundm, N.; Faircloughm, R. Development of the UK highways agency traffic speed deflectometer. In Proceedings of the 8th International Conference Bearing Capacity of Roads, Railways and Airfields, Two Volume Set (BCR2A’09), Champaign, IL, USA, 29 June–2 July 2009; Tutumluer, E., Al-Qadi, I.L., Eds.; CRC: Boca Raton, FL, USA, 2009; pp. 409–418. [Google Scholar]
- Saltan, M.; Terzi, S.; Kücüksillle, E.U. Backcalculation of pavement layer moduli and Poisson’s ratio using data mining. Expert Syst. Appl. 2011, 38, 2600–2608. [Google Scholar] [CrossRef]
- Asefzadeh, A.; Hashemian, L.; Bayat, A. Development of statistical temperature prediction models for a test road in Edmonton, Alberta, Canada. Int. J. Pavement Res. Technol. 2017, 10, 369–382. [Google Scholar] [CrossRef]
- Pengfei, L.; Wang, D.; Oeser, M. Application of semi-analytical finite element method to analyze asphalt pavement response under heavy traffic loads. J. Traffic Transp. Eng. 2017, 4, 206–214. [Google Scholar] [CrossRef]
- Hou, Y.; Wang, L.; Yue, P.; Pauli, T.; Sun, W. Modeling mode I cracking failure in asphalt binder by using nonconserved phase-field model. J. Mater. Civ. Eng. 2014, 26, 684–691. [Google Scholar] [CrossRef]
- Čygas, D.; Laurinavičius, A.; Vaitkus, A.; Perveneckas, A.; Motiejūnas, A. Research of asphalt pavement structures on Lithuanian roads (I). Balt. J. Road Bridge Eng. 2008, 3, 77–83. [Google Scholar] [CrossRef]
- Čygas, D.; Laurinavičius, A.; Paliukaitė, M.; Motiejūnas, A.; Žiliūtė, L.; Vaitkus, A. Monitoring the mechanical and structural behavior of the pavement structure using electronic sensors. Comput. Aided Civ. Infrastruct. Eng. 2015, 30, 317–328. [Google Scholar] [CrossRef]
- Vaitkus, A.; Laurinavičius, A.; Oginskas, R.; Motiejūnas, A.; Paliukaitė, M.; Barvidienė, O. The road of experimental pavement structures: Experience of five years operation. Balt. J. Road Bridge Eng. 2012, 7, 220–227. [Google Scholar] [CrossRef]
- Januška, V.A.; Kanopienė, R.; Lazauskienė, J.; Radienė, R. State regulation of the use of the underground in 2018. In Lithuanian Geological Survey: Annual Report 2018; Lazauskienė, J., Satkūnas, J., Ražinskas, V., Puronas, V., Eds.; Lithuanian Geological Survey: Vilnius, Lithuania, 2019; ISSN 1392–7272. pp. 10–14. [Google Scholar]
- SIST. Tests for Mechanical and Physical Properties of Aggregates—Part 2: Methods for the Determination of Resistance to Fragmentation; LST EN 1097-2:2001/A1:2006; SIST: Ljubljana, Slovenia, 2006; p. 45. [Google Scholar]
- American Association of State Highway Transportation Officials (AASHTO). Guide for Design of Pavement Structures; AASHTO: Washington, DC, USA, 1993; p. 624. [Google Scholar]
Figure 1.
Location of the Test Road.

Figure 2.
The Test Road in Pagiriai.

Figure 3.
The test plan.

Figure 4.
Layout of sensors in the reference pavement structure (PS) (No. 19).

Figure 5.
FWD and rut depth measurement directions.

Figure 6.
The growth of the ESAL during period 2007–2018.

Figure 7.
Strains in the asphalt base course for the period 2007–2018.

Figure 8.
The average bearing capacity in the right wheel path and track of the loaded and unloaded lanes of the PSs.
Figure 8.
The average bearing capacity in the right wheel path and track of the loaded and unloaded lanes of the PSs.

Figure 9.
Pavement structure No. 15.

Figure 10.
The average rut depth of the loaded lane right wheel path (LLRWP) in 2007–2009 and 2018.

Figure 11.
The average rut depth of the left/right wheel paths of the loaded and unloaded lanes in 2018.
Figure 11.
The average rut depth of the left/right wheel paths of the loaded and unloaded lanes in 2018.

Figure 12.
The average rut depth and bearing capacity of LLRWP in 2007–2009 and 2018.

Figure 13.
Variation of bearing capacity and rut depth in time of the PS having the highest (a,c,e,g,i) and the lowest (b,d,f,h,j) bearing capacity.
Figure 13.
Variation of bearing capacity and rut depth in time of the PS having the highest (a,c,e,g,i) and the lowest (b,d,f,h,j) bearing capacity.


Table 1.
Materials used for pavement structure (PS) construction.
| No. of PS | Length of PS, m | Thickness, cm | |||||
|---|---|---|---|---|---|---|---|
| Asphalt Wearing Course | Asphalt Binder Course | Asphalt Base Course | Sub-Base Course | Frost Blanket Course | |||
| 1 | 30 | AC 11 (4 cm) | AC 16 (4 cm) | AC 32 (14 cm) | 0/32 gravel-sand mix (20 cm) | 0/11 sand (43 cm) | |
| 2 | 30 | AC 11 (4 cm) | AC 16 (4 cm) | AC 32 (10 cm) | 0/56 crushed dolomite (15 cm) | 0/32 gravel-sand mix (20 cm) | 0/11 sand (32 cm) |
| 3 | 30 | AC 11 (4 cm) | AC 16 (4 cm) | AC 32 (10 cm) | 0/56 crushed dolomite (30 cm) | 0/4 sand (37 cm) | |
| 4 | 30 | AC 11 (4 cm) | AC 16 (4 cm) | AC 32 (10 cm) | 0/56 crushed dolomite (20 cm) | 0/4 sand (47 cm) | |
| 5 | 30 | AC 11 (4 cm) | AC 16 (4 cm) | AC 32 (10 cm) | aggregate—milled asphalt concrete (10 cm) | 0/32 crushed dolomite (10 cm) | 0/11 sand (47 cm) |
| 6 | 30 | AC 11 (4 cm) | AC 16 (4 cm) | AC 32 (10 cm) | 0/32 gravel-sand mix (20 cm) | 0/11 sand (47 cm) | |
| 7 | 30 | AC 11 (4 cm) | AC 16 (4 cm) | AC 32 (10 cm) | 0/32 crushed granite and sand mix (20 cm)8 | 0/11 sand (47 cm) | |
| 8 | 30 | AC 11 (4 cm) | AC 16 (4 cm) | AC 32 (10 cm) | 0/56 crushed granite (20 cm) | 0/11 sand (47 cm) | |
| 9 | 20 | Confalt (4 cm) | AC 16 (4 cm) | AC 32 (10 cm) | 0/56 crushed dolomite (20 cm) | 0/11 sand (47 cm) | |
| 10 | 30 | SMA 11 (4 cm) | AC 16 (4 cm) | AC 32 (10 cm) | 0/56 crushed dolomite (20 cm) | 0/11 sand (47 cm) | |
| 11 | 30 | SMA 11 PMB (4 cm) | AC 16 PMB (4 cm) | AC 32 (10 cm) | 0/56 crushed dolomite (20 cm) | 0/11 sand (47 cm) | |
| 12 | 30 | SMA 11 PMB (4 cm) | AC 16 (4 cm) | AC 32 (10 cm) | 0/56 crushed dolomite (20 cm) | 0/11 sand (47 cm) | |
| 13 | 30 | AC 11 (4 cm) | AC 161 (4 cm) | AC 32 (10 cm) | 0/56 crushed dolomite (20 cm) | 0/11 sand (47 cm) | |
| 14 | 30 | AC 11 (4 cm) | AC 162 (4 cm) | AC 32 (10 cm) | 0/56 crushed dolomite (20 cm) | 0/11 sand (47 cm) | |
| 15 | 30 | AC 11 (4 cm) | AC 163 (4 cm) | AC 32 (10 cm) | 0/56 crushed dolomite (20 cm) | 0/11 sand (47 cm) | |
| 16 | 30 | AC 11 (4 cm) | AC 164 (4 cm) | AC 32 (10 cm) | 0/56 crushed dolomite (20 cm) | 0/11 sand (47 cm) | |
| 17 | 30 | AC 11 (4 cm) | AC 165 (4 cm) | AC 32 (10 cm) | 0/56 crushed dolomite (20 cm) | 0/11 sand (47 cm) | |
| 18 | 30 | AC 11 (4 cm) | AC 166 (4 cm) | AC 32 (10 cm) | 0/56 crushed dolomite (20 cm) | 0/11 sand (47 cm) | |
| 19 * | 30 | AC 11 (4 cm) | AC 16 (4 cm) | AC 32 (10 cm) | 0/56 crushed dolomite (20 cm) | 0/11 sand (47 cm) | |
| 20 | 15 | AC 11 (4 cm) | AC 169 (4 cm) | AC 329 (10 cm) | 0/56 crushed dolomite10(20 cm) | 0/11 sand10 (47 cm) | |
| 21 | 15 | AC 11 (4 cm) | AC 169 (4 cm) | AC 329 (10 cm) | 0/56 crushed dolomite10 (20 cm) | 0/11 sand10 (47 cm) | |
| 22 | 15 | AC 119 (4 cm) | AC 169 (4 cm) | AC 32 (10 cm) | 0/56 crushed dolomite (20 cm) | 0/11 sand (47 cm) | |
| 23 | 15 | AC 119 (4 cm) | AC 169 (4 cm) | AC 32 (10 cm) | 0/56 crushed dolomite (20 cm) | 0/11 sand (47 cm) | |
| 24 | 15 | AC 11 (4 cm) | AC 16 (4 cm) | AC 32 (10 cm) | 0/56 crushed dolomite10 (20 cm) | 0/11 sand10 (47 cm) | |
| 25 | 15 | AC 11 (4 cm) | AC 16 (4 cm) | AC 32 (10 cm) | 0/56 crushed dolomite10 (20 cm) | 0/11 sand10 (47 cm) | |
| 26 | 30 | AC 11 (4 cm) | AC 16 (4 cm) | AC 326 (10 cm) | 0/56 crushed dolomite (20 cm) | 0/11 sand (47 cm) | |
| 27 | 30 | AC 11 (4 cm) | AC 16 (4 cm) | AC 327 (10 cm) | 0/56 crushed dolomite (20 cm) | 0/11 sand (47 cm) | |
* Reference pavement structure; 1 crushed granite (11/16) + crushed dolomite (5/8) + (crushed dolomite and crushed granite (8/11), 50% and 50%); 2 crushed granite (8/11; 11/16) + crushed gravel (fine aggregate) 50%; 3 crushed dolomite (8/11; 11/16) + crushed gravel (fine aggregate); 4 50% of crushed granite + 50% of sand; 5 100% of crushed granite; 6 100% of crushed gravel; 7 50% of crushed dolomite + 50% of crushed gravel; 8 50% of crushed granite + 50% of the sand and gravel mix; 9 geosynthetics between the asphalt wearing course and the asphalt binder course or the asphalt base course and the asphalt binder course; 10 geosynthetics between the sub-base course and the frost blanket course.
Table 2.
Changes in bearing capacity (in right and left wheel paths, tracks of loaded and unloaded lanes) during the Test Road exploitation.
Table 2.
Changes in bearing capacity (in right and left wheel paths, tracks of loaded and unloaded lanes) during the Test Road exploitation.
| Year | Data on Bearing Capacity, MPa | |||||||
|---|---|---|---|---|---|---|---|---|
| LLRWP | ULRWP | LLT | ULT | LLT | LLRWP | ULT | ULRWP | |
| 2007 | 568–760 | 546–765 | 568–760 | 546–765 | 568–760 | 568–760 | 546–765 | 546–765 |
| 2008 | 589–817 | 631–814 | 542–939 | 631–814 | 589–817 | 542–939 | 631–814 | 631–814 |
| 2009 | 521–741 | 572–766 | 601–804 | 628–767 | 601–804 | 521–741 | 628–767 | 572–766 |
| 2018 | 754–1079 | 756–1078 | 847–1320 | 796–1123 | 847–1320 | 754–1079 | 796–1123 | 756–1078 |
Publisher’s Note: MDPI stays neutral with regard to jurisdictional claims in published maps and institutional affiliations. |
© 2020 by the authors. Licensee MDPI, Basel, Switzerland. This article is an open access article distributed under the terms and conditions of the Creative Commons Attribution (CC BY) license (http://creativecommons.org/licenses/by/4.0/).
Share and Cite
MDPI and ACS Style
Žalimienė, L.; Vaitkus, A.; Čygas, D. Insights and Findings Following 11 Years of Test Road Exploitation. Coatings 2020, 10, 1161. https://0-doi-org.brum.beds.ac.uk/10.3390/coatings10121161
AMA Style
Žalimienė L, Vaitkus A, Čygas D. Insights and Findings Following 11 Years of Test Road Exploitation. Coatings. 2020; 10(12):1161. https://0-doi-org.brum.beds.ac.uk/10.3390/coatings10121161
Chicago/Turabian StyleŽalimienė, Laura, Audrius Vaitkus, and Donatas Čygas. 2020. "Insights and Findings Following 11 Years of Test Road Exploitation" Coatings 10, no. 12: 1161. https://0-doi-org.brum.beds.ac.uk/10.3390/coatings10121161
Note that from the first issue of 2016, this journal uses article numbers instead of page numbers. See further details here.