Article

Effect of the Compactness on the Texture and Friction of Asphalt Concrete Intended for Wearing Course of the Road Pavement

1
School of Highway, Chang’an University, South 2nd Ring Road Middle Section, Xi’an 710064, China
2
Key Laboratory for Special Area Highway Engineering of Ministry of Education, Chang’an University, South 2nd Ring Road Middle Section, Xi’an 710064, China
*
Authors to whom correspondence should be addressed.
Submission received: 25 January 2020 / Revised: 18 February 2020 / Accepted: 19 February 2020 / Published: 24 February 2020
(This article belongs to the Collection Pavement Surface Coatings)

Abstract

:
Maintaining good friction performance of highway pavement is important for road safety. The friction is affected by many factors, and the present study investigates the effect of the compactness on the texture and friction of asphalt concrete during the polishing process. Two three-dimensional (3D) texture parameters and the mean texture depth (MTD) were used to characterize the surface texture of AC-13 asphalt concrete. The differences of surface texture are then being analyzed among the pavement in the field, rutting slabs with 97% compactness (RS-97), rutting slabs with 100% compactness (RS-100), and rutting slabs with 103% (RS-103). The rutting slabs were polished by a circular vehicle simulator (CVS). The 3D surface topography, British pendulum number (BPN), and MTD were obtained during the polishing process. Test results show that the surface of the rutting slab can be smoother as the compactness increased from 97% to 103%. During the whole polishing process, the rutting slab with smaller compactness had higher value of the MTD. The impact of compactness on the BPN is insignificant during the polishing process, but rutting slabs with smaller compactness had better friction at high speed as the result of the higher MTD.

1. Introduction

Friction refers to the force developed in the tire-pavement interface, and it can be affected by several factors, such as the properties of the tire, the vehicle speed, the type of the aggregate, and the surface texture of the road pavement [1,2,3]. Generally, new asphalt pavement can provide enough friction, and the asphalt pavement will be polished due to traffic in its service life. The friction of the pavement will be deteriorated over time, which significantly increases the number of road accidents, especially under wet weather conditions [4,5]. In locations where traffic exerts a greater horizontal force, such as braking areas approaching roundabouts and junctions, or on bends and slopes, the polishing effect of traffic is amplified, and the friction coefficient tends to be lower. Moreover, the pavement will be polished even faster if the aggregate was composed of a single mineral with lower hardness [6]. Hence, maintaining highway pavements at good friction performance is important for road safety.
Surface texture is defined as the deviation between a pavement surface and a true planar surface. According to the wavelength of deviations, the surface texture of asphalt pavement can be divided into four types: Unevenness, mega-texture, macro-texture, and micro-texture [7]. For asphalt pavement, friction is mainly determined by micro-texture (wavelength lower than 0.5 mm) and macro-texture (wavelength ranging between 0.5–50 mm) [8].
The micro-texture on the surface of the coarse aggregate can interact with the tire on a molecular scale and provide adhesion. This component of the texture is especially important for friction at low speed. Additionally, the micro-texture is mainly affected by the coarse aggregate type [6]. However, the micro-texture cannot be easily quantified due to lack of high-precision testing equipment. Accordingly, many studies used the BPN to characterize the micro-texture [3,9].
The macro-texture is important for the friction at high speed and pavement with greater macro-texture has higher friction at high speed [8]. The mean profile depth (MPD) and MTD are the most common parameters to describe the macro-texture. Kouchaki et al. reported that MPD and friction have a strong correlation with each other [10]. With the development of testing technology, 3D topography of the pavement surface can be obtained at high resolution and precision. There are several 3D texture parameters which can describe the roughness of the surface with more information than MPD and MTD [11,12]. The macro-texture can be affected by many factors, such as maximum aggregate size, mix binder content, mix gradation, and compactness [8,13]. Georgiou et al. found that the rutting slabs with different compactness had different MTD [14]. Praticò et al. investigated the relationship between the surface texture and compaction methods [15]. However, previous studies only referred to the initial state of the pavement. Hence, the main objective of this study is to find the effect of the compactness on the texture and friction performance of asphalt concrete during the polishing process.
Many studies have been conducted to obtain texture parameters and friction coefficient either in the field or the laboratory. In field study, Hu et al. obtained the 3D topography and measured the friction coefficient. It was found that the peak density and the arithmetic mean peak curvature had a significant effect on the dynamic friction coefficient [16]. Li et al. used 24 different 3D texture parameters to describe the asphalt pavement surface and demonstrated that core material volume and peak density have a good correlation with friction [17].
Although field experiments can provide measured actual data in the real environment and conditions, such data are difficult to be obtained during the entire polishing process. In contrast, test factors are easier to be controlled in the laboratory. Therefore, many types of equipment have been developed to accelerate the polishing process in the laboratory. Do et al. used a Wehner/Schulze (WS) machine to polish asphalt pavement specimens in the laboratory. The WS machine can polish the specimens fast and measure friction coefficient. The surface was polished on a ring 16 cm in diameter and 6 cm in width and the slip rate between the specimen surface and the polishing cones was between 0.5% and 1% [18]. Wang et al. used an indoor micro circular track-accelerated abrasion tester with mute solid rubber tires to polish the specimens [19]. However, the tester can polish only one specimen at a time. Therefore, a large-size apparatus, which can simulate the vehicle, should be designed. Such equipment has been designed by the Chang’an University, named the circular vehicle simulator (CVS).
During the polishing process in the laboratory, the proper selection of specimens is important for reliable test results. Do et al. used cores from the field as specimens [18], which is a difficult procedure. Hence, Qian et al. used rutting slabs as specimens to be polished in the laboratory [20]. Concerning surface texture, there have been few studies discussing the differences between rutting slab and the pavement in the field. It is important to know whether a rutting slab can simulate the pavement in the field.
In this paper, the main objective is to find the effect of the compactness on the texture and friction of asphalt concrete during the polishing process. Firstly, the 3D surface topography of the pavement in the field and rutting slabs with different compactness was obtained. The aim was to determine whether the surface of the rutting slab can simulate the pavement in the field. Then, rutting slabs with different compactness were polished by the CVS. The BPN, MTD, and the 3D surface topography at different stages of the polishing process were obtained.

2. Materials and Methods

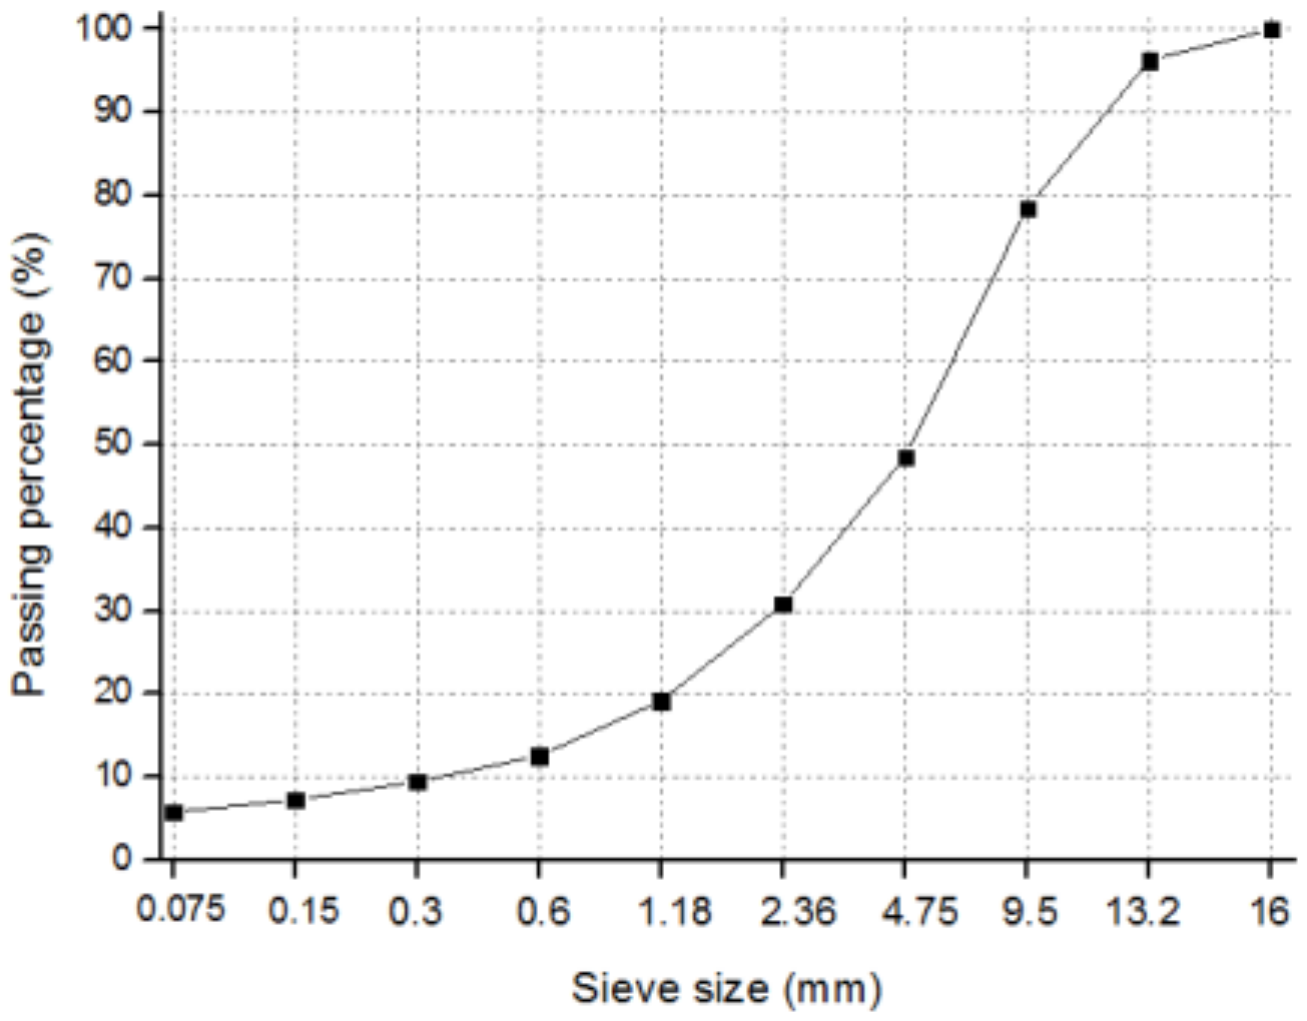
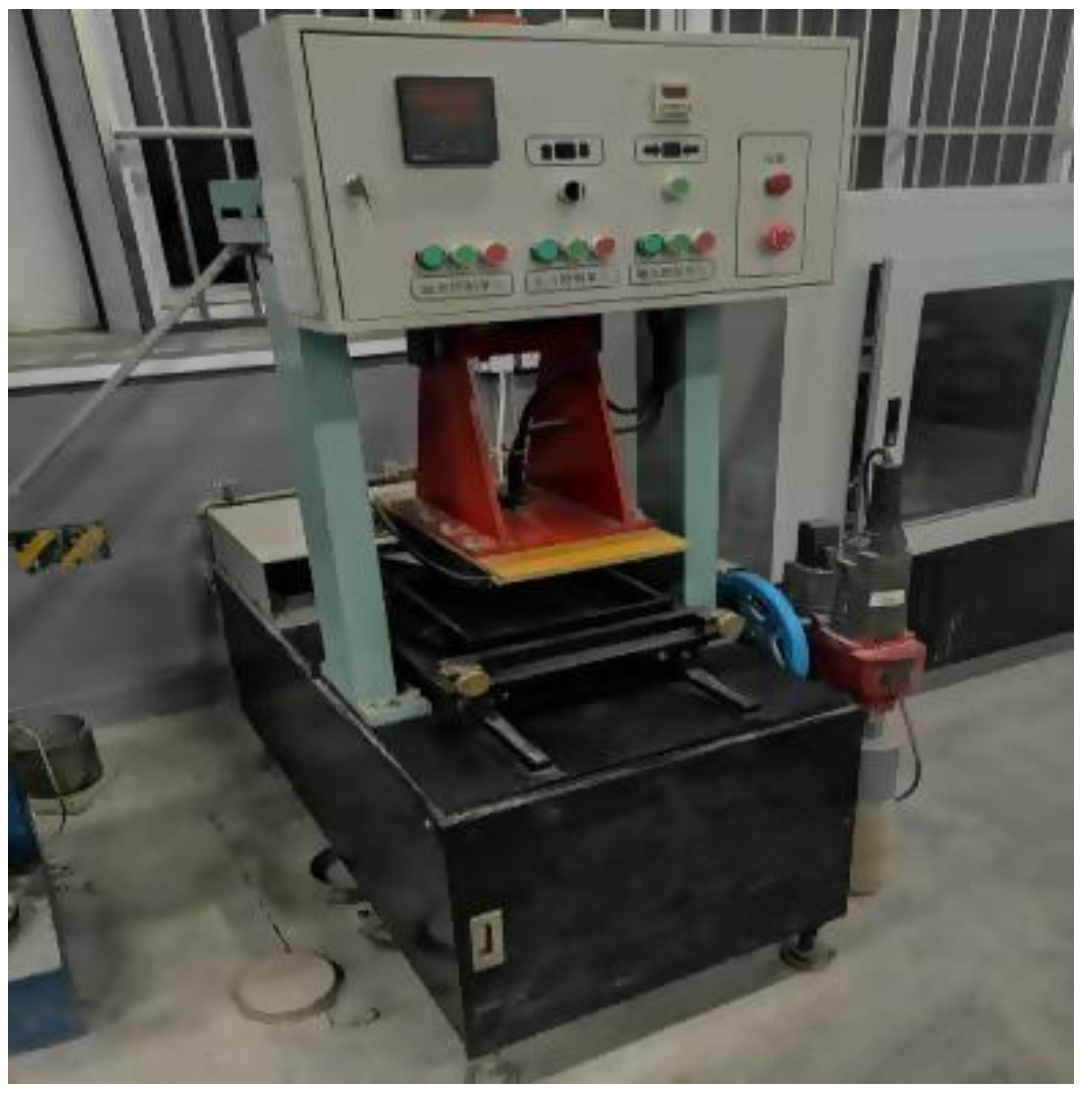
2.1. Material and Compaction Methods

In order to compare the surface texture between pavement in the field and rutting slabs, a new field asphalt pavement was selected from Xi’an, China. SBS modified asphalt, limestone aggregate, and continuous dense mixture gradation with nominal maximum aggregate size of 13 mm (AC-13) were used for both the field test section and the rutting slabs utilized in the study. The gradation curve is presented in Figure 1, and the asphalt content is 5.1%.
During compacting process in the field, the laying temperature was around 150 °C with an ambient temperature of 15 °C. The initial compaction of the AC-13 pavement was carried out one or two times by a smooth wheel roller. Then, compaction was carried out 4–6 times by a rubber roller. Finally, the surface was compacted by a smooth wheel roller twice.
In order to ensure that the material used in the laboratory was identical with that in the field, some loose asphalt mixture was collected from the transport cart in the field, which was then placed in the oven of the laboratory. When the temperature of the loose asphalt mixture reached 150 °C, it was placed into a mixing pot and mixed for 30 s. Finally, the mixture was placed into a mold using the ‘cone-and-quarter’ method to reduce segregation [21]. Subsequently, the loose asphalt mixture was compacted with a wheel roller compactor (Figure 2). The rutting slabs were compacted according to the JTG E20-2011 standard [22] and the size of the rutting slabs was 300 mm × 300 mm × 50 mm.
In this paper, the compactness is defined as the ratio between the specific volume density of the rutting slab and the volume density of the Marshall specimens. The Marshall specimens were compacted according to the JTG E20-2011 standard [22]. In order to obtain surface texture with different compactness, the mass of the loose asphalt concrete, which was filled into the mold, was adjusted according to the required compactness (97%, 100%, and 103%). The wheel roller compactor was manually stopped when the height of the rutting slab was equal to 50 mm. There are four parallel specimens for each compactness.

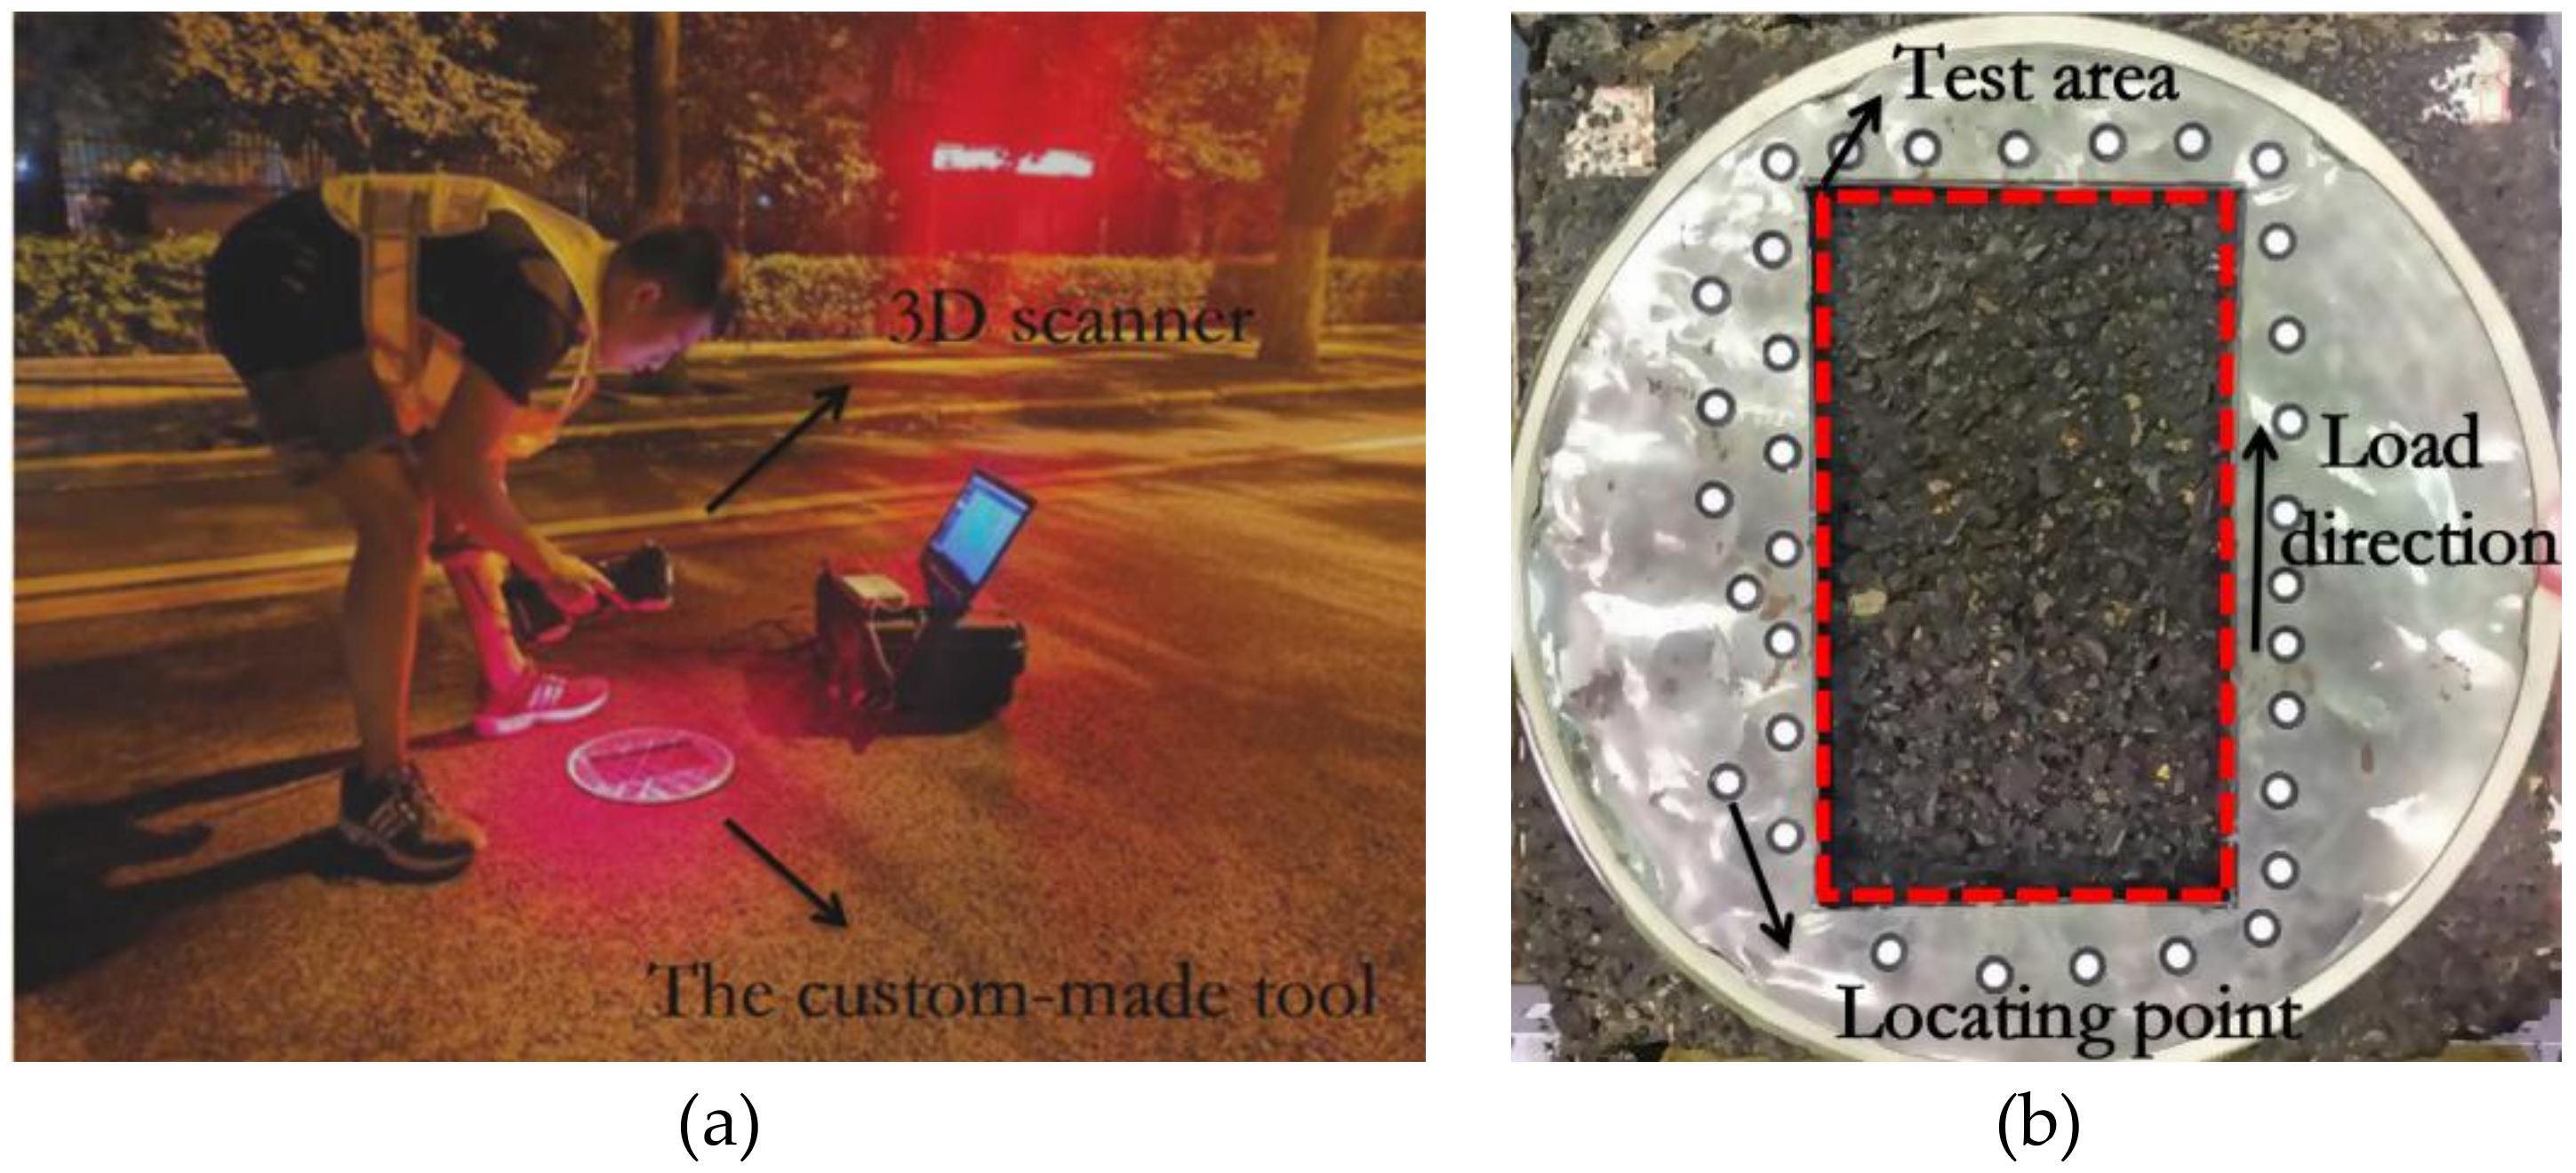
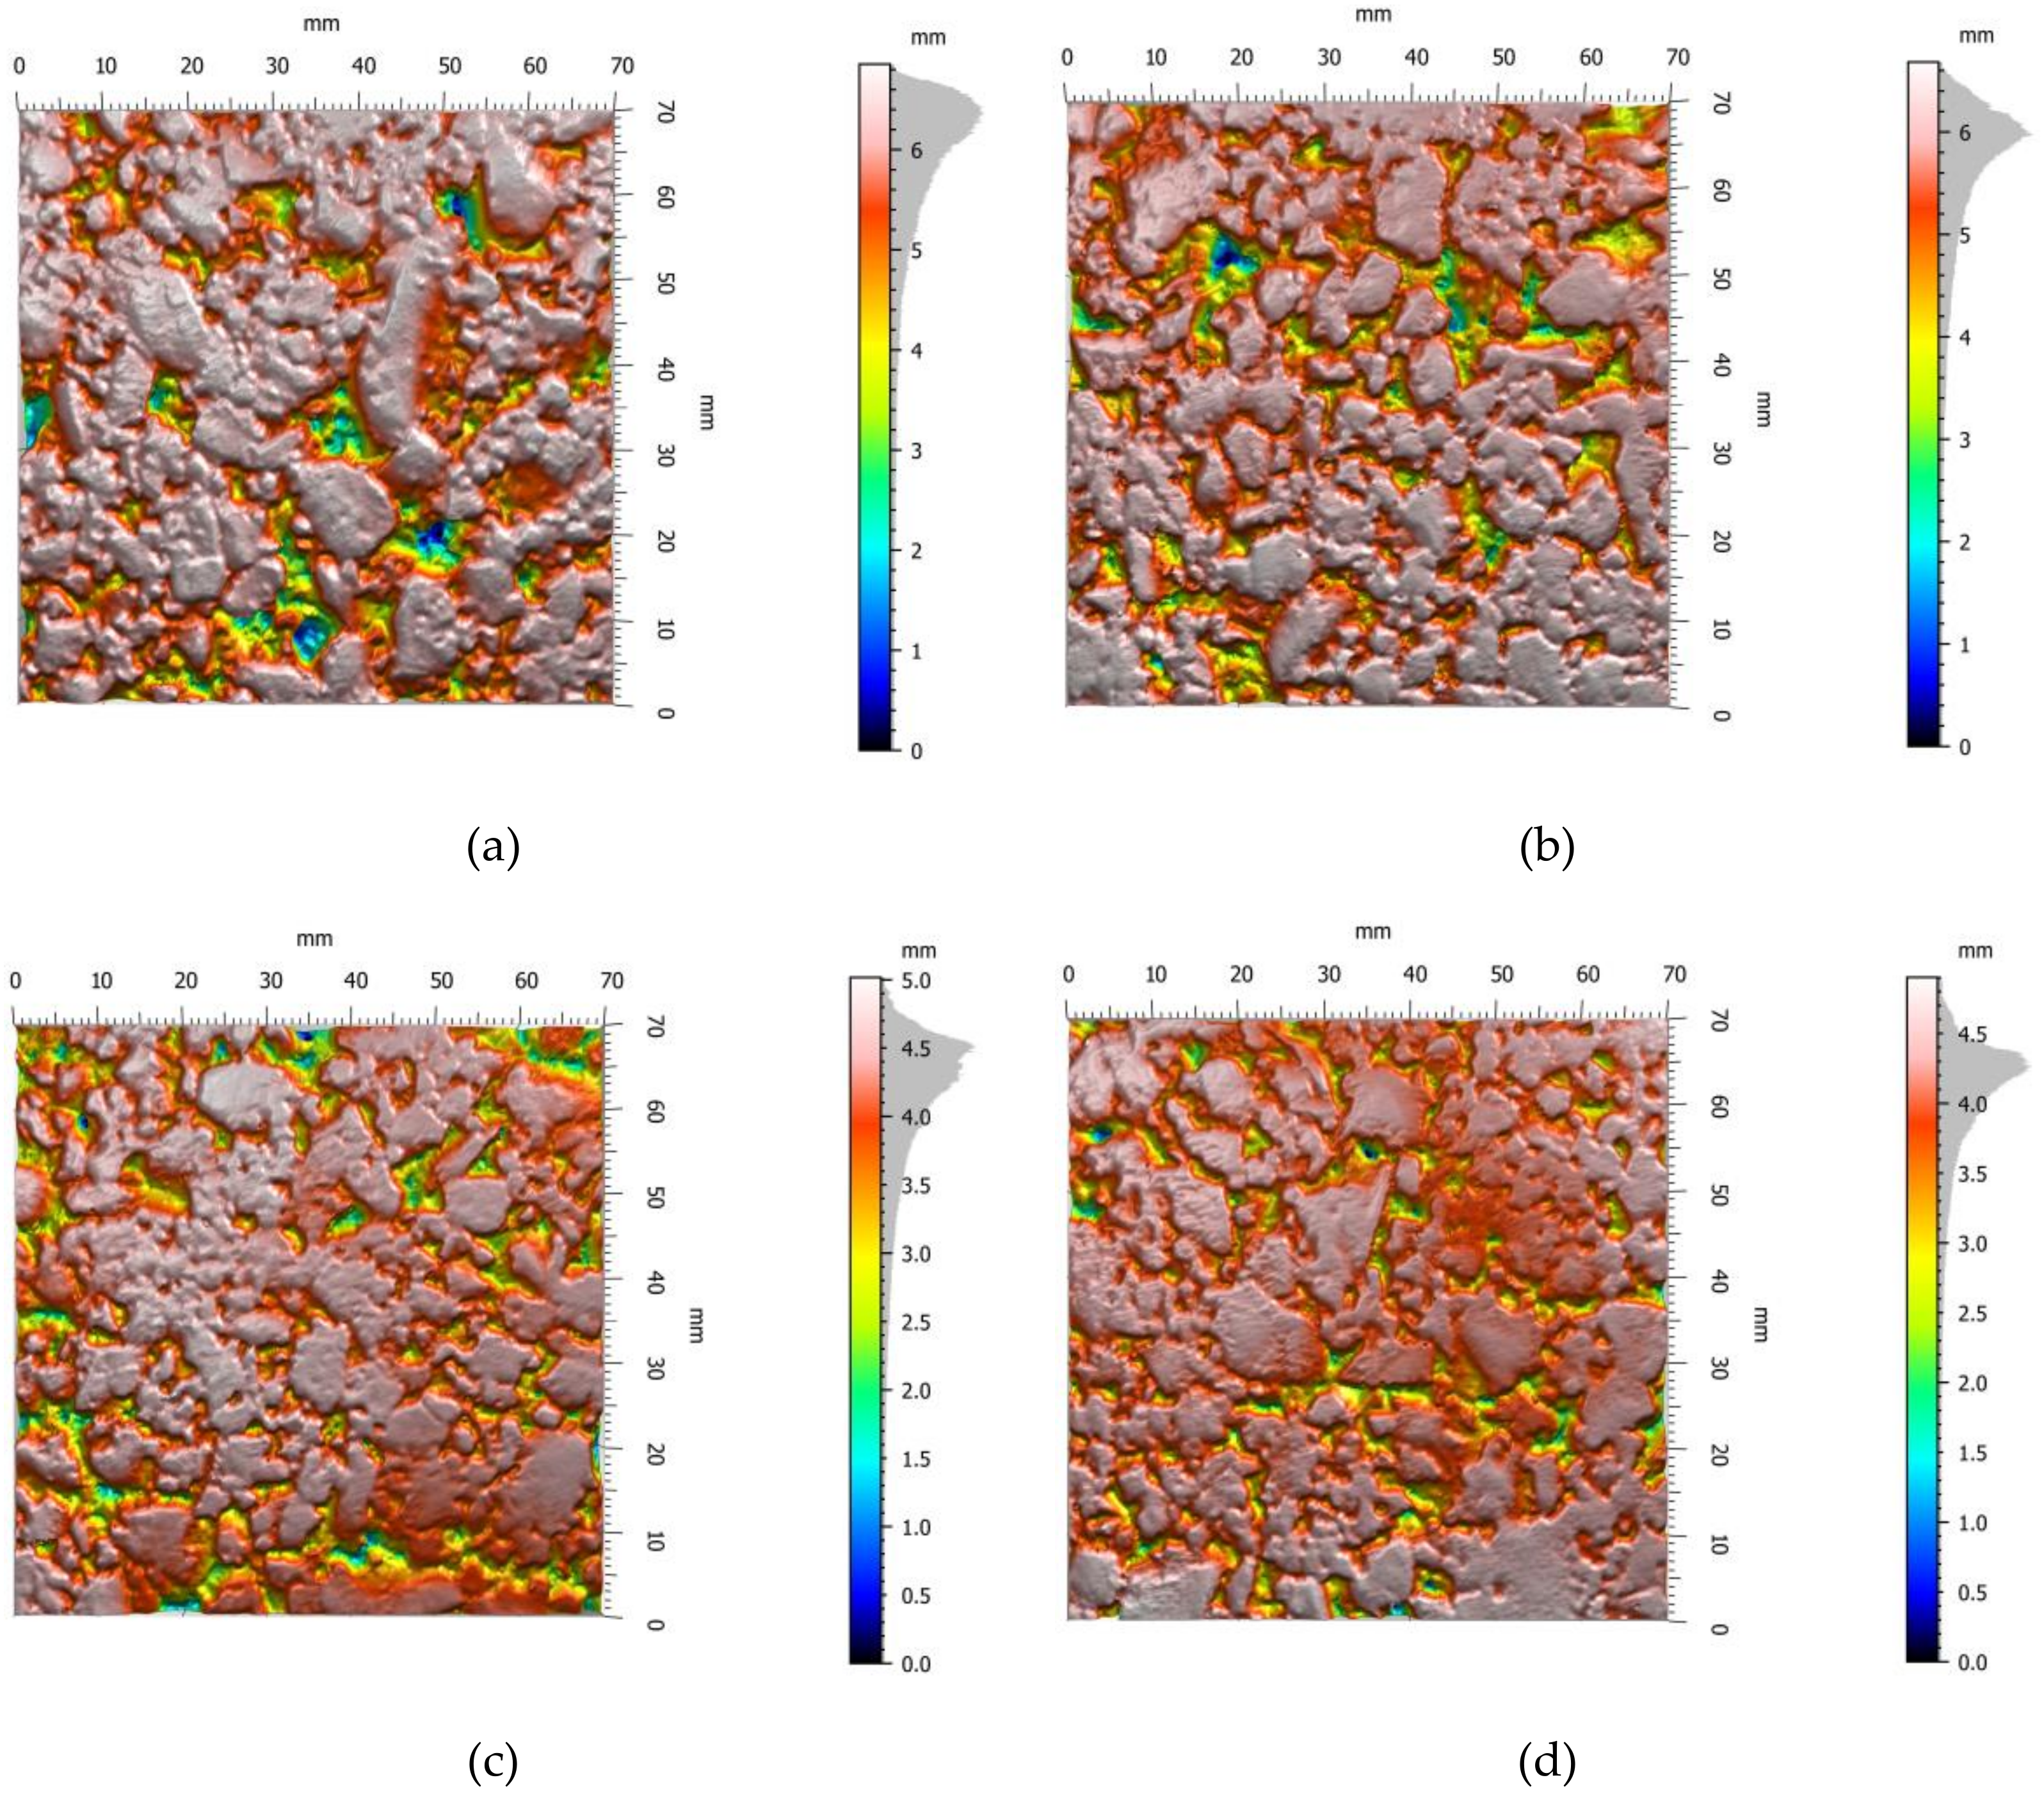
2.2. 3D Surface Topography Measurement

As it can be seen in Figure 3a, a 3D scanner (HandySCAN 300, Creaform Inc., Quebec, Canada) was used to obtain the 3D topography of the pavement surface. During the measurement, the laser emitter of the instrument can produce a beam of energy at an angle. It hits the surface of the object at the point that is being measured. A part of the reflected signal hits the receiving sensor. The distance between the laser emitter and the receiving sensor is known. The angle of the incoming ray can be calculated by applying the trigonometric formulas. Based on the geometrical relationship between components, the coordinates of the 3D data of the surface point cloud can be determined [11,16]. In this study, the instrument could provide point cloud with a resolution of 100 um and precision of 40 um. As shown in Figure 3b, during the measurement process, in order to achieve the expected precision, the locating point should be used. In addition, to avoid the effects of the environmental conditions, the tested area should be clean and dry.
The 3D surface topography of the new pavement in the field was obtained during the night. Six parallel test areas were randomly selected and the test area was 200 mm × 120 mm. As shown in Figure 3b, in order to measure the 3D surface topography of the rutting slabs without load repetitions, a custom-made tool was used to fix the test area. The tool was a 300-mm-diameter disk with a hole measuring 200 mm × 120 mm.
In order to obtain the 3D topography of the rutting slabs during the polishing process, three rutting slabs with 97%, 100%, and 103% compactness were polished using the CVS. As it can be seen in Figure 3b, the custom-made tool was also used to ensure that the test area was fixed strictly during the different stages of polishing.

2.3. Texture Parameter Calculation
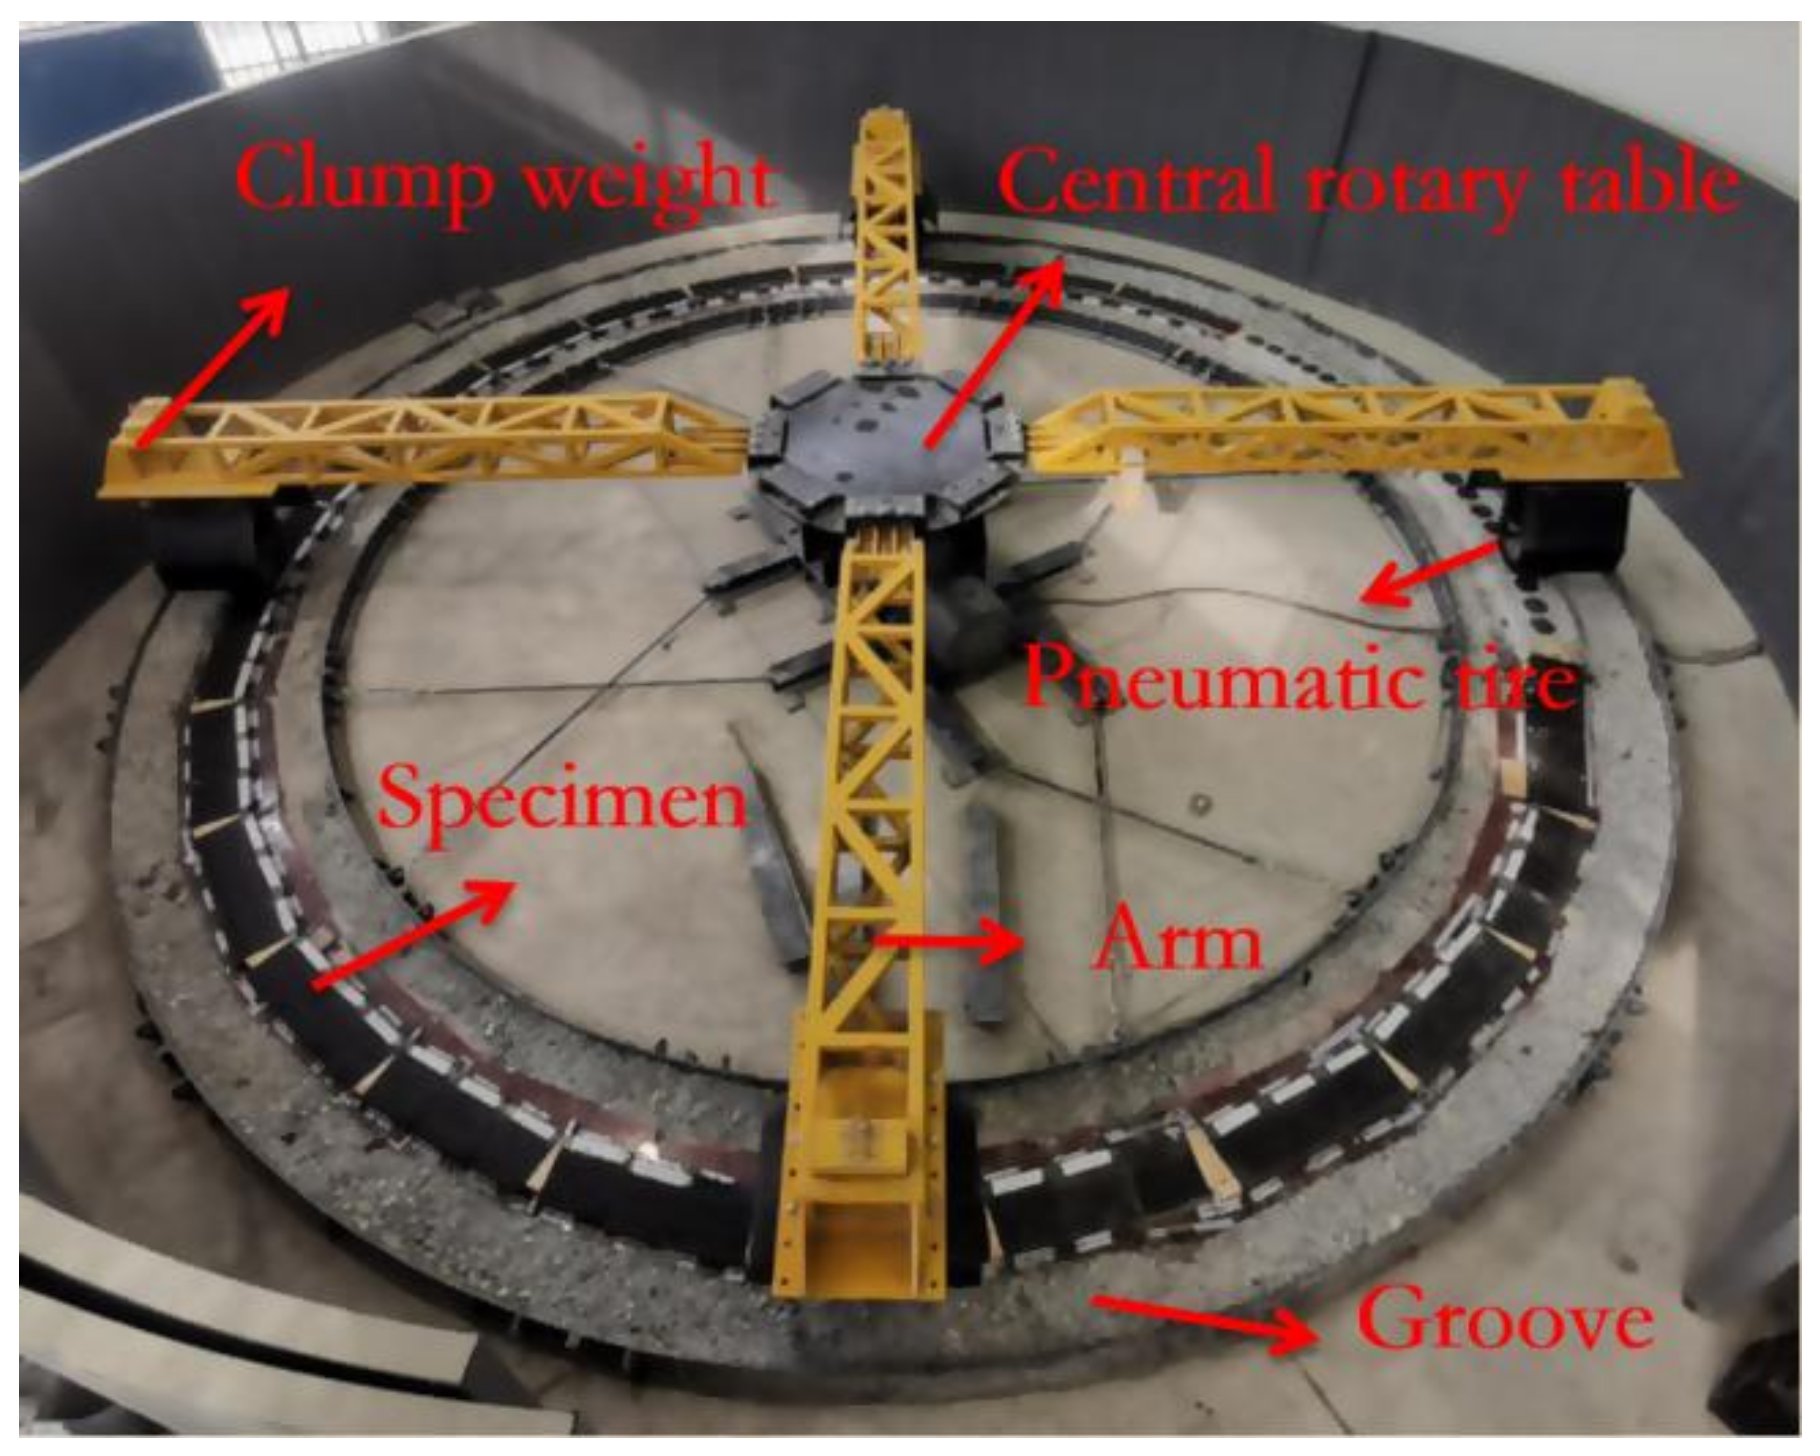
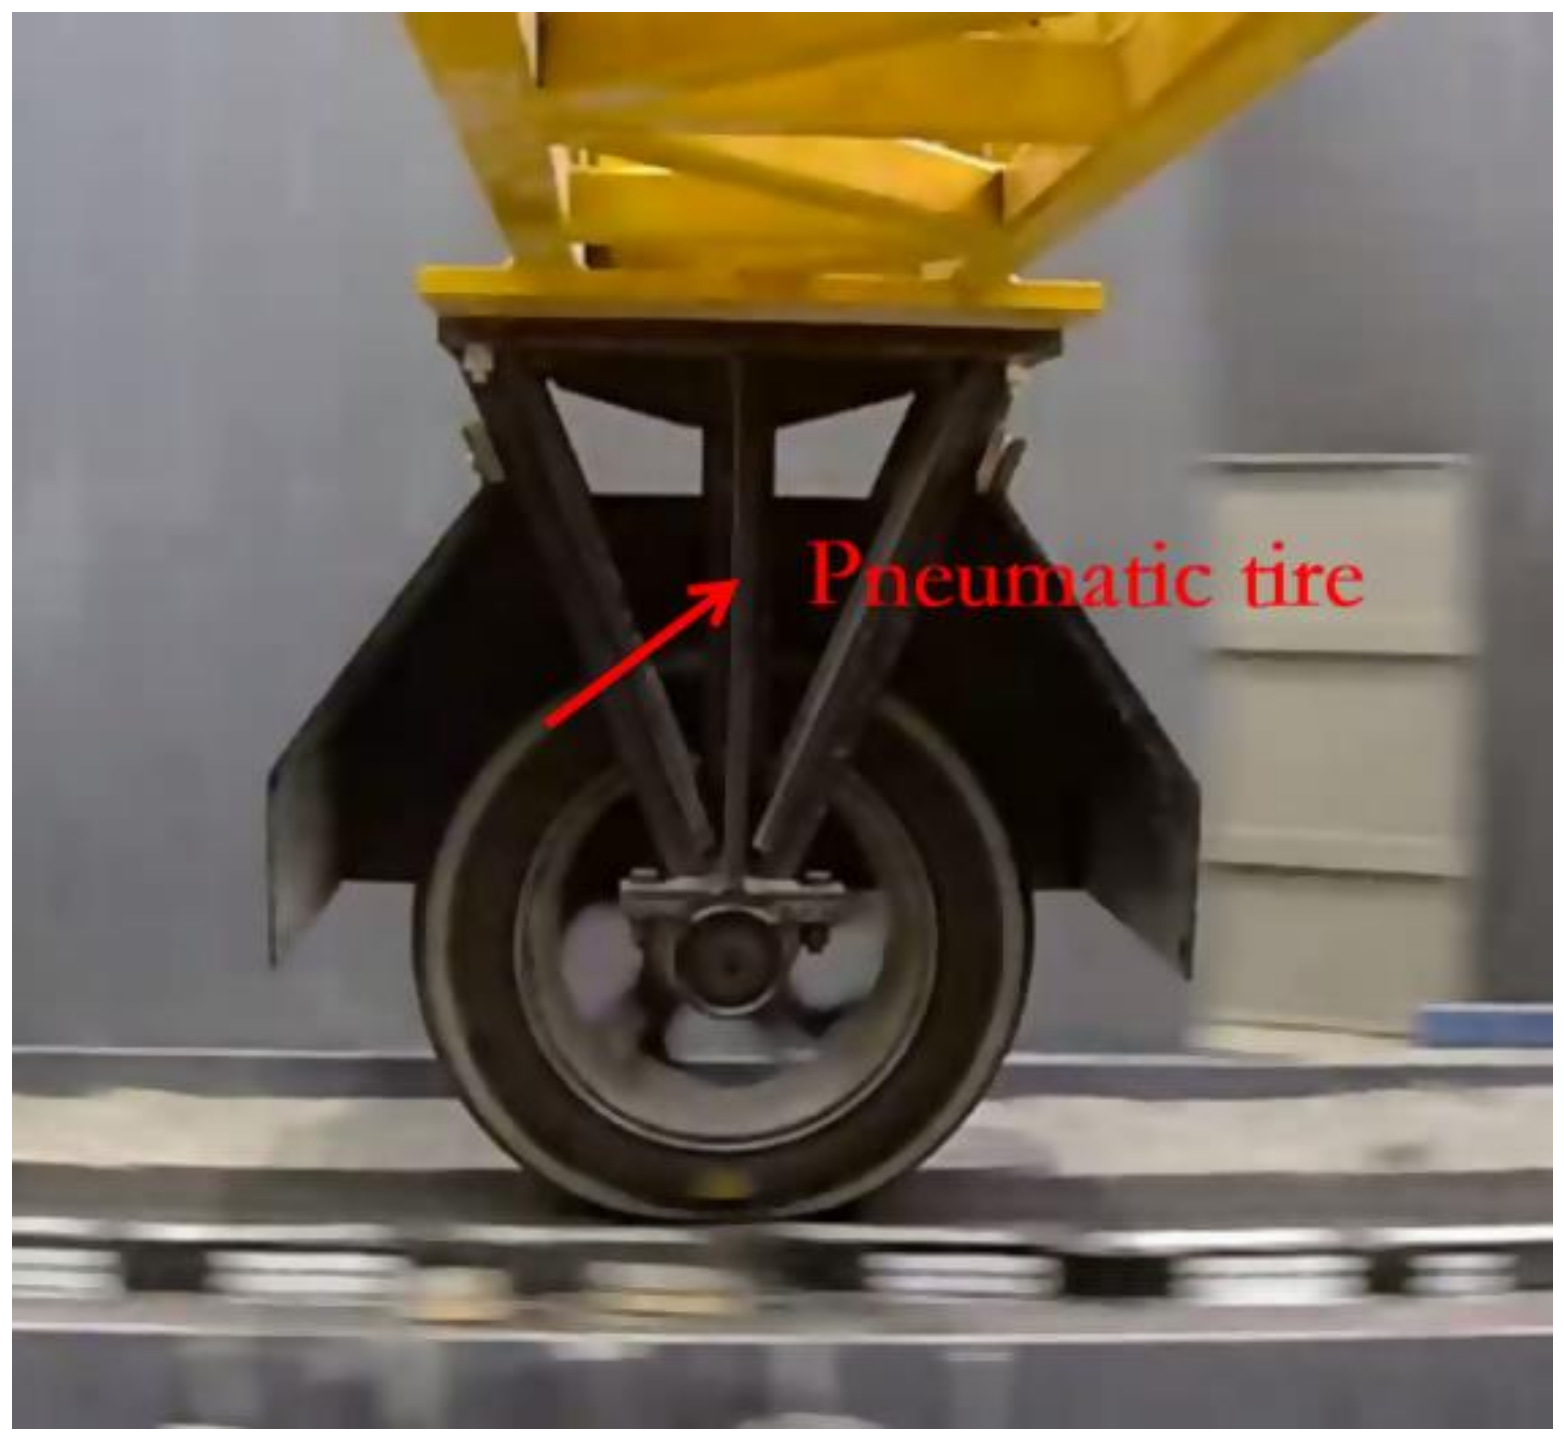
After the point clouds were obtained, GEOMAGIC was used to discard useless points and build a coordinate system for the point clouds. Since the resolution was not enough to describe the micro-texture, the point clouds were disposed by a Gaussian filter with a wavelength of 0.5 mm to take out the micro-texture. Then, the point clouds were processed in MATLAB 2018a to obtain the macro-texture parameters.
In this study, the texture parameters should describe the surface texture of the pavement. Considering the parameters used in previous studies, this paper selected the root mean height ( S q ) and developed interfacial area ratio ( S d r ), following the specifications of surface roughness (ISO-25178) [23]. The abovementioned texture parameters can be calculated according to the following equations:
S q = 1 N A z 2 x , y d x d y ,
S d r = 1 A A 1 + z x , y   x 2 + z x , y   y 2 1 d x d y ,
where, z x , y   = the deviation of the surface irregularities from the base plane [24]; A = projection area of the evaluation area; N = number of points in the evaluation area.
S q is the standard deviation of the height distribution. Additionally, the S q belongs to the height parameters. It is sensitive to the texture amplitude of the surface, and is often used to describe the roughness [25]. When the texture of the surface becomes smooth, the value of   S q can become smaller. S d r reflects the additional surface area contributed by the surface texture compared to the projection area of the evaluation area [26]. It is affected by both texture amplitude and spacing. Hence, the S d r belongs to the hybrid parameters. When the texture of the surface becomes smooth, the value of S d r can decrease. In addition, it can be used to qualify the tribological properties of a surface [24].

2.4. The CVS

The CVS was developed by the Chang’an University to simulate traffic loads. As it can be seen in Figure 4, the CVS uses four pneumatic tires, 600 mm in diameter and 195 mm in width, to polish the specimens. The four tires are fixed on four arms which are attached to the central rotary table (Figure 5). The pressure of each tire is 2.5 bar. The vertical load of the tire can be adjusted between 2 kN and 6 kN by changing the weight clump. The slip rate between tire and specimen is 4%. It should be noted that in the field, for the deformation of the tire tread, the slip rate between rolling wheel and road pavement is usually less than 5% [27]. The linear speed of the tire can be adjusted between 0 km/h and 30 km/h by changing the power frequency. A groove 8 m in diameter can be used to fix the specimens. The polishing width of each specimen is 170 mm.
In a nutshell, the CVS has three major advantages:
  • The simulating loads of the CVS is similar with the traffic in the field.
  • A lot of specimens can be polished simultaneously.
  • The polishing area is wide and is convenient for the follow-up texture and friction tests.
In the present study, the vertical load of the tire was set as 4 kN, which resembles a passenger car. The linear speed of tire was 10 km/h. In 7 h, the CVS can be rotated 2500 times and the number of load repetitions is 10,000. Three rutting slabs with 97%, 100%, and 103% compactness were polished by the CVS. After a certain number of load repetitions, the CVS was stopped and the specimens were removed in order to obtain their BPN, MTD, and the 3D surface topography. During the polishing process, the range of the temperature for the rutting slabs was from 30 °C to 45 °C.

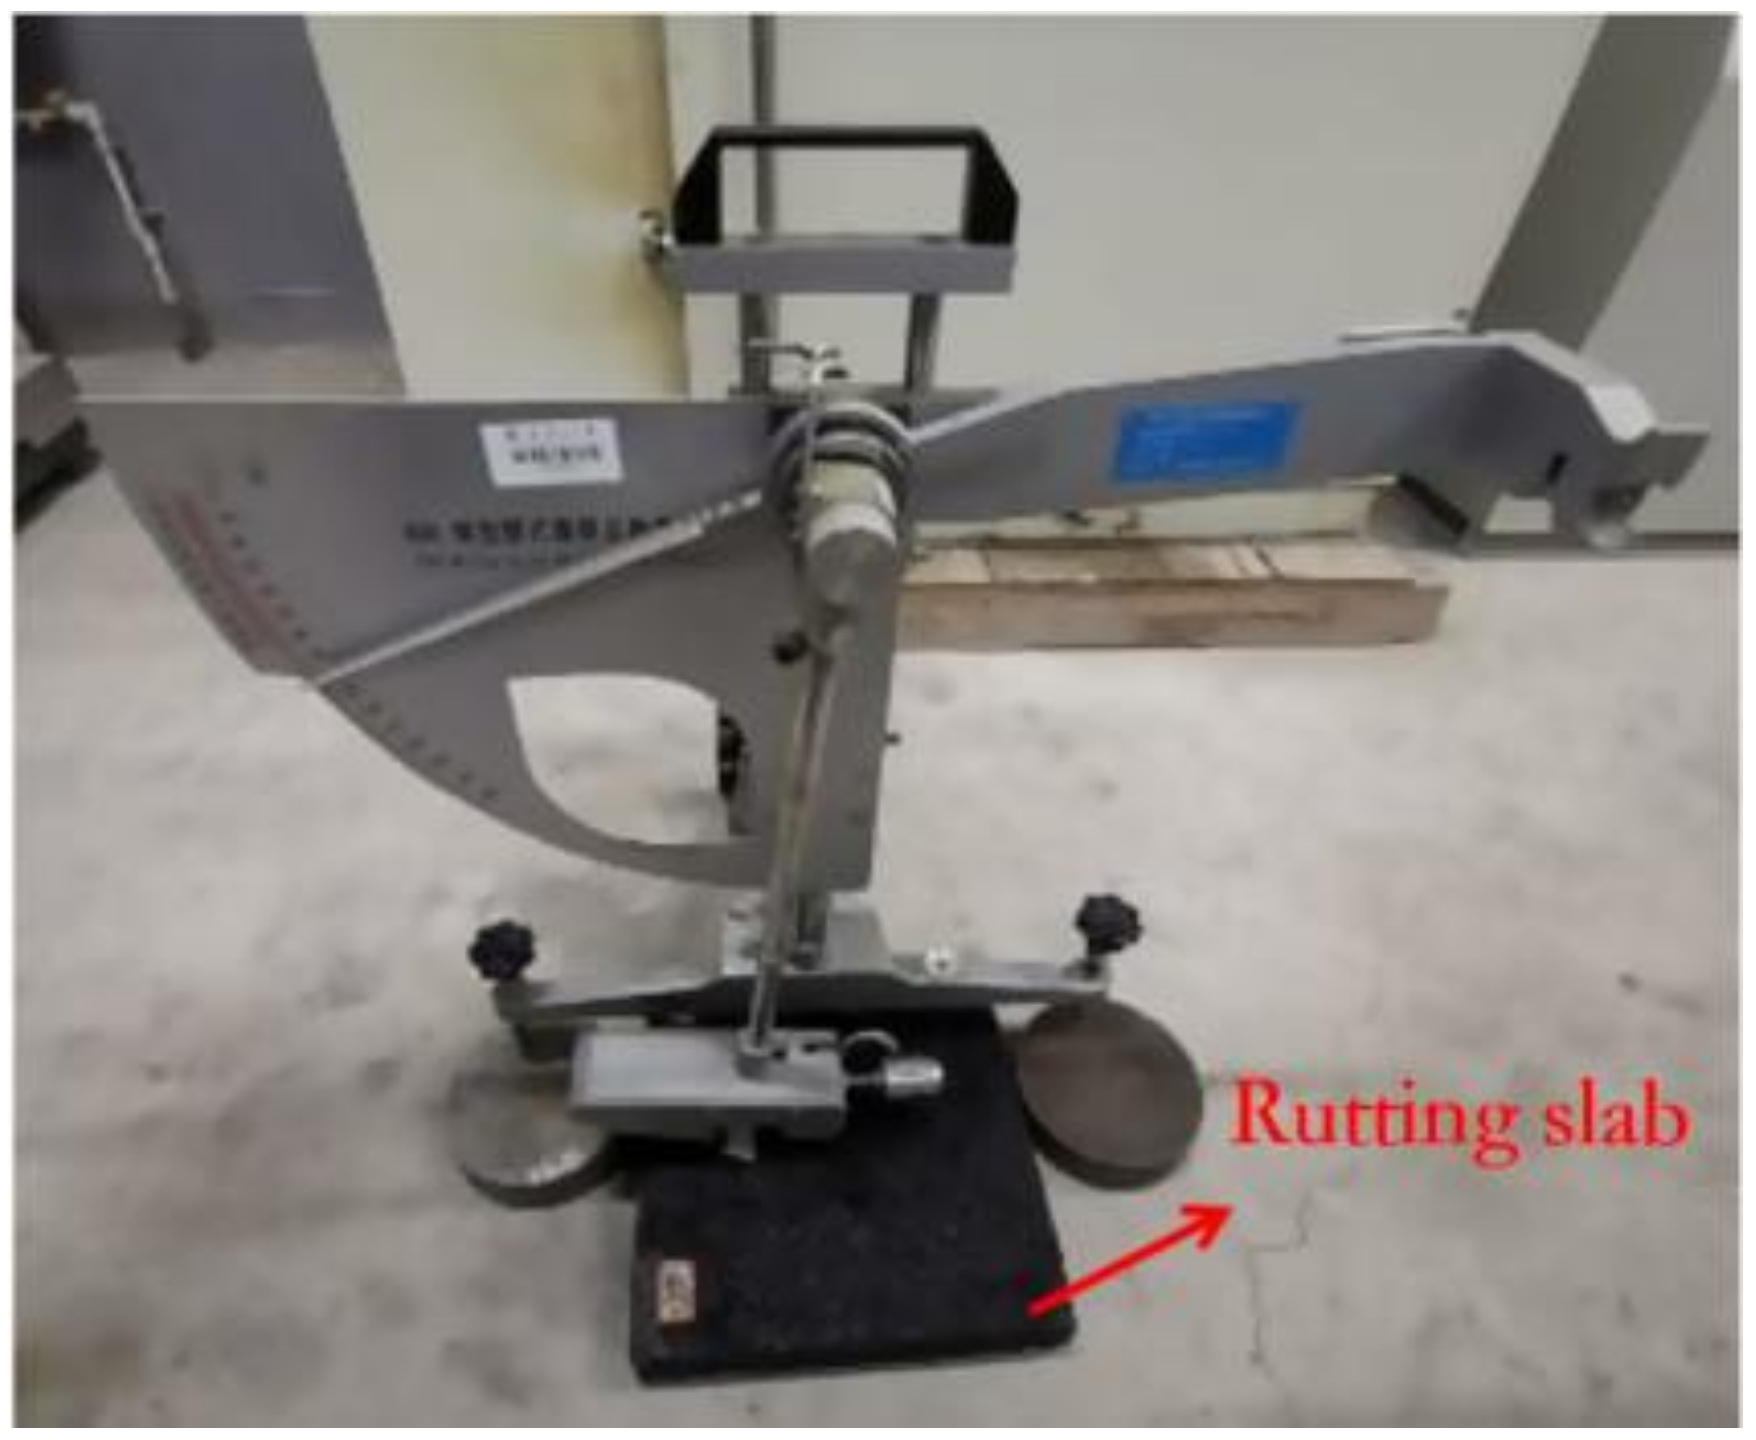
2.5. Friction and MTD Measurement

In this experiment, the friction property was characterized by the British pendulum number (BPN) using a British Pendulum Tester (Figure 6) in accordance to EN 13036-4 [28]. In order to eliminate the effect of the temperature, the rutting slabs were conditioned in a room with a constant temperature of 20 °C. In order to obtain the traditional macro-texture parameter, the MTD was also obtained using the sand patch method.
Additionally, it should be mentioned that, after a certain number of load repetitions, a large amount of the rubber powder appeared on the surface of the rutting slabs. It was important to clean the surface of the test area so that the measuring for the macro-texture could not be affected by the rubber powder.

3. Results and Discussion

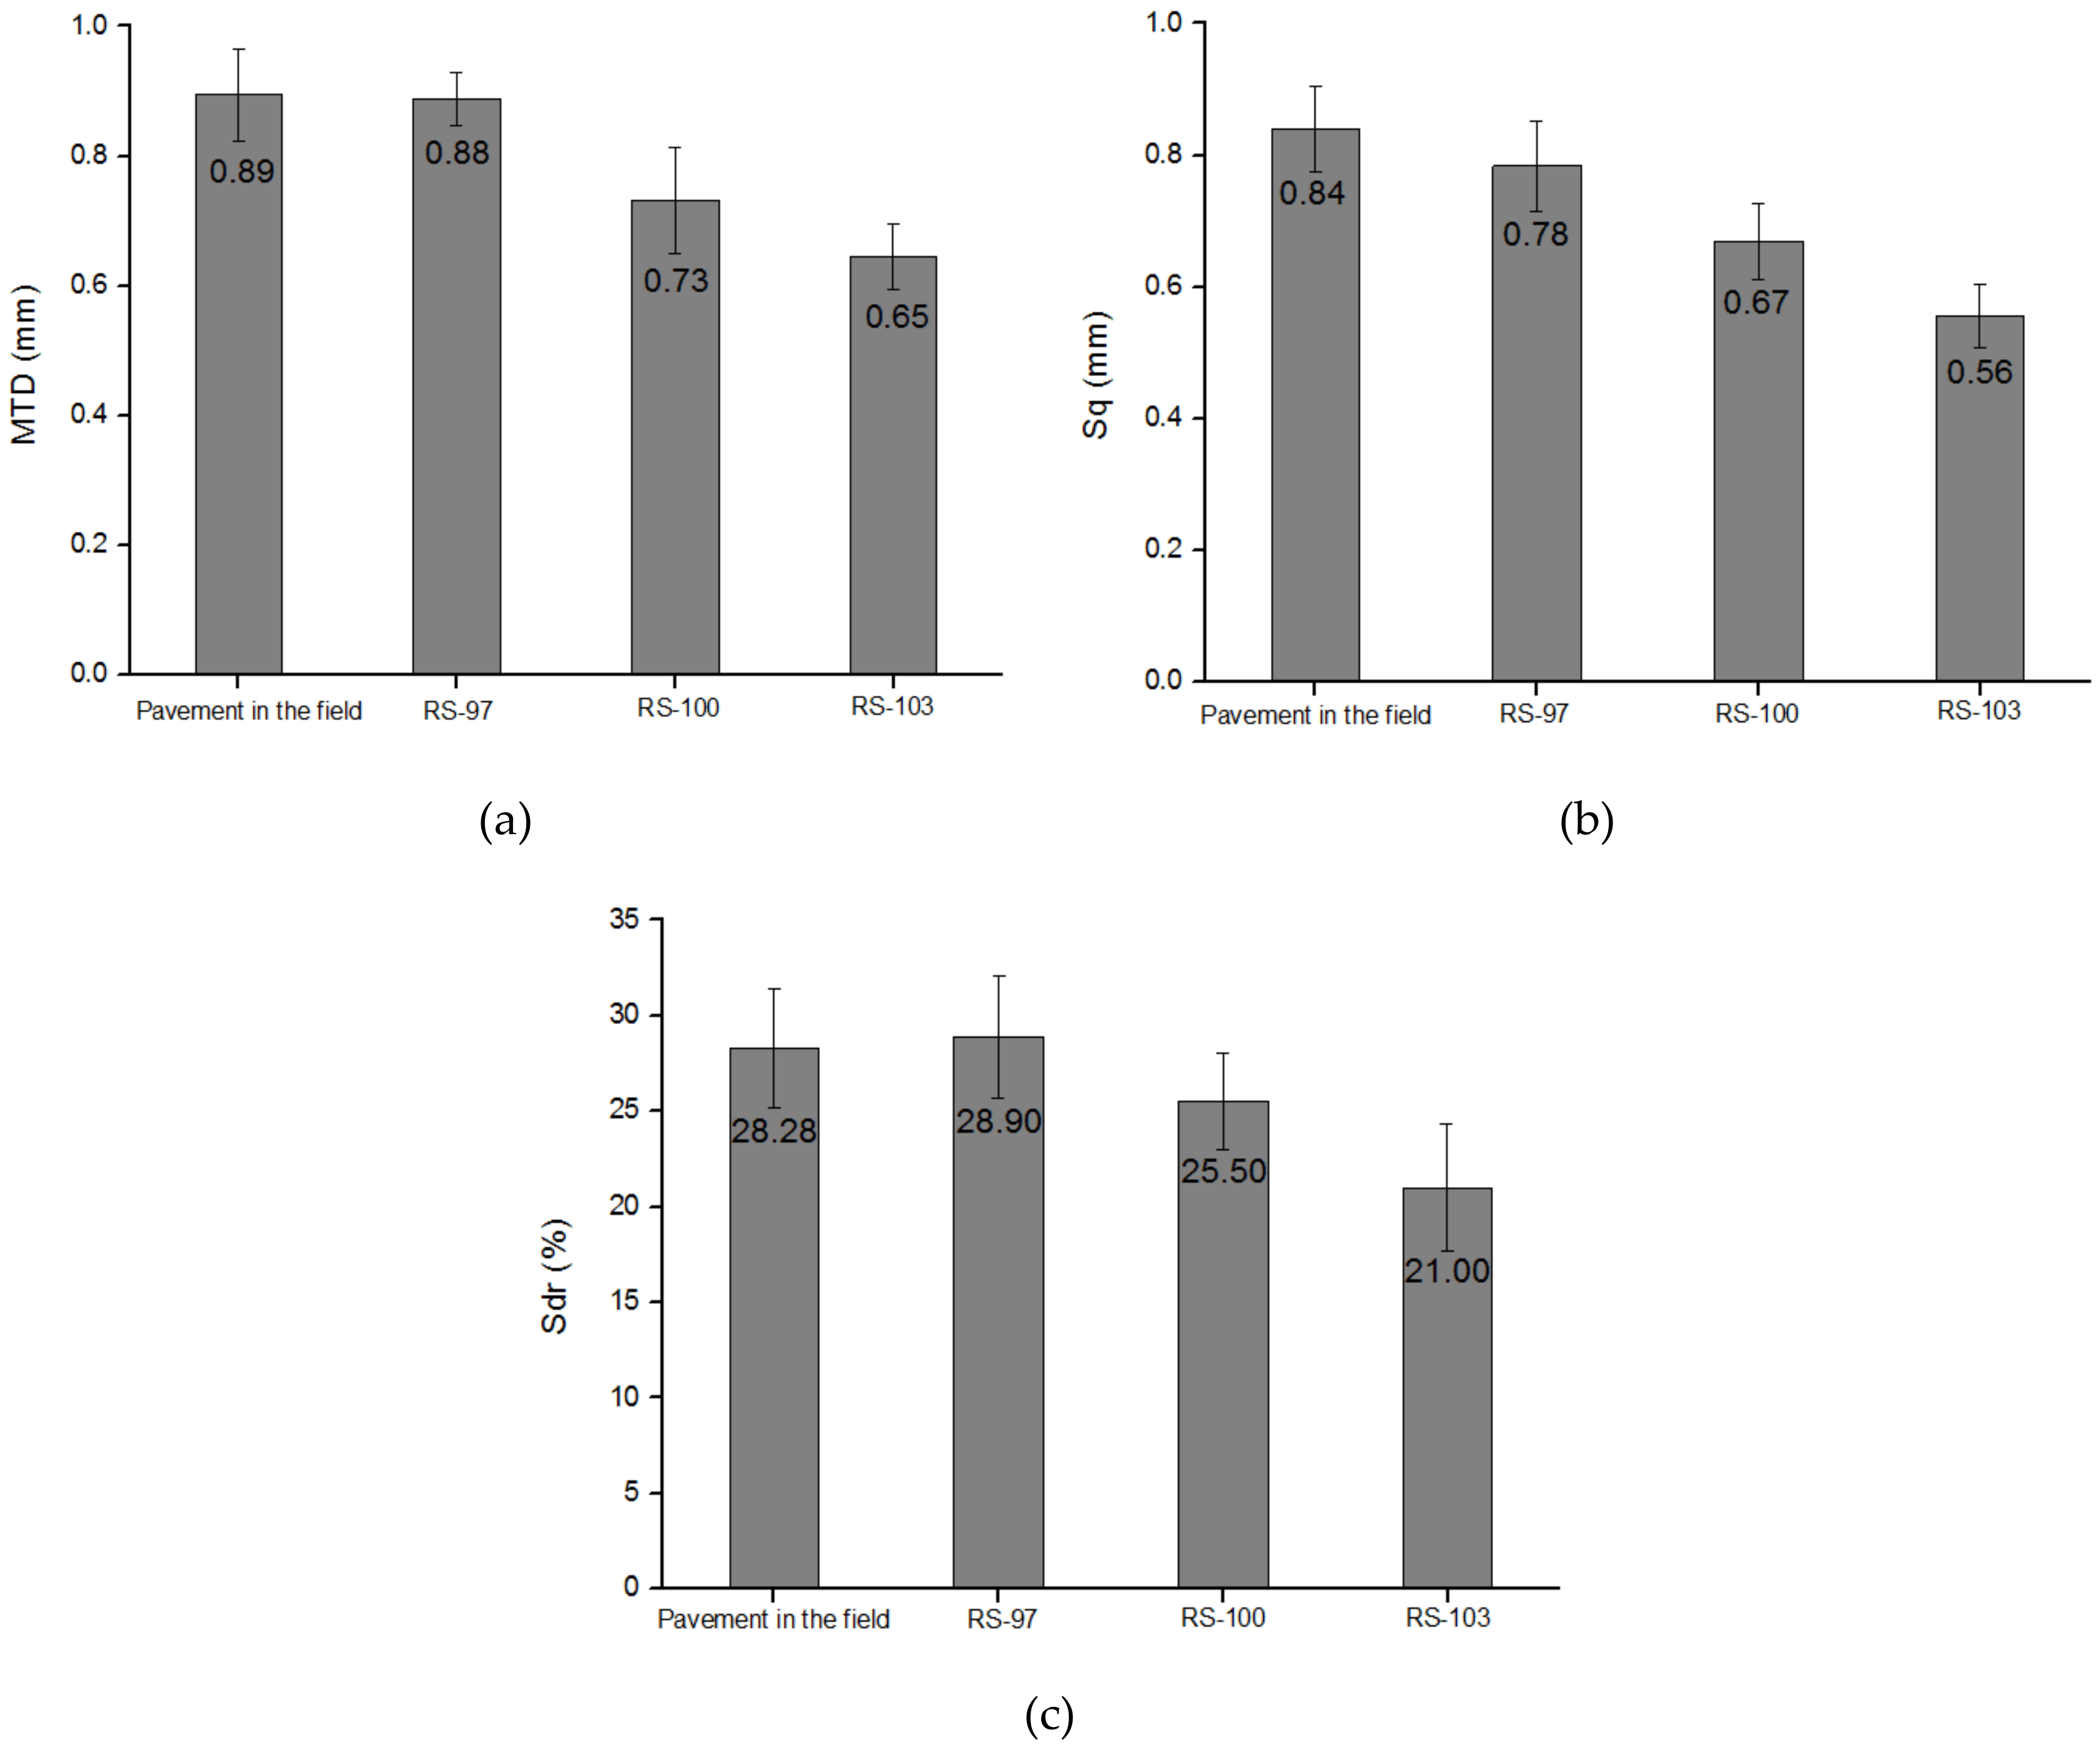
3.1. Texture Parameters Comparison between Field and Rutting Slabs without Load Repetitions

Firstly, the difference among the rutting slabs based on compactness was discussed. As it can be seen in Figure 7b–d, the volume of the valleys on the surface decreased significantly with the increase of compactness. That shows the surface of the rutting slabs became smoother with the increase of compactness. As it can be observed in Figure 8a–c, the values of MTD, S q , and S d r decreased with the increase of compactness, which demonstrated that the rutting slabs with higher compactness have worse macro-texture. In addition, the decrease of the macro-texture can weaken the drainage capacity of road surface. The friction at high speed maybe decreased for that [29,30]. In conclusion, for the AC-13 asphalt concrete studied in this study, the compactness exhibited a significant effect on the surface texture parameters of the rutting slabs, while surfaces with higher compactness were smoother.
Secondly, in order to determine whether the surface of the rutting slab can simulate the pavement in the field, the differences between pavement in the field and rutting slab were discussed. As it can be seen in Figure 7a–d, the surface of the pavement in the field is similar with the RS-97, and the surface of the RS-100 and RS-103 were smoother than the pavement in the field and the RS-97. As it can be seen in Figure 8a–c, there was no obvious difference in the MTD, S q , and S d r values between the pavement in the field and RS-97. The MTD, S q , and S d r values of RS-100 and RS-103 were significantly smaller than those of the pavement in the field. In conclusion, according to the MTD, S q , and S d r values, the RS-97 can simulate the pavement in the field under standard compaction, the RS-100 and RS-103 may simulate the pavement in the field under excessive compaction.

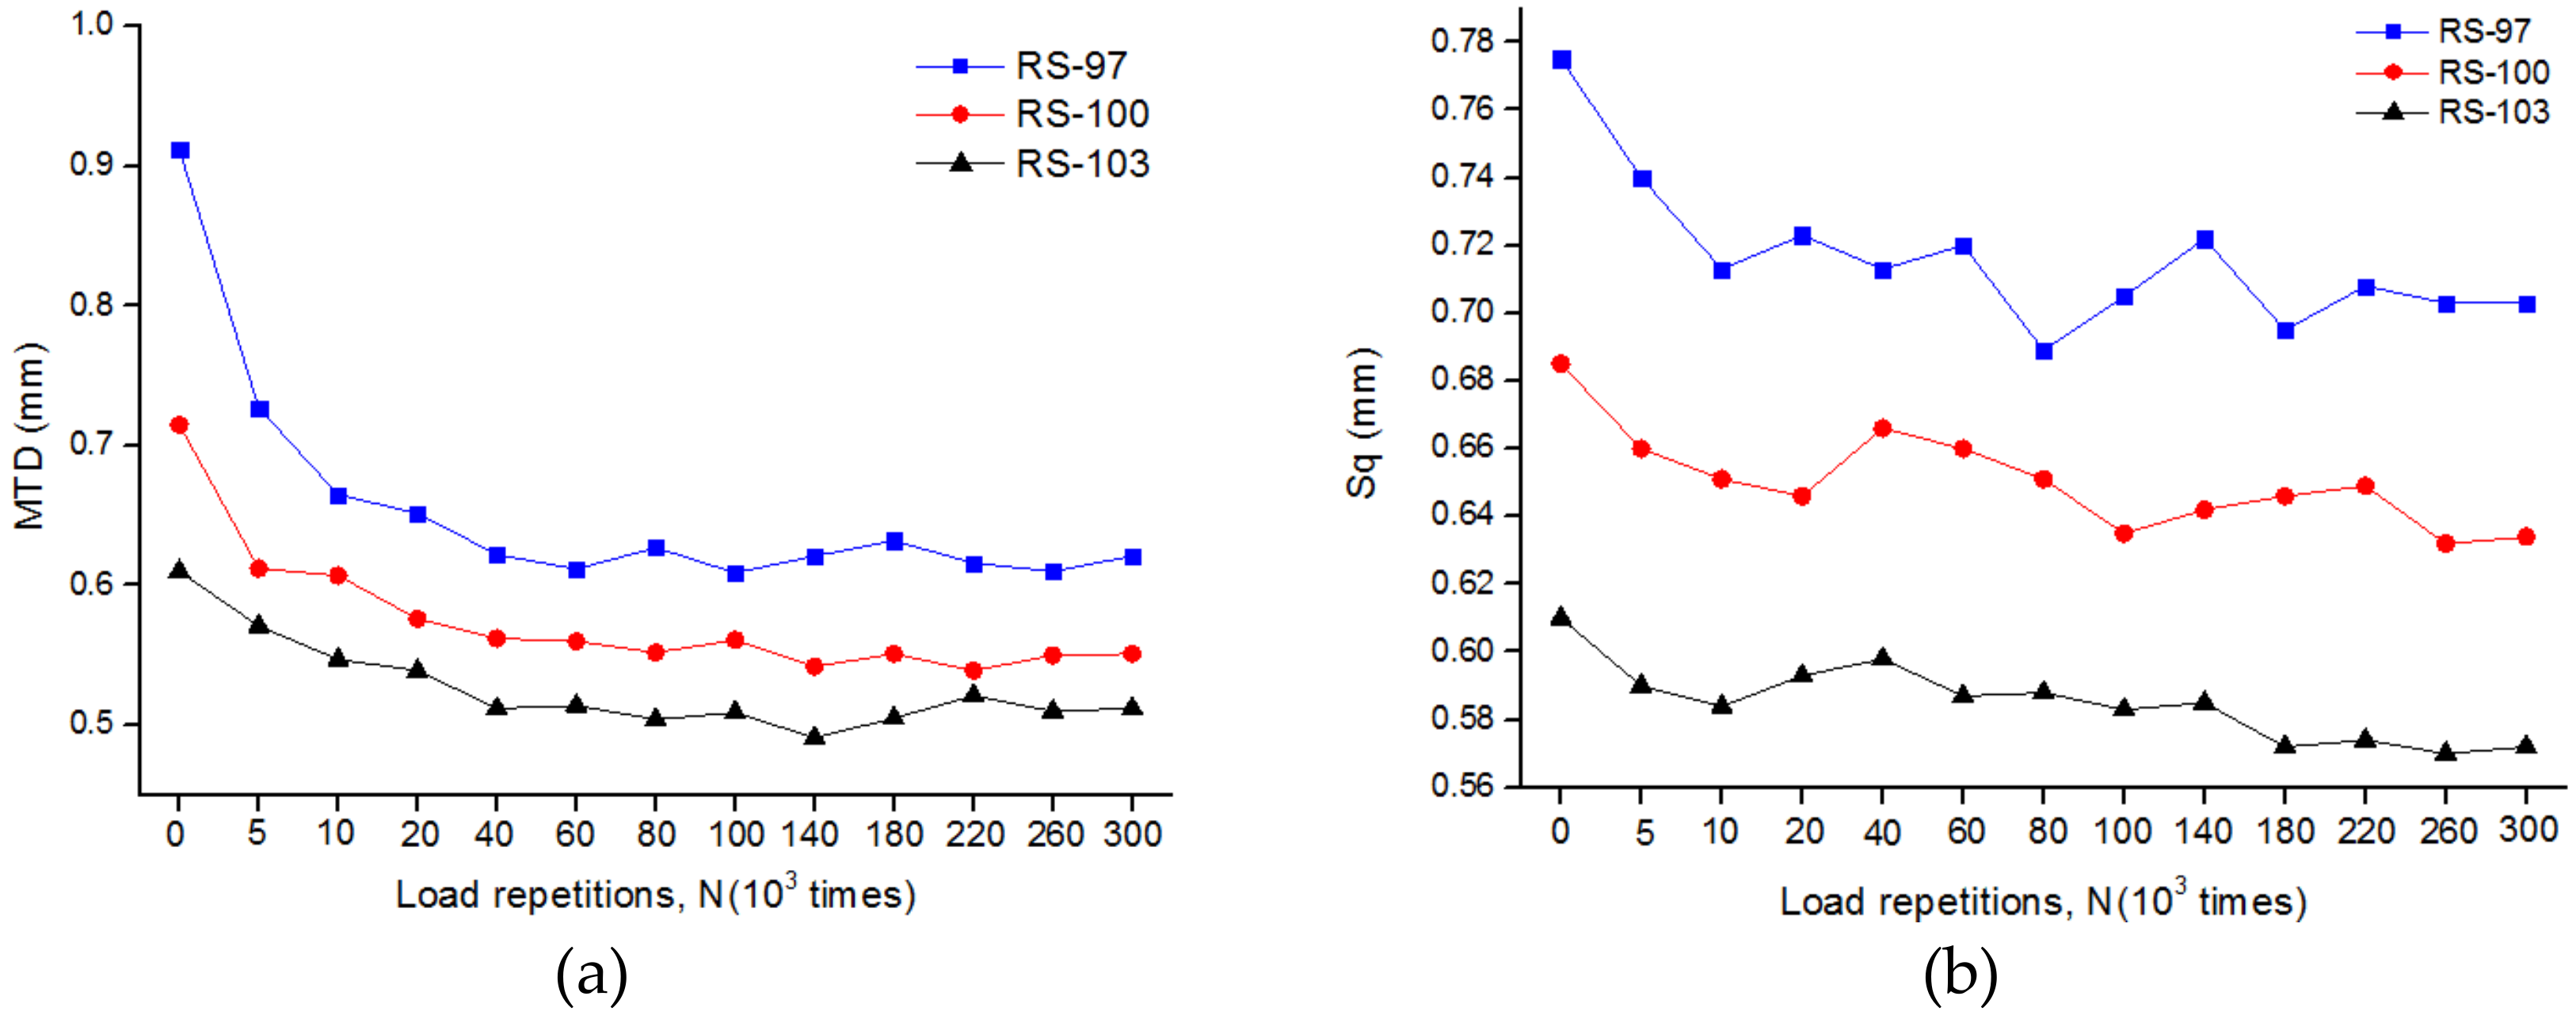
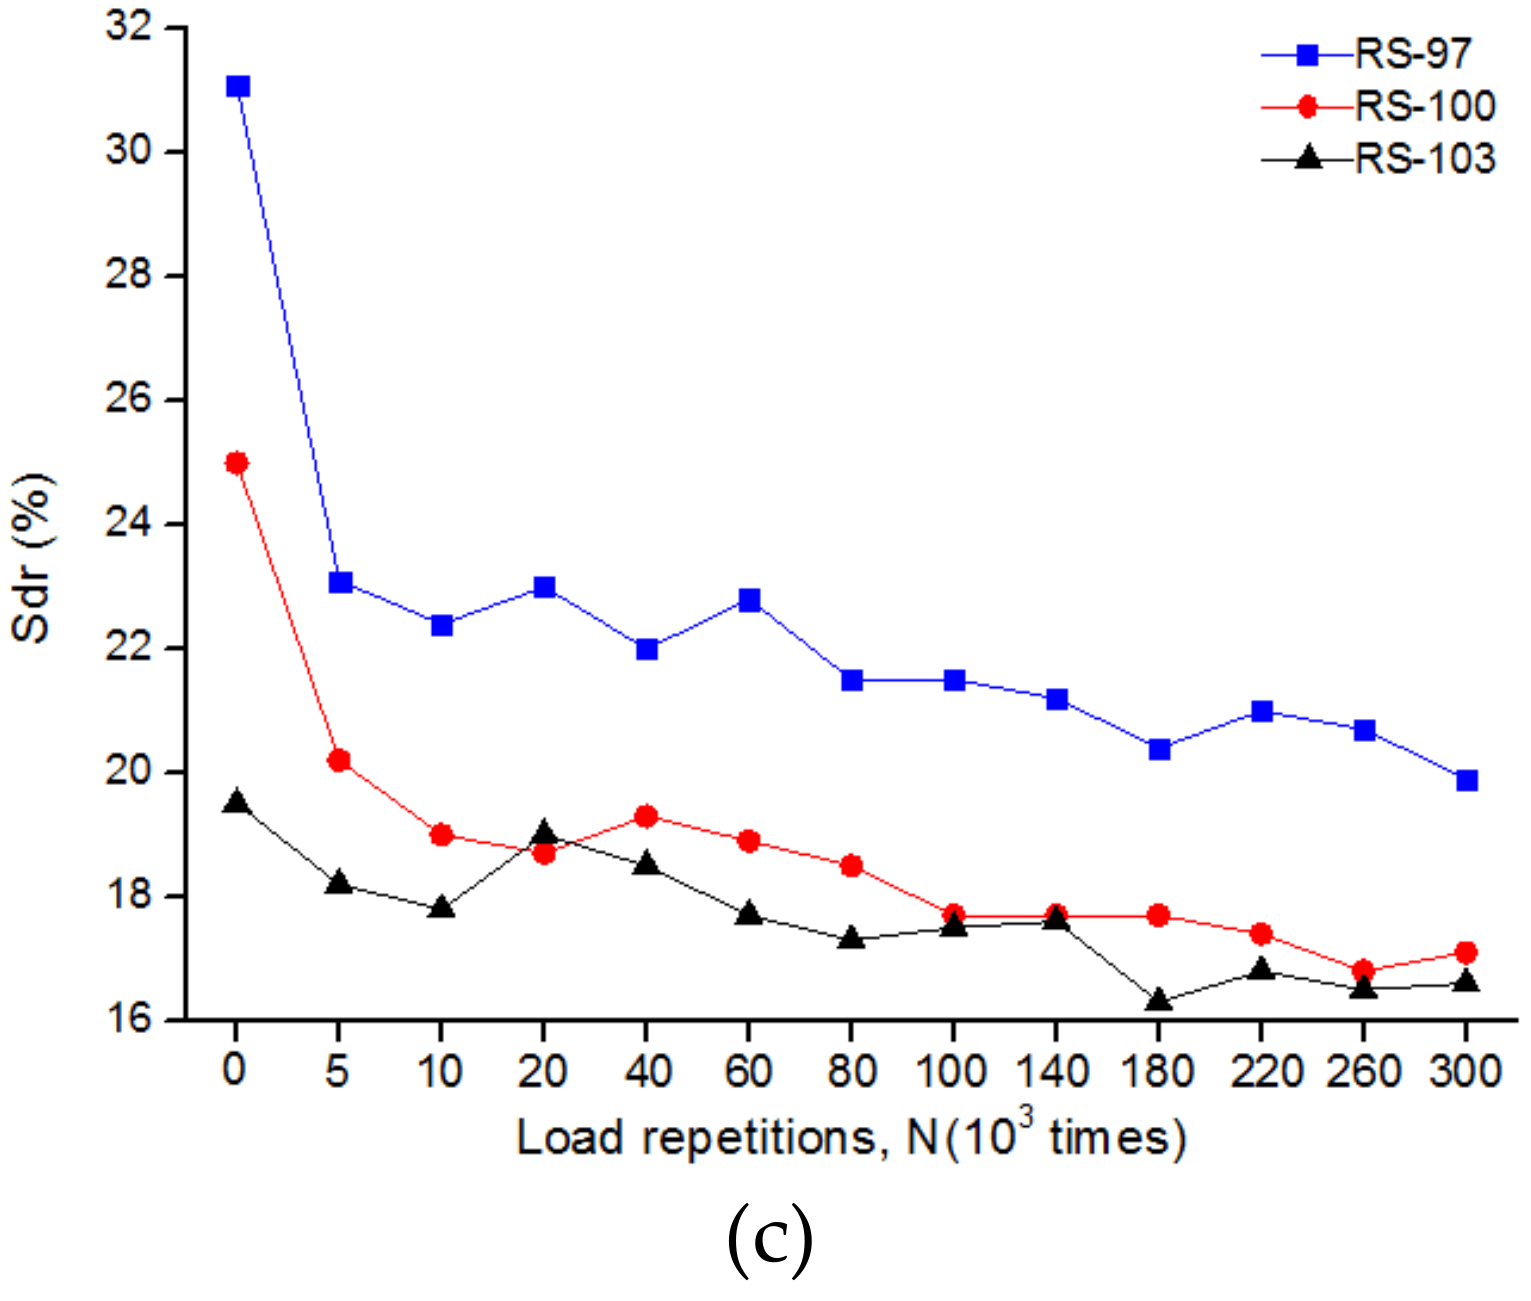
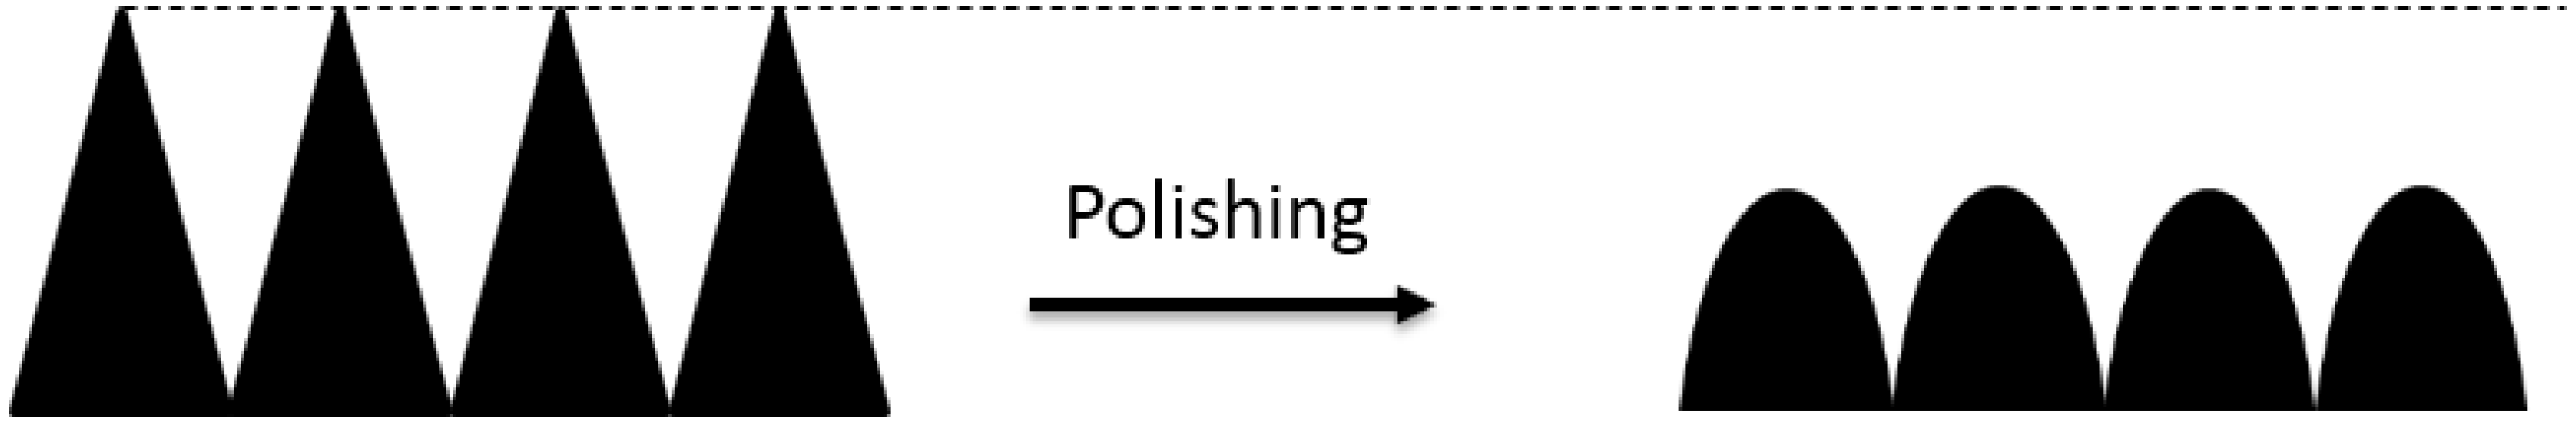
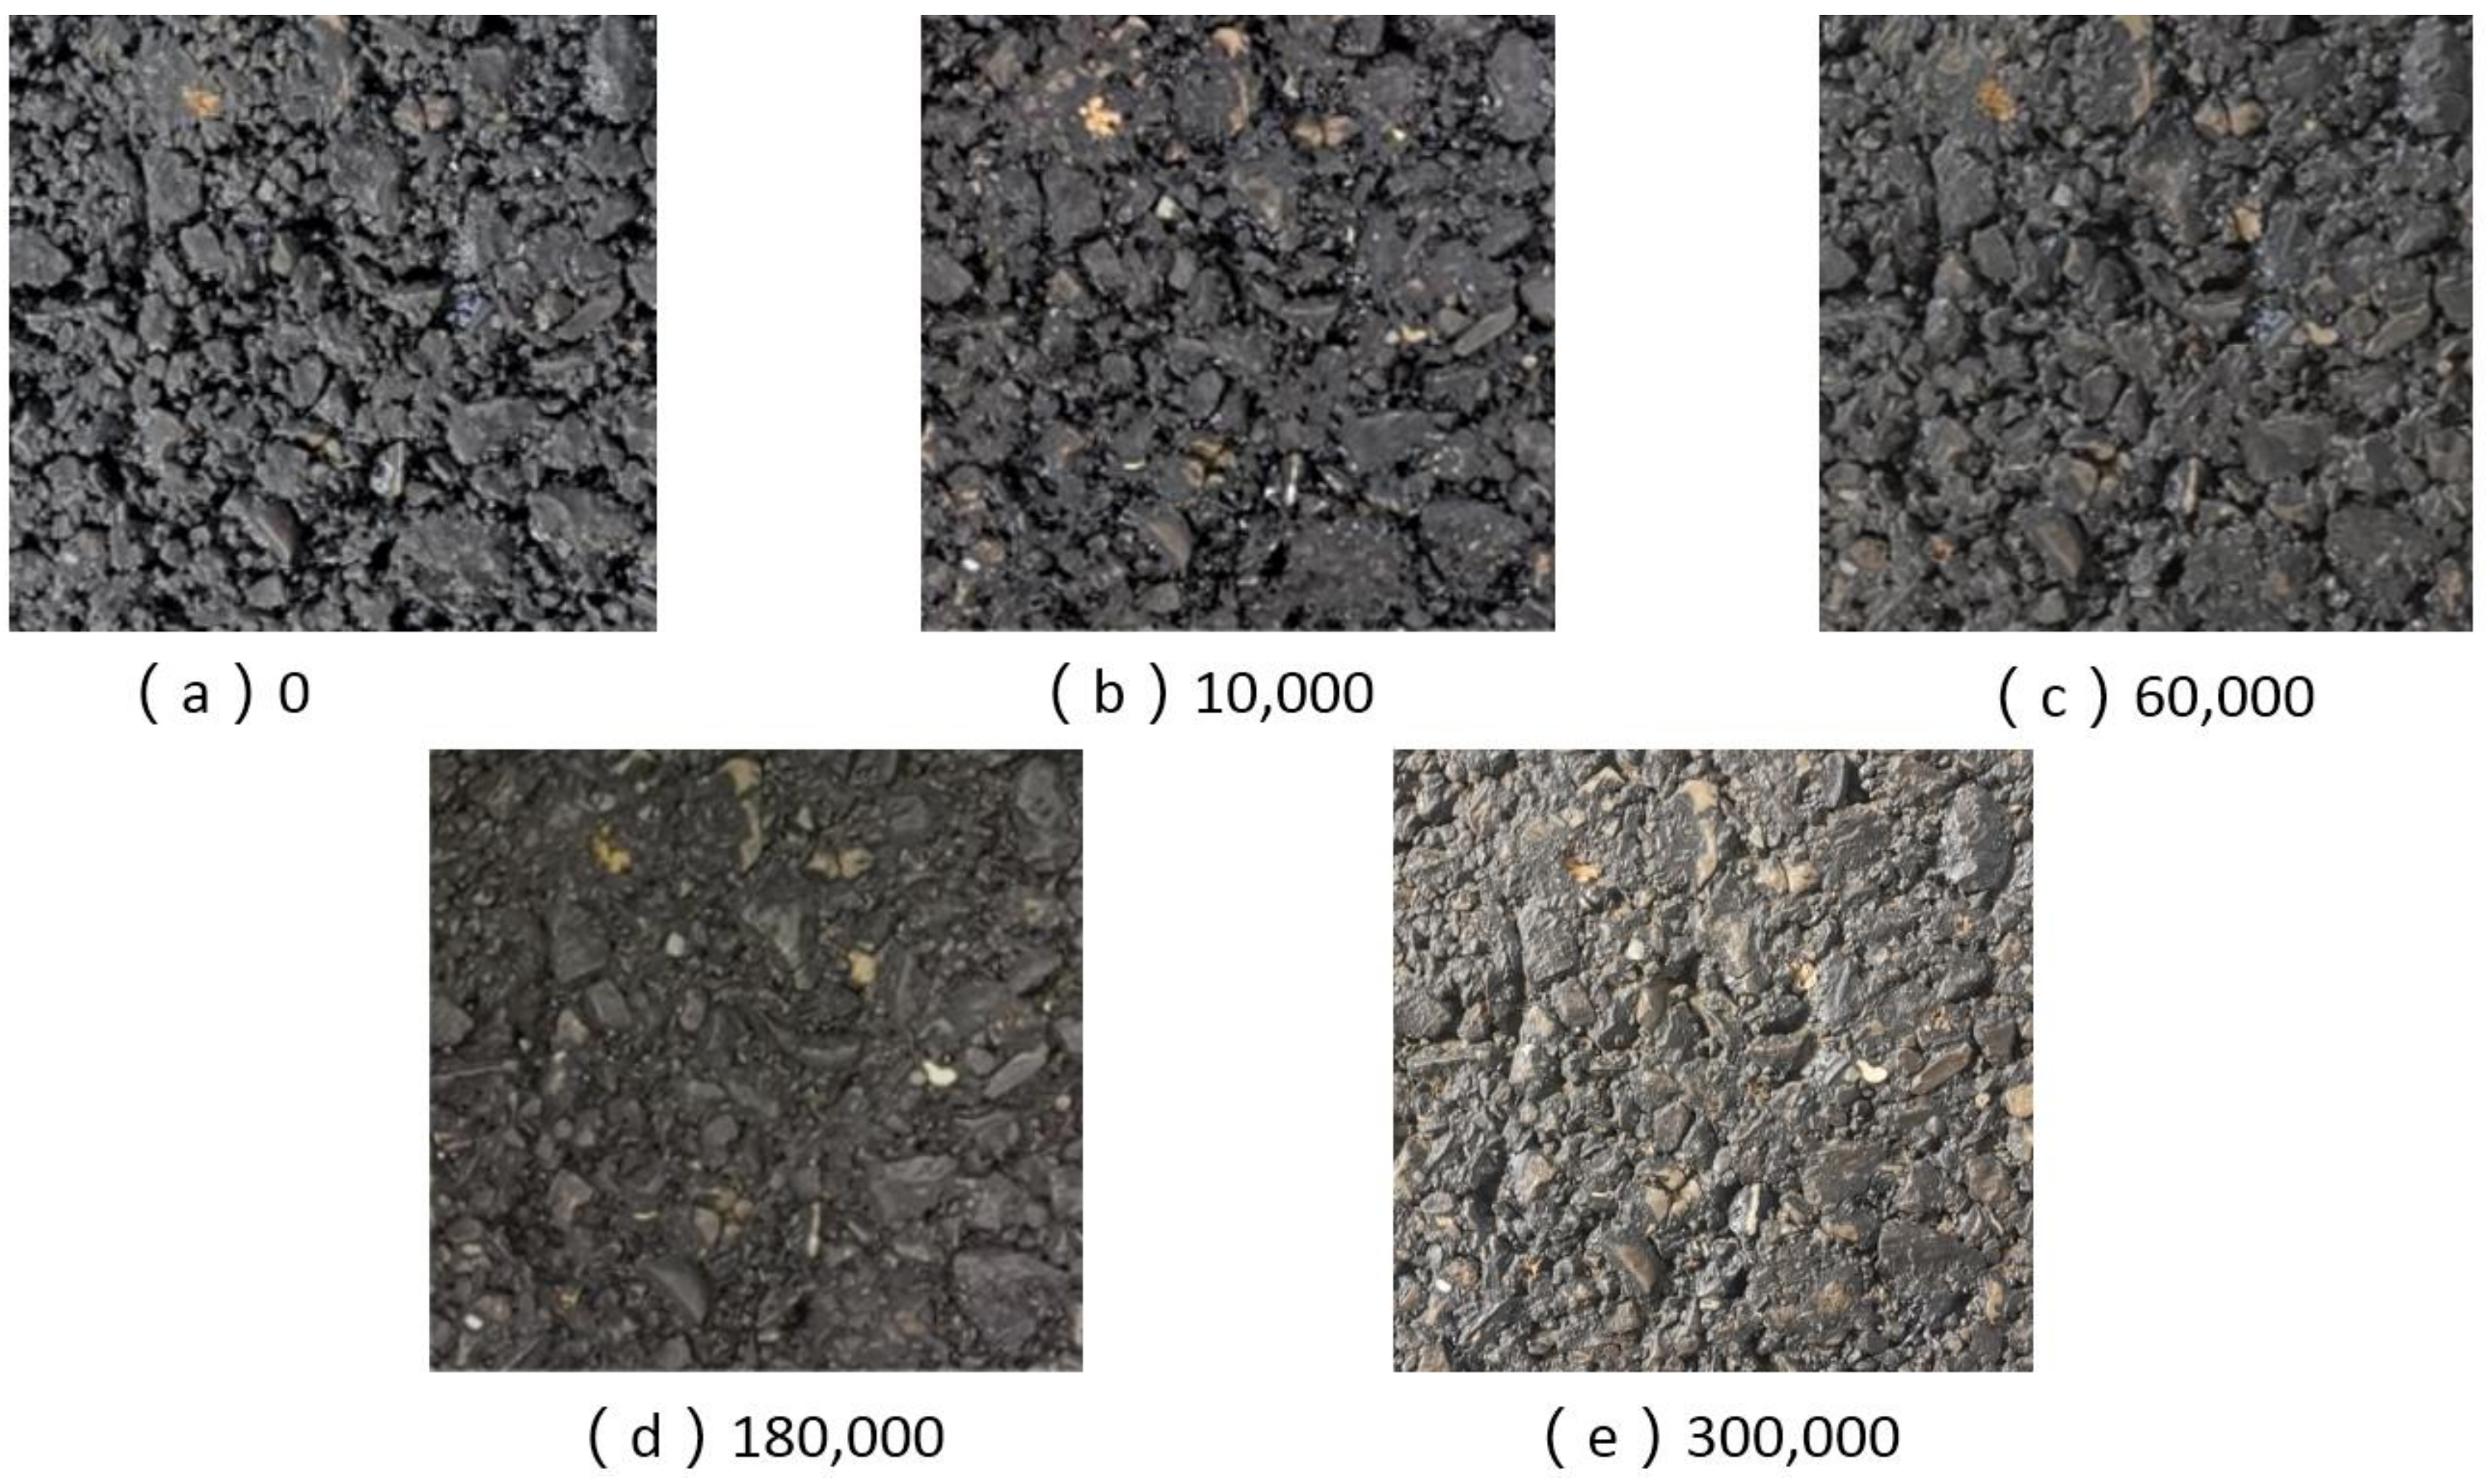
3.2. Change of Texture Parameters during the Polishing Process

During the polishing process, the change of texture parameters for the rutting slabs with different compactness is shown in Figure 9. The MTD is one of the most common parameters to characterize the macro-texture of road surface. During the polishing process, Qian et al. came up with the fact that the change of the MTD can be defined as three phases: The compacting phase, the polishing phase, and the equilibrium phase [20].
From 0 to 5000 load repetitions, as shown in Figure 9a–c, the values of the MTD, S q , and S d r for the RS-97 all decreased sharply. In contrast, for the MTD, S q , and S d r of the RS-100 and RS-103, the extent of the decrease became smaller as the compactness increased from 100% to 103%, which indicates that the decrease for the RS-97 was mainly due to the compaction of the rutting slab. For RS-100 and RS-103, the extent of the decrease was not obvious for the rutting slabs with higher compactness was hard to be compacted again. That proves the existence of the compacting phase. The asphalt concrete has nonlinear viscoelasticity. During the early stage of the loading process, with the increasing of the load repetitions, Darabi et al. regarded that the permanent deformation caused by the irrecoverable strain increased fast [31]. During the compacting phase, the permanent deformation can change the texture parameters fast.
In Figure 9a–c, from 5000 to 80,000 load repetitions, the values of the MTD, S q , and S d r for all the rutting slabs decreased slowly. After the compacting phase, the reason for the decrease of the texture parameters is mainly due to the polishing of coarse aggregate by the load repetitions [20]. In a previous study, during the polishing process, Do et al. showed that the limestone which was composed of a single mineral was mainly subjected to the general polishing. The general polishing tends to remove materials and its polishing mechanism is shown in Figure 10 [30]. Hence, the MTD, S q , and S d r which reflects the texture amplitude of the surface decreased slowly, and the decrease rate is lower than the compacting phase. In addition, there was no obvious difference between the decrease rate among the RS-97, RS-100, and RS-103.
In Figure 9a, from 80,000 to 300,000 load repetitions, the values of the MTD stabilized. During this phase, although the coarse aggregate was polished by the load repetitions as before, the extent of the decrease for the texture amplitude was so tiny that the MTD cannot capture the change. Hence, this phase is regarded as the equilibrium phase. In addition, it is obvious that the rutting slabs with smaller compactness have the bigger value of MTD.
As it can be seen in Figure 9b,c, from 80,000 to 300,000 load repetitions, the values of the S q and S d r still decreased slowly. The reason may be that the S q and S d r were calculated from the 3D surface topography with high resolution. Additionally, the S q and S d r can reflect more details than the MTD using the sand patch method. Moreover, it is obvious that the rutting slabs with smaller compactness have the higher value of S q and S d r too.
In conclusion, although the rutting slab with smaller compactness was easy to be compacted again during the early stage of the polishing process, the rutting slab with smaller compactness had higher values of the MTD, S q , and S d r during the whole polishing process. Compared with the MTD, the S q and S d r can reflect the change of the macro-texture with high accuracy during the whole polishing process.

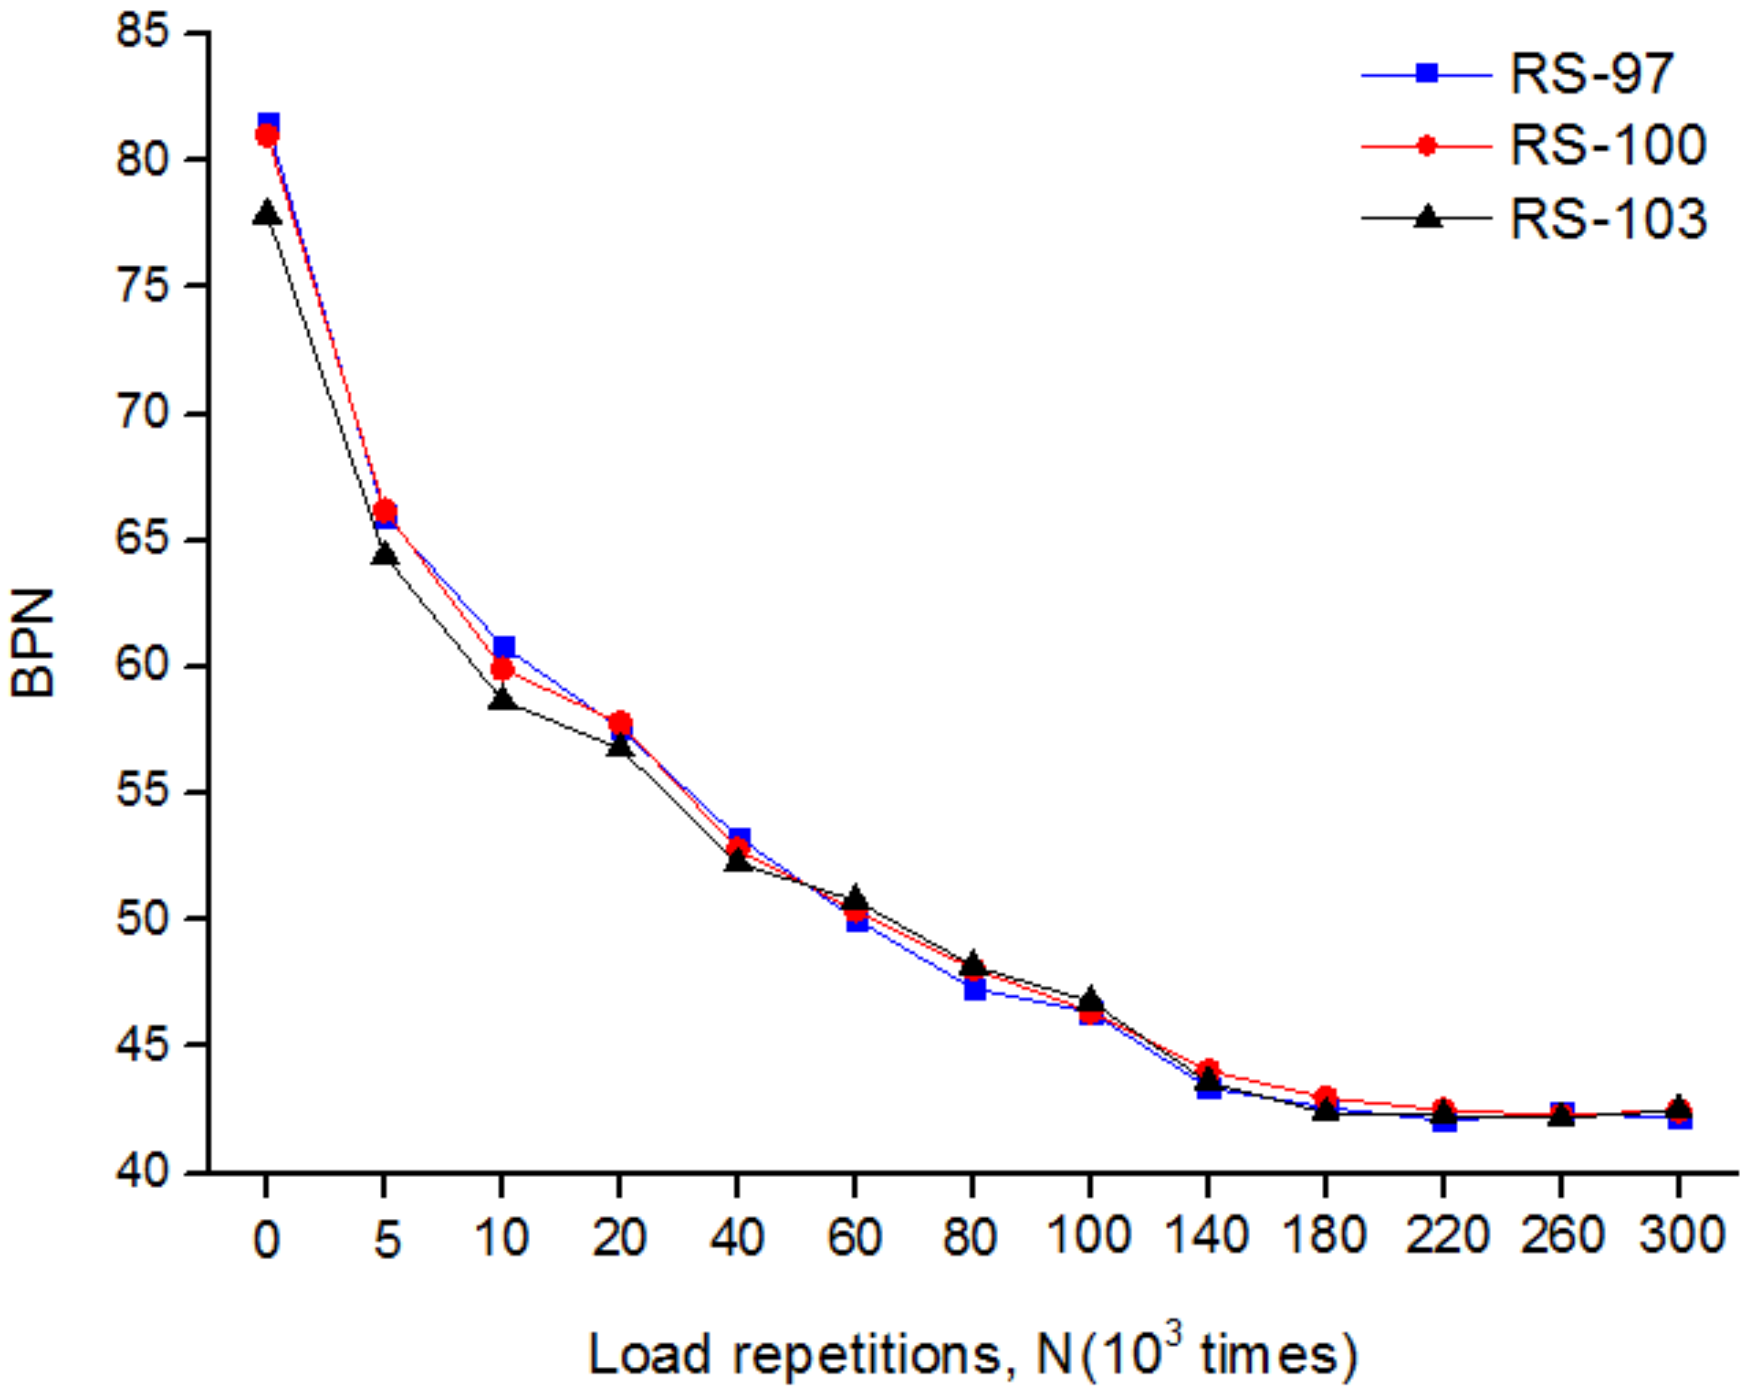
3.3. Change of Friction during the Polishing Process

As it can be seen in Figure 11, the specimens polished by the CVS demonstrated an obvious abrasion phenomenon. It is worth mentioning that, without the polishing agent, only the peaks of the coarse aggregate on the surface can be polished and the valleys of the surface still have asphalt film (if the picture was taken without good lighting effect, it is hard to distinguish the aggregate in gray color and the asphalt film on the valleys). That shows the tire can only contact the partial area of the surface for the rutting slabs.
The measured BPN values at different load repetitions are presented in Figure 12. It can be observed that the BPN of all rutting slabs decreased quickly in the early stage, then decreased slowly, and finally it was stabilized at a low value. This is in accordance with previous studies. For example, Khasawneh polished hot-mix asphalt specimens in the laboratory and reported that the BPN initially decreased quickly and then slowly [32].
At the initial stage, the RS-97 and RS-100 had similar BPN, while the RS-103 had the smallest BPN. This phenomenon vanished after the 20,000 load repetitions. Except the obvious difference before 20,000 load repetitions, no significant difference in the BPN of the rutting slabs during the polishing process was observed. It shows that the pavement with higher compactness may have smaller BPN in the early stage of the polishing process. As shown in Figure 7b–d, the reason maybe that the surface with higher compactness is smoother. When the asphalt film on the coarse aggregate was worn off, the BPN which reflects the friction coefficient at low speed was determined by the micro-texture of the coarse aggregate. Since all the rutting slabs used the same aggregate, the rutting slabs with different compactness had the similar BPN in most case.
By harmonizing the BPN test and MTD test, the international friction index (IFI) was used to make a comprehensive evaluation on the friction of road pavement [20,33]. The IFI contains two parameters: F60 and   S p , the calculation of the IFI is as follows:
S p = a + b · T x
F 60 = A + B · F R S · e x p S 60 / S p
where S p is the texture parameter of IFI; F60 is the friction parameter of IFI; Tx is the macro-texture parameter of pavement, equivalent to the MTD in this research; a, b, A, and B are empirically determined coefficients, a = −11.5981, b = 113.63426, A = 0.07784, B = 0.00709 [30]; S is the slip speed, which was defined as the swing speed of BPT, S = 10 km/h; FRS is defined as the BPN value measured at speed S.
Considering both BPN and MTD, the F60 can reflect the friction at high speed [14,20]. The F60 values of rutting slabs under different load repetitions are shown in Figure 13. During the polishing process, the F60 decreased as the load repetitions increased. During the whole polishing process, the rutting slab with smaller compactness had the higher F60. As shown in Figure 12, in most cases, the BPN which reflects the friction at low speed had no obvious difference among the rutting slabs with different compactness. When the test speed increases, the friction can decrease. For the wet road surface, the macro-texture was conducive to enhancing the drainage capacity and the deformation of tire. That could reduce the extent of the decrease for friction. Hence, with the similar BPN, the rutting slab with smaller compactness had higher F60 for the higher value of the MTD, as shown in the Figure 8a. In conclusion, in order to improve the friction at high speed of the road pavement, it is necessary to avoid the asphalt pavement for the wearing course that is compacted excessively during the process of construction.

4. Conclusions

During the polishing process, the texture and friction of the asphalt pavement changed as the number of load repetitions increased. This study used rutting slabs to simulate the asphalt pavement in the field. Three rutting slabs with 97%, 100%, and 103% compactness were polished by the CVS. The BPN, MTD, and the 3D surface topography were obtained during the polishing process. S q and S d r were used to characterize the texture of the surface. The effect of the compactness on the texture and friction of asphalt concrete were mainly studied, the main conclusions are as follows:
  • At the initial state of the AC-13 asphalt concrete in this study, the values of the MTD, S q , and S d r of the rutting slabs decreased obviously as the compactness increased, and the surface was smoother when the compactness was higher.
  • Although the rutting slab with smaller compactness was easy to be compacted again during the early stage of the polishing process, the rutting slab with smaller compactness had higher value of the MTD during the whole polishing process.
  • The impact of compactness on BPN is insignificant during the polishing process. However, the rutting slab with smaller compactness could have higher F60 owing to the higher values of the MTD.
  • To improve the friction at high speed, it is necessary to avoid excessive compaction for the asphalt concrete for the wearing course in the process construction.

Author Contributions

Conceptualization, L.H. and T.W.; methodology, T.W.; software, X.P. and S.X.; writing-original draft preparation, T.W.; writing-review and editing, L.H. and D.Y.; supervision, L.H. project administration, L.H. All authors have read and agreed to the published version of the manuscript.

Funding

This research was funded by the National Key R&D Program of China (Grant No. 2018YFB1600200), the Fundamental Research Funds for the Central Universities (Grant No. 310821173101), and the Fundamental Research Funds for the Central Universities (Grant No. 300102218515).

Conflicts of Interest

The authors declare no conflict of interest.

References

  1. Asi, I.M. Evaluating skid resistance of different asphalt concrete mixes. Build. Environ. 2007, 42, 325–329. [Google Scholar] [CrossRef]
  2. Yan, B.; Mao, H.; Zhong, S.; Zhang, X. Experimental Study on Wet Skid Resistance of Asphalt Pavements in Icy Conditions. Materials 2019, 12, 1201. [Google Scholar] [CrossRef] [PubMed] [Green Version]
  3. Vaiana, R.; Balzano, F.; Iuele, T.; Gallelli, V. Microtexture Performance of EAF Slags Used as Aggregate in Asphalt Mixes: A Comparative Study with Surface Properties of Natural Stones. Appl. Sci. 2019, 9, 3197. [Google Scholar] [CrossRef] [Green Version]
  4. Hofko, B.; Kugler, H.; Chankov, G.; Spielhofer, R. A laboratory procedure for predicting skid and polishing resistance of road surfaces. Int. J. Pavement Eng. 2017, 20, 439–447. [Google Scholar] [CrossRef] [Green Version]
  5. Wallman, C.G.; Åström, H. Friction measurement methods and the correlation between road friction and traffic safety. Vti. Meddelanden. 2001, 3, 367–377. [Google Scholar]
  6. Dunford, A. Friction and the Texture of Aggregate Particles Used in the Road Surface Course. Ph.D. Thesis, University of Nottingham, Nottingham, UK, 2013. [Google Scholar]
  7. PIARC. Report of the Committee on Surface Characteristics. In Proceedings of the Permanent International Association of Road Congress (PIARC) XVIII World Road Congress, Brussels, Belgium, 13–19 September 1987. [Google Scholar]
  8. Kogbara, R.B.; Masad, E.; Kassem, E.; Scarpas, A.; Anupam, K. A state-of-the-art review of parameters influencing measurement and modeling of skid resistance of asphalt pavements. Constr. Build. Mater. 2016, 114, 602–617. [Google Scholar] [CrossRef]
  9. Ahammed, M.A.; Tighe, S.L. Asphalt pavements surface texture and skid resistance—Exploring the reality. Can. J. Civil. Eng. 2012, 39, 1–9. [Google Scholar] [CrossRef]
  10. Kouchaki, S.; Roshani, H.; Prozzi, J.; Garcia, N.Z.; Hernandez, J.B. Field Investigation of Relationship between Pavement Surface Texture and Friction. Transp. Res. Rec. J. Transp. Res. Board 2018, 2672, 395–407. [Google Scholar] [CrossRef]
  11. Bitelli, G.; Simone, A.; Girardi, F.; Lantieri, C. Laser Scanning on Road Pavements: A New Approach for Characterizing Surface Texture. Sensors 2012, 12, 9110–9128. [Google Scholar] [CrossRef]
  12. Dunford, A.; Parry, T.; Shipway, P.; Viner, H. Three-dimensional characterisation of surface texture for road stones undergoing simulated traffic wear. Wear 2012, 292, 188–196. [Google Scholar] [CrossRef]
  13. Liu, Y.; Cheng, X.; Yang, Z. Effect of Mixture Design Parameters of Stone Mastic Asphalt Pavement on Its Skid Resistance. Appl. Sci. 2019, 9, 5171. [Google Scholar] [CrossRef] [Green Version]
  14. Georgiou, P.; Loizos, A. A laboratory compaction approach to characterize asphalt pavement surface friction performance. Wear 2014, 311, 114–122. [Google Scholar] [CrossRef]
  15. Praticò, F.G.; Vaiana, R. A study on volumetric versus surface properties of wearing courses. Constr. Build. Mater. 2013, 38, 766–775. [Google Scholar] [CrossRef]
  16. Hu, L.; Yun, D.; Liu, Z.; Du, S.; Zhang, Z.; Bao, Y. Effect of three-dimensional macro-texture characteristics on dynamic frictional coefficient of asphalt pavement surface. Constr. Build. Mater. 2016, 126, 720–729. [Google Scholar] [CrossRef]
  17. Li, Q.; Yang, G.; Wang, C.; Zhan, Y.; Wang, C. Novel Macro- and Micro-texture Indicators for Pavement Friction by Using High-Resolution Three-Dimensional Surface Data. Transport. Res. Rec. 2017, 2641, 164–176. [Google Scholar] [CrossRef]
  18. Do, M.-T.; Tang, Z.; Kane, M.; De Larrard, F. Pavement polishing—Development of a dedicated laboratory test and its correlation with road results. Wear 2007, 263, 36–42. [Google Scholar] [CrossRef]
  19. Wang, Y.; Yang, Z.; Liu, Y.; Sun, L. The characterisation of three-dimensional texture morphology of pavement for describing pavement sliding resistance. Road Mater. Pavement Des. 2018, 20, 1076–1095. [Google Scholar] [CrossRef]
  20. Qian, Z.-D.; Liu, Y.; Liu, C.-B.; Zheng, N. Design and skid resistance evaluation of skeleton-dense epoxy asphalt mixture for steel bridge deck pavement. Constr. Build. Mater. 2016, 114, 851–863. [Google Scholar] [CrossRef]
  21. Airey, G.; Collop, A. Mechanical and structural assessment of laboratory- and field-compacted asphalt mixtures. Int. J. Pavement Eng. 2014, 17, 50–63. [Google Scholar] [CrossRef] [Green Version]
  22. Ministry of Transport of the People’s Republic of China. Highway Engineering Asphalt and Asphalt Mixture Testing Procedure; JTG E20–2011; Ministry of Transport of the People’s Republic of China: Beijing, China, 2011.
  23. Geometric Product Specifications (GPS)—Surface Texture: Areal; ISO 25178; European Committee for Standardization: Brussels, Belgium, 2012.
  24. Aver’Yanova, I.O.; Bogomolov, D.Y.; Poroshin, V.V. ISO 25178 standard for three-dimensional parametric assessment of surface texture. Russ. Eng. Res. 2017, 37, 513–516. [Google Scholar] [CrossRef]
  25. Sadowski, Ł.; Czarnecki, S.; Hoła, J. Evaluation of the height 3D roughness parameters of concrete substrate and the adhesion to epoxy resin. Int. J. Adhes. Adhes. 2016, 67, 3–13. [Google Scholar] [CrossRef]
  26. Eliaz, N.; Shmueli, S.; Shur, I.; Benayahu, D.; Aronov, D.; Rosenman, G. The effect of surface treatment on the surface texture and contact angle of electrochemically deposited hydroxyapatite coating and on its interaction with bone-forming cells. Acta Biomater. 2009, 5, 3178–3191. [Google Scholar] [CrossRef] [PubMed]
  27. Moore, D.F.; Livingston, D.I. Book Review: A Review of “The Friction of Pneumatic Tyres”. Tire Sci. Technol. 1975, 3, 274–275. [Google Scholar] [CrossRef]
  28. Method for Measurement of Slip/Skid Resistance of a Surface: The Pendulum Test; EN 13036-4; British Standards Institution: London, UK, 2011.
  29. Xie, X.; Lu, G.; Liu, P.; Zhou, Y.; Wang, D.; Oeser, M. Influence of temperature on polishing behavior of asphalt road surfaces. Wear 2018, 402, 49–56. [Google Scholar] [CrossRef]
  30. Do, M.-T.; Tang, Z.; Kane, M.; De Larrard, F. Evolution of road-surface skid-resistance and texture due to polishing. Wear 2009, 266, 574–577. [Google Scholar] [CrossRef]
  31. Darabi, M.K.; Huang, C.-W.; Bazzaz, M.; Masad, E.; Little, D.N. Characterization and validation of the nonlinear viscoelastic-viscoplastic with hardening-relaxation constitutive relationship for asphalt mixtures. Constr. Build. Mater. 2019, 216, 648–660. [Google Scholar] [CrossRef]
  32. Khasawneh, M.A. Macro-texture characterisation of laboratory compacted hot-mix asphalt specimens using a new asphalt polishing machine. Road. Mater. Pavement 2018, 19, 400–416. [Google Scholar] [CrossRef]
  33. Wambold, J.C.; Henry, J.J. International Piarc Experiment to Compare and Harmonize Texture and Skid Resistance Measurement; PIARC Technical Committee on the surface characteristics: Paris, France; Madrid, Spain, 1995. [Google Scholar]
Figure 1. Gradation curve.
Coatings 10 00192 g001
Figure 2. Wheel roller compactor.
Coatings 10 00192 g002
Figure 3. The three-dimensional (3D) surface topography acquisition process. (a) Field setup. (b) Laboratory setup for the rutting slabs.
Coatings 10 00192 g003
Figure 4. Circular vehicle simulator (CVS) configuration.
Coatings 10 00192 g004
Figure 5. CVS working scene.
Coatings 10 00192 g005
Figure 6. British pendulum tester.
Coatings 10 00192 g006
Figure 7. Reconstructed 3D surfaces topography. (a) Pavement in the field; (b) rutting slabs (RS)-97; (c) RS-100; and (d) RS-103.
Coatings 10 00192 g007
Figure 8. Surface texture parameters without load repetitions. (a) MTD; (b) S q ; and (c) S d r .
Coatings 10 00192 g008
Figure 9. Change of texture parameters with load repetitions. (a) MTD; (b) S q ; and (c) S d r .
Coatings 10 00192 g009aCoatings 10 00192 g009b
Figure 10. General polishing mechanisms.
Coatings 10 00192 g010
Figure 11. Fixed area of the RS-97 after different load repetitions.
Coatings 10 00192 g011
Figure 12. Changes of British pendulum number (BPN) with load repetitions.
Coatings 10 00192 g012
Figure 13. Changes of friction parameter (F60) with load repetitions.
Coatings 10 00192 g013

