Article

Construction of Rutile-TiO2 Nanoarray Homojuction for Non-Contact Sensing of TATP under Natural Light

1
Qinghai Provincial Key Laboratory of New Light Alloys, Qinghai Provincial Engineering Research Center of High Performance Light Metal Alloys and Forming, Qinghai University, Xining 810016, China
2
Key Laboratory of Materials Physics, Institute of Solid State Physics, Chinese Academy of Science, Hefei 230031, China
3
Department of Materials Science and Engineering, University of Science and Technology of China, Hefei 230026, China
*
Authors to whom correspondence should be addressed.
These authors contributed equally to this work.
Submission received: 23 March 2020 / Revised: 13 April 2020 / Accepted: 17 April 2020 / Published: 20 April 2020

Abstract

:
Triacetone triperoxide (TATP) is a new terrorist explosive, and most nitrogen-based sensors fail to detect TATP. Herein, a sea urchin-like TiO2-covered TiO2 nanoarray is constructed as a TATP-sensitive homojunction (HJ) by one step hydrothermal method. By taking fluorine-doped tin oxide (FTO) and indium tin oxide (ITO) conducting glass as the substrate, the conducting glass is horizontally and vertically put in the reactor to epitaxially grow TiO2–FTO, TiO2–ITO, TiO2–FTO–HJ and TiO2–ITO–HJ. TiO2–FTO–HJ shows a broad absorption band edge in the visible region and high sensitivity to TATP under the simulating natural light compared with TiO2–FTO, TiO2–ITO, and TiO2–ITO–HJ. E-field intensity distribution simulation reveals that constructing homojunctions between the urchin-shaped TiO2 nanosphere and TiO2 nanoarrays can enhance the localized electromagnetic field intensity at the interface of junctions, which may provide photocatalysis active sites to reduce TATP molecules by promoting charge separation. Moreover, the TiO2–FTO–HJ shows high selectivity to TATP among ammonium nitrate, urea and sulfur, which are common homemade explosive raw materials.

1. Introduction

In recent years, the bombing terrorist attack has become the main manifestation of terrorism activities. Public places with dense populations, such as railway stations, airports, subway stations, and so on, are becoming the first target of terrorists, and so carrying out explosive detection in public places is an important anti-terrorist measure. How to rapidly and accurately detect explosives in luggage parcels in real time has become an important topic of today’s anti-terrorist activities in the international community [1,2,3,4,5].
Common explosives can be simply divided into standard explosives and non-standard explosives. Standard explosives mainly include 2,4,6-trinitrotoluene (TNT), 2,4-dinitrotoluene (DNT), p-nitrotoluene (PNT), picric acid (PA), etc. Non-standard explosives mainly include triacetone peroxide (TATP), Ammonium nitrate (AN), Urea, Sulfur, etc. There are various kinds of detection techniques for explosives at present [6,7,8,9,10,11,12,13]. Among these, dog sniffing method is one traditional detection method for tracing explosives, and its sensitivity is able to reach the parts per trillion (ppt) range. However, it has low efficiency. Police dogs generally need to rest for 15 to 30 min after continuously working for 30 min, and the training cost is high. In addition to the dog sniffing method, detection methods of explosives with more mature technology include the fluorescence detection method [14], electrochemical detection [15], ion spectroscopy [16], X-ray spectrometry, and so on [17]. However, these techniques also have disadvantages; for example, for ion spectroscopy and X-ray imaging technology, the equipment is heavy with high costs. Meanwhile, chromatographic analysis is limited to laboratory detection and cannot meet the requirements of field detection. In addition, most detection techniques cannot achieve the detection of non-standard explosives, and these disadvantages restrict the application in the actual detection of explosive. Moreover, several technologies have been discovered for the detection of trace amounts of TATP (Table S1).
Inspired by the dog sniffing method, a material used in gas-sensitive sensors for detecting explosives is produced by making use of the inherent properties of metal oxide semiconductors. In addition, gas-sensitive sensors are the most suitable for manufacturing portable explosive detection devices for explosives [17,18,19]. The detection of explosives is determined based on the electrical signal of the gas-sensitive sensor. One feasible way of improving the detection speed, sensitivity, accuracy and other attributes of the sensor is to magnify the contact area between the gas molecules and the sensor.
TiO2 has good gas sensitivity and TiO2 nanoarray can effectively enhance the contact area. Wang et al. [20] successfully prepared highly ordered aligned nitrogen-doped titania nanotube array films by liquid phase deposition (LPD) method, obtaining a new band gap corresponding to 2.17 eV in the visible region (570 Nm). Jie et al. [21] fabricated the silver ion-modified titanium nanotube array (AG/TiO2-NT) by electrochemical anodization as an electrochemical energy storage electrode for supercapacitors. Jain et al. [22] developed sensors using gold nanoparticles (GnPs) and tubular TiO2 for the detection of glycated hemoglobin in blood. The group of Hu [23] used anatase TiO2 arrays with different crystal faces in different solvents by low-temperature solvothermal synthesis, which is mainly used in the field of photocatalysis. Cheng et al. [24] organized Pd nanoparticles on the surface of a carbon-coated TiO2 nanowire array substrate using the potentiostatic pulse method, which is also used in the field of photocatalysis. Zhang et al. [25] developed TiO2 /ZnFe-LDH photoanode by photo-assisted electro deposition on TiO2 nanoarray for the cracking performance of PEC water.
Although TiO2 nanoarrays can be prepared by different methods, the above methods were not simple or effective in detecting gas sensing. In this work, the hydrothermal method is used to prepare a titanium dioxide nanoarray and to analyze the phase, morphology, ultraviolet absorption spectrum and gas-sensitive properties of the titanium dioxide nanoarray.

2. Materials and Methods

2.1. Materials

Acetone (99%, Sinopharm Ggroup Chemical Co. Ltd, Shanghai, China), ethanol (AR, Wokai, Shanghai, China), concentrated hydrochloric acid (AR, Wokai, Shanghai, China), titanium tetrachloride (99.5%, Oubokai, Shenzhen, China), ITO and FTO conductive glass (10 mm × 10 mm, Nozo, Luoyang, China) and deionized water were used.

2.2. Experimental

Preparation of TiO2-FTO: FTO glass was subjected to ultrasonic cleaning in acetone, ethyl alcohol and deionized water for 15 min and dried. The FTO glass was vertically fixed on the Teflon-lined stainless autoclave wall. 10 mL of concentrated hydrochloric acid and 1 mL of titanium tetrachloride was continually stirred for 10 min. Then the above resulting mixture is transferred into a Teflon-lined stainless autoclave and maintained at 180 °C for 4 h. The system was then naturally cooled to ambient temperature. After that, the precipitation was sequentially washed with ethanol and distilled water to obtain TiO2–FTO.
Preparation of TiO2–FTO–HJ: The preparation process was similar to the process for TiO2–FTO. The difference is that the FTO glass was horizontally fixed on the bottom of the Teflon-lined stainless autoclave.
The preparation process of TiO2–ITO and TiO2–FTO–HJ was similar to the process for TiO2–FTO and TiO2–FTO–HJ. The difference was that the FTO glass was replaced by ITO glass.

2.3. Characterization

The scanning electron microscope used in the experiment was JEOL’s JSM-6106LV (Tokyo, Japan). The Bruker Corporation’s X-ray diffractometer D8 Advance (Billerica, MA, USA) was used to analyze the sample, and Kα radial of the Cu target material was used (Wavelength λ = 1.5418 Å. voltage V = 40 kV and electricity I = 40 mA). Thermo Electron’s Fourier transform infrared spectrum analyzer Nicolet 6700 (Waltham, MA, USA) was used to measure the infrared absorption spectrum. The measurement range was 4000–400 wavenumber (cm−1). The UV-Vis absorption spectrum was determined using UV-4802S of Unico Instrument Co., Ltd. (Dayton, OH, USA), with a testing range of 300–800 nm. The Raman spectrum was recorded on Renishaw’s microscopic confocal Raman spectrometer RM2000 (Gloucestershire, UK) with a laser wavelength of 514 nm.
The different analytes were evaporated in a 50 mL transparent chamber and the test was conducted at room-temperature in saturated ammonium nitrate (AN), urea and sulfur (S) vapor. Since the TATP has very high vapor pressure at room temperature, it is diluted by air to 600 ppb. The time-dependent photoresponse of the sensor film was determined in a conventional two electrode configuration and recorded by Keithley 4200A-SCS Parameter Analyzer (Portland, ME, USA) under the simulating natural light.

3. Results and Discussion

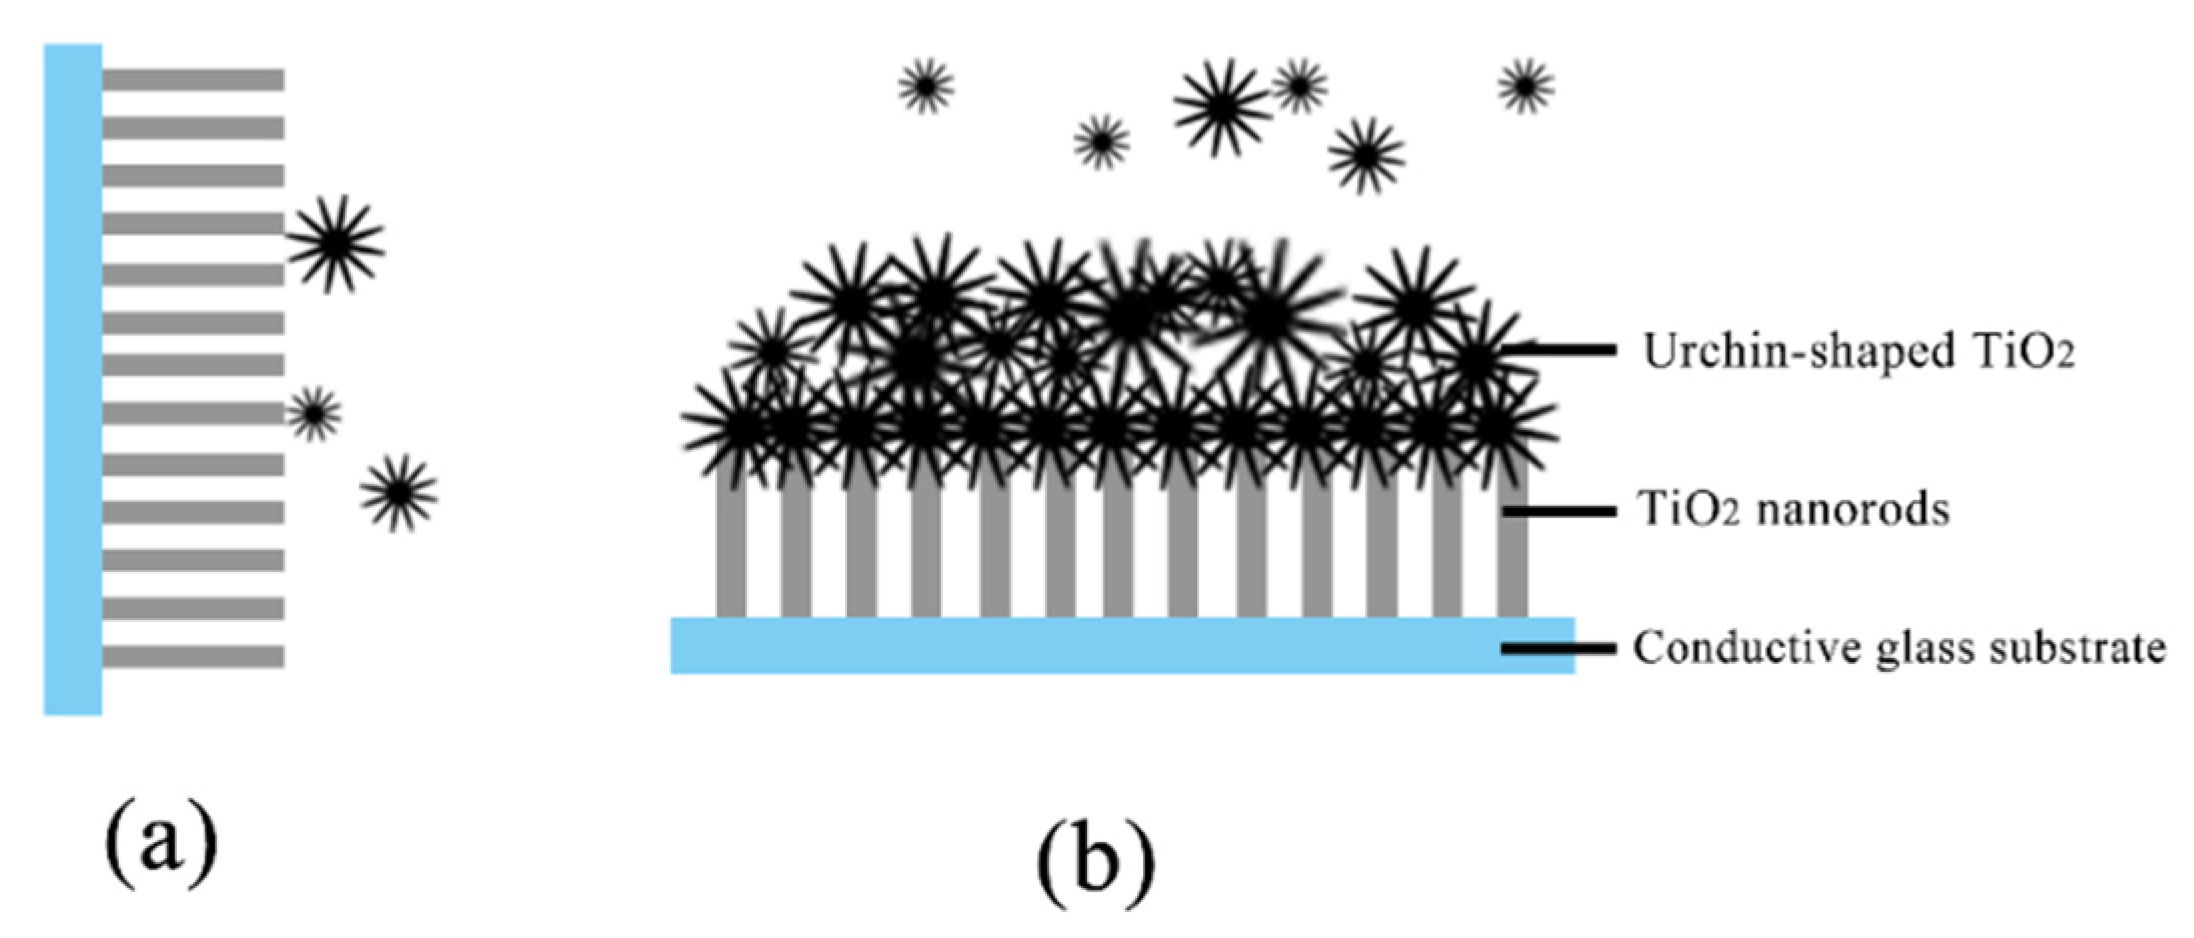
3.1. Morphology and Structural Characterization of TiO2 Nanoarray

3.1.1. Morphology of TiO2 Nanoarray

The FTO and ITO conducting glass is horizontally or vertically put into the reaction still in order to construct a TiO2 nanoarray by a simple hydrothermal method. Figure 1 is the SEM images of TiO2 nanoarray that puts FTO conducting glass into the reaction vessel vertically at 180 °C for 4 h. Figure 1a,c shows the front view and cross-section diagram of the nanoarray, while Figure 1b,d shows enlarged views of Figure 1a,c respectively. As can be seen from Figure 1a,b, the TiO2 nanoarray is rod-shaped with uniform growth, and the length of the nanoarray is basically consistent. Combined with Figure 1c,d, the uniformity of the nanoarray can be clearly seen. The two sides of the nanoarray are basically parallel, and the thickness of the nanoarray is about 10.8 µm. The TiO2 nanoarray grown on FTO conducting glass is recorded as TiO2–FTO.
Figure 2 is the SEM images of the TiO2 nanoarray that places the ITO conducting glass into the reaction vessel vertically at 180 °C for 4 h. Figure 2a,c shows the front view and cross-section diagram of the nanoarray, while Figure 2b,d shows enlarged views of Figure 2a,c, respectively. Compared to FTO (Figure 1a), the nanoarrays grown on the ITO as shown in Figure 2a are more loose. It can be seen from Figure 2b that there are obvious radial nanorods from the center of the urchin-shaped cluster, and the rod diameter and rod length are uniform. From Figure 2c,d, it can be seen more clearly from the cross-section that the thickness of the radial nanoarray is about 8.1 µm. The TiO2 nanoarray grown on ITO conducting glass is recorded as TiO2–ITO.
Figure 3 shows the microtopography of TiO2 nanoarray that places the FTO conducting glass into the reaction vessel vertically at 180 °C for 4 h. Figure 3a,b shows the front view of TiO2 nanoarray grown on conducting glass substrate. As can be seen in Figure 3a,b, there are stacked sea urchin-shaped TiO2 nanoarrays on the surface, with different sizes and dense arrangement. The length and diameter of the nanorods are basically equal in the same urchin-shaped TiO2 nanoarray. The inset in Figure 1a is the cross-section diagram and enlarged view of TiO2 nanoarray generated on the FTO conducting glass. It can be clearly seen that the TiO2 grown on the horizontally placed conducting glass is composed of TiO2 nanorod arrays and urchin-shaped TiO2 nanoarrays that are in contact with the bottom surface. The two kinds of nanoarrays with different morphologies are combined to form the homojunction of the TiO2 nanoarray (recorded as TiO2 –HJ, HJ: Homojunction), and the thickness of the homojunction of the TiO2 nanoarray is between 150 and 200 mm. Figure 3c,d shows the reverse side of the TiO2 grown on the FTO conducting glass and their enlarged views. The reverse side indicates the contact surface between TiO2 nanoarray and conducting glass. As can be seen in Figure 3c,d, the nanorods are arranged in order with the diameter of 600 nm and the vertical extent of the TiO2 nanorod array is obviously improved when the FTO conducting glass is placed vertically.
Figure 4 shows the microtopography of TiO2 nanoarray that places ITO conducting glass into the reaction vessel vertically at 180 °C for 4 h. Figure 4a,b shows the front view of the homojunction of the TiO2 nanoarray grown on the ITO conducting glass substrate. There are stacked urchin-shaped TiO2 nanoarrays on the surface, with different sizes and dense arrangement. The morphology of the growth of the ITO conductive glass is similar to that of the nanoarray formed when the FTO conductive glass is the substrate, and the nanorods are arranged radially. The urchin-shaped TiO2 nanoarrays are substantially equal. The inset in Figure 4a is the cross-section diagram and enlarged view of TiO2 generated on ITO conducting glass. It can be clearly seen that the urchin-like nanospheres are supported by TiO2 nanoarrays. The thickness of the homojunction of the TiO2 nanoarray is between 150 and 200 mm. Figure 4c,d shows the reverse side of TiO2 grown on ITO conducting glass. It can also be seen from the back view that the compactness of the TiO2 nanorod array, which is generated by taking the ITO, is lower than that of the TiO2 nanorod array that takes the FTO conducting glass as the substrate.
The morphology of nanorods grown on various conducting glasses are different, which may be due to the different crystal structures of the conducting glasses. The ITO glass is composed of 10 wt.% SnO2 doped In2O3. SnO2 have rutile structure, while In2O3 has cubic ferromanganese crystal structure. TiO2 epitaxial grow on the ITO surfaces to obtain loose nanoarray with rutile structure due to the low content of SnO2. By comparison, the FTO glass is only composed of rutile SnO2. TiO2 epitaxial grow on the external surfaces of the SnO2 to obtain more orderly and denser rutile nanorod arrays.
Moreover, it can be found that under the same hydrothermal conditions, the homojunction is formed when the conducting glass is placed horizontally in the reaction vessel, while only nanoarray is formed when the conducting glass is placed vertically. Under certain temperature conditions, the TiO2 generated by hydrolysis nucleates on the conducting glass and continues to grow into nanorods after nucleation. When the nanorods grow to a certain length, the hydrolysis reaction continues to produce a large amount of TiO2. TiO2 grows into urchin-shaped-like TiO2 nanoballs in solution. A large amount of TiO2 exceed the growth rate of TiO2 nanorods along the vertical direction on the conducting glass and falls directly on the TiO2 nanorods that have been already generated, which forms the titanium dioxide nanoarray homojunction. The schematic diagram of the formation mechanism is shown in Figure 5a shows the schematic diagram of the formation of TiO2 nanoarray when the conducting glass is placed vertically. Figure 5b indicates the schematic diagram of the homojunction of TiO2 nanoarray when conducting glass is placed horizontally.
Figure 6 shows the Raman spectrum of TiO2 nanoarray, which shows well-resolved peaks of TiO2–FTO–HJ located at 240.35 cm−1, 443.13 cm−1, and 610.42 cm−1, and the well-resolved peaks of TiO2–ITO–HJ located at 235.29 cm−1, 444.82 cm−1 and 610.42 cm−1. From these results, it can also be concluded that the crystal structures of the two homojunctions are rutile [26].

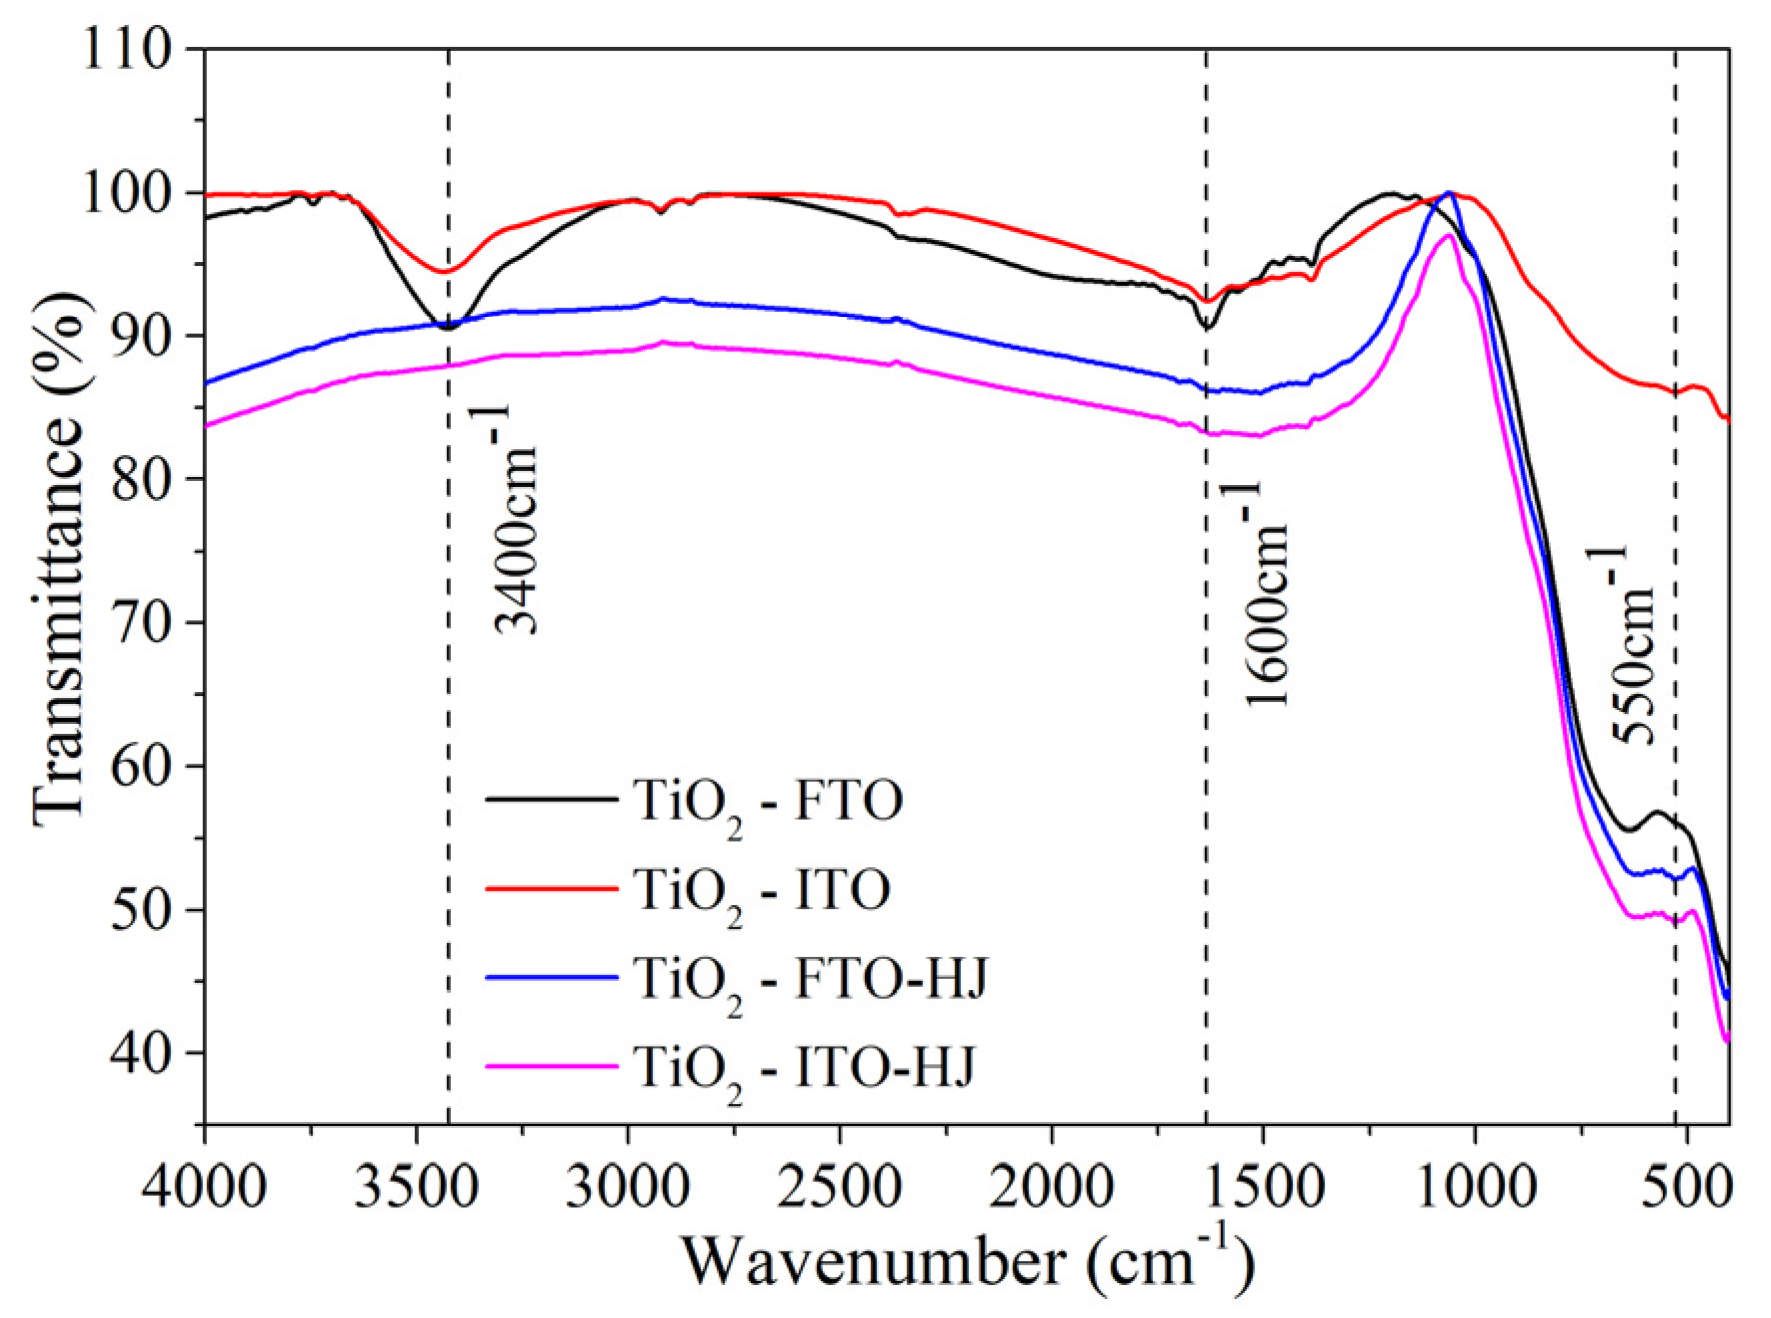
3.1.2. The Structure of the TiO2 Nanoarray

X-ray diffraction (XRD) characterization is presented in Figure 7. It can be seen that the TiO2 with four morphologies have crystal faces of (110), (101), (002), (301) and (112), which indicates that the crystal structures of TiO2–FTO, TiO2–ITO, TiO2–FTO–HJ and TiO2–ITO–HJ are tetragonal rutile phase [27]. The (101) diffraction peak of TiO2 grown on FTO conducting glass substrate is the strongest and sharpest, which suggests that the structure order degree of TiO2–FTO was improved by FTO [26,27].
It can be seen from the FT–IR spectrum of TiO2 nanoarrays in Figure 8 that a weak absorption appears at the wavenumber of 3400 cm−1 the TiO2 grown on the FTO and ITO conducting glass substrates. The weak absorption of 3400 and 1600 cm−1 is the characteristic absorption of hydroxy (–OH), which may be due to the incomplete hydrolysis of titanium tetrachloride (TiCl4) to generate TiO2 and residual –OH. The characteristic bands at 550 cm−1 are attributed to vibrations of Ti–O in TiO2 nanocrystal.
Figure 9a is the ultraviolet-visible absorption spectrograms of four nanoarrays and their band gap diagrams. The homojunction of the TiO2 nanoarrays generated by the horizontally placed FTO and ITO conducting glasses are basically the same; we can see that TiO2–FTO, TiO2–ITO and ITO–HJ absorption wavelength in the ultraviolet region from 400 nm, while TiO2–FTO–HJ has an absorption band edge at the about 750 nm. It can be seen from Figure 9b that the band gap of TiO2–FTO is 3.02 eV, and the band gap of TiO2–ITO, FTO–HJ, ITO–HJ is 3.04 eV, respectively, suggesting that these TiO2 nanostructures may be promising for sensing [28].
The gas sensing performance diagram of TiO2–FTO–HJ, TiO2–ITO–HJ, TiO2–FTO and TiO2–ITO to TATP vapors was evaluated under simulated natural light [29]. One can see from Figure 10a that the response of TiO2–FTO–HJ to TATP vapors is nearly three times as strong as the response of TiO2 –ITO–HJ to TATP. TiO2–FTO and TiO2-ITO also respond to TATP vapors, but the response is weak compared with that of homojunction structure. As shown in Figure 10b, the responses of TiO2–FTO–HJ, TiO2 –ITO–HJ, TiO2–FTO and TiO2–ITO to TATP vapors were about 67%, 23%, 11% and 7%, respectively. Moreover, TiO2–FTO–HJ showed a quick response time to TATP of 7.2 s and a recovery time of 4.9 s (Figure 10b). This can be attributed to the homojunctions formation between the urchin-shaped TiO2 and TiO2 nanoarrays, which may be beneficial in promoting the efficient separation of photogenerated charges.
As a demonstration, E-field intensity distributions of TiO2 homojunction and TiO2 nanoarrays were simulated by finite element method. Figure 11a shows the electric field distributions of TiO2 homojunction. The hot spot area can be found between the interface of urchin-shaped TiO2 nanosphere and TiO2 nanoarrays. Compared with the simulation results of the urchin-free nanosphere shown in Figure 11b, the strength of the electromagnetic fields of the TiO2 homojunction at the hot spot area increase at least six orders of magnitude with respect to the TiO2 nanoarrays. This demonstrates that the interface of the urchin-shaped TiO2 nanosphere and TiO2 nanoarrays can enhance the localized electromagnetic fields intensity to a certain extent under the simulated natural light. Thus, the photoelectrons accumulate at the interface of the homojunction to provide photocatalysis active site to reduce TATP to acetone and hydrogen peroxide (Figure 11c).
Ammonium nitrate (AN), urea and sulfur (S) are also employed as improvised explosives or explosive raw materials. The sensing properties of the TiO2–FTO–HJ toward different saturated AN, urea and S vapors are depicted in Figure 12. The response of TiO2–FTO–HJ to AN, urea and S vapor is about 22%, 26% and 9%, respectively, which is lower than the response to TATP. The response time of TiO2–FTO–HJ to AN, urea and S vapors is about 11 s, 24 s and 12 s, while the recovery time is 12 s, 4 s and 3 s, respectively. Among these improvised explosives, AN, urea and S are relatively stable. However, the electron transfer process is thermodynamically and kinetically favorable for TATP reductive decomposition. Thus, TiO2–FTO–HJ shows selectivity to TATP, and this result reveals that TiO2–FTO–HJ is a potential candidate for TATP sensors.

4. Conclusions

The TiO2 nanoarrays and sea urchin-like TiO2-covered TiO2 nanoarray epitaxial were grown on FTO and ITO conductive glass using a simple one step hydrothermal method. For the TiO2 nanoarrays grown on the FTO and ITO conducting glasses, when they were placed horizontally, the part that was in contact with the conducting glass was more orderly and uniform than when vertically placed. In addition, for the nanoarrays that used FTO conducting glass as the substrate, the nanoarrays were more orderly and uniform than those using ITO conducting glass as the substrate. The crystal structure of the homojunction of TiO2 nanoarrays grown on conducting glass placed horizontally was rutile. Among the four kinds of TiO2 nanostructure, TiO2–FTO–HJ showed excellent response to TATP vapors, reaching 67%, compared with the performances of TiO2–ITO–HJ (23%), TiO2–FTO (11%), and TiO2–ITO (7%) with respect to TATP. The response speed and recovery speed of TiO2–FTO–HJ to TATP were relatively fast, with a response time of 7.2 s and a recovery time of 4.6 s. The TiO2–FTO–HJ also showed high selectivity to TATP among ammonium nitrate, urea and sulfur, which are common homemade explosives raw materials.

Supplementary Materials

The following are available online at https://0-www-mdpi-com.brum.beds.ac.uk/2079-6412/10/4/409/s1, Table S1: The available techniques for detection of TATP.

Author Contributions

Conceptualization, B.L. and L.G.; methodology, Y.T. and Y.Z. (Yuxiang Zhang); validation, Y.Z. (Youxiong Zheng) and J.Y.; formal analysis, Y.Z. (Yuxiang Zhang); investigation, Y.T., Y.Z. (Yuxiang Zhang) and G.X.; resources, B.L.; data curation, Y.T. and Y.Z. (Youxiong Zheng); writing—original draft preparation, Y.T. and Y.Z. (Yuxiang Zhang); writing—review and editing, B.L. and L.G.; visualization, Y.Z. (Youxiong Zheng); supervision, B.L. and L.G.; project administration, B.L.; funding acquisition, B.L. and L.G. All authors have read and agreed to the published version of the manuscript.

Funding

This research was funded by the National Natural Science Foundation of China 21804078, Natural Science Foundation of Qinghai Province 2020-ZJ-764 and Thousand Talents Program of Qinghai Province.

Conflicts of Interest

The authors declare no conflicts of interest.

References

  1. Hernández-Adame, P.L.; Medina-Castro, D.; Rodriguez-Ibarra, J.L.; Salas-Luevano, M.A.; Vega-Carrillo, H.R. Design of an explosive detection system using Monte Carlo method. Appl. Radiat. Isot. 2016, 117, 27–31. [Google Scholar] [CrossRef] [PubMed]
  2. Sun, X.; Wang, Y.; Lei, Y. Fluorescence Substrated Explosive Detection from Mechanisms to Sensory Materials. Chem. Soc. Rev. 2015, 44, 8019–8061. [Google Scholar] [CrossRef] [PubMed] [Green Version]
  3. Lichtenstein, E.; Havivi, R. Shacham, Supersensitive Fingerprinting of Explosives by Chemically Modified Nano sensors Arrays. Nat. Commun. 2014, 5, 41–95. [Google Scholar] [CrossRef] [PubMed] [Green Version]
  4. Pinnaduwage, L.; Gehl, A.; Hedden, D. Explosives a Microsensor for Trinitrotoluene Vapour. Nature 2003, 425, 474. [Google Scholar] [CrossRef] [PubMed]
  5. Wang, F.; Gu, H.; Swager, T. Carbon Nanotube/Polythiophene Chemiresistive Sensors for Chemical Warfare Agents. J. Am. Chem. Soc. 2008, 130, 5392–5393. [Google Scholar] [CrossRef] [PubMed]
  6. Mao, S.; Zhou, H.; Wu, S. High performance hydrogen sensor substrated on Pd/TiO2 composite film. Int. J. Hydrogen Energy 2018, 43, 22727–22732. [Google Scholar] [CrossRef]
  7. Ho, W.-J.; Hsiao, K.-Y.; Hu, C.-H. Characterized plasmonic effects of various metallic nanoparticles on silicon solar cells using the same anodic aluminum oxide mask for film deposition. Thin Solid Films 2017, 631, 64–71. [Google Scholar] [CrossRef]
  8. Chen, C.C.; Chen, S.H.; Shyu, S.W. Use of Nanostructures in Fabrication of Large Scale Electrochemical Film. Phys. Procedia 2012, 25, 44–49. [Google Scholar] [CrossRef] [Green Version]
  9. Lee, J.; Kim, D.H.; Hong, S.-H. A hydrogen gas sensor employing vertically aligned TiO2 nanotube arrays prepared by template-assisted method. Sens. Actuators B Chem. 2011, 160, 1494–1498. [Google Scholar] [CrossRef]
  10. López-Ayala, S.; Rincón, M.E.; Pfeiffer, H. Influence of copper on the microstructure of sol–gel titanium oxide nanotubes array. J. Mater. Sci. 2009, 44, 4162–4168. [Google Scholar]
  11. Huang, J.-W.; Lu, K.C.-C.; Huang, Y.-S. Novel fabrication process using nanoporous anodic aluminum oxidation and MEMS technologies for gas detection. Procedia Chem. 2009, 1, 56–59. [Google Scholar] [CrossRef] [Green Version]
  12. Ge, Y.; Zhong, W.; Li, Y. Highly sensitive and rapid chemiresistive sensor towards trace nitro-explosive vapors based on oxygen vacancy-rich and defective crystallized In-doped ZnO. Sens. Actuators B Chem. 2017, 244, 983–991. [Google Scholar] [CrossRef]
  13. Zeng, X.S.; Zeng, X.S.; Xu, H.; Xu, Y. A series of porous interpenetrating metal-organic frameworks based on fluorescent ligand for nitroaromatic explosives detection. Inorg. Chem. Front. 2018, 10, 10–39. [Google Scholar] [CrossRef]
  14. O’Mahony, A.M.; Wang, J. Nanomaterial-based electrochemical detection of explosives: A review of recent developments. Anal. Methods 2013, 5, 4296. [Google Scholar] [CrossRef]
  15. Kielmann, M.; Prior, C.; Senge, M.O. Porphyrins in troubled times: A spotlight on porphyrins and their metal complexes for explosives testing and CBRN defense. New J. Chem. 2018, 42, 7529–7550. [Google Scholar] [CrossRef]
  16. Meng, X.C. Detection Technology of Explosives and Drugs. Nucl. Electron. Detect. Technol. 2013, 4, 371–379. [Google Scholar]
  17. Liang, J.H.; Liu, P.P.; Chen, Z.; Sun, G.X.; Li, H. Rapid evaluation of arsenic contamination in paddy soils using field portable X-ray fluorescence spectrometry. J. Environ. Sci. 2018, 64, 345–351. [Google Scholar] [CrossRef]
  18. Patil, V.L.; Vanalakar, S.A.; Patil, P.S. Fabrication of nanostructured ZnO thin films substrated NO2 gas sensor via SILAR technique. Sens. Actuators B Chem. 2017, 239, 1185–1193. [Google Scholar] [CrossRef]
  19. Drobek, M.; Kim, J.H.; Bechelany, M. MOF-Substrated Membrane Encapsulated ZnO Nanowires for Enhanced Gas Sensor Selectivity. ACS Appl. Mater. Interfaces 2016, 8, 8323–8328. [Google Scholar] [CrossRef]
  20. Wang, J.; Wang, Z.; Li, H.; Cui, Y.; Du, Y. Visible light-driven nitrogen doped TiO2 nanoarray films: Preparation and photocatalytic activity. Alloys Compd. 2010, 494, 372–377. [Google Scholar] [CrossRef]
  21. Jie, C.; Lin, C.; Dahai, Z. Surface Characteristic Effect of Ag/TiO2 Nanoarray Composite Structure on Supercapacitor Electrode Properties. Scanning 2018, 2018, 1–10. [Google Scholar]
  22. Jain, U.; Singh, A.; Kuchhal, K. Glycated hemoglobin biosensing integration formed on Au nanoparticle-dotted tubular TiO2 nanoarray. Anal. Chim. Acta 2016, 945, 67–74. [Google Scholar] [CrossRef] [PubMed]
  23. Hu, W.; Dong, F.; Zhang, J. Differently ordered TiO2 nanoarrays regulated by solvent polarity, and their photocatalytic performances. Appl. Surf. Sci. 2018, 442, 298–307. [Google Scholar] [CrossRef]
  24. Cheng, K.; Cao, D.; Fan, Y. Electrodeposition of Pd nanoparticles on C@TiO2 nanoarrays: 3D electrode for the direct oxidation of NaBH4. J. Mater. Chem. 2011, 22, 850–855. [Google Scholar] [CrossRef]
  25. Zhang, R.; Shao, M.; Xu, S. Photo-assisted synthesis of zinc-iron layered double hydroxides/TiO2, nanoarrays toward highly-efficient photoelectrochemical water splitting. Nano Energy 2017, 33, 21–28. [Google Scholar] [CrossRef]
  26. Shinde, D.V.; Mane, R.S.; Oh, I.H. SnO2 nanowall-arrays coated with rutile-TiO2 nanoneedles for high performance dye-sensitized solar cells. Dalton Trans. 2012, 41, 10161. [Google Scholar] [CrossRef]
  27. Wang, H.; Bai, Y.; Wu, Q. Rutile TiO2 nano-branched arrays on FTO for dye-sensitized solar cells. Phys. Chem. Chem. Phys. 2011, 13, 7008. [Google Scholar] [CrossRef]
  28. Yang, Y.; Yin, L.C.; Gong, Y. An Unusual Strong Visible-Light Absorption Band in Red Anatase TiO2 Photocatalyst Induced by Atomic Hydrogen-Occupied Oxygen Vacancies. Adv. Mater. 2018, 30, 1704479. [Google Scholar] [CrossRef]
  29. Lü, X.; Hao, P.; Xie, G. A Sensor Array Realized by a Single Flexible TiO2/POMs Film to Contactless Detection of Triacetone Triperoxide. Sensors 2019, 19, 915. [Google Scholar] [CrossRef] [Green Version]
Figure 1. SEM images of TiO2 nanoarrays grown on vertically placed FTO substrate: (a) Front view of TiO2 nanoarray; (b) A magnified view; (c) TiO2 nanoarray cross-section; (d) C magnified view.
Coatings 10 00409 g001
Figure 2. SEM images of TiO2 nanoarrays grown on vertically placed ITO substrate: (a) Front view of TiO2 nanoarray; (b) A magnified view; (c) TiO2 nanoarray cross-section; (d) C magnified view.
Coatings 10 00409 g002
Figure 3. SEM images of TiO2 nanoarrays grown on horizontally placed FTO substrate: (a) Front view of TiO2 nanoarray; (b) A cross-sectional view and an enlarged view of the TiO2 nanoarray; (c) TiO2 nanoarray bottom view; (d) C magnified view.
Coatings 10 00409 g003
Figure 4. SEM images of TiO2 nanoarrays grown on horizontally placed ITO substrate: (a) Front view of TiO2 nanoarray; (b) A cross-sectional view and an enlarged view of the TiO2 nanoarray; (c) TiO2 nanoarray bottom view; (d) C magnified view.
Coatings 10 00409 g004
Figure 5. Generation mechanism diagrams of TiO2 nanoarrays and its homojunction: (a) Placing the conductive glass vertically; (b) Placing the conductive glass horizontally.
Coatings 10 00409 g005
Figure 6. The Raman spectrum of TiO2 nanoarrays.
Coatings 10 00409 g006
Figure 7. The XRD spectrum of TiO2 nanoarrays.
Coatings 10 00409 g007
Figure 8. The FTIR spectrum of TiO2 nanoarrays.
Coatings 10 00409 g008
Figure 9. UV-Vis absorption spectrum and band gap calculation diagram of TiO2 nanoarrays: (a) Ultraviolet-visible absorption spectrum; (b) Band gap calculation chart.
Coatings 10 00409 g009
Figure 10. Gas sensing performance diagram of explosives of TiO2 nanoarrays (a) and the corresponding statistical chart of response, response time and recovery time (b).
Coatings 10 00409 g010
Figure 11. E-field intensity distributions of TiO2 nanoarray on FTO glass: (a) Front view of a TiO2 nanoarray applying a uniform E-field; (b) Front view of a dandelion-free TiO2 nanosphere array applying a uniform E-field and (c) a possible sensing mechanism of TiO2–FTO–HJ to TATP.
Coatings 10 00409 g011
Figure 12. Time-dependent response of the TiO2–FTO–HJ in room-temperature to saturated AN (a), urea (b) and S (c) vapor and corresponding response time and recovery time (d).
Coatings 10 00409 g012

