Influence of Electrolyte Temperature on the Color Values of Black Plasma Electrolytic Oxidation Coatings on AZ31B Mg Alloy

Abstract
:1. Introduction
2. Materials and Methods
Coatings Characterization
3. Results
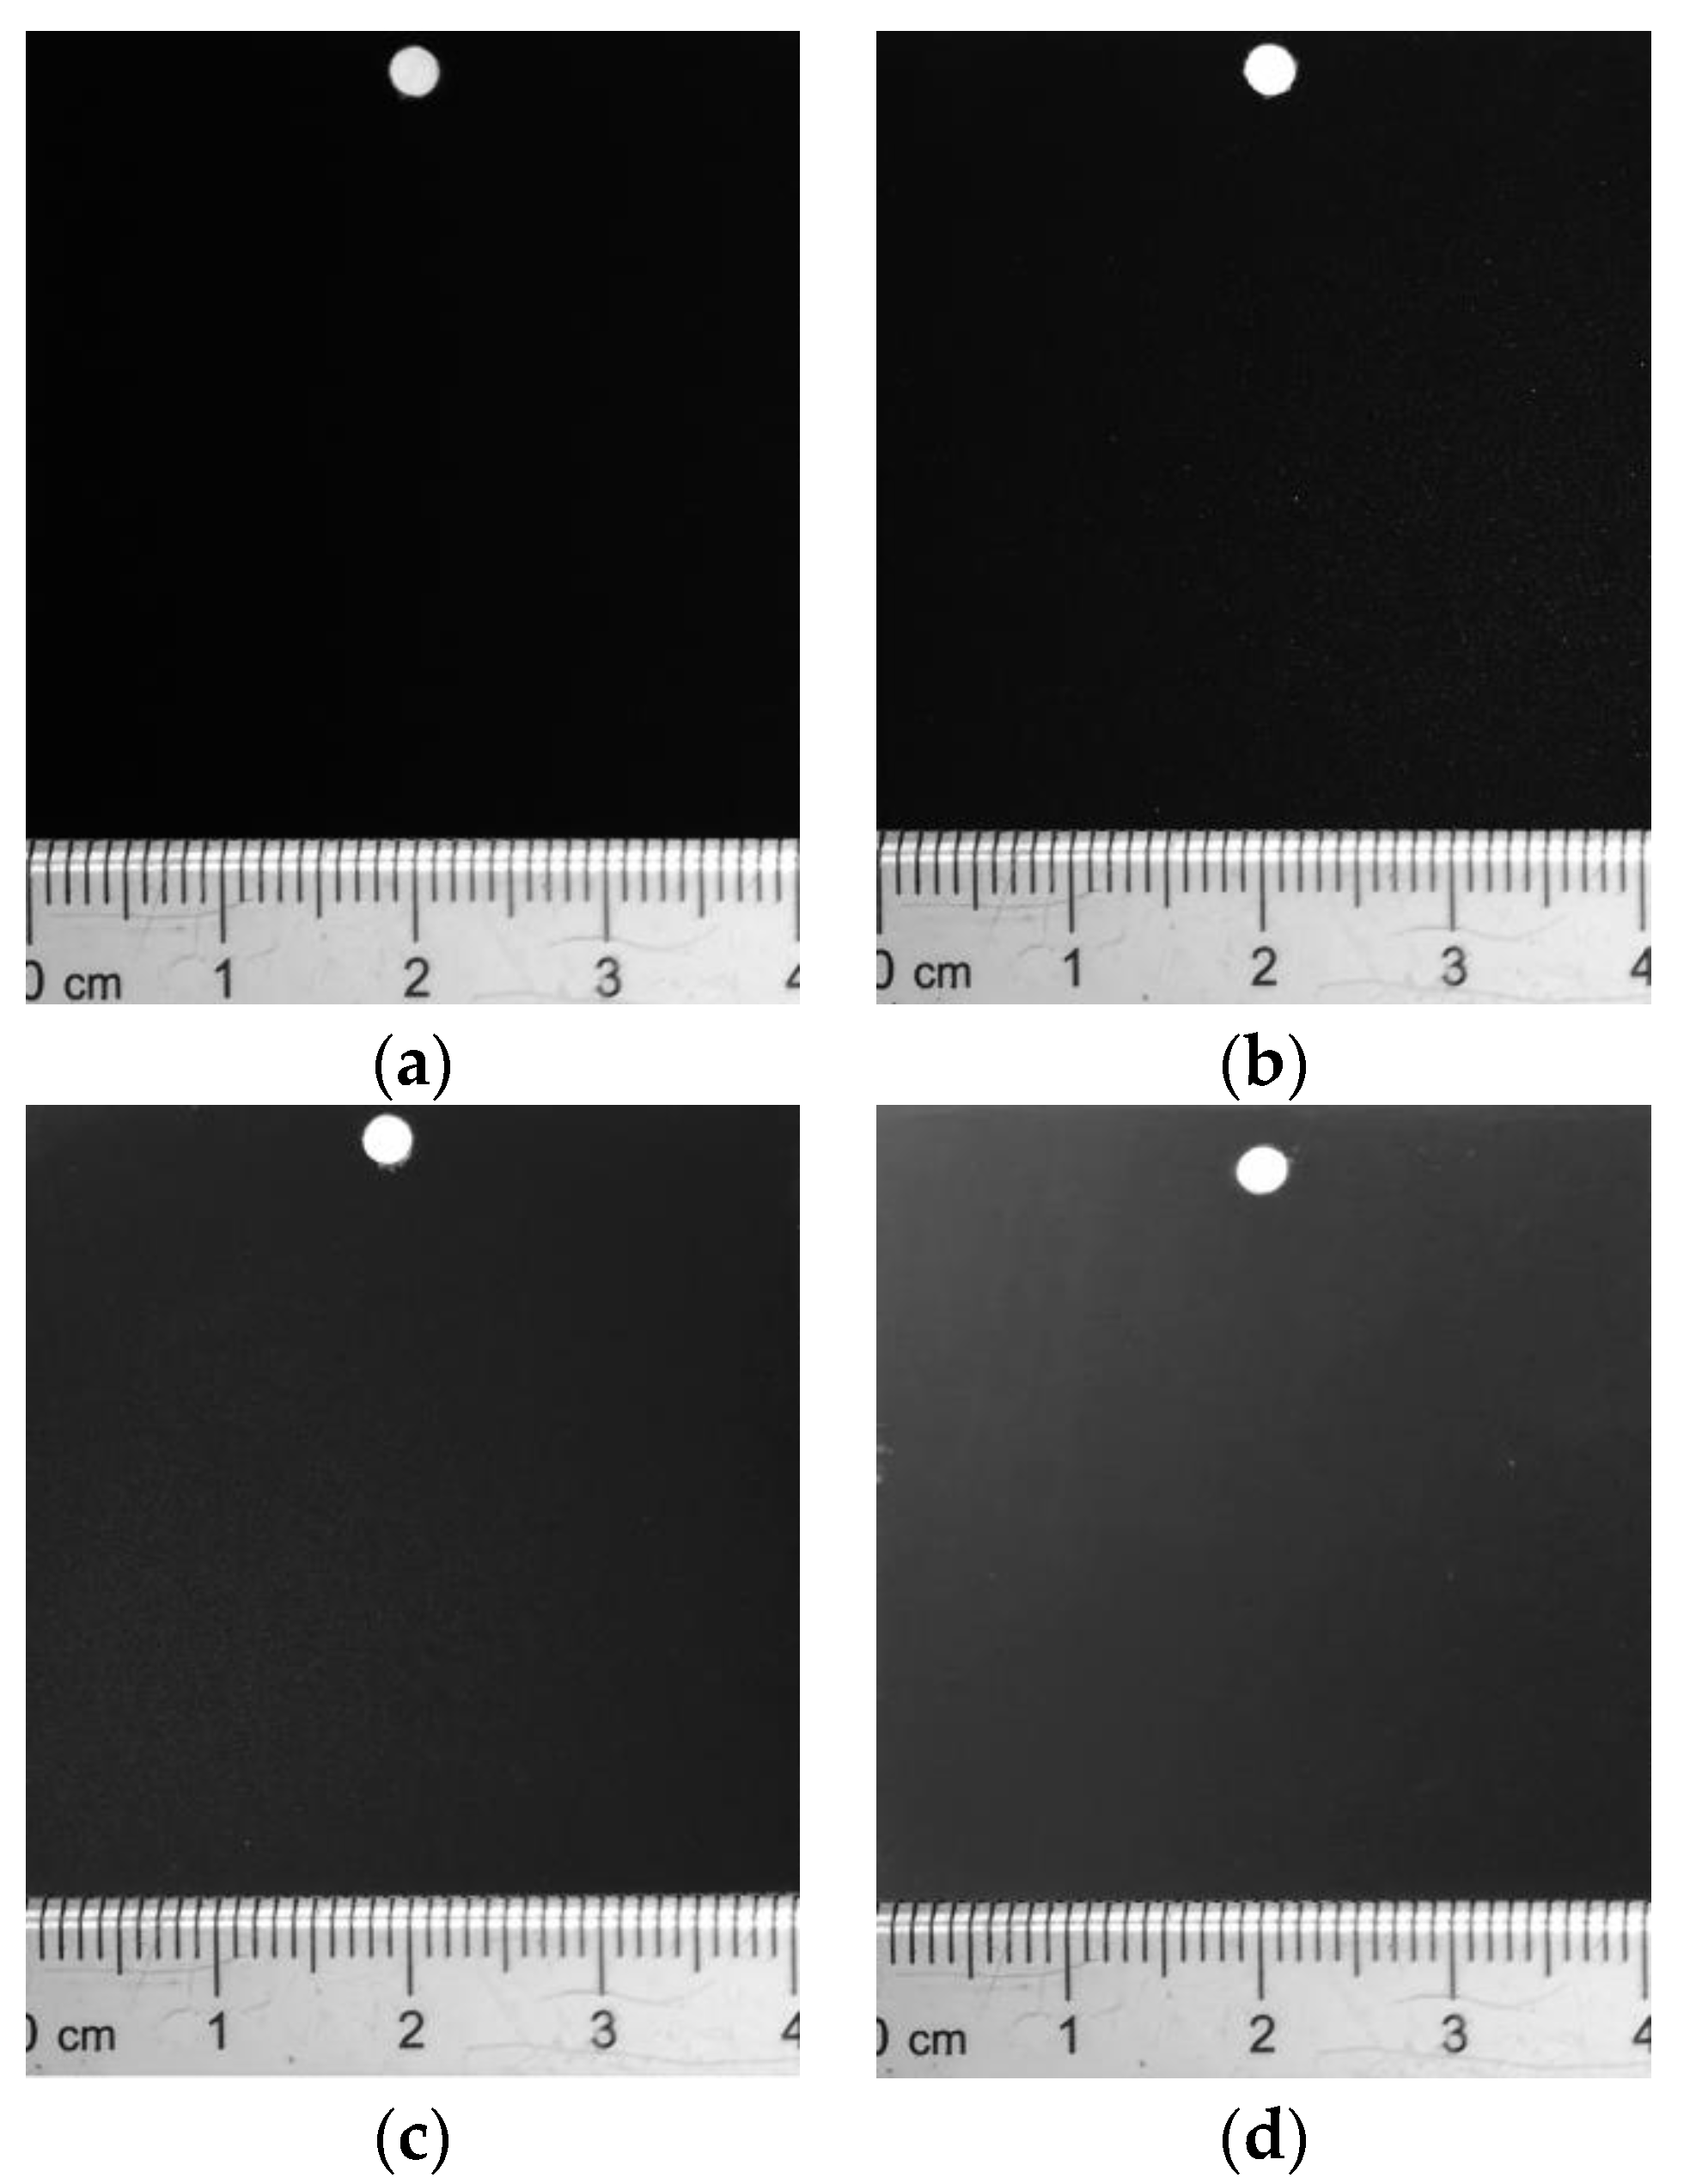
3.1. Color Values and PEO Coating Thickness
3.2. XRD Analysis
3.3. Raman Analysis
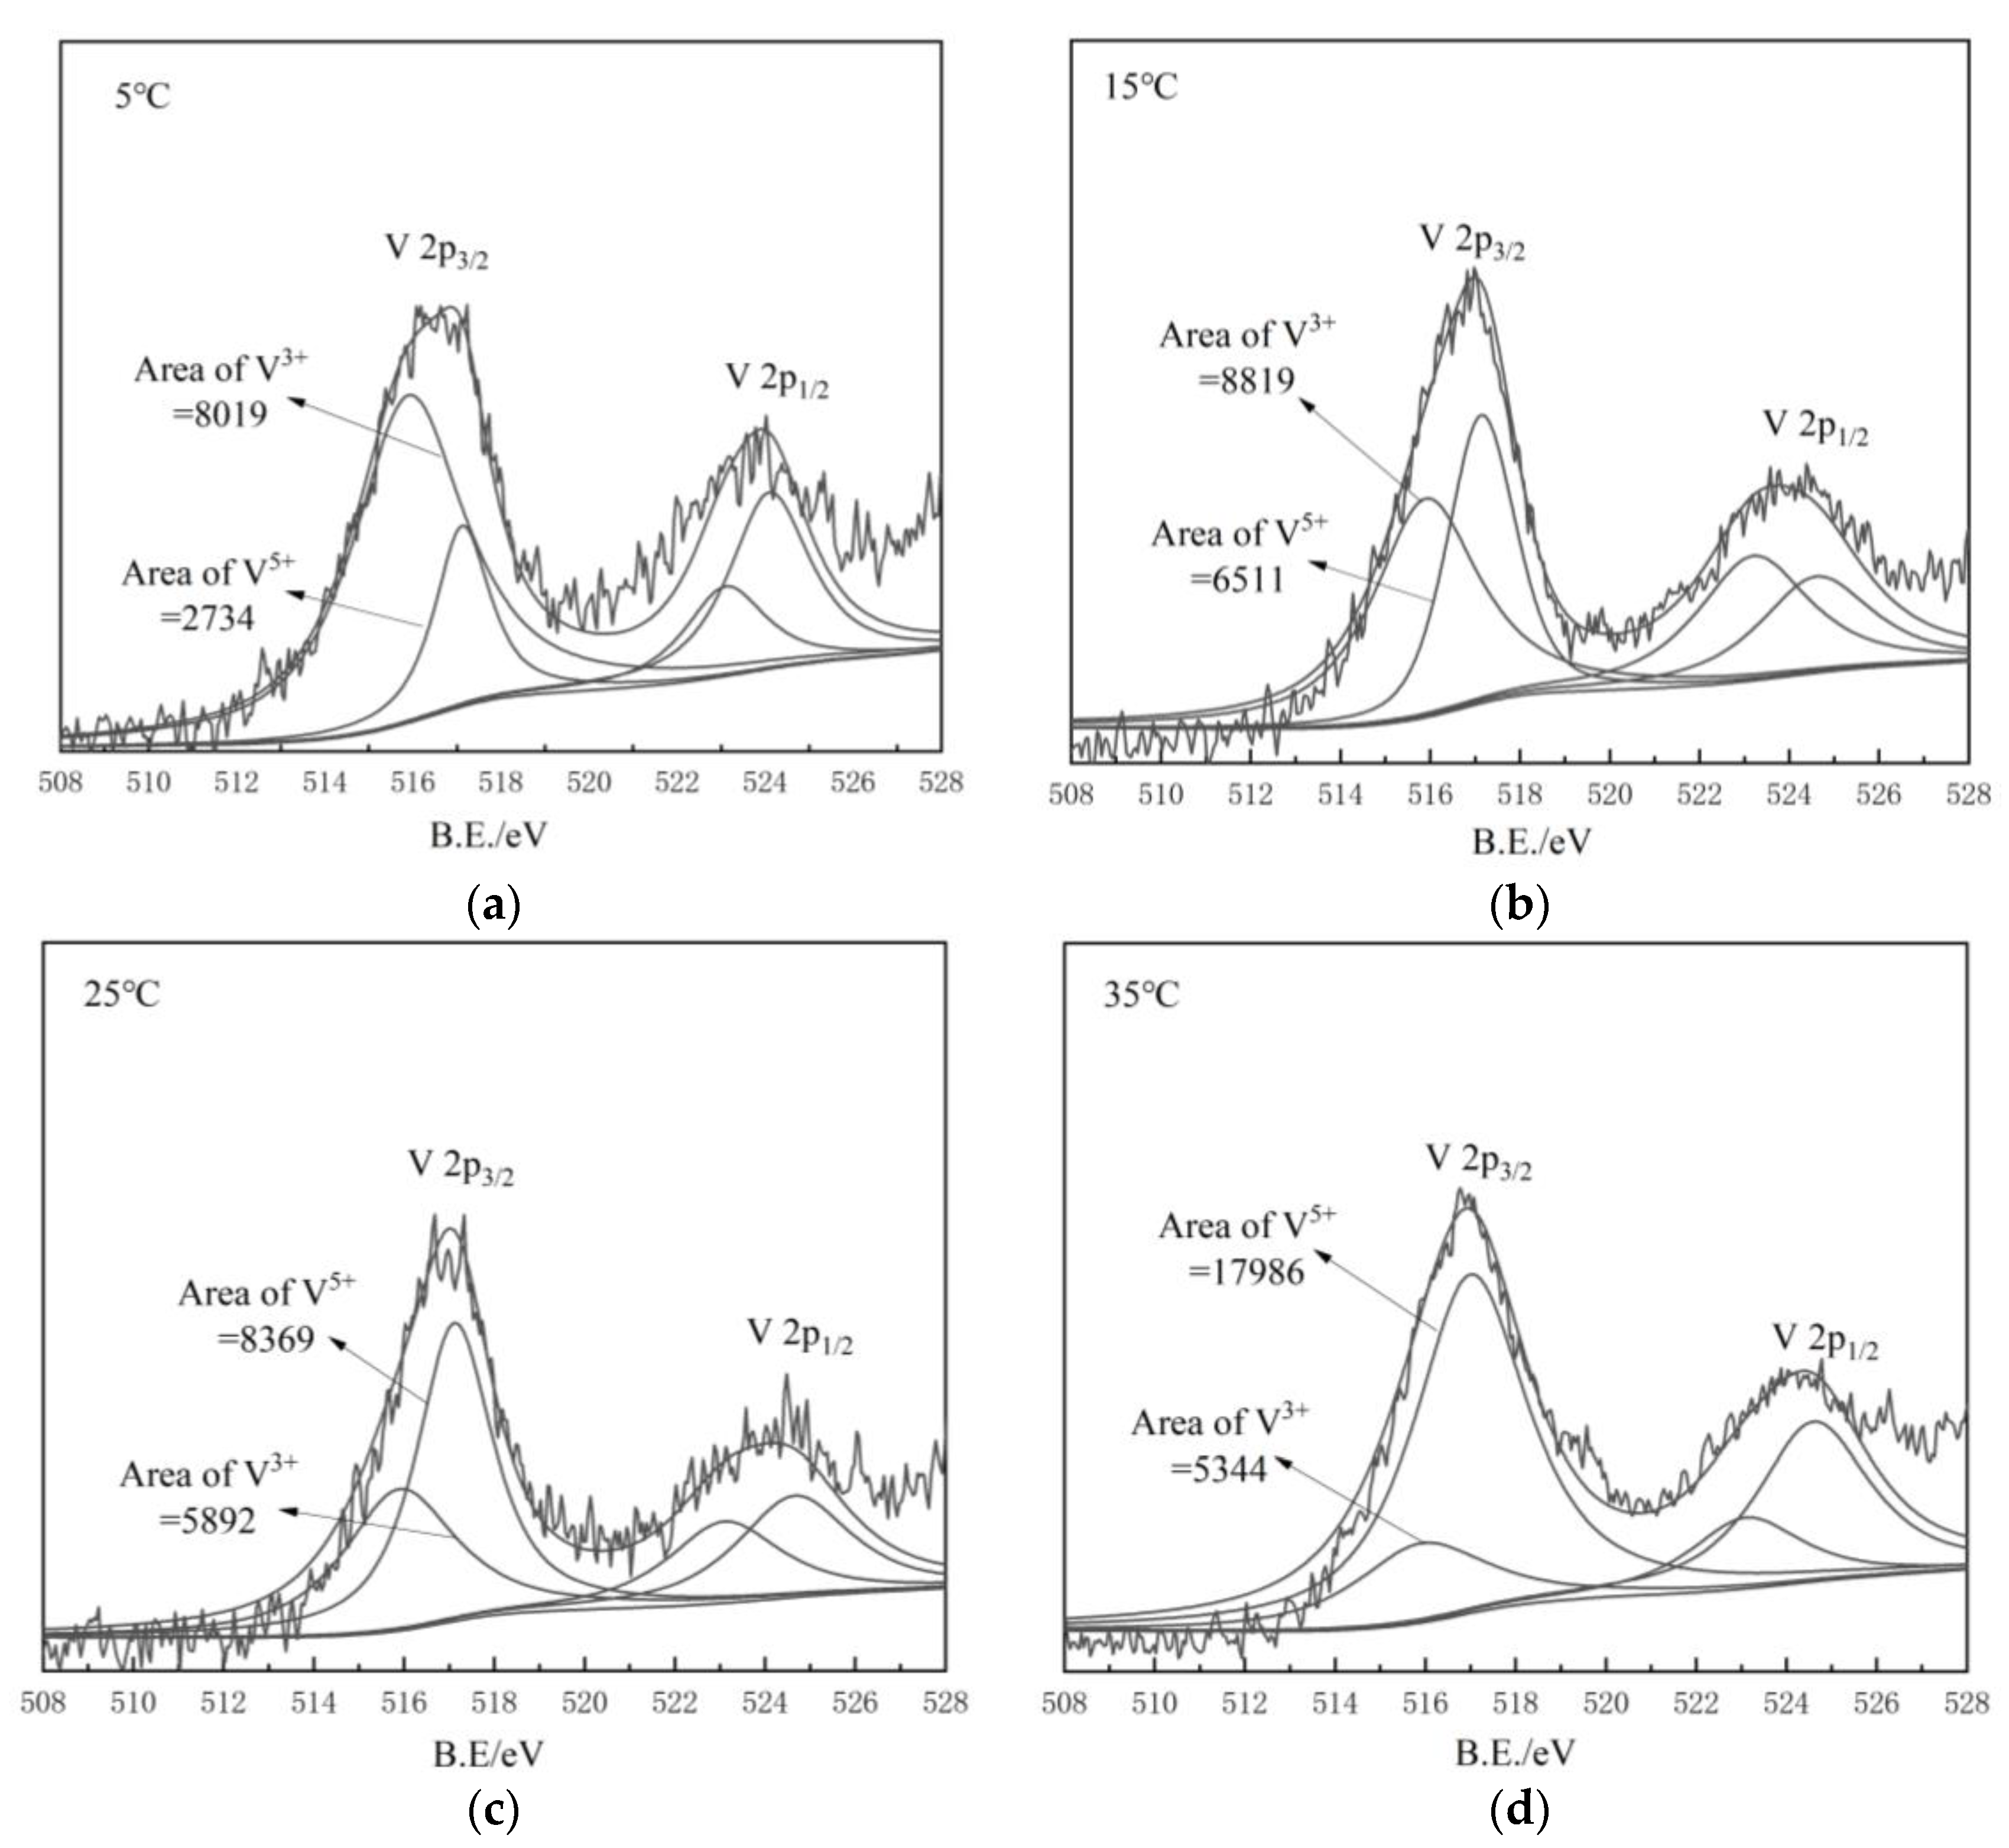
3.4. XPS Analysis
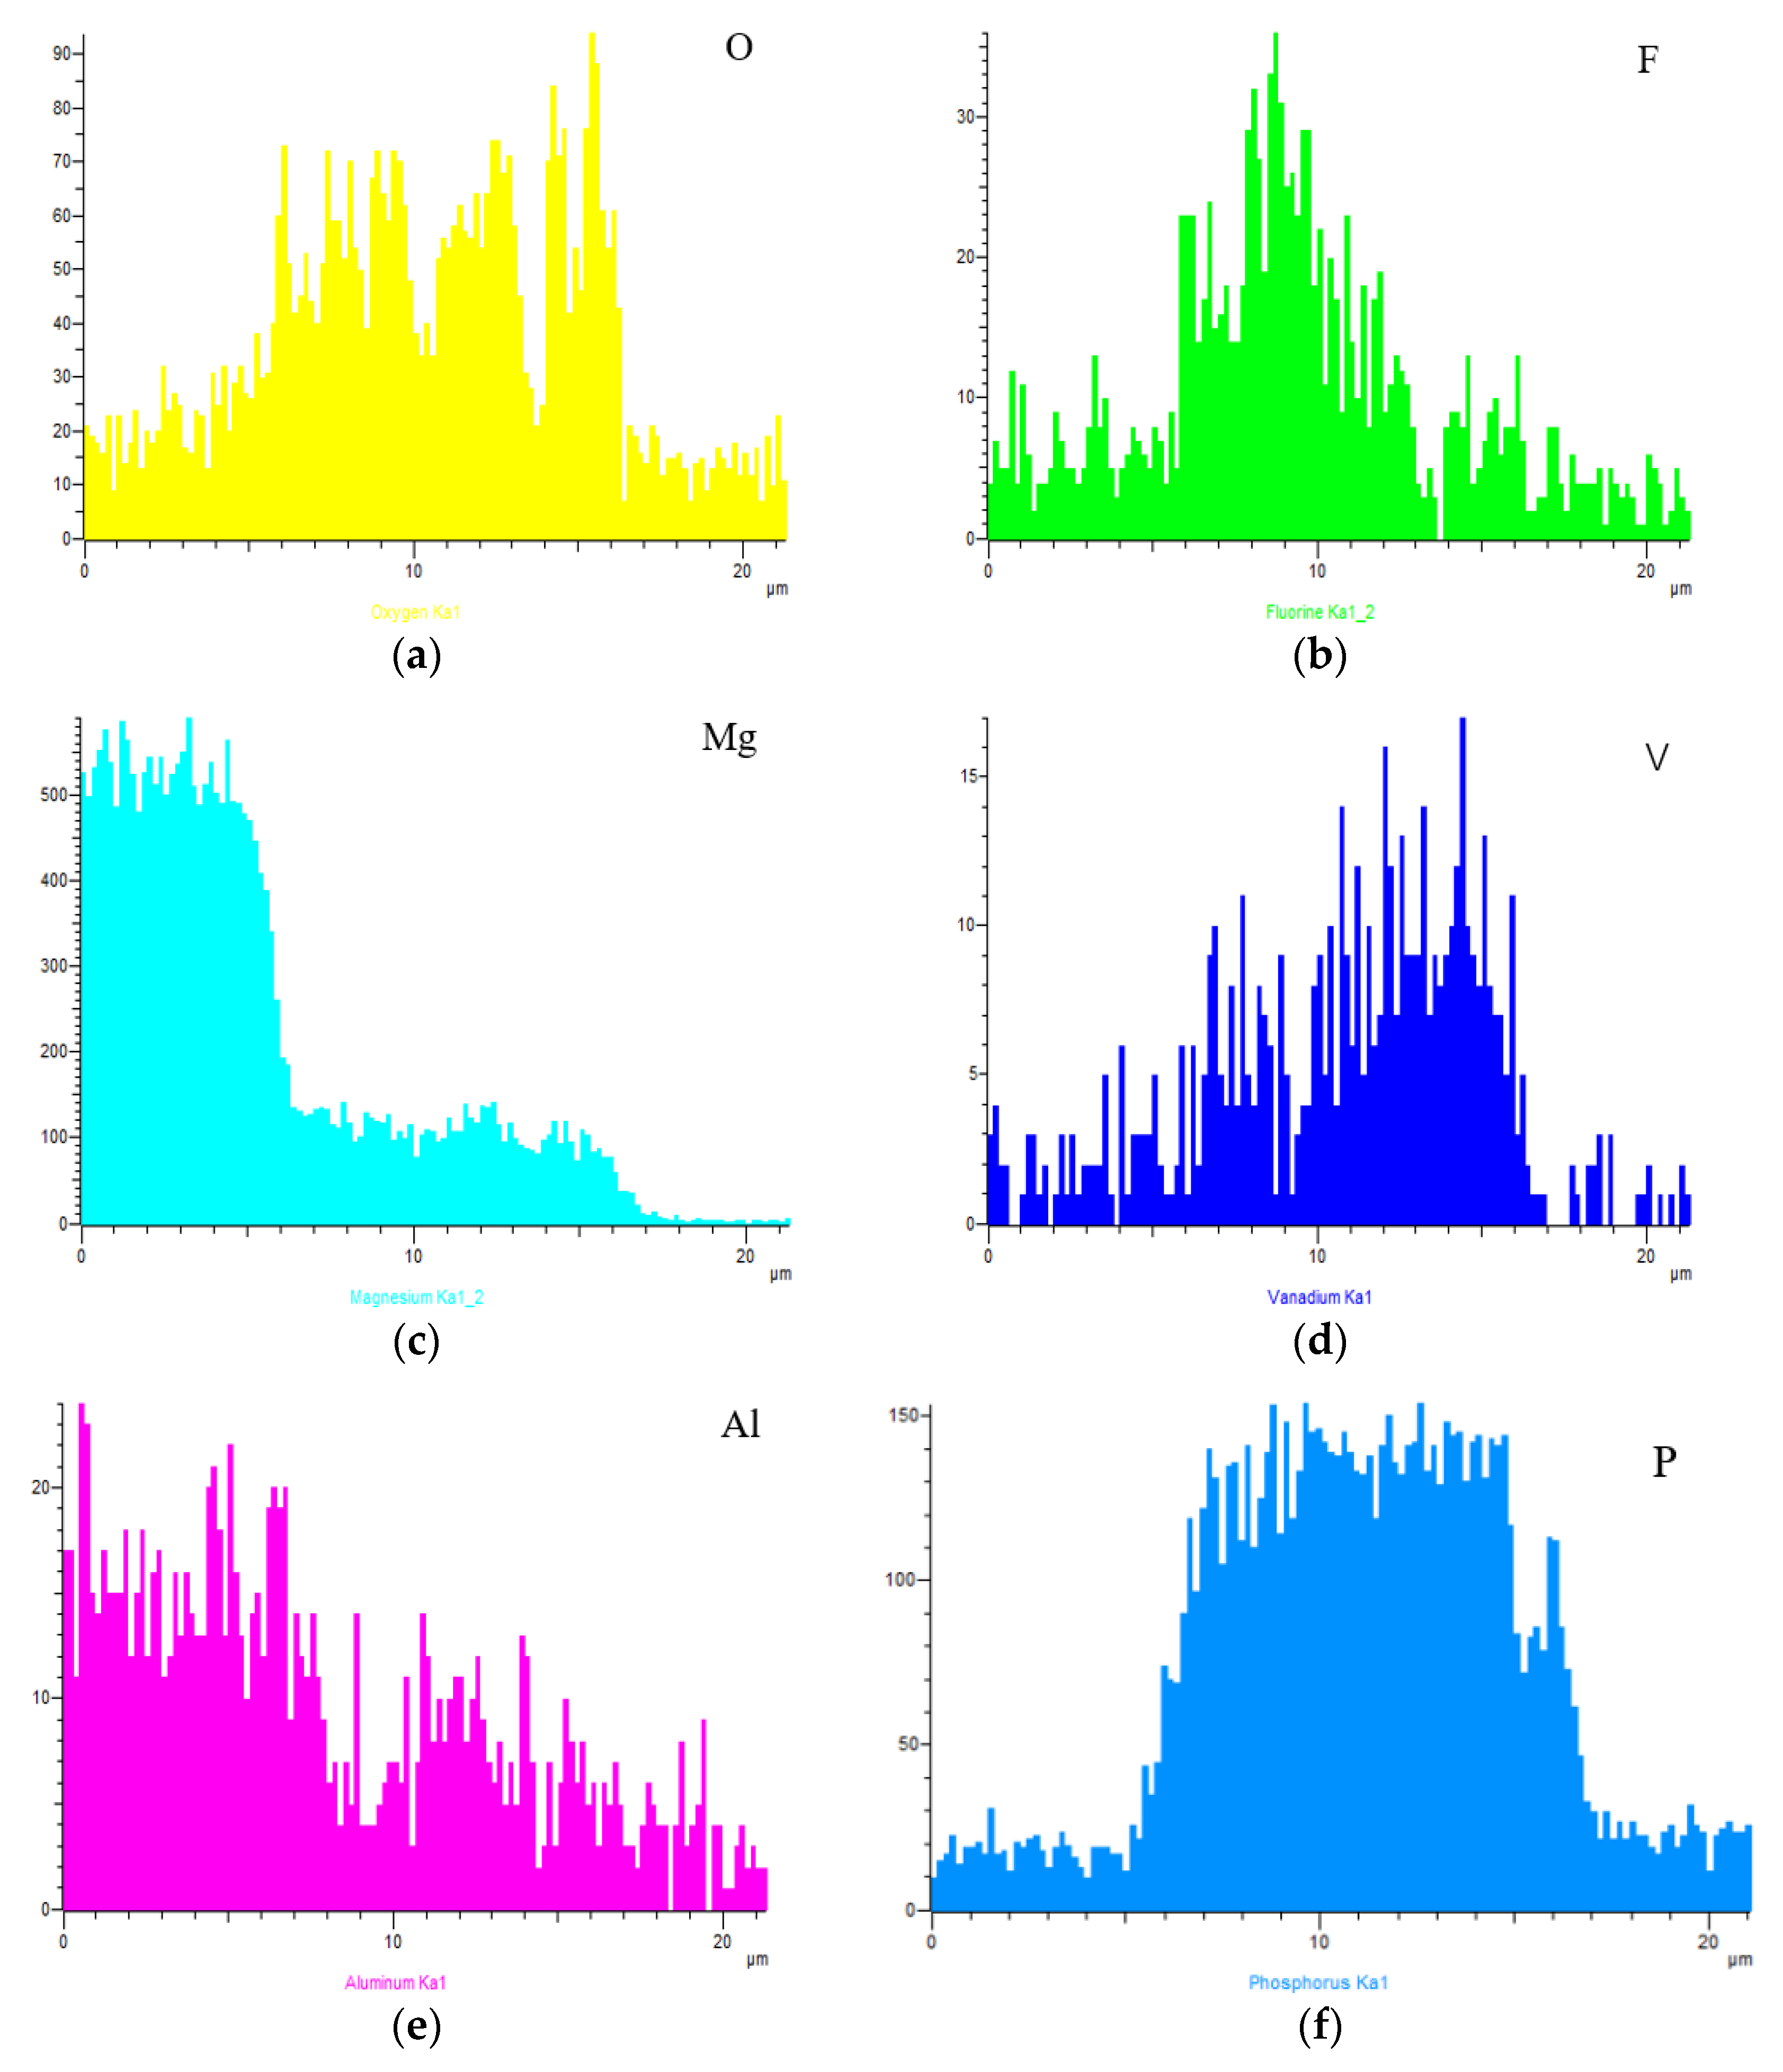
3.5. SEM Analysis
4. Discussion
The Mechanism of the Color Value Change of the Black PEO Coating
5. Conclusions
- The V2O3/V2O5 content ratio is the main reason for coating color change with the variation of electrolyte temperature. At higher temperatures, the V2O5 content is higher.
- With temperature increase, RVO decreased from 2.93 at 5 °C to 0.30 at 35 °C, with the coating color value ranging from 24.78 at 5 °C to 29.03 at 35 °C.
- In the process of PEO formation, V2O5 was mainly generated by VO3− losing electrons and then V2O5 reacting with NH3 in solution to form V2O3. The main reactions were 4VO3− − 4e− → 2V2O5 + O2 and 3V2O5 + 4NH3 → 3V2O3 + 6H2O + 2N2↑.
- The electrolyte temperature changed the coating microstructure. As temperature increased, the coating hole diameters decreased and hole numbers increased, with the coating thickness gradually decreasing.
Author Contributions
Funding
Conflicts of Interest
References
- Darband, G.B.; Aliofkhazraei, M.; Hamghalam, P.; Valizade, N. Plasma electrolytic oxidation of magnesium and its alloys: Mechanism, properties and applications. J. Magnes. Alloy. 2017, 5, 74–132. [Google Scholar] [CrossRef]
- Guan, X.; Zhu, H.; Shi, J.; Wei, S.; Shao, Z.; Shen, X. Influence of zinc-dipping on electroless nickel coating on magnesium alloy. Surf. Eng. 2018, 35, 906–912. [Google Scholar] [CrossRef]
- Wierzbicka, E.; Pillado, B.; Mohedano, M.; Arrabal, R.; Matykina, E. Calcium doped flash-PEO coatings for corrosion protection of Mg alloy. Metals 2020, 10, 916. [Google Scholar] [CrossRef]
- Ali, M.; Hussein, M.; Al-Aqeeli, N. Magnesium-based composites and alloys for medical applications: A review of mechanical and corrosion properties. J. Alloy. Compd. 2019, 792, 1162–1190. [Google Scholar] [CrossRef]
- Shao, Y.; Zeng, R.-C.; Li, S.-Q.; Cui, L.-Y.; Zou, Y.-H.; Guan, S.-K.; Zheng, Y.-F. Advance in antibacterial magnesium alloys and surface coatings on magnesium alloys: A review. Acta Met. Sin. 2020, 33, 615–629. [Google Scholar] [CrossRef]
- Godja, N.; Hansal, W.E.G.; Mann, R.; Kleber, C.; Hansal, S. Pulsed plasma electrolytic oxidation processes for aeronautical applications and their technical application. Trans. IMF 2013, 91, 321–329. [Google Scholar] [CrossRef]
- Zhang, X.; Wu, Y.; Wang, J.; Xia, X.; Lv, Y.; Cai, G.; Liu, H.; Xiao, J.; Liu, B.; Dong, Z. Microstructure, formation mechanism and antifouling property of multi-layered Cu-incorporated Al2O3 coating fabricated through plasma electrolytic oxidation. Ceram. Int. 2020, 46, 2901–2909. [Google Scholar] [CrossRef]
- Chen, Q.; Jiang, Z.; Tang, S.; Dong, W.; Tong, Q.; Li, W. Influence of graphene particles on the micro-arc oxidation behaviors of 6063 aluminum alloy and the coating properties. Appl. Surf. Sci. 2017, 423, 939–950. [Google Scholar] [CrossRef]
- Hsu, C.-H.; Teng, H.-P.; Lu, F. Effects of addition of Al(NO3)3 to electrolytes on alumina coatings by plasma electrolytic oxidation. Surf. Coat. Technol. 2011, 205, 3677–3682. [Google Scholar] [CrossRef]
- Luo, H.; Cai, Q.; Wei, B.; Yu, B.; Li, D.; He, J.; Liu, Z. Effect of (NaPO3)6 concentrations on corrosion resistance of plasma electrolytic oxidation coatings formed on AZ91D magnesium alloy. J. Alloy. Compd. 2008, 464, 537–543. [Google Scholar] [CrossRef]
- Rahmati, M.; Raeissi, K.; Toroghinejad, M.R.; Hakimizad, A.; Santamaria, M. Effect of pulse current mode on microstructure, composition and corrosion performance of the coatings produced by plasma electrolytic oxidation on AZ31 Mg alloy. Coatings 2019, 9, 688. [Google Scholar] [CrossRef] [Green Version]
- Aliramezani, R.; Raeissi, K.; Santamaria, M.; Hakimizad, A. Effects of pulse current mode on plasma electrolytic oxidation of 7075 Al in KMnO4 containing solution. J. Electrochem. Soc. 2017, 164, C690–C698. [Google Scholar] [CrossRef]
- Mann, R.; Hansal, W.E.G.; Hansal, S. Effects of pulsed current on plasma electrolytic oxidation. Trans. IMF 2014, 92, 297–304. [Google Scholar] [CrossRef]
- Liu, S.; Zeng, J. Effects of negative voltage on microstructure and corrosion resistance of red mud plasma electrolytic oxidation coatings. Surf. Coat. Technol. 2018, 352, 15–25. [Google Scholar] [CrossRef]
- Laurindo, C.A.H.; Lepienski, C.M.; Amorim, F.L.; Torres, R.D.; Soares, P. Mechanical and tribological properties of Ca/P-Doped titanium dioxide layer produced by plasma electrolytic oxidation: Effects of applied voltage and heat treatment. Tribol. Trans. 2018, 61, 733–741. [Google Scholar] [CrossRef]
- Tavares, M.D.M.; Vitoriano, J.D.O.; Da Silva, R.C.; Franco, A.R.; De Souza, G.B.; Da Costa, J.A.P.; Alves-Júnior, C. Effect of duty cycle and treatment time on electrolytic plasma oxidation of commercially pure Al samples. J. Mater. Res. Technol. 2019, 8, 2141–2147. [Google Scholar] [CrossRef]
- Vakili-Azghandi, M.; Fattah-Alhosseini, A. Effects of duty cycle, current frequency, and current density on corrosion behavior of the plasma electrolytic oxidation coatings on 6061 Al alloy in artificial Seawater. Metall. Mater. Trans. A 2017, 48, 4681–4692. [Google Scholar] [CrossRef]
- Krishtal, M.M.; Polunin, A.V.; Ivashin, P.V.; Borgardt, E.D.; Yasnikov, I.S. Changes in the phase composition of oxide layers produced by microarc oxidation on Al–Si and Mg alloys induced by additions of SiO2 nanoparticles to the electrolyte. Dokl. Phys. Chem. 2016, 469, 93–96. [Google Scholar] [CrossRef]
- Al Zoubi, W.; Kamil, M.P.; Yang, H.W.; Ko, Y.G. Electron-donor and -acceptor agents responsible for surface modification optimizing electrochemical performance. ACS Appl. Mater. Interfaces 2017, 9, 28967–28979. [Google Scholar] [CrossRef]
- Al Bosta, M.M.; Ma, K.-J. Influence of electrolyte temperature on properties and infrared emissivity of MAO ceramic coating on 6061 aluminum alloy. Infrared Phys. Technol. 2014, 67, 63–72. [Google Scholar] [CrossRef]
- Raj, V.; Ali, M. Formation of ceramic alumina nanocomposite coatings on aluminium for enhanced corrosion resistance. J. Mater. Process. Technol. 2009, 209, 5341–5352. [Google Scholar] [CrossRef]
- Zhai, Y.; Chen, H.; Ma, X. Effect of temperature of micro-arc oxidation electrolyte on microstructure and properties of AZ31B magnesium alloy. Mater. Prot. 2013, 46, 16–18. [Google Scholar]
- Bai, L.; Dong, B.; Chen, G.; Xin, T.; Wu, J.; Sun, X. Effect of positive pulse voltage on color value and corrosion property of magnesium alloy black micro-arc oxidation ceramic coating. Surf. Coat. Technol. 2019, 374, 402–408. [Google Scholar] [CrossRef]
- Li, J.; Cai, H.; Jiang, B. Growth mechanism of black ceramic layers formed by microarc oxidation. Surf. Coat. Technol. 2007, 201, 8702–8708. [Google Scholar] [CrossRef]
- Ahn, B.-H.; Lee, D.G.; Cho, H.-J.; Lee, S.-R.; Ahmed, F.; Anwar, M.S.; Koo, B.H. Effect of Na2SiO3 concentration on the properties of AZ31 magnesium alloy prepared by electrolytic plasma processing. Electron. Mater. Lett. 2013, 9, 813–815. [Google Scholar] [CrossRef]
- He, L.H.; Zhou, C.Q.; Kang, W.B.; Bo, Y.; Jian, H.; Jun, L.D. Effect of (NaPO3)6 on electrochemical corrosion characteristic of micro-arc oxidation ceramic coatings formed on AZ91D Mg alloy. Acta Phys. Chim. Sin. 2008, 24, 481–486. [Google Scholar] [CrossRef]
- Zhang, S.H.; Fu, J.; Su, Q.C.; Wu, L.; Li, X. In situ characterization on thermal transitions of VO2(B): Toward VO2(R) and V2O3. Rare Metal Mater. Eng. 2016, 45, 1374–1380. [Google Scholar] [CrossRef] [Green Version]
- Grzechnik, A. Local structures in high pressure phases of V2O5. Chem. Mater. 1998, 10, 2505–2509. [Google Scholar] [CrossRef]
- Silversmit, G.; Depla, D.; Poelman, H.; Marin, G.B.; De Gryse, R. Determination of the V2p XPS binding energies for different vanadium oxidation states (V5+ to V0+). J. Electron Spectrosc. Relat. Phenom. 2004, 135, 167–175. [Google Scholar] [CrossRef]
- Dou, Q.; Li, W.; Zhang, G.; Wan, X. Preparation and characterisation of black ceramic coating on AZ91D magnesium alloy by plasma electrolytic oxidation with reduced energy consumption. Mater. Res. Innov. 2015, 19, S2–S27. [Google Scholar] [CrossRef]
- Fattah-alhosseini, A.; Babaei, K.; Molaei, M. Plasma electrolytic oxidation (PEO) treatment of zinc and its alloys: A review. Surf Interfaces 2020, 18, 100441. [Google Scholar] [CrossRef]
- Wang, K.; Byeon, S.S.; Koo, B.H. Nitrogen inducing effect on preparation of AlON–Al2O3 coatings on Al6061 alloy by electrolytic plasma processing. Surf. Coat. Technol. 2010, 205, S11–S14. [Google Scholar] [CrossRef]
- Stojadinovic, S.; Tadić, N.; Vasilić, R. Down-conversion photoluminescence of ZrO2:Er3+ coatings formed by plasma electrolytic oxidation. Mater. Lett. 2018, 219, 251–255. [Google Scholar] [CrossRef]


| Element | Mg | Al | Zn | Ca | Si | Mn | Fe | Cu | Ni |
|---|---|---|---|---|---|---|---|---|---|
| Content/% | Bal. | 2.5–3.5 | 0.6–1.4 | 0.04 | 0.08 | 0.2–1.0 | 0.003 | 0.01 | 0.001 |
| Current Density/A·dm2 | Frequency/Hz | Duty Cycle/% | Time/min |
|---|---|---|---|
| 4 | 800 | 35 | 10 |
| Chemical Component | Na2SiO3 | (NaPO3)6 | NH4VO3 | KF | Na-Citrate | NaOH | EDTA |
|---|---|---|---|---|---|---|---|
| Content g/L | 15 | 20 | 10 | 25 | 3 | 3 | 5 |
| T/°C | 5 | 15 | 25 | 35 |
|---|---|---|---|---|
| The color value | 24.78 | 24.87 | 25.82 | 29.03 |
| T/°C | 5 | 15 | 25 | 35 |
|---|---|---|---|---|
| Thickness/μm | 14.54 | 12.39 | 8.97 | 7.54 |
| T/°C | 5 | 15 | 25 | 35 |
|---|---|---|---|---|
| RVO | 2.93 | 1.35 | 0.70 | 0.30 |
| Thermodynamic Data | VO3− (aq) | V2O5 (s) | V2O3 (s) | O2 (g) | N2 (g) | H2O (l) | NH3 (aq) |
|---|---|---|---|---|---|---|---|
| ΔfHmƟ (kJ·mol−1) | −888.3 | −1550.59 | −1218.3 | 0 | 0 | −285.83 | −80.29 |
| SmƟ (J·mol−1·K−1) | 50.2 | 130 | 98.3 | 205.152 | 191.5 | 69.91 | 111.29 |
| ΔfGmƟ (kJ·mol−1) | −783.7 | −1419.63 | −1139.3 | 0 | 0 | −237.18 | −26.57 |
| Reactions | Standard State (T/K) | Nonstandard State (T/K) (Considering Gas Partial Pressure) |
|---|---|---|
| (1) 4VO3− − 4e → 2V2O5 + O2↑ | 1698 | 2183 |
| (2) 4VO3− − 4e → 2V2O3 + 3O2↑ | 1827 | 2541 |
| (3) V2O5 → V2O3 + O2↑ | 1928 | 2260 |
| (4) V2O5 + 4NH3 → 3V2O3 + 6H2O + 2N2↑ | - | - |
© 2020 by the authors. Licensee MDPI, Basel, Switzerland. This article is an open access article distributed under the terms and conditions of the Creative Commons Attribution (CC BY) license (http://creativecommons.org/licenses/by/4.0/).
Share and Cite
Yi, A.; Liao, Z.; Zhu, W.; Zhu, Z.; Li, W.; Li, K.; Chen, K.; Huang, S. Influence of Electrolyte Temperature on the Color Values of Black Plasma Electrolytic Oxidation Coatings on AZ31B Mg Alloy. Coatings 2020, 10, 890. https://0-doi-org.brum.beds.ac.uk/10.3390/coatings10090890
Yi A, Liao Z, Zhu W, Zhu Z, Li W, Li K, Chen K, Huang S. Influence of Electrolyte Temperature on the Color Values of Black Plasma Electrolytic Oxidation Coatings on AZ31B Mg Alloy. Coatings. 2020; 10(9):890. https://0-doi-org.brum.beds.ac.uk/10.3390/coatings10090890
Chicago/Turabian StyleYi, Aihua, Zhongmiao Liao, Wen Zhu, Zhisheng Zhu, Wenfang Li, Kang Li, Ken Chen, and Shengkai Huang. 2020. "Influence of Electrolyte Temperature on the Color Values of Black Plasma Electrolytic Oxidation Coatings on AZ31B Mg Alloy" Coatings 10, no. 9: 890. https://0-doi-org.brum.beds.ac.uk/10.3390/coatings10090890