Article

Effect of Transformation Plasticity on Gear Distortion and Residual Stresses in Carburizing Quenching Simulation

1
Department of Information System, Saitama Institute of Technology, Fukaya 3690293, Japan
2
Saitama Institute of Technology, Fukaya 3690293, Japan
3
Ningbo Haizhi Institute of Material Industry Innovation, Ningbo 315000, China
4
Graduate School of Science and Engineering, Chiba University, Chiba 263-8522, Japan
5
School of Mechanical Engineering, Hebei University of Technology, Tianjin 300131, China
6
Parts Development Department, Zhejiang Wanliyang Co., Ltd., Hangzhou 310024, China
*
Author to whom correspondence should be addressed.
Submission received: 7 August 2021 / Revised: 13 September 2021 / Accepted: 23 September 2021 / Published: 9 October 2021
(This article belongs to the Special Issue Surface Modification and Functionalization for Advanced Materials)

Abstract

:
This paper addresses the effect of gear steel on distortion and residual stresses due to phase transformation in carburizing and quenching. In particular, the martensitic and bainitic phase transformation expansion and transformation plasticity properties of two automotive gearbox steels (20CrMnTiH and 20MnCr5) and their physical parameters are measured by experiments of transformation plasticity properties. Numerical simulations of the actual carburizing and quenching process of the gearbox spline helical gears were carried out in combination with the thermal and mechanical properties with temperature variations calculated by the material design software JMAT-Pro. In particular, the phase transformation properties of the two materials and their influence on the distortion and residual stresses after carburizing and quenching were verified by experiments of transformation plasticity and numerical simulations. A reliable basis is provided for predicting the distortion mechanism of gear steels in carburizing and quenching.

1. Introduction

The gearboxes of new energy vehicles differ from conventional gearbox designs, mainly in terms of high transmission ratios and small gear sizes. For this reason, it is necessary to increase the hardness of the tooth surfaces in order to guarantee the high wear resistance necessary at high ratios. The carburizing and quenching process is an important technology used in industry to improve the high hardness and wear resistance of gear surfaces. By carburizing and quenching, gears can achieve better mechanical properties and higher fatigue strength [1,2,3]. However, the carburizing and quenching process often uses quench oil as a coolant, and after the gear is heated to around 930 °C and put into the quench oil, very complex nucleation and vapor film boiling occur, while the material changes from an austenitic state to a martensitic or bainite state depending on the cooling rate of each part. As a result of the differences in each part of phase transformation structure, phase transformation expansion and plastic distortion occur due to the transformation plasticity of the difference. These differences in phase transformation structure and the differences in phase transformation expansion and transformation plasticity are one of the main causes of distortion after carburizing and quenching. This, together with the thermal and inelastic strains caused by temperature changes, leads to a complex mechanism of distortion as well as residual stresses during the carburizing and quenching process [4,5,6]. Without an accurate grasp of these mechanisms, it is difficult to predict the distortion in carburizing and quenching and to determine the amount of machinability reserved for the gear before carburizing and quenching.
In order to predict the diffusion, heat transfer, behavior of phase transformation and inelastic stress/strain behavior of carbon during carburizing and quenching using numerical simulation methods, Inoue and Ju proposed a thermal-phase transformation-mechanical theory and a numerical simulation method based on multi-field coupling [6,7,8,9,10]. This theory and the numerical simulation method provide the basis for predicting carburizing quench distortion. However, as multi-field coupled simulations incorporating the behavior of phase transformation require accurate knowledge of the phase transformation properties and characteristics that reflect the phase transformation behavior, the actual measurement of phase transformation expansion and phase transformation plasticity that occurs when a phase transformation is generated becomes very important to study. In this thesis, a thermal simulation tester and test method were developed. This method allows the behavior of phase transformation expansion and transformation plasticity of steel during phase transformation and heat treatment to be measured and the coefficients of phase transformation expansion and transformation plasticity to be calculated based on the kinetics theory of phase transformation [11,12,13]. In order to verify the effect of phase transformation characteristics on the distortion after carburizing and quenching, this paper uses the heat treatment simulation software with multi-field coupling (COSMAP) developed by Ju and Inoue to carry out carburizing and quenching simulations on variable box gears [14,15,16]. The phase transformation characteristics of two MnCr alloy steels (20MnCr5 and 20CrMnTiH) with relatively similar compositions were measured to compare the phase transformation characteristics of the two materials and to obtain the effect of the trace addition of Ti on the phase transformation characteristics. The material properties and transformation plasticity behavior of these two alloy steels were substituted into the carburizing and quenching simulations to obtain the effect of phase transformation properties on the distortion and residual stresses of the gears. These results provide further insight into the effect of Ti on the phase transformation properties and also reveal the effect of the phase transformation properties on the distortion and stress fields generated in the carburizing quench. This will be of great use in predicting the mechanical strength and properties of carburized quenched gears and suggesting optimizing processes.

2. Summary of the Theoretical Model

The carburizing and quenching process allows the phase transformation structure of the material to be changed. In particular, mechanical components, such as gears, bearings and rollers, which place high demands on the surface in terms of resistance to friction and wear, can be substantially hardened and improved by the carburizing process. However, the carburizing and quenching process involves a complex continuous medium thermodynamic theory and requires consideration of the coupling between the carbon concentration diffusion field, temperature field, phase transformation kinetics and tissue distribution, as well as the inelastic stress/strain field (as shown in Figure 1) [6,7,8,9,10].
In this theory, the coupling effects of the following aspects are considered. The first is a comprehensive consideration of the effects on material properties and phase transformation kinetics due to the diffusion of carbon ions in the steel and the creation of a gradient distribution. The second considers the effect of temperature changes on the nucleation and growth of phase distortion and on the temperature field due to the generation of latent heat from the phase transformation. The growth of the phase transformation has an effect on the stress and strain fields as the phase transformation brings about local expansion or contraction. Conversely, the stress/strain fields can also inhibit or induce the nucleation and growth of the phase transformation. The third aspect is that changes in the temperature field inevitably lead to expansion or contraction of the material, i.e., thermal strain. When large distortions occur within the material as a result of processing and heat treatment, heat generation also occurs, which affects the change in the temperature field. This is the phenomenon of multi-field coupling in the heat treatment process.

3. Theory and Experimental Method of Transformation Plasticity

3.1. Theory Experimental Method of Transformation Plasticity

3.1.1. Inelastic Constitutive Equation

It is possible to obtain an explicit expression of the relationship for elastic stress–strain while giving the form of the Gibbs free energy function G. In this way, the component ε i j e of the elastic strain tensor is derived as follows:
ε i j e = ρ   I = 1 N ξ I G I e ( σ i j , T ) σ i j
where, ρ is density,   σ i j is stress, T is temperature and ξ I is the volume fraction of the I-th transformation. Considering the case where the I-th (I = 1, 2, …, N) phase undergoes plastic distortion, normal thermal plastic distortion occurs even if there is no change by the volume of the phase. When materials have the assumption of isotropy, the expansion of G I e ( σ k l , T ) around the natural state σ k l = 0 and T = T 0 leads to:
G I e ( σ k l , T ) = ρ [ ϕ I 0 + ϕ I 1 σ k k + ϕ I 2 ( σ k k ) 2 + ϕ 13 σ k l σ k l + ϕ I 4 ( T T 0 ) σ k k + f I ( T T 0 ) ]
where f 1 ( T T 0 ) is the function of temperature rise and ϕ I 0 , ϕ I 1 , ϕ I 3 , ϕ I 4 are the polynomial functions of stress invariants and temperature.
Then, the elastic strain ε i j e can be expressed as:
ε i j e = I = 1 N   ξ I ε I i j e
with
ε I i j e = 2 ϕ I 3 σ i j + 2 ϕ I 2 σ k k δ i j + ϕ I 4 ( T T 0 ) δ i j + ϕ I 1 δ i j
where δ i j is a component of the unit matrix. As the first two items of Equation (4) are Hooke’s law, the third item is thermal strain and isotropic strain of the I-th constituent is related to the fourth item, provided that the parameters are constant, then we can apply:
2 ϕ I 3 = 1 + v 1 E I ,     2 ϕ I 2 = v 1 E l ,               ϕ I 4 = α I ,                 ϕ I 1 = β I
where E I and v I are Young’s modulus and Poisson’s ratio, respectively, and β I is volumetric dilatation due to phase transformation in this case. Then, we have:
ε I i j e = 1 + v I E I σ i j v I E I σ k k δ i j + α I ( T T 0 ) δ i j + β I δ i j
Due to the global form of material parameters, Young’s modulus E, Poisson’   v , linear expansion coefficient α and transformation expansion coefficient β with a relationship of phase transformation structure can be written by a relationship with phase transformation structure as:
E =       1 I = 1 N   ζ 1 E 1 ,     v = I = 1 N   ξ I v I E I I = 1 N   ξ 1 E I ,     α = I = 1 N   ξ I α I ,     β = I = 1 N   ξ I β I
Finally, the macroscopic elastic strain is summarized as the following formula:
ε i j e = 1 + v E σ i j v E σ k k δ i j + α ( T T 0 ) δ i j + β δ i j

3.1.2. Plastic Strain

The evolutional equation of the plastic strain for an elastic–plastic material is derived (common rule) [6]:
ε ˙ i j p = Λ F σ i j
with the yield function
F = F ( σ i j , ε i j p , κ , T , ξ I ) = 0
The effect of the structures is represented by the yield function F, the plastic strain is ε i j p and κ is the yield strain and hardening parameter of materials.
The parameter Λ in Equation (9) is a function depending on stress, strain and stress rate and its history. We introduce Prager’s consistency correlation:
F ˙ = F σ i j σ ˙ i j + F ε i j p ε ˙ i j p + F κ κ ˙ + F T T ˙ + I = 1 N   F ξ I ξ ˙ I = 0
The parameter Λ is easily determined as:
Λ = G ^ ( F σ m n σ ˙ m n + F T T ˙ + I = 1 N   F ξ I ξ ˙ I )
Finally, we have:
ε ˙ i j p = G ^ ( F s k l s ˙ k l + F T T ˙ + I = 1 N   F ξ I ξ ˙ I ) F σ i j
G ^ is termed as the hardening function and takes the form:
1 G ^ = ( F ε m n p + F κ σ m n ) F σ m n
where s k l is a component of deviation stress.

3.1.3. Transformation Plastic Strain

During phase transformation, relatively low stresses even below the yield stress can induce large inelastic distortions, which are often called transformation plasticity. Sometimes, an inelastic strain is so large that it is called a transformation superplastic strain, which is observed in some alloys. However, the strain induced during quenching is mostly small owing to the relatively short operation time, and the phenomenon is called transformation plasticity [11,12,13].
Inoue et al. give a detailed and more general discussion [11]. Nevertheless, the transformation plastic strain is normally presented as a linear function of applied stress, and the rate is presented as:
ε ˙ i j t p = 3 2 i = 1 n   K I h ( ξ I ) s i j ,    
with
h ( ξ I ) = 2 ( 1 ξ I )
where N is the number of phase transition types, the parameter K I is the coefficient of the transformation plasticity, ε ˙ i j t p is the strain due to transformation plasticity, h ( ξ I ) is a function related to phase change volume rate and s i j is deviator stress under the yield condition. It is not easy to obtain these data given the rather complicated experimental procedure but also the dilatation under stress that needs to be measured during the cooling operation. Some data and proposed simple ways to identify the coefficient are included in the references and the Jmat-Pro for materials design software [17].

3.2. Experimental Method of Transformation Plasticity Behavior

3.2.1. Multi-Purpose Thermo-Mechanical Load Test

The experimental setup used in this paper is shown in Figure 2. The device uses an infrared heating furnace (YONEKURA MFG, Osaka, Japan), which allows rapid local heating of the central part of the specimen. This method has a fast heating rate and the two fixed ends of the specimen have a low temperature and are not easily deformed, thus ensuring the accuracy of the experiment. In the experiment, a 0.01 thermocouple wire (KMT-100-100-200) is welded to the middle of the specimen (where it is heated) in order to measure the temperature change during heating and cooling. The experimental setup is equipped with a load cell and a laser extensometer. The laser extensometer for the experimental test section is shown in Figure 2a. In the experiments, the laser extensometer can be used to measure the displacement with high speed and accuracy. In addition, in order to measure the distortion during the moment of phase transformation and the growth of the phase transformation, a tensile test set is installed in our experimental setup (shown in Figure 2a and Figure 3a). This allows the tensile machine to be activated automatically when the initial temperature of the phase transformation is reached and to start applying the load to the specimen so that the distortion during the onset and growth of the phase transformation can be measured under different stress loads.
Figure 3b represents the shape of the test specimen. In the experiments, the specimens were held with nuts on clamps at the ends of the stretching device. Two quartz glass rods were mounted 3 mm apart at the left and right midpoints of the specimens. When the specimen was heated and cooled, the distance between the two rods changes and the change in displacement was measured by the laser extensometer (YONEKURA MFG, Osaka, Japan) and stored in the computer.

3.2.2. Transformation Plasticity during the Cooling Phase

Figure 4 shows the relationship of stress-phase transformation plastic strain obtained by the experiment. When a single-phase transformation occurs in the steel material, the plastic behavior of the phase transformation is generally measurable. When the applied load increased continuously, the phase transformation plastic strain produced by the material had a significant difference against the unloaded state. For the unloaded state, the material only experienced phase transformation strain and thermal strain, whereas for the loaded state, in addition to phase transformation strain and thermal strain, phase transformation plastic strain also occurred. In this case, the normal plastic strain would not occur, as the stress generated by the applied load does not exceed the yield limit. The coefficient of the transformation plasticity can be solved by Equation (17).
K = ε τ p σ
where ε τ p is strain in the loaded state or strain in the unloaded state, σ is stress in the loaded state and K is the coefficient of the transformation plasticity.

4. Experimental Results of Transformation Plasticity

4.1. Results of 20CrMnTiH Steel

According to the CCT curves of 20CrMnTiH steel (results of JMAT-Pro, represented in Figure 5a), during the cooling phase of the 20CrMnTiH material, its bainitic phase transformation occurs at around 520 °C, while its martensitic phase transformation occurs at around 440 °C. Therefore, two different cooling rates had to be experimented with in order to measure the phase transformation plastic distortion of bainite and martensite in materials during the phase transformation growth process. In our experiments, we used the method of controlling the flow rate of the cooling gas to achieve the control of the cooling rate. The final two different cooling rates are shown in Figure 5b. The chemical composition of the sample is shown in Table 1.
The results of these two experiments are shown in Figure 6. Based on these results and Equation (17), the transformation plasticity coefficients of the bainitic and martensitic phases transformation for the materials are 1.035 × 10⁻⁵ [MPa−1] and 3.72 × 10⁻⁶ [MPa−1], respectively.

4.2. Results of 20MnCr5 Steel

Similarly, according to the CCT curve of 20MnCr5 steel (shown in Figure 7a), it can be determined that the bainitic phase transformation occurs at around 530 °C, while the martensitic phase transformation occurs at around 420 °C. The cooling rate for measuring the plasticity of the bainitic and martensitic phase transformation is determined from the CCT curve and controlled to obtain a cooling curve that gives access to both phase transformations (as shown in Figure 7b). With this controlled cooling rate, the distortion curves for martensitic and bainitic growth were measured separately (as shown in Figure 8). Based on this result and Equation (17), plasticity coefficients of the martensitic and bainitic phase transformation for the material can be calculated as 1.274 × 10⁻⁵ [MPa−1] and 1.36 × 10⁻⁵ [MPa−1], respectively. The chemical composition of the sample is shown in Table 2.

5. Model and Results of Simulation

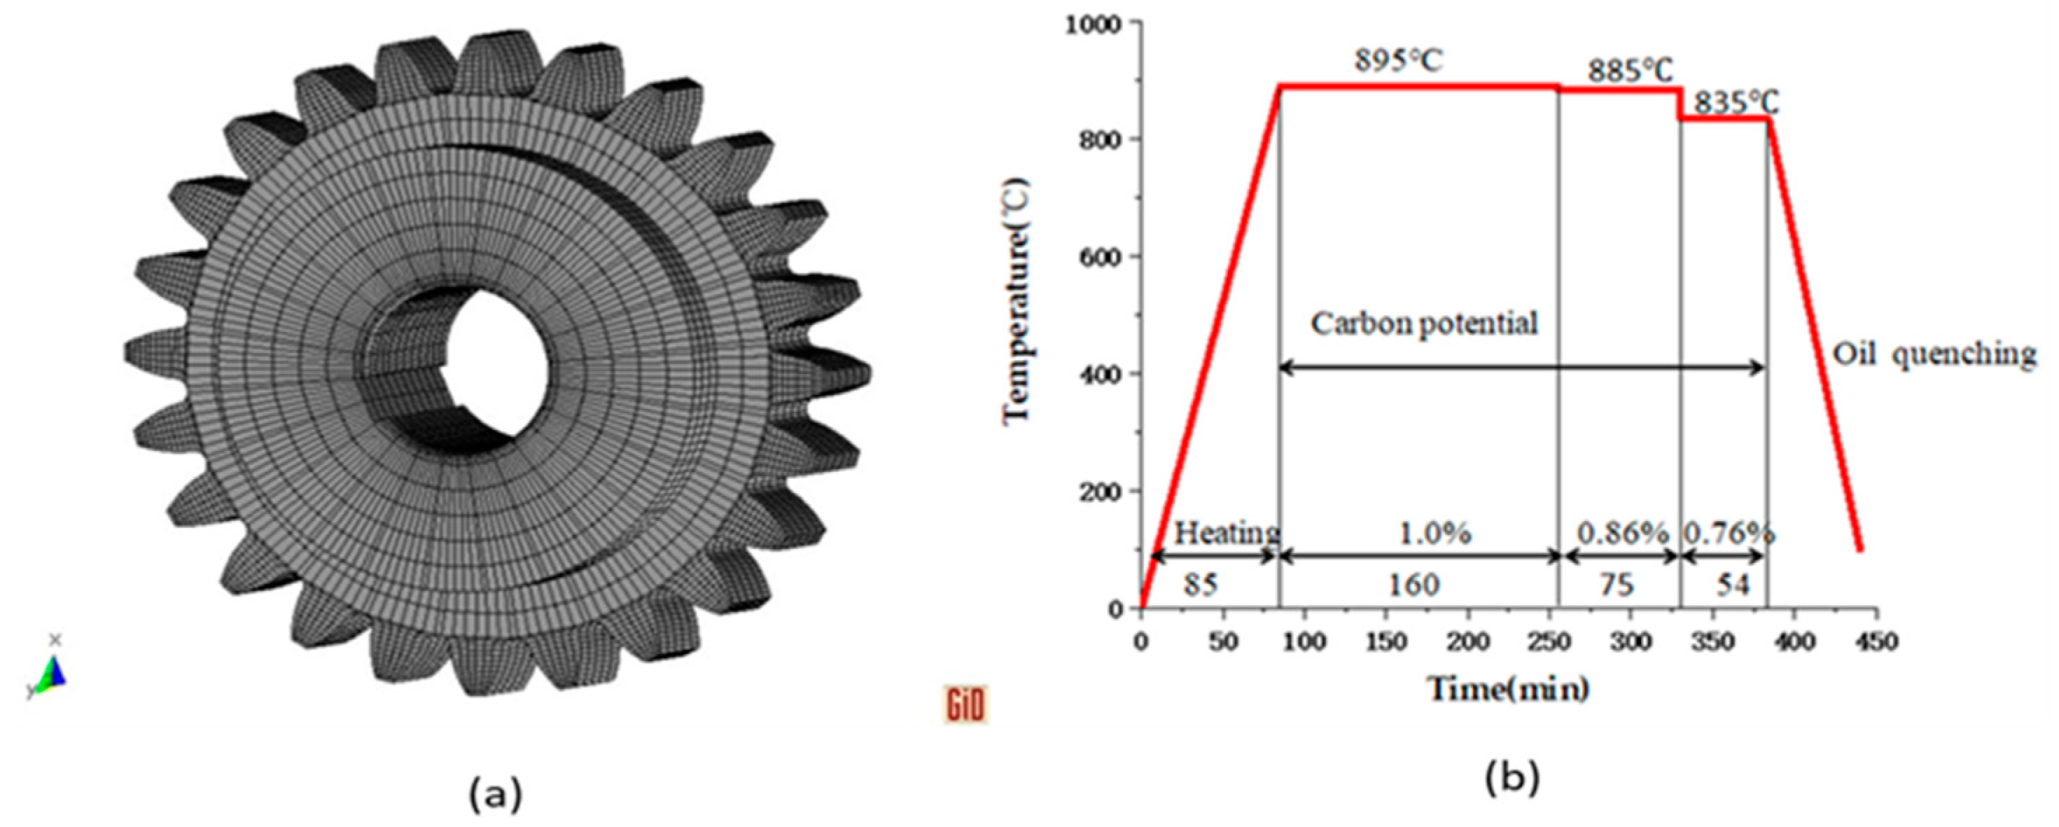
5.1. Model and Boundary of Simulation

In order to verify the effect of transformation plasticity on the distortion and residual stresses in the gear after carburizing and quenching, we carried out a multi-field coupled numerical simulation for the full process of carburizing and quenching a gear model. Here, a straight accelerated gear was used for simulation and evaluation. A 3D gear geometry model (Figure 9a) was first created using GID software with a 3D six-sided element mesh. The total number of nodes in the model was 31,860 and the total number of elements was 24,700.
The gear carburizing and quenching process is shown in Figure 9b. The heat transfer boundary conditions during quenching are set as in Figure 10a. The quenching coolant is quenching oil. As the gear end face is placed into the coolant in a horizontal attitude during quenching, there is a large time difference between the upper and lower end faces of the gear and the nucleation and film boiling phenomena, resulting in different heat transfer coefficients and different cooling rates for the upper and lower end faces. The heat transfer coefficients of the upper and lower end faces of the gear are shown in Figure 10b.

5.2. Simulation Results of Distortion

5.2.1. Simulation Results of 20CrMnTiH Steel

An important item as a quality check after the carburizing and quenching of gears is to check the amount of distortion at the gear knuckle after carburizing and quenching. If the amount of transformation is too large, it will lead to gear transmission accuracy and produce a large noise level, which can affect the assembly of the transmission. On the other hand, in order to evaluate the effect of introducing transformation plasticity on the distortion of gears after carburizing and quenching, two numerical simulations were carried out to compare the two types of simulations in which transformation plasticity is not taken into account. Figure 11a represents the results of the 3D distortion simulation considering transformation plasticity. Figure 11b shows the results of the three-dimensional distortion simulation without considering the transformation plasticity. Figure 11c shows the distortion results at the gear pitch circle and compares the two cases with and without consideration of transformation plasticity. The comparison shows that the simulated results are smaller when transformation plasticity is taken into account. In practice, the maximum distortion at these gear pitches was kept to around 0.1 mm. Therefore, it can be seen that the results that take into account transformation plasticity are closer to the inspection requirements.

5.2.2. Simulation Results of 20MnCr5 Steel

Figure 12 represents the distortion results of a 20MnCr5 steel gear after carburizing and quenching. Figure 12a displays the 3D distortion simulation considering transformation plasticity. Figure 12b shows the results of the 3D distortion simulation without consideration of transformation plasticity. Figure 12c shows the distortion results at the gear pitch circle and compares the two cases considering and not considering transformation plasticity. The comparison of the results shows that the simulation results for distortion are smaller for gears of 20MnCr5 steel where transformation plasticity is also considered. However, the overall distortion results are greater than those for gears of 20CrMnTiH steel, which indicates that this carburizing and quenching process is more suitable for 20CrMnTiH steel, but for 20MnCr5 steel, the carburizing and quenching process must be improved if the distortion after carburizing and quenching is to meet the usual testing standards.

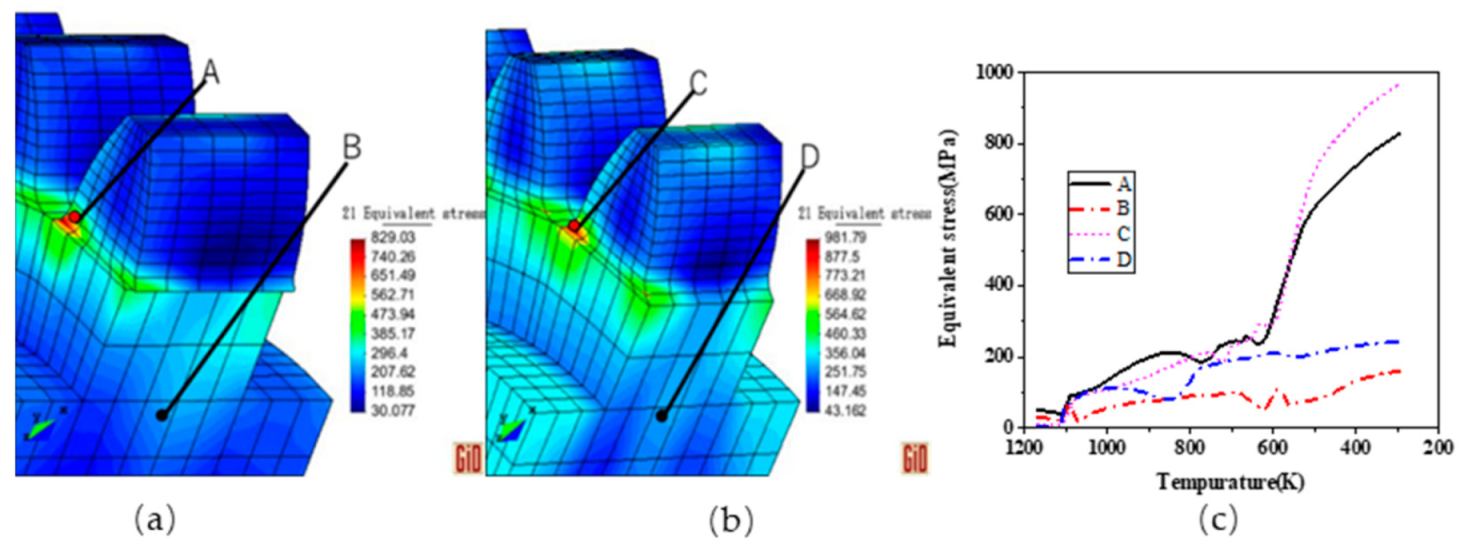
5.3. Simulation Results of Equivalent Stress

5.3.1. Simulation Results of 20CrMnTiH Steel

The main purpose of the carburizing and quenching process is to increase the strength and hardness of the tooth surface while obtaining an optimum match between overall stiffness and toughness through differences in the internal and surface phase transformation structure. In general, the residual stresses after carburizing and quenching play an important role in the strength improvement of gears. Numerical simulations of the carburizing and quenching process are carried out to predict the strength of gears after carburizing and quenching, and therefore, the residual stresses on the tooth surfaces of gears after carburizing and quenching are important to evaluate. According to the theory described in Section 3, consideration of transformation plasticity is important to improve the accuracy of the simulation of the stress field. For this reason, as in the case of distortion simulations, and in order to consider the effect of transformation plasticity on the residual stresses in this paper, the equivalent residual stress simulation results after considering transformation plasticity are given in Figure 13a, where points A and B are the points on the surface and inside the gear, respectively. Figure 13b gives the simulated results of equivalent residual stresses when transformation plasticity is not considered. Points C and D are also points on the surface and inside the gear, respectively. The four stress curves in Figure 13c are the equivalent stress changes with temperature changes at points A, B, C and D of the gear. The maximum stress values of the four points in Figure 13a,b are 829.03 MPa, 160.82 MPa, 970.41 MPa and 242.35 MPa, respectively.
According to previous studies [19,20], the maximum equivalent residual stress level in the tooth face area of gears with outer diameters below 200 mm after carburizing and quenching is generally in the range of 300–500 MPa, and the equivalent residual stress inside the gear does not exceed the strength limit of the material. Therefore, the results in Figure 13c show that the stress results obtained are too large if transformation plasticity is not taken into account, whereas the stress results with transformation plasticity taken into account are closer to reality.

5.3.2. Simulation Results of 20MnCr5 Steel

Similarly, we also carried out carburizing and quenching simulations for gears of 20MnCr5 steel. The effect of phase transformation plasticity on the residual stresses in the 20MNCr5 steel was also analyzed separately considering the effect of transformation plasticity. Figure 14a shows the equivalent residual stress simulation results after considering transformation plasticity, where points A and B are the points on the surface and inside the gear, respectively. Figure 14b shows the equivalent residual stress simulation results without consideration of transformation plasticity, where points C and D are the points on the surface and inside the gear, respectively. Figure 14c shows the simulation results for the stresses at points A, B, C and D as a function of temperature; their maximum stress values are 580.80 MPa, 54.91 MPa, 846.18 MPa and 138.28 MPa, respectively.
It can be seen that the simulation results after considering the transformation plasticity are smaller and closer to the actual situation than the simulation results without considering the transformation plasticity. Furthermore, the residual stresses in the 20MnCr5 steel are lower than those in the 20CrMnTiH steel. This suggests that if the residual stresses in 20MnCr5 steel after carburizing and quenching need to be increased, the process conditions for carburizing and quenching also need to be adjusted.

6. Conclusions

This paper proposes an experimental method for evaluating the transformation plasticity behavior of alloy steels during quenching. The method was used to determine material coefficients of the transformation plasticity for martensite and bainite phases of 20CrMnTiH and 20MnCr5 steels.
Based on the measured phase change plasticity parameters and the metallo-thermal-mechanical theory, the interactions between the multi-field problem, such as diffusion, temperature, phase change structure and stress–strain fields during carburizing and quenching, were evaluated for the above two steel gear models by simulation. According to the results of the simulations, the distortion after quenching is more than about 10% larger than the simulation with phase change plasticity if it is not taken into account. The maximum distortion after carburizing is only 100–160 μm for gears with an outside diameter of 100–300 mm or less [17,18,19]. It can also be seen from the residual stress simulation results that when the effect of phase change plasticity is taken into account, the simulated results for residual stresses are much smaller. This is more in line with the results of a large number of gear residual stress evaluations [13,15,20]. Thus, we can conclude the following:
  • Transformation plasticity reflects an important distortion behavior of alloy steel materials during the carburizing and quenching heat treatment process. To reveal the densification behavior and material properties of transformation plasticity, the method proposed in this paper for the precise measurement of distortion behavior under rapid cooling is a very effective and practical experimental technique.
  • The behavior of transformation plasticity is essential to predict component distortion and residual stresses after carburizing and quenching and to improve the accuracy of heat treatment simulations.

Author Contributions

Conceptualization, D.J. and Y.C.; Methodology, D.J. and X.L.; Software, X.L.; Validation, X.L. and D.J.; Formal analysis, D.J., X.L., F.H. and H.L.; Investigation, D.J. and X.L.; Data curation, D.J., J.C., S.W. and X.L.; Writing, D.J. and X.L.; Review and editing, D.J. and J.C.; Visualization D.J.; Supervision, D.J.; Project management, D.J. and Y.C.; Funding acquisition, D.J. All authors have read and agreed to the published version of the manuscript.

Funding

This research was funded by National Key R&D Program of China (2018YEE0207000).

Institutional Review Board Statement

Not applicable.

Informed Consent Statement

Not applicable.

Data Availability Statement

The data presented in this study are available on request from the corresponding author.

Conflicts of Interest

The authors declare no conflict of interest.

References

  1. Tobie, T.; Hippenstiel, F.; Mohrbacher, H. Optimizing gear performance by alloy modification of carburizing steels. Metals 2017, 7, 415. [Google Scholar] [CrossRef] [Green Version]
  2. Mohrbacher, H. Efficiency Gains in Powertrain Components by Molybdenum-Alloyed Special Steels. Adv. Mater. Sci. Environ. Energy Technol. V Ceram. Trans. 2016, 260, 53–65. [Google Scholar]
  3. Wang, W.; Liu, H.; Zhu, C.; Du, X.; Tang, J. Effect of the residual stress on contact fatigue of a wind turbine carburized gear with multiaxial fatigue criteria. Int. J. Mech. Sci. 2019, 151, 263–273. [Google Scholar] [CrossRef]
  4. Ju, D.Y. Computer Prediction of Residual Stresses and Distortion in Carburizing—Quenching of Gear. In Proceedings of the 6th International Conference on Residual Stresses, Oxford, UK, 10–12 July 2000; IOM Communications: London, UK; Volume 1, pp. 550–556. [Google Scholar]
  5. Ju, D.Y.; Yousuke, I.T.O. Simulation and Verification of Residual Stresses and Distortion in Carburizing-quenching Process of a Gear Shaft. In Proceedings of the 4th International Conference on Quenching and Control of Distortion, Beijing, China, 23–25 November 2003; pp. 291–296. [Google Scholar]
  6. Inoue, T.; Wang, Z. Coupling between stress, temperature, and metallic structures during processes involving phase transfor-mations. Mater. Sci. Technol. 1985, 1, 845–850. [Google Scholar] [CrossRef]
  7. Denis, S.; Gautier, E.; Simon, A.; Beck, G. Stress--phase-transformation interactions--basic principles, modelling, and calculation of internal stresses. Mater. Sci. Technol. 1985, 1, 805–814. [Google Scholar] [CrossRef]
  8. Sjöström, S. Interactions and constitutive models for calculating quench stresses in steel. Mater. Sci. Technol. 1985, 1, 823–829. [Google Scholar] [CrossRef]
  9. Ju, D.; Sahashi, M.; Omori, T.; Inoue, T. Simulation of quenching-tempering process based on metallo-thermo-mechanical. Zairyo (J. Soc. Mater. Sci. Jpn.) 1996, 45, 643–649. [Google Scholar] [CrossRef]
  10. Liu, C.C.; Ju, D.Y.; Inoue, T. A numerical modeling of metallo-thermo-mechanical behavior in both carburized and carbonitrided quenching processes. ISIJ Int. 2002, 42, 1125–1134. [Google Scholar] [CrossRef] [Green Version]
  11. Inoue, T.; Wakamatsu, H. Unified theory of transformation plasticity and the effect on quenching simulation. Strojarstvo 2011, 53, 11–18. [Google Scholar]
  12. Inoue, T. Mechanism of transformation plasticity and the unified constitutive equation for transformation-thermo-mechanical plasticity with some applications. Int. J. Microstruct. Mater. Prop. 2010, 5, 319–327. [Google Scholar] [CrossRef]
  13. Inoue, T. Mechanics and characteristics of transformation plasticity and metallo-thermo-mechanical process simulation. Procedia Eng. 2011, 10, 3793–3798. [Google Scholar] [CrossRef] [Green Version]
  14. Ju, D.Y.; Mukai, R.; Sakamaki, T. Development and application of computer simulation code COSMAP on induction heat treatment process. Int. Heat Treat. Surf. Eng. 2011, 5, 65–68. [Google Scholar] [CrossRef]
  15. Deng, X.; Ju, D.Y. Modeling and simulation of quenching and tempering process in steels. Phys. Procedia 2013, 50, 368–374. [Google Scholar] [CrossRef] [Green Version]
  16. Ju, D.Y.; Sahashi, M.; Omori, T.; Inoue, T. Residual stresses and distortion of a ring in quenching-tempering process based on metallo-thermo-mechanics. In Proceedings of the International Conference on Quenching and the Control of Distortion, Cleveland, OH, USA, 4–7 November 1996. [Google Scholar]
  17. Rohde, J.; Jeppsson, A. Literature review of heat treatment simulations with respect to phase transformation, residual stresses and distortion. Scand. J. Metall. 2000, 29, 47–62. [Google Scholar] [CrossRef]
  18. Mukai, R.; Ju, D.Y. Simulation of carburizing-quenching of a gear-Effect of carbon content on residual stresses and distortion. J. Phys. IV Fr. 2004, 120, 489–497. [Google Scholar] [CrossRef]
  19. Kanamori, H.; Ju, D.Y. Identification of heat transfer coefficients and simulation of quenching distortions on disk probe. Mater. Trans. 2020, 61, 884–892. [Google Scholar] [CrossRef]
  20. Saunders, N.; Guo, U.K.Z.; Li, X.; Miodownik, A.P.; Schillé, J.-P. Using JMatPro to model materials properties and behavior. JOM 2003, 55, 60–65. [Google Scholar] [CrossRef]
Figure 1. Metallo-thermal-mechanical theory in heat treatment processes.
Coatings 11 01224 g001
Figure 2. Laboratory equipment. (a) Equipment appearance; (b) dimensional measuring instruments.
Coatings 11 01224 g002
Figure 3. Inner construction of an electric furnace and tensile sample. (a) Inner construction of an electric furnace; (b) tensile sample.
Coatings 11 01224 g003
Figure 4. Relationship of stress-phase transformation plastic strain.
Coatings 11 01224 g004
Figure 5. CCT curves and cooling curves of 20CrMnTiH steel. (a) CCT curves of 20CrMnTiH steel; (b) cooling curves of 20CrMnTiH steel when martensitic and bainitic transformations can be obtained.
Coatings 11 01224 g005
Figure 6. Temperature–strain diagrams of the 20CrMnTiH steel. (a) Temperature–strain diagram of the bainitic phase; (b) temperature–strain diagram of the martensitic phase.
Coatings 11 01224 g006
Figure 7. CCT curves and cooling curves of 20MnCr5 steel. (a) CCT curves of 20CrMnTiH steel; (b) cooling curves of 20MnCr5 steel when martensitic and bainitic transformations can be obtained.
Coatings 11 01224 g007
Figure 8. Temperature–strain diagrams of the 20CrMnTiH steel. (a) Temperature–strain diagram of the bainitic phase; (b) temperature–strain diagram of the martensitic phase.
Coatings 11 01224 g008
Figure 9. Geometric model and process conditions. (a) Finite element model; (b) carburizing and quenching process conditions.
Coatings 11 01224 g009
Figure 10. Heat transfer boundary condition and heat transfer coefficients. (a) Boundary surface (The green color is the upper end face, and the yellow color is the lower end face). (b) Heat transfer coefficients [18].
Coatings 11 01224 g010
Figure 11. Distortion results of 20CrMnTiH steel gears after carburizing and quenching. (a) The 3D distortion results with considered transformation plasticity; (b) the 3D distortion results without transformation plasticity; (c) distortion results at the gear knuckle after carburizing and quenching.
Coatings 11 01224 g011
Figure 12. Distortion results of 20MnCr5 steel gears after carburizing and quenching. (a) The 3D distortion results with considered transformation plasticity; (b) the 3D distortion results without transformation plasticity; (c) distortion results at the gear knuckle after carburizing and quenching.
Coatings 11 01224 g012
Figure 13. Equivalent residual stress results for 20CrMnTiH steel gears: (a) with transformation plasticity; (b) without transformation plasticity; (c) equivalent residual stress depending on temperature.
Coatings 11 01224 g013
Figure 14. Equivalent residual stress results for 20MnCr5 steel gears: (a) with transformation plasticity; (b) without transformation plasticity; (c) equivalent residual stress depending on temperature.
Coatings 11 01224 g014
Table 1. Chemical composition of 20CrMnTiH steel (wt.%).
CompositionsCSiMnCrTiPSFe
Content0.20.21.11.150.070.020.02Bal.
Table 2. Chemical composition of 20MnCr5 steel (wt.%).
CompositionsCSiMnCrPSFe
Content0.20.21.11.150.020.02Bal.
Publisher’s Note: MDPI stays neutral with regard to jurisdictional claims in published maps and institutional affiliations.

