Article

On the Effects of High and Ultra-High Rotational Speeds on the Strength, Corrosion Resistance, and Microstructure during Friction Stir Welding of Al 6061-T6 and 316L SS Alloys

Jiangsu Provincial Key Laboratory of Advanced Welding Technology, Jiangsu University of Science and Technology, Zhenjiang 212000, China
*
Author to whom correspondence should be addressed.
Submission received: 10 November 2021 / Revised: 2 December 2021 / Accepted: 14 December 2021 / Published: 17 December 2021
(This article belongs to the Special Issue Corrosion and Degradation of Materials)

Abstract

:
In this study, under the conditions of using tools at a high rotational speed (HRS) of 10,000 rpm and an ultra-high rotational speed (ultra-HRS) of 18,000 rpm, the produced welding heat input was utilized to weld two specimens of Al alloy 6061-T6 with 1.0 mm thickness and 316L SS with 0.8 mm thickness. The microstructural characteristics, mechanical properties, and electrochemical corrosion properties of the aluminum alloy–steel joints were analyzed. The higher tool offset forms an intermetallic compound layer of less than 1 µm at the Fe-Al interface on the advancing side (AS) at different speeds. This results in a mixed zone structure. The lower tool offset forms intermetallic compounds of only 2 µm. The formation of a composite material based on aluminum alloy in the weld nugget zone improves the hardness value. The intermetallic compounds are Fe3Al and FeAl3, respectively. It was observed that the formation of intermetallic compounds is solely related to the rotational speed, and the iron-rich intermetallic compounds produced under ultra-HRS parameters have higher corrosion resistance. When the tool offset is 0.55 mm, using the HRS parameters, the tensile strength is 220.8 MPa (about 75.9% of that of the base metal).

1. Introduction

To move beyond the “carbon peak”, as recently proposed by the Chinese government, there has been an increased demand to meet the lightweight requirements of the automobile, rail transit, and shipbuilding industries. These industries widely use certain thin-plate materials. However, to achieve the minimized weight of material structures, the thinner sheets made of the same material fail to meet the strength requirements. Therefore, finding an economical and dependable method of connecting dissimilar materials is of the utmost importance [1,2,3].
A better lightweight alternative is the use of Al alloy with stainless steel [4] connections. The highly economical, lightweight 6××× series Al alloy, offering superior corrosion resistance, has often been used in various applications [5,6,7]. Austenitic SS is widely utilized for aircraft parts, ship parts, and auto parts due to its excellent corrosion resistance and sound weldability. The welding heat input leads to the mutual diffusion of aluminum and iron to form intermetallic compounds (IMC). At the welding interface, Al and Fe form a high-quality connection, mainly through the formation of micron-sized and uniformly distributed IMC [8,9]. As 6061-T6 Al alloy has small amounts of Si, the thickness of the IMC can be slightly reduced, thereby improving the microstructure and properties of the welding joint [10]. Therefore, the combination of the above two materials has attracted widespread attention in various application fields [11,12,13,14,15], such as the new energy vehicle frames, the connection of tailor-welded blanks, sealing covers, and other thin-walled structures.
There is still a crucial question to be answered about how to choose the connection method between SS and Al alloy. In the traditional fusion welding method, the higher heat input produces a thicker IMC layer. This may lead to crack propagation and reduce the mechanical properties of the joint. In comparison, friction stir welding (FSW) has numerous advantages. Primarily, the low welding-heat input will reduce sheet deformation. Furthermore, it does not produce welding defects caused by the molten state, such as pores, burn-through, cold cracks, and hydrogen embrittlement. Additionally, the thickness of the IMC layer generated at the Al-Fe interface can be precisely controlled [16]. As reported [11,17], some induction heating when using FSW technologies has achieved good results. Nevertheless, the safety risks have been heightened by adding auxiliary devices to increase the welding energy.
At present, the research on the friction stir welding of Al-Fe material only explores the use of medium and thick plates (thickness 1 mm). Ramachandran et al. [9] conducted experiments on the FSW of AA5052-H32 and hot-rolled HRSLA steel IRSM42–93 with 3 mm thickness under a rotational speed of 500 rpm, a welding speed of 50 mm/min, and a welding axial force of 7 KN. Scanning electron microscopy (SEM) was used to observe the distribution of IMC thickness produced by tapered cylindrical and straight cylindrical tools. It was observed that the IMC distribution at the Al-Fe interface of the cylindrical tool with a taper of 10° was the most uniform. In comparison to the straight cylindrical tool, the geometric shape of the tapered cylindrical tool is conducive to the generation of IMC at the bottom of the Al-Fe interface. X. Liu et al. [8,18] welded 6061-T6 aluminum alloy and phase transformation-induced plasticity (TRIP). It was found that the welding speed could not affect the type of IMC and that the tool’s rotational speed increased the strain rate of the materials. The material strain rate increased static dislocations, mobile dislocations, and cracks caused by grain boundary deformation. Therefore, compared with a conventional FSW (tool rotation speed < 2000 rpm), a higher rotation speed can improve the diffusion process and produce more IMC. In the connection of welding materials, the formation of an appropriate thickness of the IMC layer at the Al-Fe interface is important. However, F. C. Liu et al. [19,20] found that at higher rotational speeds, the formation of IMC is inhibited, and nano-scale amorphous phases can form.
Micro friction stir welding (µ-FSW) refers to FSW with a thickness of less than 1 mm. For thin plates, micro friction stir welding presents a feasible connection method between Al alloy and SS. Chen et al. [21,22,23] pointed out that high rotation-speed FSW can improve the degree of material mixing, with less material thinning, and can reduce the machine rigidity needed. The HRS-FSW (High rotation speed-FSW) is higher than 2000 rpm and lower than 15,000 rpm, which can realize μ-FSW connection. The FSW connection can be made with a lower axial force. This reduces the rigidity requirement of the machine, which is beneficial in the case of welding robot applications.
The high rotational speed of FSW is attracting an increasing amount of attention. Mohan et al. [24] combined µ-FSW with ultra-high rotational speed friction stir welding (ultra-HRS-FSW) to weld AA1100 with a thickness of 1.0 mm. The rotation speed of ultra-HRS-FSW ranges from 15,000 to 24,000 rpm. The welding speed could attain 1000 mm/min, which improves the welding efficiency. The existing literature about HRS-FSW of dissimilar material connections focuses only on the connection between similar materials and on dissimilar materials having comparable thermomechanical properties. For example, Zhang et al. [25] conducted µ-FSW to weld brass (H62) and copper (T2), both having a thickness of 0.6 mm, a rotational speed of 12,000 rpm, and a welding speed of 280 mm/min. A relatively high tensile strength of 194 MPa was achieved, which is approximately 82.6% that of copper (T2). It was concluded that the welding process parameters have a greater effect on the quality of welding in thin plates than tool geometry. Park et al. [26] conducted tests with µ-FSW of AA6061-T6 and AA5052-H32 plates with a thickness of 1 mm, under a rotation speed of 9000 rpm and a welding speed of 300 mm/min, to reach the highest tensile strength of 226.63 MPa. It can be concluded that the welding heat input is lower at a higher speed. Additionally, using a backing plate with higher thermal conductivity has a serious impact on the material connection. However, the connection problem of dissimilar sheet materials is still unresolved. Based on the current studies, it can be concluded that high rotational speed is beneficial to µ-FSW’s connections that include similar or different materials having comparable thermomechanical properties. However, for the µ-FSW of Al-Fe, the physical and mechanical properties of aluminum alloy and steel are extremely different, the binding mechanism is completely different from that of different materials with the same thermodynamic properties. In addition to the effect of rotational speed on the welding parameters, previous studies have not reported any specifics on the effect of tool offset on joint characteristics.
In the abovementioned studies, Al-Fe welding has been studied mainly in terms of medium-thick plates. Thin plates were studied mainly in terms of welding dissimilar materials or of similar materials having comparable thermomechanical properties. There are no relevant studies on Al-Fe µ-FSW, using an ideal lightweight material. In addition to the rotation speed, which is an important welding parameter of µ-FSW in the joint, the offset of the tool has a considerable influence on material fluidity and the mechanical properties of the joint. Therefore, this paper aims to investigate the feasibility of different process parameters for Al-Fe plates under HRS and super-HRS-FSW, to summarize the advantages and disadvantages of microstructures and mechanical properties, and to analyze the formation of IMC to gain insight into the intrinsic mechanism.

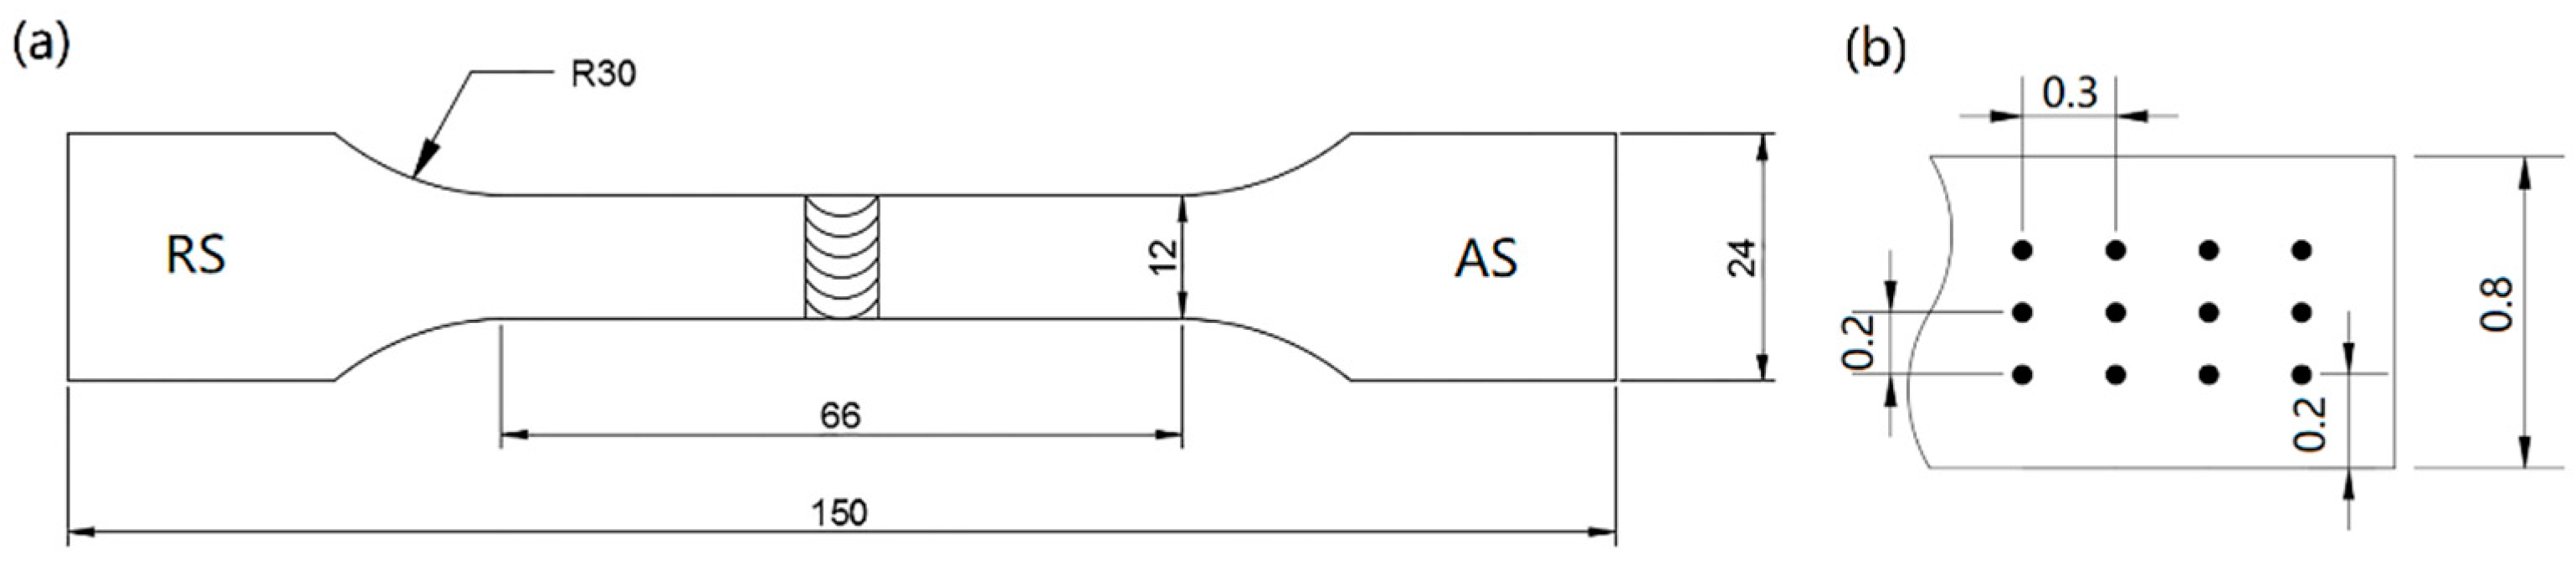
2. Materials and Methods

Figure 1a illustrates a schematic diagram of the welding experiment, and X is the tool offset in Figure 1b. As a result of the differences in physical properties between Al and Fe alloys, the Al alloy is placed on the retreating side (RS) to allow its strong plasticity to form a satisfactory weld [8]. In this study, a 1.0 mm-thick 6061-T6 Al alloy and a 0.8 mm-thick 316L SS were used. Table 1 shows the chemical composition of the metal as given in the material certificate provided by the supplier.
In Figure 1a, the circle drawn using dashed lines represents the tool of the FSW. As some of the tools will be immersed in steel and subjected to severe thermal friction conditions, high-temperature resistance and high-strength materials are required. In this study, tungsten rhenium alloy [27] was chosen for the tool, which has good high-temperature strength and a certain degree of plasticity. The geometry of the tool was chosen based on the proposal by Ramachandran et al. [9] that when the inclination of the tapered cylindrical pin reaches 10°, it facilitates the formation of a homogeneous IMC layer at the Al-Fe interface. Consequently, this improves the weld quality. On the RS, the level of resistance to material flow depends on the width of the plastic-state material around the pin and the volume of material transferred per rotation. To avoid the formation of tunneling defects, a smaller-diameter pin was chosen to reduce the volume of transferred material [28]. Figure 2 shows a physical view of the mixing head, with the exact dimensions. Austenitic SS was used as the backing plate under the workpiece because, during the welding process between the thin plate and the backing plate, using a material with high thermal conductivity would remove more heat [22]. To ensure the control accuracy of axial displacement, drill holes were drilled in specific positions on the backing plate and plate being welded. The diameter of the hole was slightly larger than that of the thermocouple to avoid the problem of insufficient material flow caused by plate consumption. The thermal conductivity of 6061-T6 aluminum alloy is much higher than that of 316L SS. A K-type thermocouple was inserted in each location marked by a red circle in Figure 1a,b, to measure the highest weld temperature. The diameter of the top of the tool pin is about 2 mm because the highest temperature point of the weld is at the edge of the tool pin. Therefore, to measure the peak temperature during welding without damaging the thermocouple, the distance between the through-hole and the Al-Fe interface must be 3 mm. For each parameter, three temperature-measuring points were selected, and the measured temperature value was taken as the average. To measure the magnitude of the axial force during the welding process, six JHBM-H3 force gauges (LYOYS, Bengbu, China) were mounted underneath the pad. The FSW welding equipment used in this study is a new type of lightweight FSW equipment developed by the research team for sheet metal welding. Its three axes can move with an accuracy of 0.01 mm, and the rotation speed ranges from 1000 to 24,000 rpm.
In this study, we mainly focus on the influence of HRS-FSW and ultra-HRS-FSW methods, taking into consideration the fact that the welding speed has a minimal effect on the composition of IMC [8], the welding heat input has a great deal of influence, but the welding heat input of FSW is a multi-factor coupling. According to Nandan et al. [29,30,31], the heat input formula for welding is as follows:
E = (   ω r ( δ μ p + ( 1 δ ) τ y ) d A ) / k v
E represents welding heat input, ω represents the spindle rotation speed, r represents the tool radius, δ represents the degree of slip, µ represents the coefficient of friction, p represents pressure, τy represents shear stress, k represents the constant, and v represents welding speed. Table 2 shows the optimal welding parameters as a result of a large number of welding tests. The deviation of the welding tool offset was within ± 0.05 mm, as a result of the error caused by the unevenness of the sheet’s cross-section. The weld with the median mechanical properties was selected for analysis after each parameter experiment was repeated thrice.
A Zeiss microscope (equipment model: Imager.A2 m, PRECISE, Beijing, China) was used to observe the microstructure of the cross-section. The scanning electron microscope (QUANTA 250FEG, Thermo Fisher Scientific, Waltham Mass, MA, USA) was used to analyze the thickness and composition of the diffusion layer at the interface. The electrochemical corrosion analysis of the joint was conducted to analyze the impact of FSW on the corrosion resistance of the joint. The size of the working electrode of the heterogeneous Al-Fe-FSW material was 8 mm × 8 mm × 0.8 mm3. The counter electrode was a Pt sheet, and the reference electrode was a saturated calomel electrode. For the polarization curve parameters, the initial potential was set to −1 V, the end potential was set to 0 V, and the scanning speed was 0.333 mV/s. Figure 3a shows the specific shape and size of the tensile specimens, as per the Chinese national standard “GB/T 2651–2008/ISO 4136:2001”. All the tensile tests were conducted at a strain rate of 2 mm/min on the CMT5205 (Sinter, Jilin, China) tensile machine. As shown in Figure 3b, the hardness tests were carried out in 3 rows. A fully automatic hardness testing machine, KN30S (Sinter, Jilin, China), at an applied load of 400 g for 20 s, was used to observe the microhardness at the top, middle, and bottom in the direction of thickness across the joint. The spacing between the upper and lower rows was 0.20 mm, and the spacing between the points of each row was 0.30 mm.

3. Results and Discussion

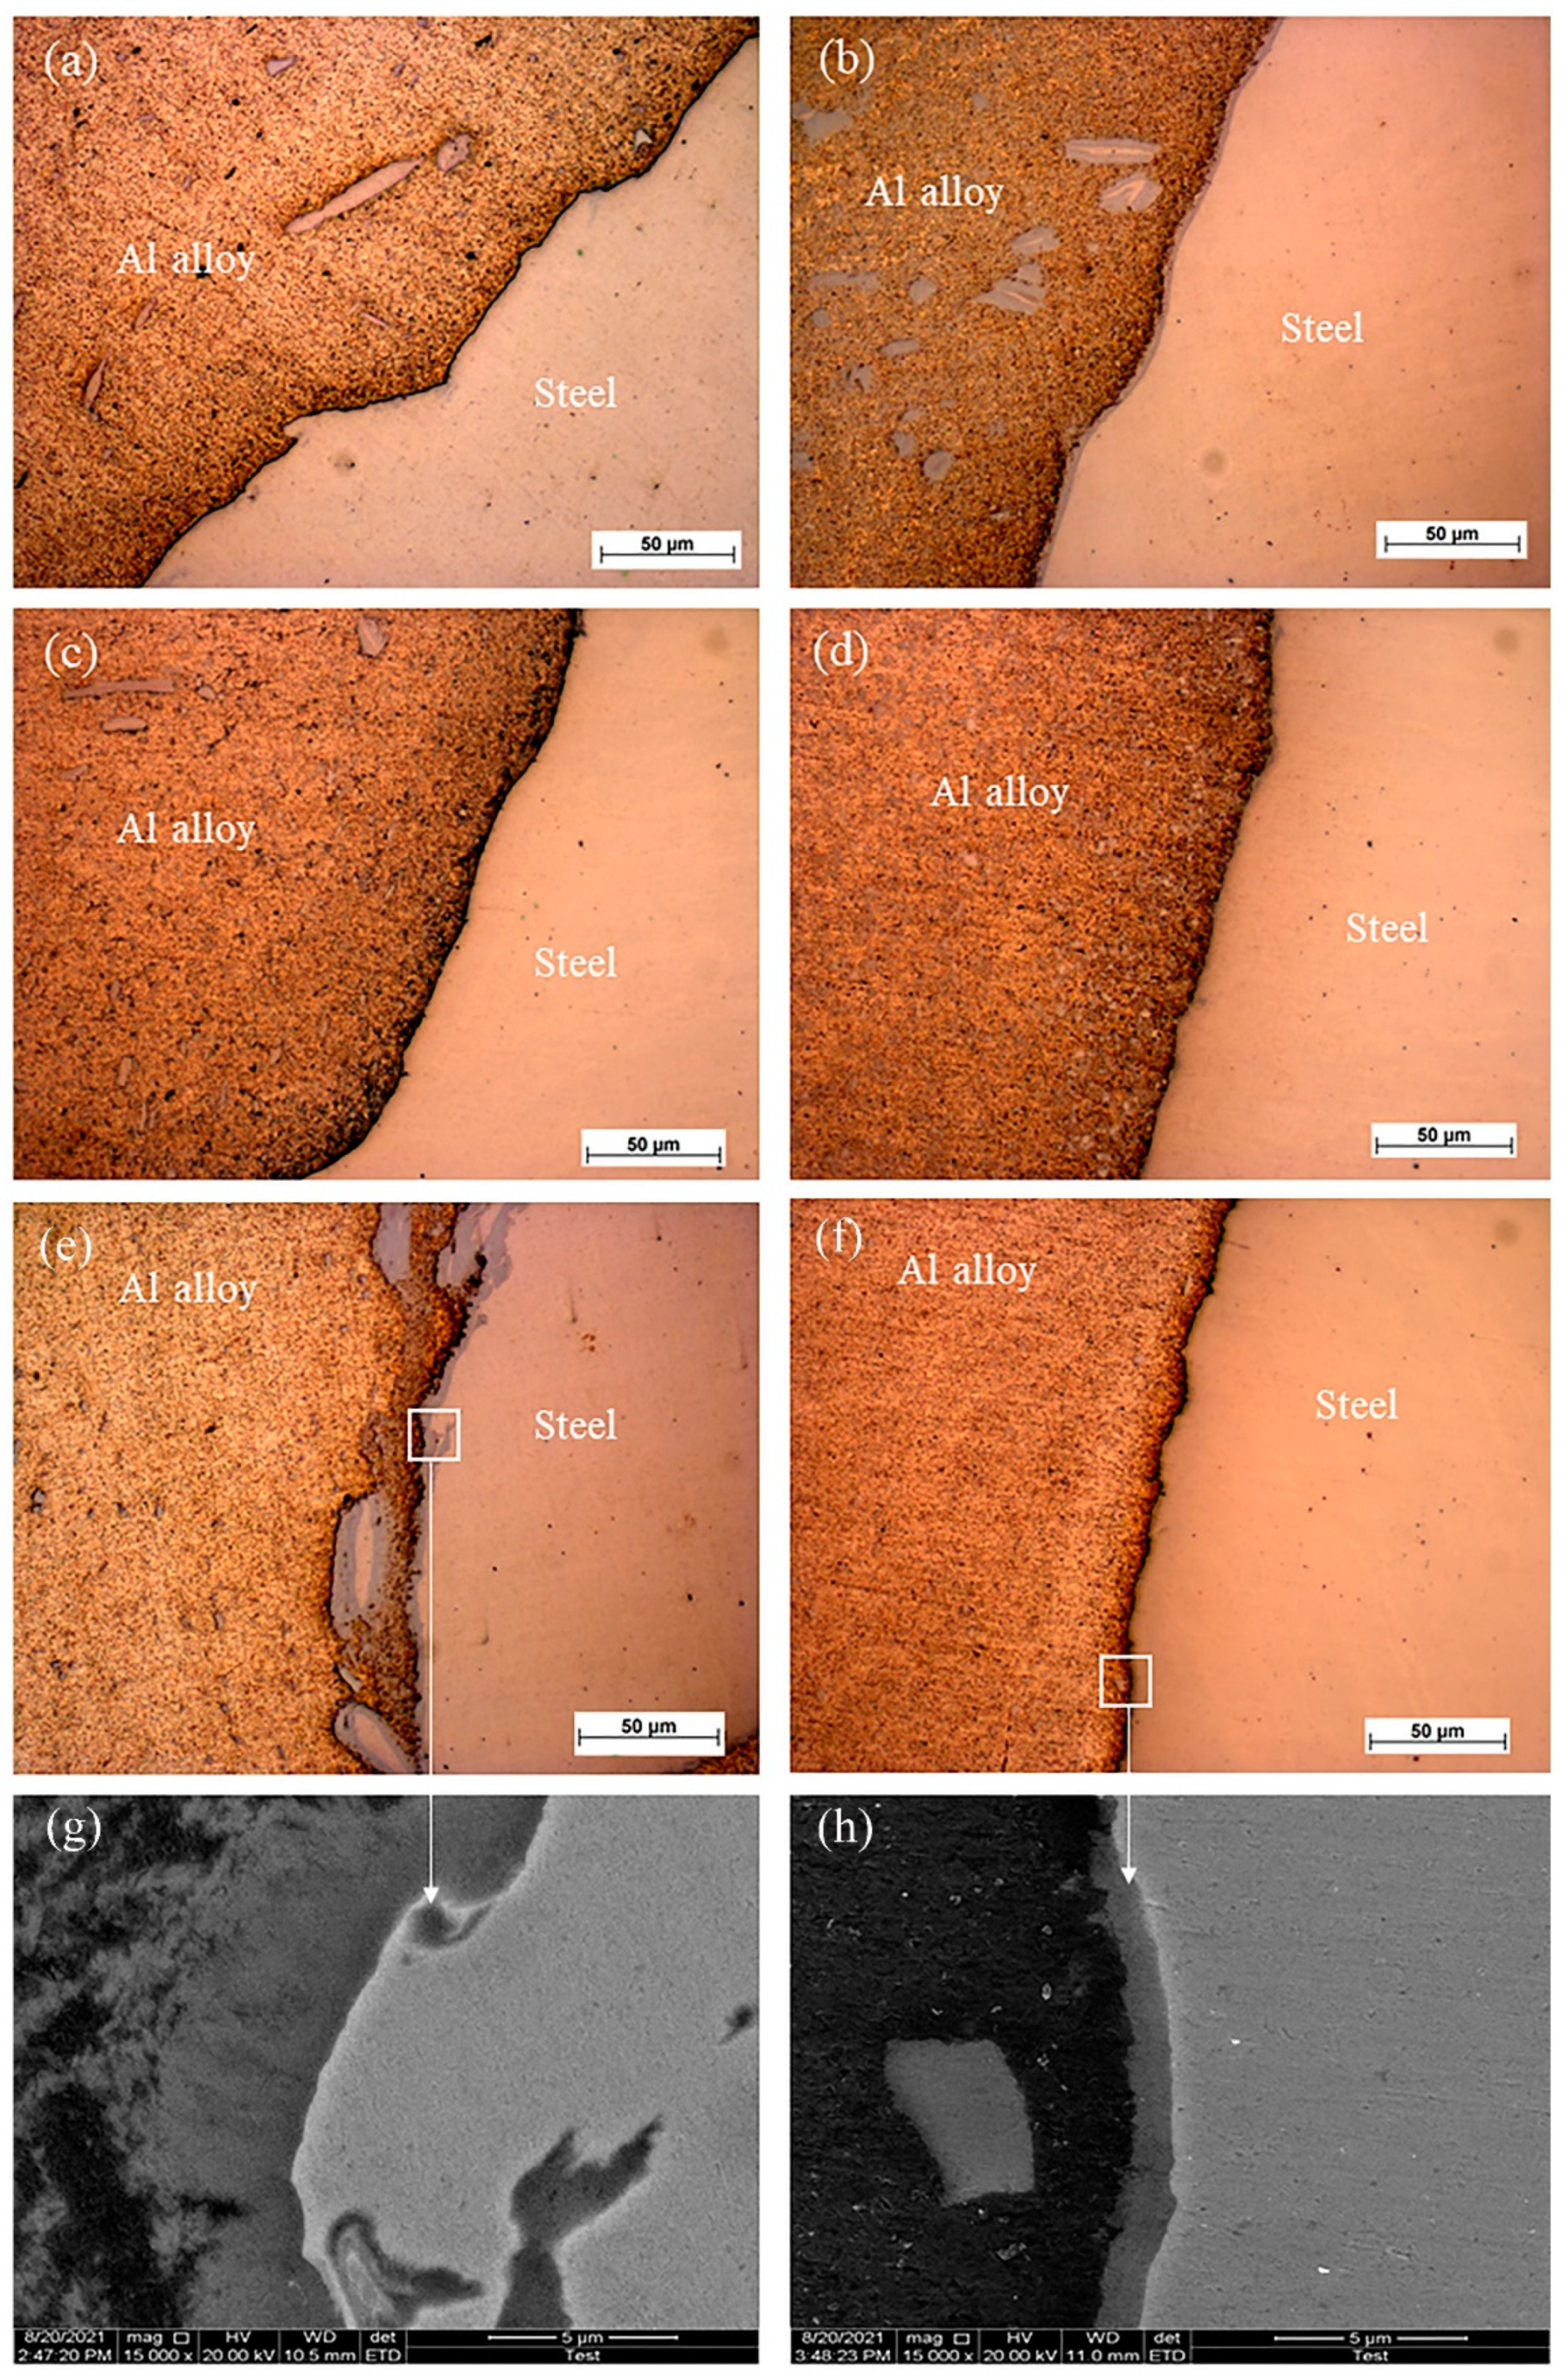
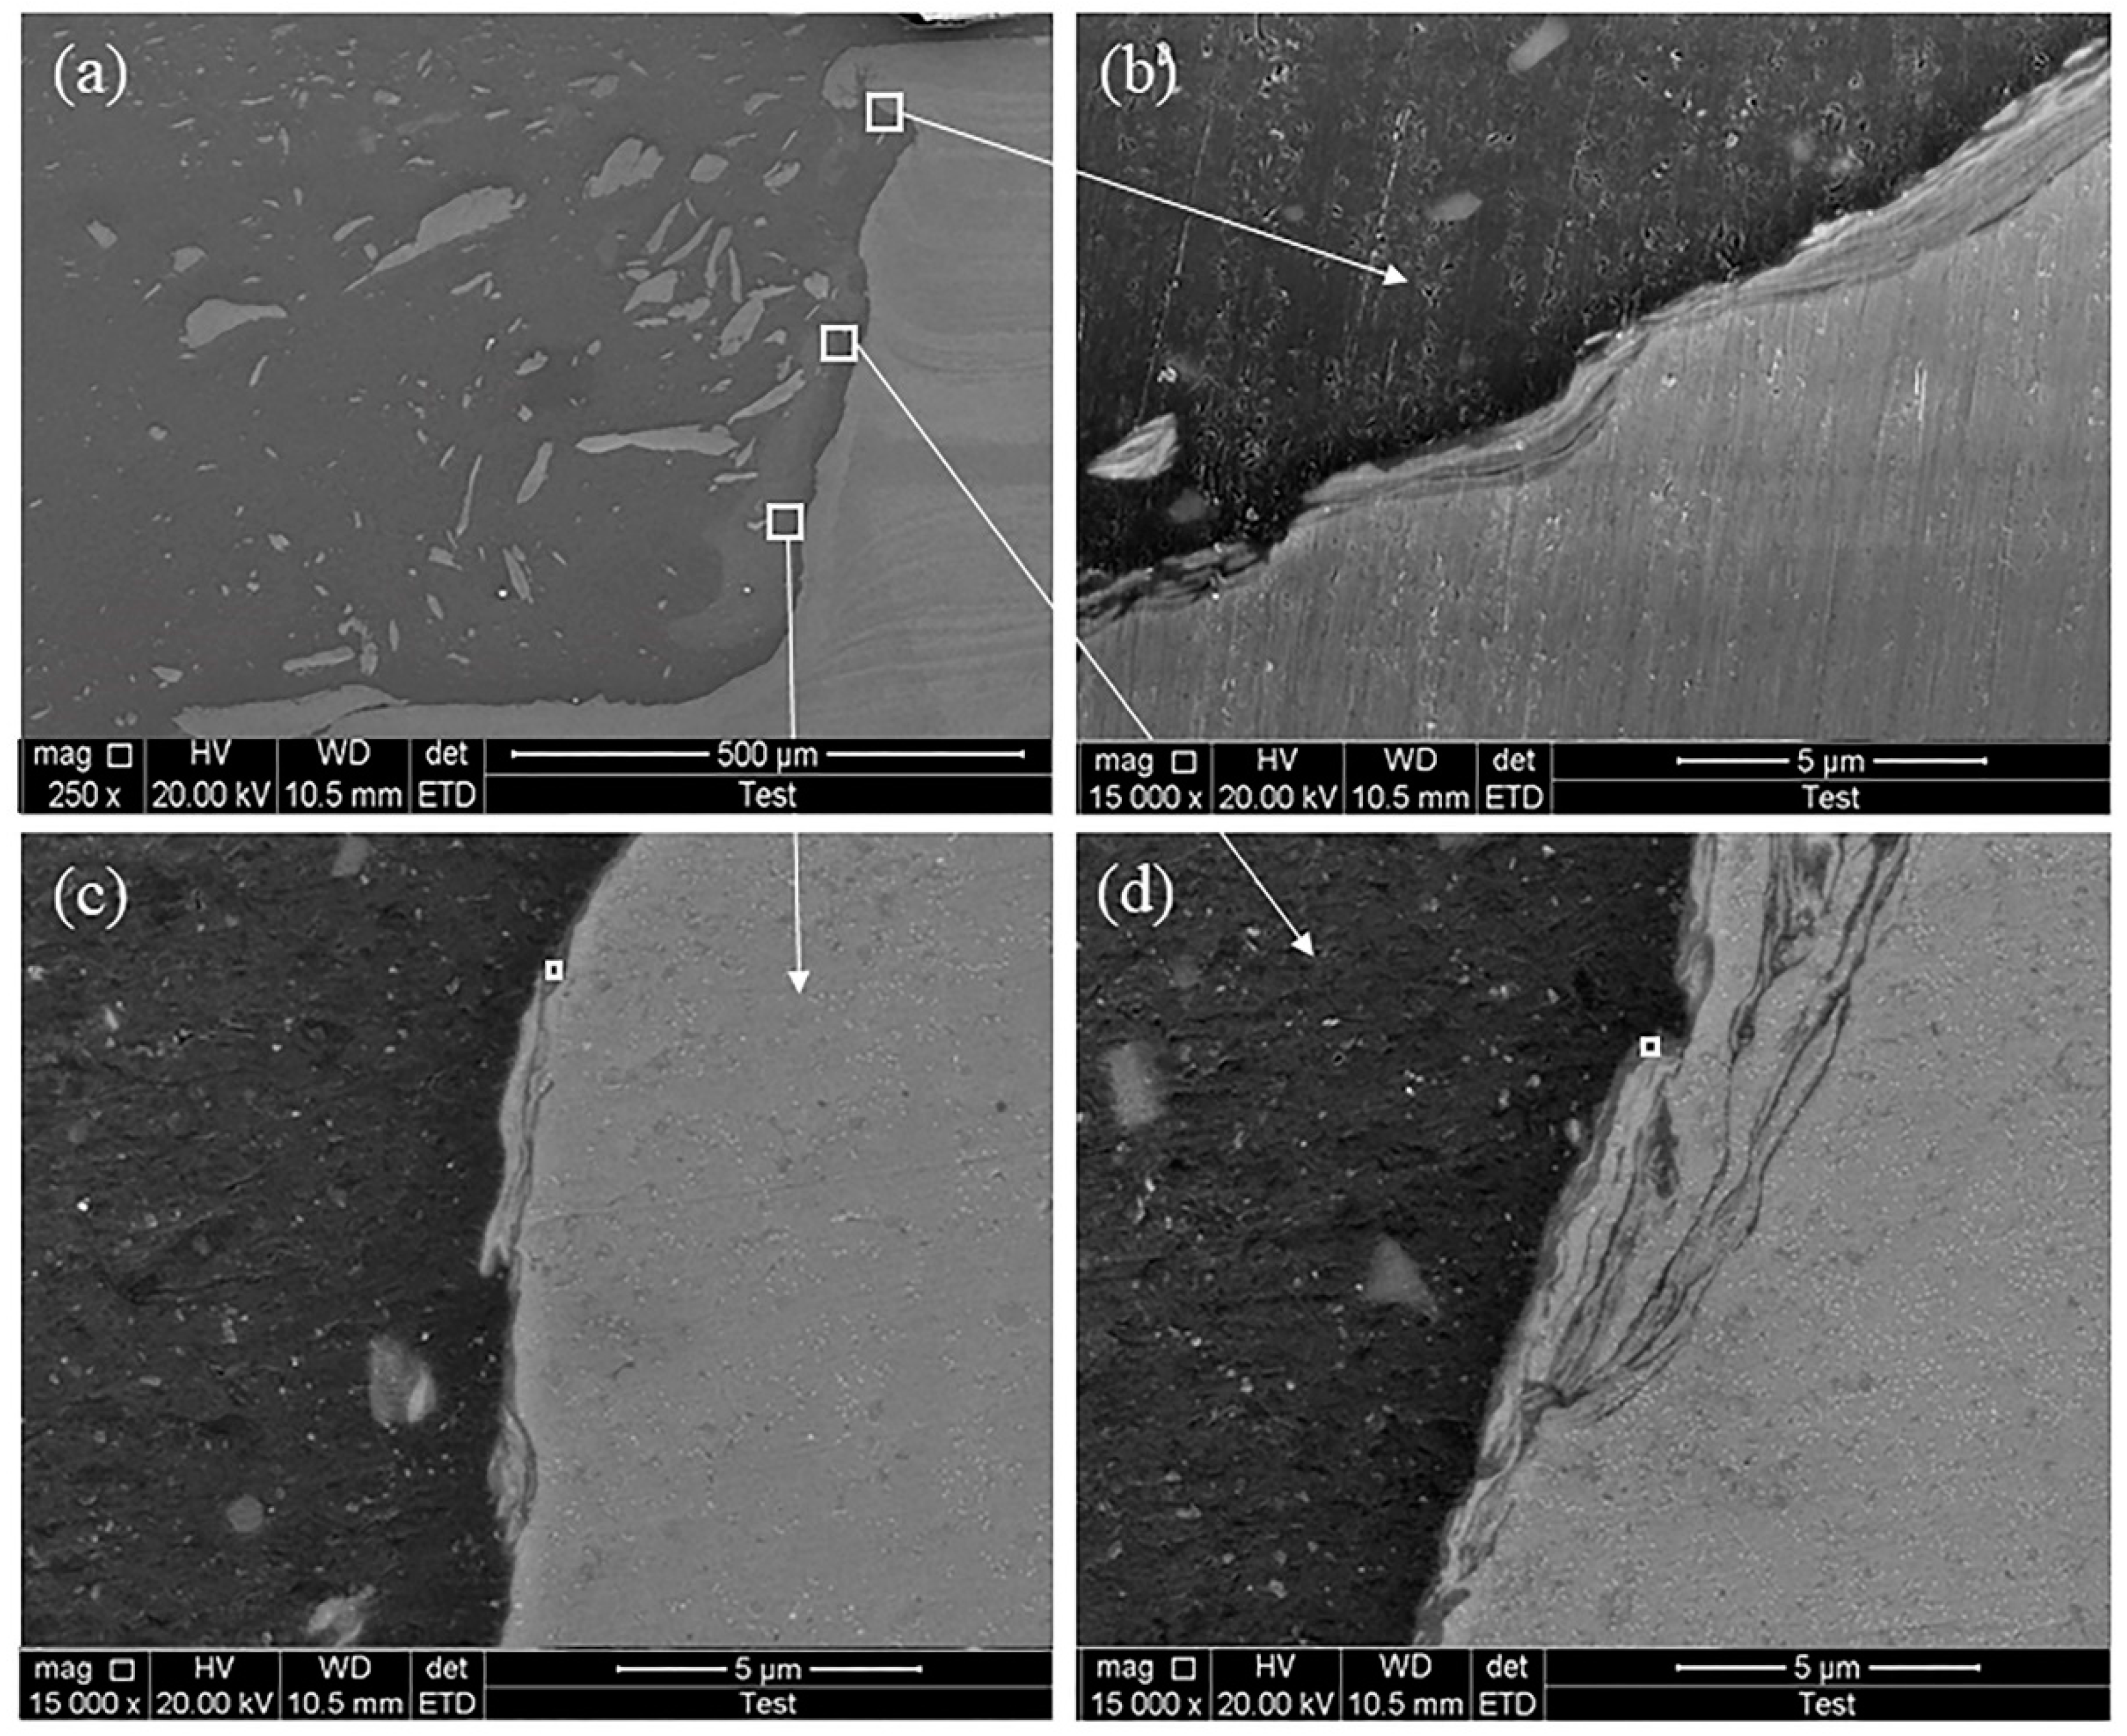
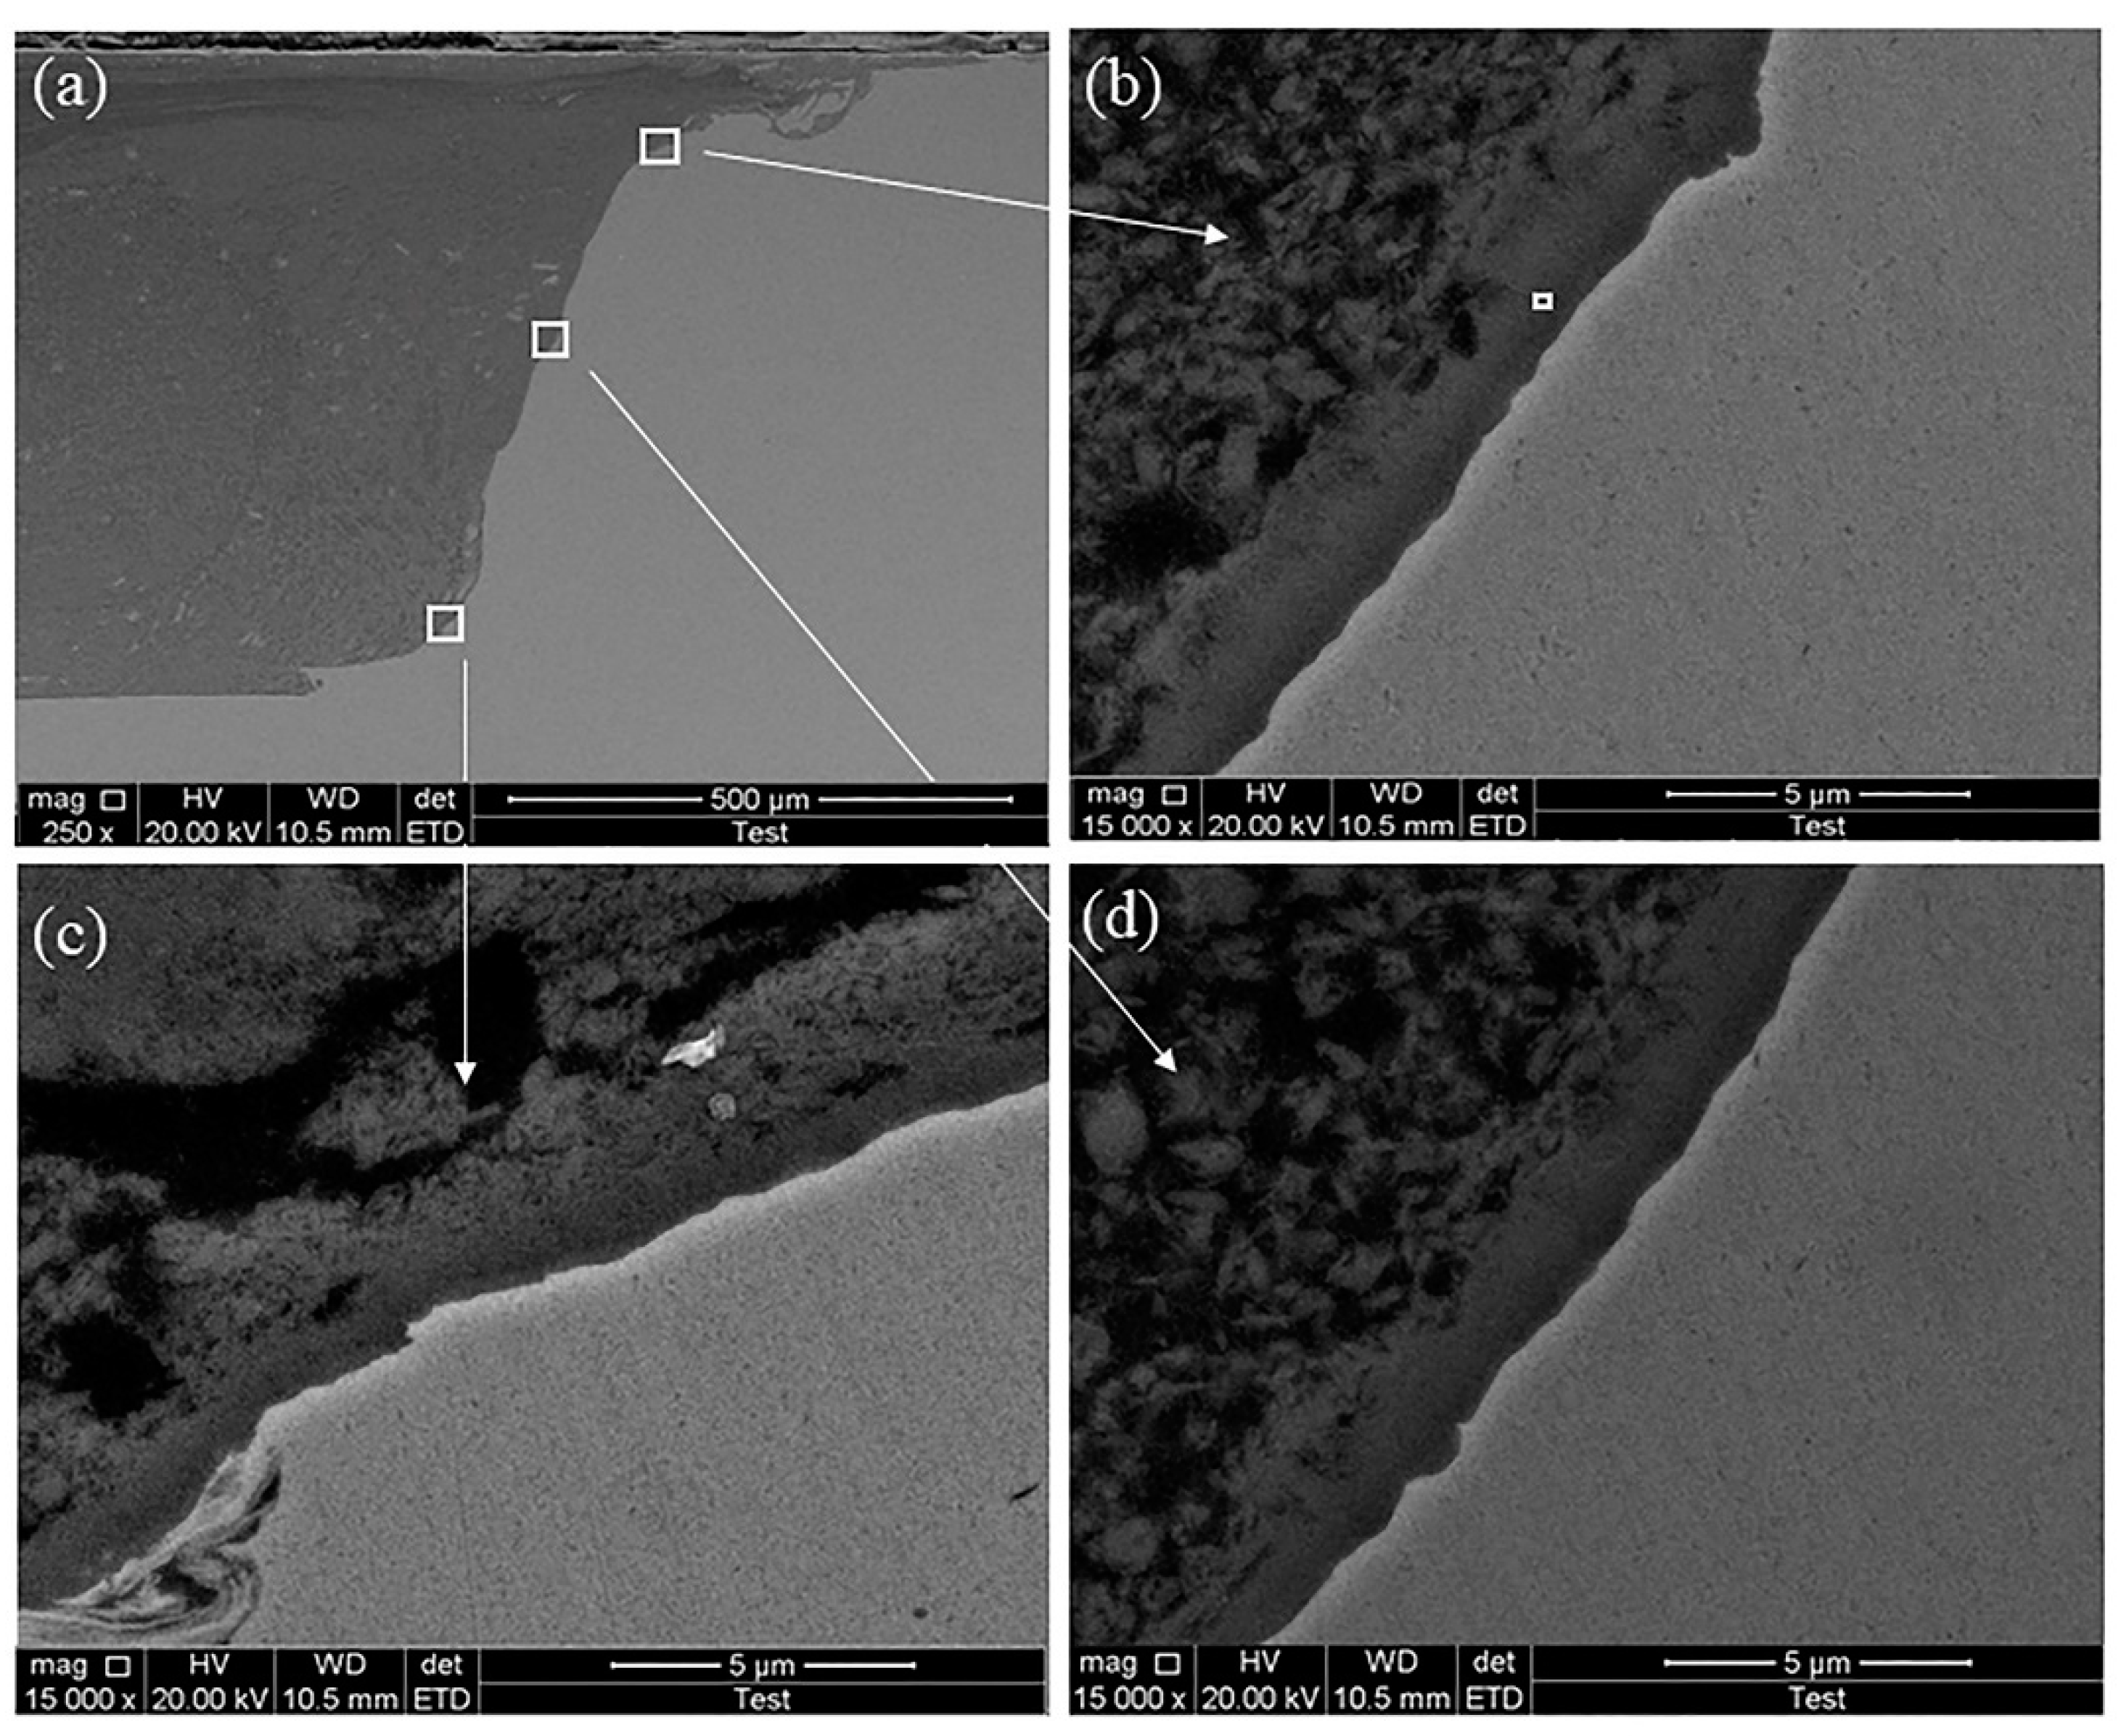
3.1. Microstructure and Interface Analysis of Joints

Figure 4 shows the metallography prepared by various tool offsets, using the FSW connection method of HRS and ultra-HRS, respectively. The length of the tool pin is slightly less than the thickness of the plate; the stainless steel on the AS was driven to the aluminum side by extrusion. At a low tool offset, the extruded stainless steel was taken to the RS, creating a channel-like shape. When the axial force was measured under different parameters, it was found that the maximum axial force of FSW welding at 0.8 mm thickness was not more than 2 KN, and the minimum axial force was not less than 0.8 KN with the increase in rotational speed, indicating that the material has reached a certain degree of plasticization.
As illustrated in Figure 4a,b, a flocculent gray structure or local steel particles were observed in the shoulder of the affected zone (SAZ). This occurs due to the shoulder stirring action during FSW. It does not appear in Figure 4c,d, mainly because the whole piece of SS metal that is stirred down is thrown outward at high speed to form a wall that prevents the flow of steel particles from the shaft shoulder.
Under the HRS parameters, the welding speed was slow, and the axial force was large. Consequently, the heat generation increased, and the middle part of the SS welding interface changed to a plastic state. Therefore, the local aluminum alloy was brought to the SS side and, at the Al-Fe interface, a 25° inclination angle was formed. However, under the ultra-HRS parameters, the inclination angle of the Al-Fe interface was reduced to 13°, and at the Al-Fe interface, part of the SS flowed to the aluminum alloy. This is shown in the red-circled areas of Figure 4c,d. The plastic material in the affected area of the shoulder tended to squeeze up at the tool pin because of the inclination angle of the tool shoulder. According to the Bernoulli effect, when rotation speed and welding speed increase, the linear speed of the material in the interface area reaches 306.7 mm/s, resulting in a drop in the interface pressure. The SS on the upper surface of the weld was in a plastic state under the higher rotation speed, and the plastic SS was pressed to the aluminum side. Conversely, as the welding speed increased, the welding heat input and the centrifugal force on the plate reduced, enabling the Bernoulli effect to occupy a dominant position and the inclination angle to decrease.
Figure 5 shows enlarged maps of the Al-Fe interface, corresponding to the boxes marked with black rectangles in Figure 4, and Figure 5a–d shows details of the Al-Fe interface. The steel particles on the aluminum alloy side are smashed more finely with the increase of rotational speed. In Figure 5b,d, when a small offset on the Al side was used, it is clearly observed that some small areas with gray contrast were distributed uniformly in the nugget zone. This is consistent with the phenomenon reported by X. Liu et al. [8,32] In addition, it shows that the smaller the offset, the more diffuse the distribution. On the RS near the aluminum alloy, the light gray contrast area in Figure 5e is IMC, and the corresponding SEM diagram in Figure shows that the thickness of IMC is uneven and is higher than 7 μm in Figure 5g,h.
According to the Spot EDS analysis of Figure 6, Figure 7, Figure 8 and Figure 9, the compositions of spot 1 and spot 2 were consistent with those of 6061-T6 aluminum alloy and 316L aluminum alloy base metals. From Figure 6 and Figure 8, it can be seen that the Al-Fe interface could be divided into two layers, the middle layer, and the mixed layer. After analyzing point 4 and point 5, respectively, it is clear that point 4 is mainly composed of 316L SS, with a little aluminum alloy. It can be seen that point 5 is mainly composed of 6061-T6 aluminum alloy with a portion of iron. The occurrence of the mixed layer is significantly correlated with the large offset. The smaller mixed layer generated in SS is due to the smaller transverse extrusion pressure in comparison with a lesser offset. Lee et al. [33]. demonstrated that the interface produces an island-like mixing zone. In Figure 7 and Figure 9, at the aluminum iron interface, a more continuous interface is generated. On the steel side, a continuous and discontinuous region with small peaks is formed. This indicates that the diffusion between the atoms is dominated by iron atoms.

3.2. Thermal History and Formation of Diffusion Layer at the Al-Fe Interface

The key influencing factors that contribute to the formation of IMC in the welding of Al-Fe dissimilar metals are heat input and axial pressure [4,33]. Therefore, it is necessary to measure the temperature of the welding process. When using different offsets, there are slight temperature differences. Figure 10 shows the temperature measurement data for the HRS and ultra-HRS parameters. The highest temperatures measured by the HRS and ultra-HRS connection methods were 470 °C and 620 °C, respectively. The highest temperature was lower than 655 °C, the Al-Fe eutectic point. In the paper by Mahoney [34], it was found that the temperature difference along the direction of thickness was almost negligible. Since a thinner thickness was used in this experiment, the temperature can be considered to be the same in the direction of the thickness. The experimental temperature measurement point was close to the thermal mechanically affected zone on the RS. Therefore, in the welding process, the measured temperature at this point could be considered closest to the highest temperature.
The atomic diffusion was related to the average shear strain rate of the interface and the diffusion coefficient of the current temperature. The average shear strain rate is defined as the ratio of the shear velocity to the shear band thickness [19]. Under HRS and ultra-HRS parameters, the shear speeds in the middle of the tool pin are 151.3 mm/s and 267.7 mm/s, respectively. Figure 11 displays the schematic diagram of the shear band thickness under HRS and ultra-HRS parameters. Without taking into account the amount of energy released by the plastic deformation at the tip of the tool pin, the middle layer of the tool pin was chosen as the minimum shear band thickness. The shear band thickness is 0.116 mm and 0.022 mm, respectively. Therefore, the average shear strain rate was 1.3 × 10³ s−1 and 1.2 × 10⁴ s−1, respectively. The relationship between the diffusion coefficient D, the jump distance λ of the diffusion atom, and the jump frequency of the atom is D = λ^2 Γ/6. At 450 °C and 620 °C, according to the literature [35,36], the diffusion coefficients between Al and Fe are 3 × 10⁻¹⁵ m2/s and 6 × 10⁻¹⁴ m2/s, respectively, and the distance between Fe and Al atoms is 2 nm. The atomic jump frequencies of 1.35 × 10⁴ s−1 and 9 × 10⁴ s−1 were higher than the average shear strain rate, and the shear did not completely inhibit atomic diffusion. Consequently, an IMC interlayer was formed.
The average values of the EDS energy spectra are obtained from three points in the IMC layer of the interface diagram. Figure 6, Figure 7, Figure 8 and Figure 9 show the interface diagrams. Table 3 shows the chemical average mass composition (wt%) of the corresponding parameters. The mass fraction ratios of the chemical components of the corresponding parameters are 70.8%Al/29.2%Fe, 75.4%Al/24.6%Fe, 15.8%Al/84.2%Fe, and 17.4%Al/82.6%Fe. The corresponding IMC are FeAl3, FeAl3, Fe3Al, and Fe3Al, respectively. Yeremenko et al. [32] also obtained similar IMC components. It was found that under the HRS and ultra-HRS parameters, while the role of spindle rotation speed is dominant, the IMC type has little influence on welding temperature, welding heat input, welding speed, and tool offset. This is different from the impact of rotation speed and tool offset in the case of the IMC type described by Liu et al. [8]. The difference occurs because of the simultaneous diffusion and reaction. Atomic diffusion is inhibited by the high shear rate, and atomic diffusion makes atomic chemical reactions almost impossible. Thus, only the diffusion reaction occurs.
It was established that the thickness of the IMC layer was about 0.7 µm when the offset was 0.7 mm, while in comparison, the thickness of the IMC layer was about 2.0 µm when the offset was 0.55 mm. The tool offset was the main factor that determined the thickness of the IMC layer at the same rotating speed and welding speed. The thickness of the IMC layer in the upper, middle, and lower parts of the Al-Fe interface decreased gradually with a larger tool offset. The upper and lower IMC layers of the Al-Fe interface were larger with a smaller tool offset, whereas the middle IMC layer was smaller. The thickness of the lower IMC layer was higher, and the upper friction heat IMC thickness of the shoulder was also higher, resulting in a thinner IMC in the middle because the axial tip of the stirring needle absorbed the energy released by the deformation of the rotating plastic backlog steel on the forward side.

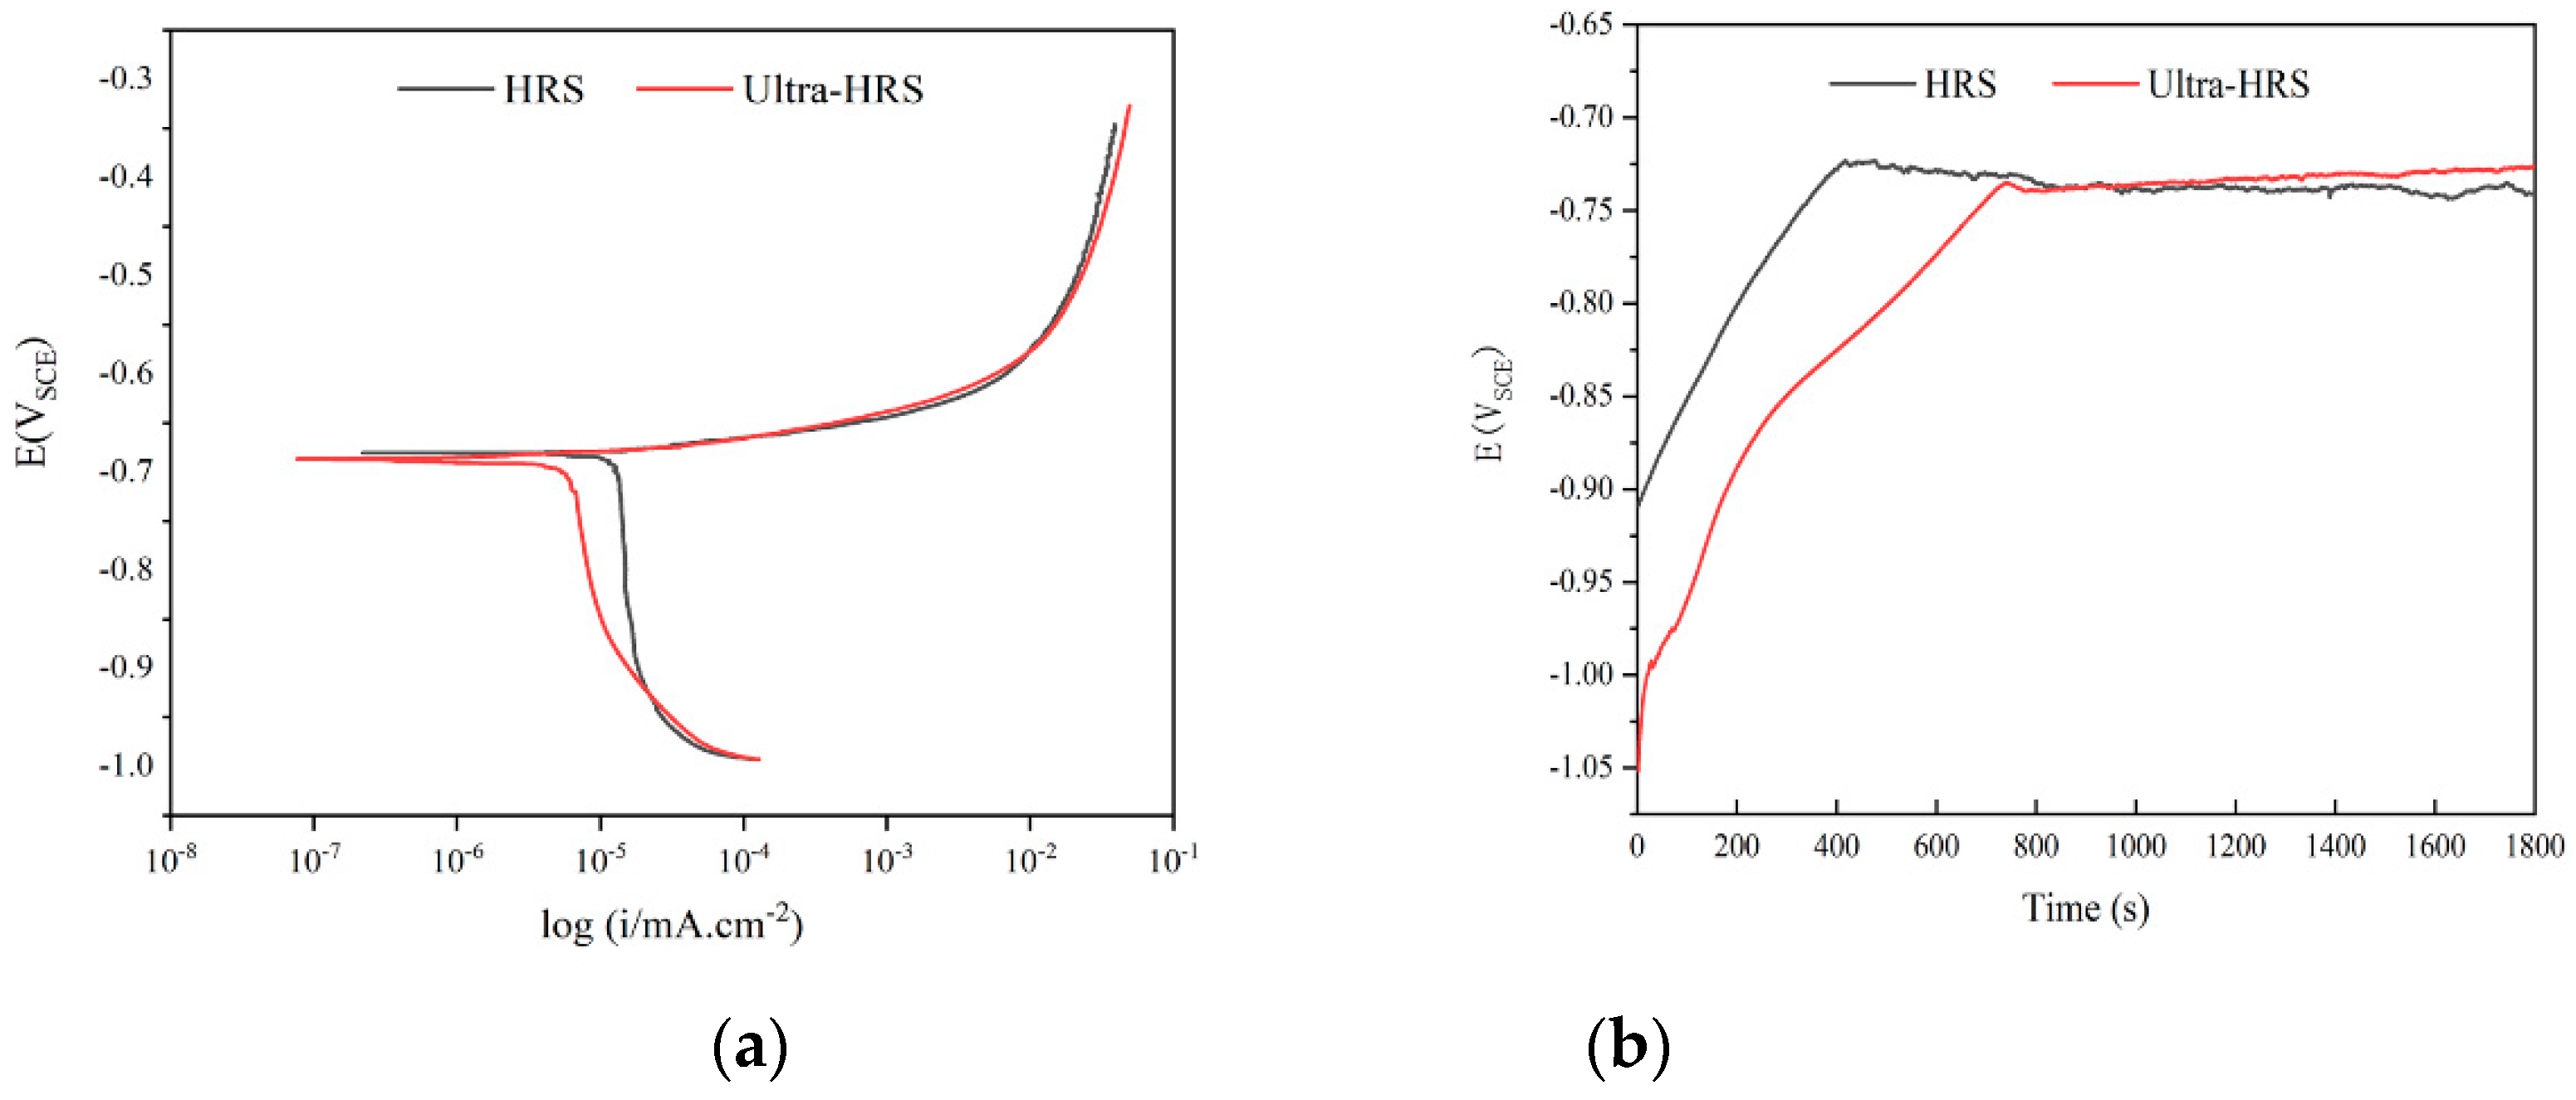
3.3. Electrochemical Test and Analysis

The Al-Fe alloy FSW joint showed more IMC with two parameters of HRS and ultra-HRS under a smaller tool offset. Figure 12a shows the time-dependent curve of an open-circuit potential (OCP) in a 3.5 wt% solution. From Figure 12a, it can be seen that with the increase in immersion time, the corrosion potential (Ecorr) of the two samples moved to a positive potential, indicating that the two materials spontaneously formed a passivation film [37]. At around 800 s, the Ecorr for the HRS sample reached a stable potential of −0.74 VSCE from about −0.91 VSCE to a higher potential. However, the Ecorr of the ultra-HRS sample remained stable at −0.73 VSCE at about 700 s. In comparison with the HRS sample, the ultra-HRS sample took less time to obtain the steady potential in a 3.5 wt% NaCl solution. The Ecorr value was corrected, indicating that the Ultra-HRS sample was more corrosion-resistant [38,39,40]. The IMC were the main factor affecting the corrosion resistance since the corrosion interface was composed of IMC from the SS matrix and the aluminum alloy matrix.
Figure 12b shows the polarization curve of the Al-Fe alloy welded with HRS and ultra-HRS in a 3.5 wt% solution. The two samples exhibit anodic dissolution characteristics, which are caused by the anodic dissolution of the aluminum alloy at the initial stage of immersion [41]. The corrosion potential (Ecorr) and corrosion current density (icorr) of HRS and Ultra-HRS samples are −0.68 V and −0.69 V, 2.18 × 10⁻⁵ A cm−2, and 9.50 × 10⁻⁶ A cm−2, respectively. As compared to the HRS sample, the corrosion current density of the ultra-HRS sample has a lower value, which indicates a reduced corrosion rate and, therefore, higher corrosion resistance. In the ultra-HRS sample, the IMC layer was rich in Fe3Al, while the HRS sample contained more FeAl3. The presence of Fe3Al improved the corrosion resistance of the alloy, which led to the improvement of the corrosion resistance of ultra-HRS samples [42]. This corrosion resistance is consistent with the results of Knibloe et al. [42,43], and the iron-rich phase has better corrosion resistance.

3.4. Microhardness Distribution of Joint Interface

The hardness of 6061-T6 aluminum alloy is 95 ± 5 HV, and the hardness of 316L is 170 ± 5 HV. As indicated in Figure 13, the hardness of aluminum alloy gradually decreases between the aluminum alloy matrix and the heat-affected zone(HAZ) of the RS. In Figure 13, there was a peak value of hardness on the RS of the weld due to the driving effect of the tool pin. The hardness between the HAZ and SS matrix decreased gradually. The width of the HAZ of the RS was larger than that of the ultra-HRS method, as shown in Figure 13, while the HAZ of the AS of the SS was nearly the same. The main reasons for this were that the friction area of the shoulder against the SS was small, and the thermal conductivity of SS was poor. Except in the nugget area, the hardness in the upper region was observed to be different from that of the middle and lower lines. From the center stir zone to the base material, there was a noticeable decrease in hardness on the Al side, which was substantially correlated with the significantly increased grain size, along with dislocation density [44]. Interestingly, the hardness on the upper surface had a relatively lower value, which may be attributed to the coarse grains that had grown due to the resulting overheating from the rotational shoulder. On the other hand, the hardness on the top layer always exhibited a slightly higher value than that of the middle and bottom layers, since the transformation of austenite into martensite is easily induced by the heat generated during FSW. This phenomenon was identified by Lee [33], and this conjecture RS was verified by the weld’s magnetic conductivity at the end of welding.
As shown in Figure 13b, the average hardness of the center stir zone was more than 110 HV. This phenomenon is caused by randomly distributed SS particles in the aluminum matrix, which are beneficial for the strengthening of aluminum alloy. The average hardness of the bottom region, which has the highest value, is mainly related to the finest grains, which are caused by a significant degree of dynamic recrystallization during FSW. The rotational tool drags the 316L SS from the AS to the RS [27]. Under the action of rotation, a bridge between the SS and aluminum alloy is formed at the bottom, with an average hardness of 210 HV. Some SS and IMC are pushed to the RS as a consequence of the existence of the bridge, and the hardness of the RS can reach 400 HV.

3.5. Tensile Strength Test

Figure 14 shows the stress-strain curve of the joint with the best mechanical properties after welding with HRS and ultra-HRS parameters, respectively. With a smaller tool offset, under HRS conditions, an optimum tensile strength of 220.8 MPa (about 75.9% of the base metal of aluminum alloy) was obtained. The tensile specimen broke the outer boundary of the SS involved in the HAZ on the aluminum alloy side. The decrease in strength in this area was due to the over-aging of precipitates in 6061 aluminum alloy during welding, resulting in a decrease in strength due to the growth of precipitates. Under this parameter, the hardness of the HAZ decreases, and its width increases, as shown in Figure 13b, which is consistent with the over-aging conjecture. However, from the enlarged area of Figure 5e, it is seen that the thickness of the SS IMC layer near the aluminum alloy side was not uniform. The lowest thickness was at least 7 µm, and the mechanical properties improved when the thickness of the IMC layer was uniformly distributed at about 2 µm, at the Al-Fe interface [9]. An excessively thick IMC layer would result in crack propagation [45]. As shown in Table 4, the thickness of the IMC layer at the Al-Fe interface was uniform, and the average thickness was about 2 µm. This differs from the findings of Ramachandran et al. [9], who formed a layer of intermetallic compounds with a uniform thickness of 15 µm on the best-welded joint. This may be due to the difference in the rotational speed of the spindle. The steel particles, a kind of Al-Fe intermetallic composites distributed in the stir zone, broke at the outer boundary of SS in the heat-affected zone of the aluminum alloy side.
Under the ultra-HRS parameters, the tensile strength of the joint with a large offset was 177.1 MPa (about 61% of that of the aluminum alloy base metal). The fracture was located between the bottom of the center stir zone and the Al-Fe interface of the joint. The IMC produced at the interface is Fe3Al, which is an iron-rich brittle compound. The strength of iron-rich compounds was higher, and their brittleness was lower than that of aluminum-rich compounds. Weld fracture was caused by three major factors: the effect of ultra-high rotational speed on the centrifugal force of welding materials, the thermal mechanically affected zone, and the upward flow of material caused by a small axial pressure. Consequently, holes were produced at the welding core, which is the source of fracture.

3.6. Fracture Analysis

Figure 15 shows the typical SEM fracture images of fractured tensile samples under the conditions of HRS with low offset and Ultra-HRS with high offset. Figure 15a shows a picture of the weld fracture with low offset under HRS parameters. The interface fracture occupied at the outside of the rolled-up SS in the nugget zone on the side of the partial aluminum alloy. The interface was mainly dimple and brittle cleavage fracture in Figure 15b.c, so it could be concluded that the fracture mode was dominated by the mixture of brittle and ductile. Figure 15d showed the picture of fracture under high offset under Ultra-HRS parameters. The interface fracture was at the Al-Fe interface, and the non-uniform IMC layer of the interface is the cause of brittle cleavage fracture. The fracture of this method was brittle fracture mechanism.

4. Conclusions

HRS and ultra-HRS welding methods were used to perform friction stir welding experiments on 0.8 mm thick 316L SS and 1 mm thick 6061-T6 aluminum alloy under approximate welding heat input conditions. The microstructure, mechanical properties, and electrochemical corrosion properties of the joints were analyzed. This study led to the following findings.
Under the HRS parameters, when the tool offset is 0.55 mm (about 75.9% of the base metal), a tensile strength of 220.8 MPa is obtained. The IMC compounds are uniformly distributed at the Al-Fe interface, and the weld breaks at the Al-Fe adhesion interface outside the stirring pin on the RS.
Under high rotation speed and ultra-high rotation speed, the welding temperature, welding speed, and tool offset have little influence on the IMC type. High rotation speed means a high shear rate, which directly affects the interatomic diffusion, thereby affecting the type of intermetallic compounds produced. Therefore, the rotation speed plays a crucial role in the type of IMC.
The tensile strength of the iron-rich phase (Fe3Al) of the joint in the interlayer is not as high as that of the aluminum-rich phase (FeAl3) of the joint in the interlayer. In the case of the joint obtained by ultra-HRS-FSW, the SS block cut by high stirring leads to the formation of loose holes between the joints and a decrease in connection strength. The iron-rich phase (Fe3Al) has better corrosion resistance.
According to the hardness analysis, the hardness of the top layer of the joint is found to be substantially different from that of the middle and lower layers. The aluminum side has lower hardness levels than the steel side. This difference in hardness is related to the high tool rotation speed on the aluminum alloy side, higher friction, and plastic deformation caused by high-speed rotation of the shoulder. The grain on the side of aluminum alloy absorbs energy, and the material softens, while SS is transformed into martensite as a result of temperature changes and plastic deformation.
When the tool offset is 0.7 mm under HRS-FSW and ultra-HRS-FSW welding methods, along with an intermetallic compound at the Al-Fe interface, a mixed zone of iron and aluminum is formed. When the tool offset is 0.55 mm, only intermetallic compounds are formed at the Al-Fe interface.
From the above findings, it can be concluded that although the mechanical properties of ultra-HRS-FSW joints are not as high as those of HRS-FSW joints, the iron-rich phases produced by ultra-HRS-FSW have better strength, toughness and corrosion resistance. Future research can be focused on improving the ultra-HRS-FSW connection modes, such as improving the shape of the stirring head or adding auxiliary pulses or induction heating to vary the microstructure distribution of joints. Finally, improved methods and processes can lead to the formation of excellent welds.

Author Contributions

Data curation, Y.Z., H.Z., X.C., M.S., Z.Y., Y.G. and L.M.; writing—original draft, Y.G., L.M., S.C. and Z.L.; writing—review and editing, Z.L. and S.C.; supervision, S.C.; validation, Y.Z., H.Z., X.C., M.S. and Z.L. All authors have read and agreed to the published version of the manuscript.

Funding

This research received no external funding.

Institutional Review Board Statement

Not applicable.

Informed Consent Statement

Not applicable.

Conflicts of Interest

The authors declare no conflict of interest.

References

  1. Li, K.; Liu, X.; Zhao, Y. Research Status and Prospect of Friction Stir Processing Technology. Coatings 2019, 9, 129. [Google Scholar] [CrossRef] [Green Version]
  2. Riahi, M.; Amini, A. Effect of different combinations of tailor-welded blank coupled with change in weld location on mechanical properties by laser welding. Int. J. Adv. Manuf. Technol. 2013, 67, 1937–1945. [Google Scholar] [CrossRef]
  3. Wan, L.; Huang, Y. Friction stir welding of dissimilar aluminum alloys and steels: A review. Int. J. Adv. Manuf. Technol. 2018, 99, 1781–1811. [Google Scholar] [CrossRef]
  4. Springer, H.; Kostka, A.; Payton, E.; Raabe, D.; Kaysser-Pyzalla, A.; Eggeler, G. On the formation and growth of intermetallic phases during interdiffusion between low-carbon steel and aluminum alloys. Acta Mater. 2011, 59, 1586–1600. [Google Scholar] [CrossRef]
  5. Wang, Z.; Bi, X.; Liu, B.; Xu, M.; Dong, Z. Adhesion enhancement of PEEK/6161-T6 FLJ joints via laser surface modification. Compos. Part. B Eng. 2021, 216, 108797. [Google Scholar] [CrossRef]
  6. Verma, R.P.; Pandey, K.; Sharma, Y. Effect of ER4043 and ER5356 filler wire on mechanical properties and microstructure of dissimilar aluminium alloys, 5083-O and 6061-T6 joint, welded by the metal inert gas welding. Proc. Inst. Mech. Eng. Part B J. Eng. Manuf. 2014, 229, 1021–1028. [Google Scholar] [CrossRef]
  7. Cabral-Miramontes, J.; Gaona-Tiburcio, C.; Estupinán-López, F.; Lara-Banda, M.; Zambrano-Robledo, P.; Nieves-Mendoza, D.; Maldonado-Bandala, E.; Chacón-Nava, J.; Almeraya-Calderón, F. Corrosion Resistance of Hard Coat Anodized AA 6061 in Citric–Sulfuric Solutions. Coatings 2020, 10, 601. [Google Scholar] [CrossRef]
  8. Liu, X.; Lan, S.; Ni, J. Analysis of process parameters effects on friction stir welding of dissimilar aluminum alloy to advanced high strength steel. Mater. Des. 2014, 59, 50–62. [Google Scholar] [CrossRef]
  9. Ramachandran, K.K.; Murugan, N.; Kumar, S.S. Effect of tool axis offset and geometry of tool pin profile on the characteristics of friction stir welded dissimilar joints of aluminum alloy AA5052 and HSLA steel. Mater. Sci. Eng. A 2015, 639, 219–233. [Google Scholar] [CrossRef]
  10. An, J.; Liu, Y.B.; Zhang, M.Z.; Yang, B. Effect of Si on the interfacial bonding strength of Al–Pb alloy strips and hot-dip aluminized steel sheets by hot rolling. J. Mater. Process. Technol. 2002, 120, 30–36. [Google Scholar] [CrossRef]
  11. Kaushik, P.; Dwivedi, D.K. Induction preheating in FSW of Al-Steel combination. Mater. Today Proc. 2021, 46, 1091–1095. [Google Scholar] [CrossRef]
  12. Sisan, M.M.; Sereshki, M.A.; Khorsand, H.; Siadati, M. Carbon coating for corrosion protection of SS-316L and AA-6061 as bipolar plates of PEM fuel cells. J. Alloy. Compd. 2014, 613, 288–291. [Google Scholar] [CrossRef]
  13. Öztürk, B. Energy consumption model for the pipe threading process using 10 wt.% Cu and 316L stainless steel powder-reinforced aluminum 6061 fittings. Mater. Test. 2019, 61, 797–805. [Google Scholar] [CrossRef]
  14. Kap, I.; Starostin, M.; Shter, G.E.; Grader, G.S. Corrosion of aluminium, stainless steels and AISI 680 nickel alloy in nitrogen-based fuels. Mater. Corros. 2011, 63, 571–579. [Google Scholar] [CrossRef]
  15. Chen, C.S.; Peng, X.L.; Li, Y.L.; Hu, X.W.; Wang, W.Q. Influence of Cu Coating on the Microstructure and Mechanical Properties of Laser Welded Joints in Dissimilar Metals. Lasers Eng. 2019, 43, 131–144. [Google Scholar]
  16. Guan, Q.; Long, J.; Yu, P.; Jiang, S.; Huang, W.; Zhou, J. Effect of steel to aluminum laser welding parameters on mechanical properties of weld beads. Opt. Laser Technol. 2019, 111, 387–394. [Google Scholar] [CrossRef]
  17. Mohan, D.G.; Tomków, J.; Gopi, S. Induction Assisted Hybrid Friction Stir Welding of Dissimilar Materials AA5052 Aluminium Alloy and X12Cr13 Stainless Steel. Adv. Mater. Sci. 2021, 21, 17–30. [Google Scholar] [CrossRef]
  18. Tylecote, R.F. The Solid Phase Welding of Metals; Hodder & Stoughton Educational: London, UK, 1968. [Google Scholar]
  19. Liu, F.; Dong, P.; Zhang, J.; Lu, W.; Taub, A.; Sun, K. Alloy amorphization through nanoscale shear localization at Al-Fe interface. Mater. Today Phys. 2020, 15, 100252. [Google Scholar] [CrossRef]
  20. Liu, F.; Dong, P. From thick intermetallic to nanoscale amorphous phase at Al-Fe joint interface: Roles of friction stir welding conditions. Scr. Mater. 2021, 191, 167–172. [Google Scholar] [CrossRef]
  21. Chen, S.; Zhou, Y.; Xue, J.; Ni, R.; Guo, Y.; Dong, J. High Rotation Speed Friction Stir Welding for 2014 Aluminum Alloy Thin Sheets. J. Mater. Eng. Perform. 2017, 26, 1337–1345. [Google Scholar] [CrossRef]
  22. Liu, F.J.; Fu, L.; Chen, H.Y. Effect of high rotational speed on temperature distribution, microstructure evolution, and mechanical properties of friction stir welded 6061-T6 thin plate joints. Int. J. Adv. Manuf. Technol. 2018, 96, 1823–1833. [Google Scholar] [CrossRef]
  23. Zhang, H.J.; Wang, M.; Qi, R.L.; Zhu, Z.; Zhang, X.; Yu, T.; Wu, Z.Q. Effect of rotation speed on nugget structure and property of high rotation speed friction stir welded Al-Mn aluminum alloy. Int. J. Adv. Manuf. Technol. 2017, 92, 2401–2410. [Google Scholar] [CrossRef]
  24. Mohan, R.; Jayadeep, U.B.; Manu, R. CFD modelling of ultra-high rotational speed micro friction stir welding. J. Manuf. Process. 2021, 64, 1377–1386. [Google Scholar] [CrossRef]
  25. Zhang, C.; Qin, Z.; Rong, C.; Shi, W.; Wang, S. The Preliminary Exploration of Micro-Friction Stir Welding Process and Material Flow of Copper and Brass Ultra-Thin Sheets. Materials 2020, 13, 2401. [Google Scholar] [CrossRef] [PubMed]
  26. Park, S.; Joo, Y.; Kang, M. Effect of Backing Plate Materials in Micro-Friction Stir Butt Welding of Dissimilar AA6061-T6 and AA5052-H32 Aluminum Alloys. Metals 2020, 10, 933. [Google Scholar] [CrossRef]
  27. Barnes, S.J.; Bhatti, A.R.; Steuwer, A.; Johnson, R.M.; Altenkirch, J.; Withers, P. Friction Stir Welding in HSLA-65 Steel: Part I. Influence of Weld Speed and Tool Material on Microstructural Development. Met. Mater. Trans. A 2012, 43, 2342–2355. [Google Scholar] [CrossRef]
  28. Kumar, K.; Kailas, S.V. The role of friction stir welding tool on material flow and weld formation. Mater. Sci. Eng. A 2008, 485, 367–374. [Google Scholar] [CrossRef] [Green Version]
  29. Kumar, R.; Singh, K.; Pandey, S. Process forces and heat input as function of process parameters in AA5083 friction stir welds. Trans. Nonferrous Met. Soc. China 2012, 22, 288–298. [Google Scholar] [CrossRef]
  30. Nandan, R.; Debroy, T.; Bhadeshia, H. Recent advances in friction-stir welding–Process, weldment structure and properties. Prog. Mater. Sci. 2008, 53, 980–1023. [Google Scholar] [CrossRef] [Green Version]
  31. Pew, J.W.; Nelson, T.W.; Sorensen, C.D. Torque based weld power model for friction stir welding. Sci. Technol. Weld. Join. 2007, 12, 341–347. [Google Scholar] [CrossRef]
  32. Yeremenko, V.N.; Natanzon, Y.V.; Dybkov, V.I. The effect of dissolution on the growth of the Fe2Al5 interlayer in the solid iron -liquid aluminium system. J. Mater. Sci. 1981, 16, 1748–1756. [Google Scholar] [CrossRef]
  33. Lee, W.-B.; Schmuecker, M.; Mercardo, U.A.; Biallas, G.; Jung, S.-B. Interfacial reaction in steel–aluminum joints made by friction stir welding. Scr. Mater. 2006, 55, 355–358. [Google Scholar] [CrossRef]
  34. Mahoney, M.W.; Rhodes, C.G.; Flintoff, J.G.; Bingel, W.H.; Spurling, R.A. Properties of friction-stir-welded 7075 T651 aluminum. Metall. Mater. Trans. A 1998, 29, 1955–1964. [Google Scholar] [CrossRef]
  35. Hirano, K.-I.; Agarwala, R.; Cohen, M. Diffusion of iron, nickel and cobalt in aluminum. Acta Met. 1962, 10, 857–863. [Google Scholar] [CrossRef]
  36. Hood, G.M. The diffusion of iron in aluminium. Philos. Mag. 1970, 21, 305–328. [Google Scholar] [CrossRef]
  37. Qin, T.; Lin, X.; Yu, J.; Wang, M.; Guo, P.; Li, J.; Zhang, Y.; Liu, J.; Zhang, S.; Huang, W. Performance of different microstructure on electrochemical behaviors of laser solid formed Ti–6Al–4V alloy in NaCl solution. Corros. Sci. 2021, 185, 109392. [Google Scholar] [CrossRef]
  38. Tang, Y.; Shen, X.; Qiao, Y.; Yang, L.; Chen, J.; Lu, D.; Zhang, Z. Corrosion Behavior of a Selective Laser Melted Inconel 718 Alloy in a 3.5 wt.% NaCl Solution. J. Mater. Eng. Perform. 2021, 30, 5506–5514. [Google Scholar] [CrossRef]
  39. Qiao, Y.; Wang, X.; Yang, L.; Wang, X.; Chen, J.; Wang, Z.; Zhou, H.; Zou, J.; Wang, F. Effect of aging treatment on microstructure and corrosion behavior of a Fe-18Cr-15Mn-0.66N stainless steel. J. Mater. Sci. Technol. 2021, 107, 197–206. [Google Scholar] [CrossRef]
  40. Chen, Z.; Hu, H.; Guo, X.; Zheng, Y. Effect of groove depth on the slurry erosion of V-shaped grooved surfaces. Wear 2022, 488–489, 204133. [Google Scholar] [CrossRef]
  41. Gupta, R.K.; Das, H.; Pal, T.K. Influence of Processing Parameters on Induced Energy, Mechanical and Corrosion Properties of FSW Butt Joint of 7475 AA. J. Mater. Eng. Perform. 2012, 21, 1645–1654. [Google Scholar] [CrossRef]
  42. Knibloe, J.R.; Wright, R.N.; Trybus, C.L. Microstructure and mechanical properties of Fe3Al alloys with chromium. J. Mater. Sci. 1993, 28, 2040–2048. [Google Scholar] [CrossRef]
  43. Johnson, M.; Mikkola, D.E.; March, P.A.; Wright, R.N. The resistance of nickel and iron aluminides to cavitation erosion and abrasive wear-ScienceDirect. Wear 1990, 140, 279–289. [Google Scholar] [CrossRef]
  44. Jin, H.O.; Ko, C.; Saimoto, S.; Threadgill, P.L. Microstructure of Friction Stir Welded Joints in AA5182. Mater. Sci. Forum 2000, 331–337, 1725–1730. [Google Scholar] [CrossRef]
  45. Miles, M.P.; Pew, J.; Nelson, T.W.; Li, M. Comparison of formability of friction stir welded and laser welded dual phase 590 steel sheets. Sci. Technol. Weld. Join. 2006, 11, 384–388. [Google Scholar] [CrossRef]
Figure 1. Schematic diagram of the FSW experiment. (a) Schematic diagram of tool displacement; (b) Cross-sectional diagram in (a).
Coatings 11 01550 g001
Figure 2. An example of an FSW tool. (a) Physical drawing of the tool; (b) specific dimensions of the tool (unit: mm).
Coatings 11 01550 g002
Figure 3. Tensile test and hardness test: (a) specific dimensions of the tensile specimen; (b) schematic diagram of the hardness measurement location (unit: mm).
Coatings 11 01550 g003
Figure 4. This picture corresponds to the Zeiss picture of the interface of (a) serial number 1, (b) serial number 2, (c) serial number 3, and (d) serial number 4 in Table 2. The red dotted line is the inclination angle of the Fe-Al interface.
Coatings 11 01550 g004
Figure 5. Details corresponding to the partially enlarged images in Figure 4 and the SEM image. (a) HRS-FSW Al-Fe interface under a high tool offset (b) HRS-FSW Al-Fe interface under a low tool offset. (c) Ultra-HRS-FSW Al-Fe interface under a high tool offset. (d) Ultra-HRS-FSW Al-Fe interface under a low tool offset. (e) RS side interface and SEM picture of HRS-FSW under a low tool offset. (f) RS side interface and SEM picture of ultra-HRS-FSW under a low tool offset. (g) Partial magnification in Figure e. (h) Partial magnification in Figure f.
Coatings 11 01550 g005
Figure 6. SEM image of the HRS-FSW interface and the EDS measuring position under a high tool offset. (a) Low- magnification SEM picture, (b) SEM Al-Fe interface picture at the top and EDS point scan position, (c) SEM Al-Fe interface picture in the middle, and (d) SEM Al-Fe interface picture at the bottom.
Coatings 11 01550 g006
Figure 7. SEM image of HRS-FSW interface and EDS measuring position under a low tool offset. (a) Low magnification SEM picture, (b) SEM Al-Fe interface picture at the top and EDS point scan position, (c) SEM Al-Fe interface picture in the middle, (d) SEM Al-Fe interface picture at the bottom.
Coatings 11 01550 g007
Figure 8. SEM image of ultra-HRS-FSW interface and EDS measuring position under a high tool offset. (a) Low magnification SEM picture, (b) SEM Al-Fe interface picture at the top, (c) SEM Al-Fe interface picture in the middle, (d) SEM Al-Fe interface picture at the bottom and EDS point scan position.
Coatings 11 01550 g008
Figure 9. SEM image of ultra-HRS-FSW interface and EDS measuring position under a low tool offset. (a) Low magnification SEM picture, (b) SEM Al-Fe interface picture at the top and EDS point scan position, (c) SEM Al-Fe interface picture in the middle, (d) SEM Al-Fe interface picture at the bottom.
Coatings 11 01550 g009
Figure 10. Thermal history of the aluminum alloy retracted side under HRS and ultra-HRS low tool offset parameters.
Coatings 11 01550 g010
Figure 11. (a) Schematic diagram of shear band thickness under HRS-FSW parameter, (b) schematic diagram of shear band thickness under an ultra-HRS-FSW parameter.
Coatings 11 01550 g011
Figure 12. The electrochemical corrosion behavior of HRS and ultra-HRS under low tool offset parameters. (a) The open-circuit potential of the connector; (b) the polarization curve of the connector.
Coatings 11 01550 g012
Figure 13. This figure corresponds to the microhardness values of the connector of (a) serial number 1, (b) serial number 2, (c) serial number 3, (d) and serial number 4 in the parameters of Table 2.
Coatings 11 01550 g013
Figure 14. The stress-strain curve of the highest UTS under the parameters of HRS and ultra-HRS, respectively.
Coatings 11 01550 g014
Figure 15. SEM photos of tensile fracture (a) fracture SEM picture under HRS-FSW. (b) partial enlargement in (a). (c) partial enlargement in (a). (d) fracture SEM picture under ultra-HRS-FSW.
Coatings 11 01550 g015
Table 1. Chemical composition of the base materials.
BaseChemical Composition (Wt.%)
MaterialCCuSiFeMnMgZnMoCrNiTiAl
6061-T6-0.110.60.70.150.90.25-0.09-0.15Bal.
316L0.023-0.45Bal.1.36--2.0716.7510.05--
Table 2. The process parameters used regarding the HFSW of Al 6061 to 316L steel.
Serial NumberProcess TypeRotational Speed
(R) (rpm)
Welding Speed
(FT) (mm/min)
Tool Offset
(Offset) (mm)
1HRS10,000800.70
2HRS10,000800.55
3Ultra-HRS18,0004000.70
4Ultra-HRS18,0004000.55
Table 3. The EDS results on the Al-Fe interface IMC, corresponding to the parameters of Table 2.
Serial NumberAl (wt%)Fe (wt%)IMC
170.829.2FeAl3
275.424.6FeAl3
315.884.2Fe3Al
417.482.6Fe3Al
Table 4. Variables corresponding to the IMC thickness of different parts of the AlFe interface, under the parameters given in Table 2.
Serial NumberTop (μm)Middle (μm)Bottom (μm)Average Value
(μm)
11.190.4560.29140.646
22.7822.1643.5522.833
31.4690.3690.5890.809
42.4141.6332.3192.122
Publisher’s Note: MDPI stays neutral with regard to jurisdictional claims in published maps and institutional affiliations.

