
The Effect of Adding Sodium Carbonate on the Electrical Conductivity of Aluminum Paste

School of Materials Science and Engineering, Kunming University of Science and Technology, Kunming 650093, China
*
Author to whom correspondence should be addressed.
Coatings 2021, 11(12), 1557; https://0-doi-org.brum.beds.ac.uk/10.3390/coatings11121557
Submission received: 19 November 2021
/
Revised: 29 November 2021
/
Accepted: 15 December 2021
/
Published: 18 December 2021
(This article belongs to the Special Issue Functional Coatings for Metallic and Ceramic Materials)
Abstract
:Base metal pastes have been widely used in the preparation of ZnO varistor electrodes, and it is important to accurately grasp the relevant mechanisms affecting the conductivity of aluminum electrodes. In this paper, the effect of adding sodium carbonate on the conductive property of aluminum paste was assessed, and the microscopic mechanism during aluminum electrode sintering explored. The results show that adding sodium carbonate can reduce the softening point of glass powder and enhance its fluidity. Sodium carbonate, glass, and aluminum oxide film react together; consequently, the aluminum oxide film is partially dissolved by reaction to produce defects, and there is tight contact at the interface between the aluminum powder particles. The sodium ions will displace the aluminum ions in the alumina, conferring the alumina film with a certain ionic conductivity. At the same time, sodium ions are doped into the aluminum lattice, which causes the aluminum lattice to swell. After sintering, the structure of aluminum electrode is compact and its electrical conductivity is significantly improved. This study is a valuable reference for the theoretical research and the potential applications of aluminum paste.
1. Introduction
Conductive paste is an important and indispensable basic raw materials in microelectronics industry. It is mainly used as electrode material for manufacturing electronic components. A zinc oxide varistor is a polycrystalline material [1,2]. It is widely used in circuits for overvoltage protection and voltage regulation and is characterized by a sensitive change in resistance value as the applied voltage increases, resulting in a nonlinear change in the corresponding current and voltage [3,4]. At present, silver and other precious metals are usually used as electrode materials for zinc oxide varistors in the industry. With the rapid development of the electronics and information industry, the demand for low-cost electronic components in the electronics manufacturing industry is more and more extensive. Zinc oxide varistors with silver as the electrode material have been at a disadvantage in the competitive market due to their high costs [5,6]. Hence, cost reduction by the widespread use of base metals for the electrode material has become one of the trends in the development of zinc oxide varistors. Copper electrodes have gradually replaced the silver electrode for preparing zinc oxide varistors [7,8], but the former is prone to oxidization, and the sintering process is also complex (must be carried out in a protective atmosphere), with high costs [9,10,11]. Therefore, the development of a base metal electrode paste with good performance and low cost (that can be sintered in air) has become a topic requiring research.
The cost of aluminum electrode material is lower, but the chemical properties of aluminum powder of the conductive phase of aluminum paste confer greater activity. Usually, there is a layer of insulating alumina film on the surface, which leads to the poor electrical conductivity of the aluminum electrode [12,13,14]. Even if the aluminum powder is pretreated (removing the alumina film), it will still oxidize in the high temperature environment during sintering, resulting in reduced performance. In this paper, aluminum paste was prepared with the addition of different contents of sodium carbonate to study its effect on the performance of aluminum electrode, and the underlying mechanism, so as to provide a scientific basis for improving the performance of aluminum electrodes.
2. Materials and Methods
Experimental materials: spherical aluminum powder, particle size of 2.0–3.0 μm; the glass was SiO2-B2O3-Bi2O3 system glass. The organic carrier was a mixture of butyl carbitol, ethyl cellulose, and other additives.
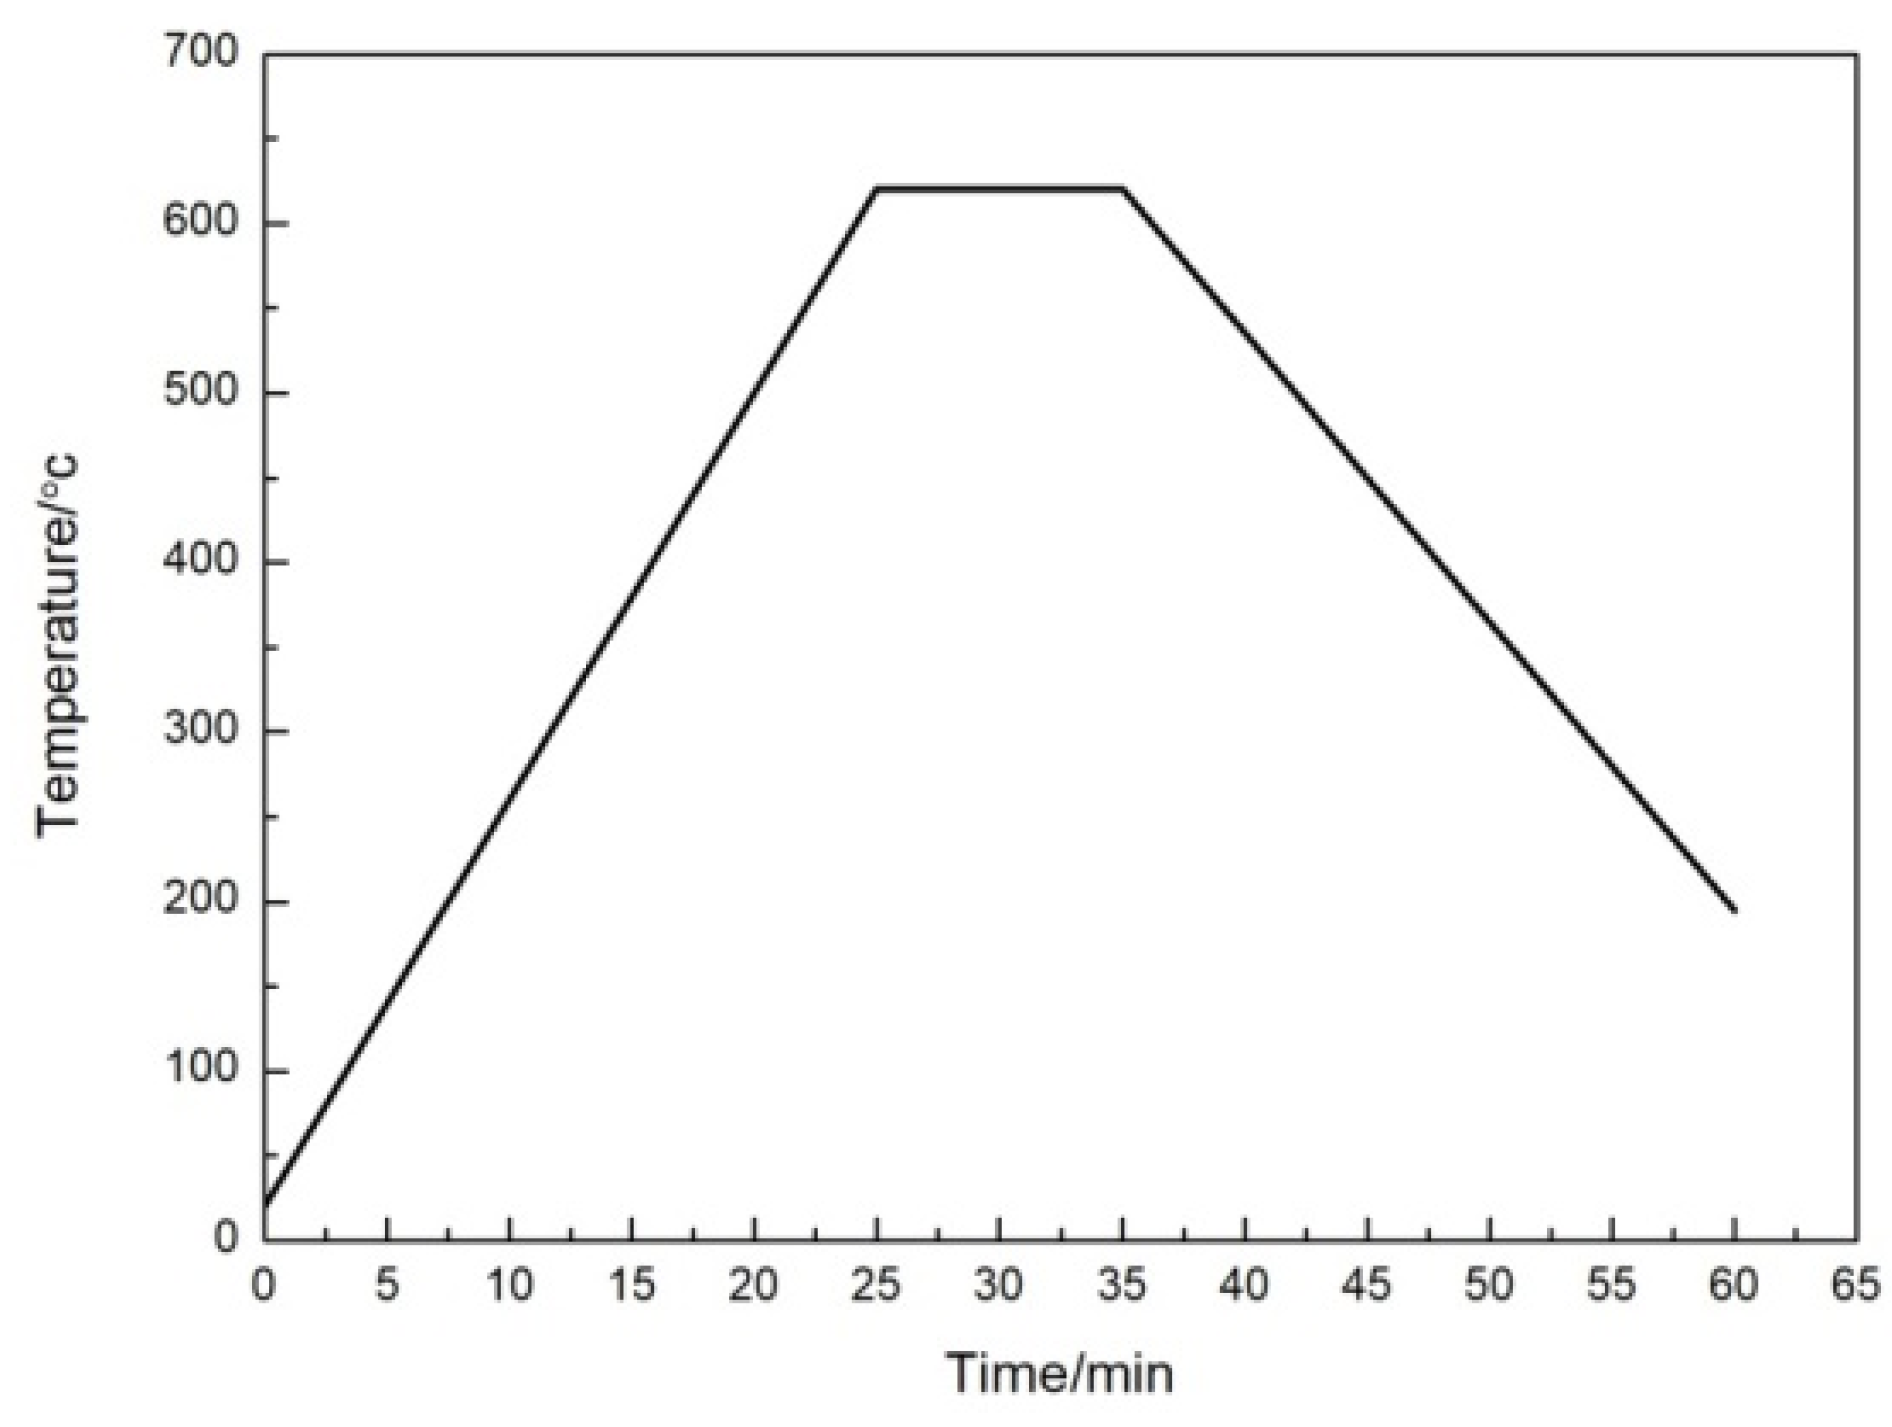
Aluminum powder, glass powder, organic carrier, and sodium carbonate were weighed in a certain proportion, and then rolled and dispersed with a three-roller mill to obtain aluminum paste with fineness of less than 10 μm. The aluminum paste was printed on ZnO substrate by a screen printing method, placed into an oven and dried at 150 °C for 5 min, and finally transferred into a tube sintering furnace (NBD-HT1100-80IT, Henan Nobody Materials Science and Technology Co., Ltd., Zhengzhou, China) for sintering. The peak temperature was 620 °C, the holding time was 10 min, and the heating rate was 30 °C/min. The content of sodium carbonate (mass fraction, %) added to the aluminum pastes were 0%, 3%, 4%, 5%, and 6% for 5 sets of samples. The sintered aluminum electrode specimens are shown in Figure 1, and the sintering curves are shown in Figure 2.
The microstructure and densities of aluminum electrodes were characterized by scanning electron microscopy (SEM, FEI Company, Hillsboro, OR, USA) XL30ESEM-TMP. The square resistance of the aluminum electrode was measured by the four-probe method. To distinguish the metallic core of the aluminum powder from the oxide shell, the evolution of the powder morphology and core-shell structure after sintering was studied using a Tecnai F30 transmission electron microscope (TEM, Hillsboro, OR, USA). The physical phase analysis of the aluminum electrode as well as the glass powder was checked using a D8A advance x-ray diffractometer. Possible phase changes in glass, sodium carbonate, and mixtures of glass and sodium carbonate were characterized by thermogravimetry (TG) and differential scanning calorimetry (DSC) STA 449F3. The samples were heated in an oxygen/argon atmosphere (oxygen flow rate of 20 mL/min and argon flow rate of 80 mL/min) from room temperature to 700 °C at a heating rate of 10 °C/min. XPS analysis was performed using a PHI5000 Versaprobe-II X-ray photoelectron spectrometer (ULVAC-PHI, Chigasaki, Japan). The C, Al, and Na elements of the surface of aluminum electrode were measured. C1s (284.80eV) of polluted carbon was used for charge calibration. A survey scan was performed within the range of 0~1400 eV, followed by a narrow scan of C, Al, and Na elements.
3. Materials and Methods
3.1. TG-DSC Analysis of Samples
Figure 3 shows the TG-DSC curves of glass, sodium carbonate, glass and sodium carbonate mixture; Figure 4 shows the XRD patterns of glass before and after sintering, and glass and sodium carbonate mixture after sintering. The structural state of glass will change with the increase of temperature during heating. Glass transition is an endothermic process, while crystallization is an exothermic process, so the temperature in the curve rises from low to high, and different endothermic and exothermic peaks correspond to the transition temperature (Tg), softening temperature (Tf), and crystallization temperature (Ts) of glass [15]. As can be seen from Figure 3, before sodium carbonate is added, the glass transition temperature, Tg, is 484 °C and the glass softening temperature, Tf, is 574 °C. The starting point of the exothermic peak shows that the crystallization temperature, TS, is 584 °C, and at this temperature, the crystallization and nucleation of the glass occur simultaneously. For the glass with added sodium carbonate, Tg was 469 °C, Tf was 499 °C, and Ts was 534 °C. Compared with the glass without sodium carbonate, these three characteristic temperatures are all reduced, indicating that the addition of sodium carbonate can enhance glass sintering [16,17,18,19]. It can also be seen from Figure 3 and Figure 4 that the sample of glass with sodium carbonate added has lost weight after sintering, and a new phase of Bi24Si2O40 is generated, which is called sillente, a member of class of stable Bi2O3 derivatives in which Si can stabilize γ-Bi2O3 to a Bi24Si2O40 phase at lower temperatures [20]. In contrast, the diffraction peak of sodium carbonate is not apparent. This indicates that in the temperature range of 429 to 514 °C, sodium carbonate and glass components undergo a double decomposition reaction, resulting in the release of CO2 gas, and hence a weight loss. Elemental sodium carbonate should begin to decompose only above 850 °C [21,22], but when the sodium carbonate is added into glass, it will react with glass (generating a new Bi24Si2O40 phase), enhance the softening of glass, and causing the remaining sodium carbonate to be decomposed at a lower temperature (619 °C).
3.2. XPS Analysis of Samples
Figure 5 shows the XPS spectra of different elements on the surface of the aluminum electrode. Among them, Figure 5a shows the 2p peak of the Al element and Figure 5b shows the 1s peak of the Na element. Without the addition of sodium carbonate, the 2p peak of Al is located at 74.15eV. Since a small amount of sodium carbonate is added as a burning aid during the preparation of glass, a small amount of Na2CO3 is also detected in the aluminum electrode sample without added sodium carbonate. Due to the addition of sodium carbonate, the charge transfer changes the environment where Al3+ is located, but does not cause a change in valence state. Therefore, the binding energy of Al 2p electrons was reduced to 73.59 eV. From Table 1, it can be seen that the aluminum content in the aluminum electrode without added sodium carbonate was 67.93% and the aluminum content in the aluminum electrode with added sodium carbonate was 29.55%. The large decrease in aluminum content was due to the displacement of aluminum ions in the alumina film by sodium ions. Sodium ion incorporated alumina displays ionic conductivity [23]. The binding energies of Na 1s were 1072.20 eV, 1071.50 eV, and 1070.80 eV, where 1072.20 eV and 1071.50 eV were consistent with the binding energies of Na 1s in the literatur, which proved that Na existed in the form of albite and Na2CO3. This also agreed with the XRD test results.
3.3. TEM and XRD Analysis of Samples
Figure 6 shows the XRD patterns of aluminum paste sintered samples with and without the addition of sodium carbonate. Against the standard PDF cards (JCPDS Card No.49-0003, No.49-0006, No.83-1466) and compared with the samples without sodium carbonate, the diffraction curves of Na1.95Al1.95Si0.05O4, Na1.55Al1.55Si0.45O4, and Na0.986(Al1.005Si2.995O8) composite oxides appear in the sample with added sodium carbonate. This shows that during the sintering of aluminum paste, in addition to the chemical reaction between the sodium carbonate mentioned above and the glass, there is the formation of a new phase (Bi24Si2O40). The morphology of the aluminum powder after sintering at 620 °C is shown in Figure 7a. EDS analysis was performed on point 1 in Figure 7a, and the results are shown in Figure 7b. The copper mesh was used as the carrier mesh for the TEM test, so the copper diffraction peaks appeared in the EDS analysis. Sodium carbonate, glass, and aluminum oxide film react together, so that the aluminum oxide film is partially dissolved by reaction to produce defects (see Figure 8). Further, the sodium ions will displace the aluminum ions in the alumina, so that the alumina film gains a certain ionic conductivity. As a result, the contact between the aluminum powder particles becomes denser, the contact resistance reduced, and the square resistance of aluminum electrodes is improved.
In addition, the XRD analysis also shows that, compared with the sintered sample without sodium carbonate, the peak of the aluminum diffraction line of the sample with added sodium carbonate shifts to the left (2θ value decreases); that is, the corresponding plane spacing or the aluminum lattice constant increases. The reason for this is that during the sintering process, when the sodium carbonate reacts with glass and the aluminum powder, the sodium ions become doped into the lattice of aluminum. Due to the large radius of sodium ions (102 pm) and the small radius of aluminum ions (53.5 pm), the sodium ions replace the aluminum ions, resulting in lattice expansion.
3.4. SEM Analysis of Aluminum Electrode Surface
Figure 9 shows the SEM photos of the surfaces of the aluminum electrode with 0%, 3%, 4%, 5%, and 6% sodium carbonate added respectively. Figure 10 shows the square resistance of the aluminum electrode with 0%, 3%, 4%, 5%, and 6% sodium carbonate content respectively. When sodium carbonate is added, aluminum paste enhances the melting of glass in the sintering process. At the same time, aluminum oxide and glass react, and part of aluminum oxide detaches after the reaction, exposing aluminum, so that aluminum particles make contact with each other to form a dense structure. As the sodium carbonate content increases, the ability of glass to infiltrate aluminum particles also increases, and the compactness of aluminum electrode is further improved. As can be seen from Figure 9, the surface morphology of the aluminum electrode varies also significantly. The surface of the aluminum electrode without added sodium carbonate has many holes, with no close contacts between particles, which indicates that the glass does not form a network structure around the aluminum particles to make a good compaction. The square resistance of the aluminum electrode (96.51 mΩ/□) is large, and there are many holes. The number of holes on the surface of the aluminum electrode with 3% sodium carbonate added is still large, but there is a shorter bond between particles, the contact area increases, and the square resistance (78.18 mΩ/□) decreases. The number of holes on the surface of the aluminum electrode with 4% sodium carbonate added was significantly reduced, and the aluminum powder with different particle sizes was distributed proportionally. The large and small aluminum powder particles are arranged relatively close, forming a coherent conductive network. The contact resistance is small, the density is increased, and the square resistance (49.56 mΩ/□) is the smallest. When adding excessive sodium carbonate (>4%), sodium carbonate, which is not involved in the reaction, will become resident on the aluminum electrodes. This affects wettability of glass to aluminum particles, increases the number of holes on the aluminum electrodes, and, at the same time may, block direct contact between aluminum powder particles. Moreover, as there is excess decomposed sodium oxide, the mechanical strength, thermal stability, and chemical stability of the glass may be reduced. As can be seen from Figure 10, compared with the aluminum electrode with 4% sodium carbonate, the square resistance of the aluminum electrode with 5% and 6% sodium carbonate added increases in turn (49.56 mΩ/□→56.7 mΩ/□→ 65.33 mΩ/□).
3.5. SEM Analysis of Aluminum Electrode Cross-Section
The cross-sectional SEM photographs of the aluminum electrode film and the ZnO substrate are given in Figure 11. From Figure 11a, it can be seen that the aluminum electrode film layer with 0% sodium carbonate content added to the ZnO substrate is obviously delaminated, the aluminum electrode layer is not dense, and no diffusion permeation phenomenon occurs between the aluminum electrode film layer and the ZnO substrate. From Figure 11b,c, it can be seen that when 3% and 4% sodium carbonate was added to the aluminum electrode, sodium carbonate promoted the melting of the glass and improved the fluidity of the glass. There is no delamination between the film layer of the aluminum electrode and the ZnO substrate, and the connection effect is better. When 5% and 6% sodium carbonate was added to the aluminum electrode, too much sodium carbonate decomposes to sodium oxide, reducing the mechanical strength, thermal stability, and chemical stability of the glass, resulting in the poor fluidity of the glass. In addition, during the sintering process, there is an increase in NaAlSiO4 crystals precipitated by the reaction of sodium carbonate, aluminum powder, and glass, which hinders the connection between aluminum particles and affects the electrical conductivity. From Figure 11d,e, it can be seen that only a small part of the aluminum electrode film layer and the ZnO substrate did not show delamination, and most of the regions showed delamination and poor adhesion between the aluminum electrode film layer and the ZnO substrate.
3.6. Square Resistance of Aluminum Electrode with Different Sintering Temperatures
It can be seen from Figure 12 that the square resistance of the aluminum electrode decreased substantially with an increase in temperature. At 620 °C, the aluminum electrode conductivity was the best, with a square resistance of 49.56 mΩ/□. With a temperature increase to 640 °C, the square resistance of the aluminum electrode starts to increase due to the enhanced reaction of the glass, aluminum powder, and sodium carbonate, resulting in the production of excess crystals. After the comparison, the best conductivity of the aluminum electrode was obtained from preparation at 620 °C.
3.7. The Effect of the Sodium Carbonate Addition on the Conductivity Mechanism
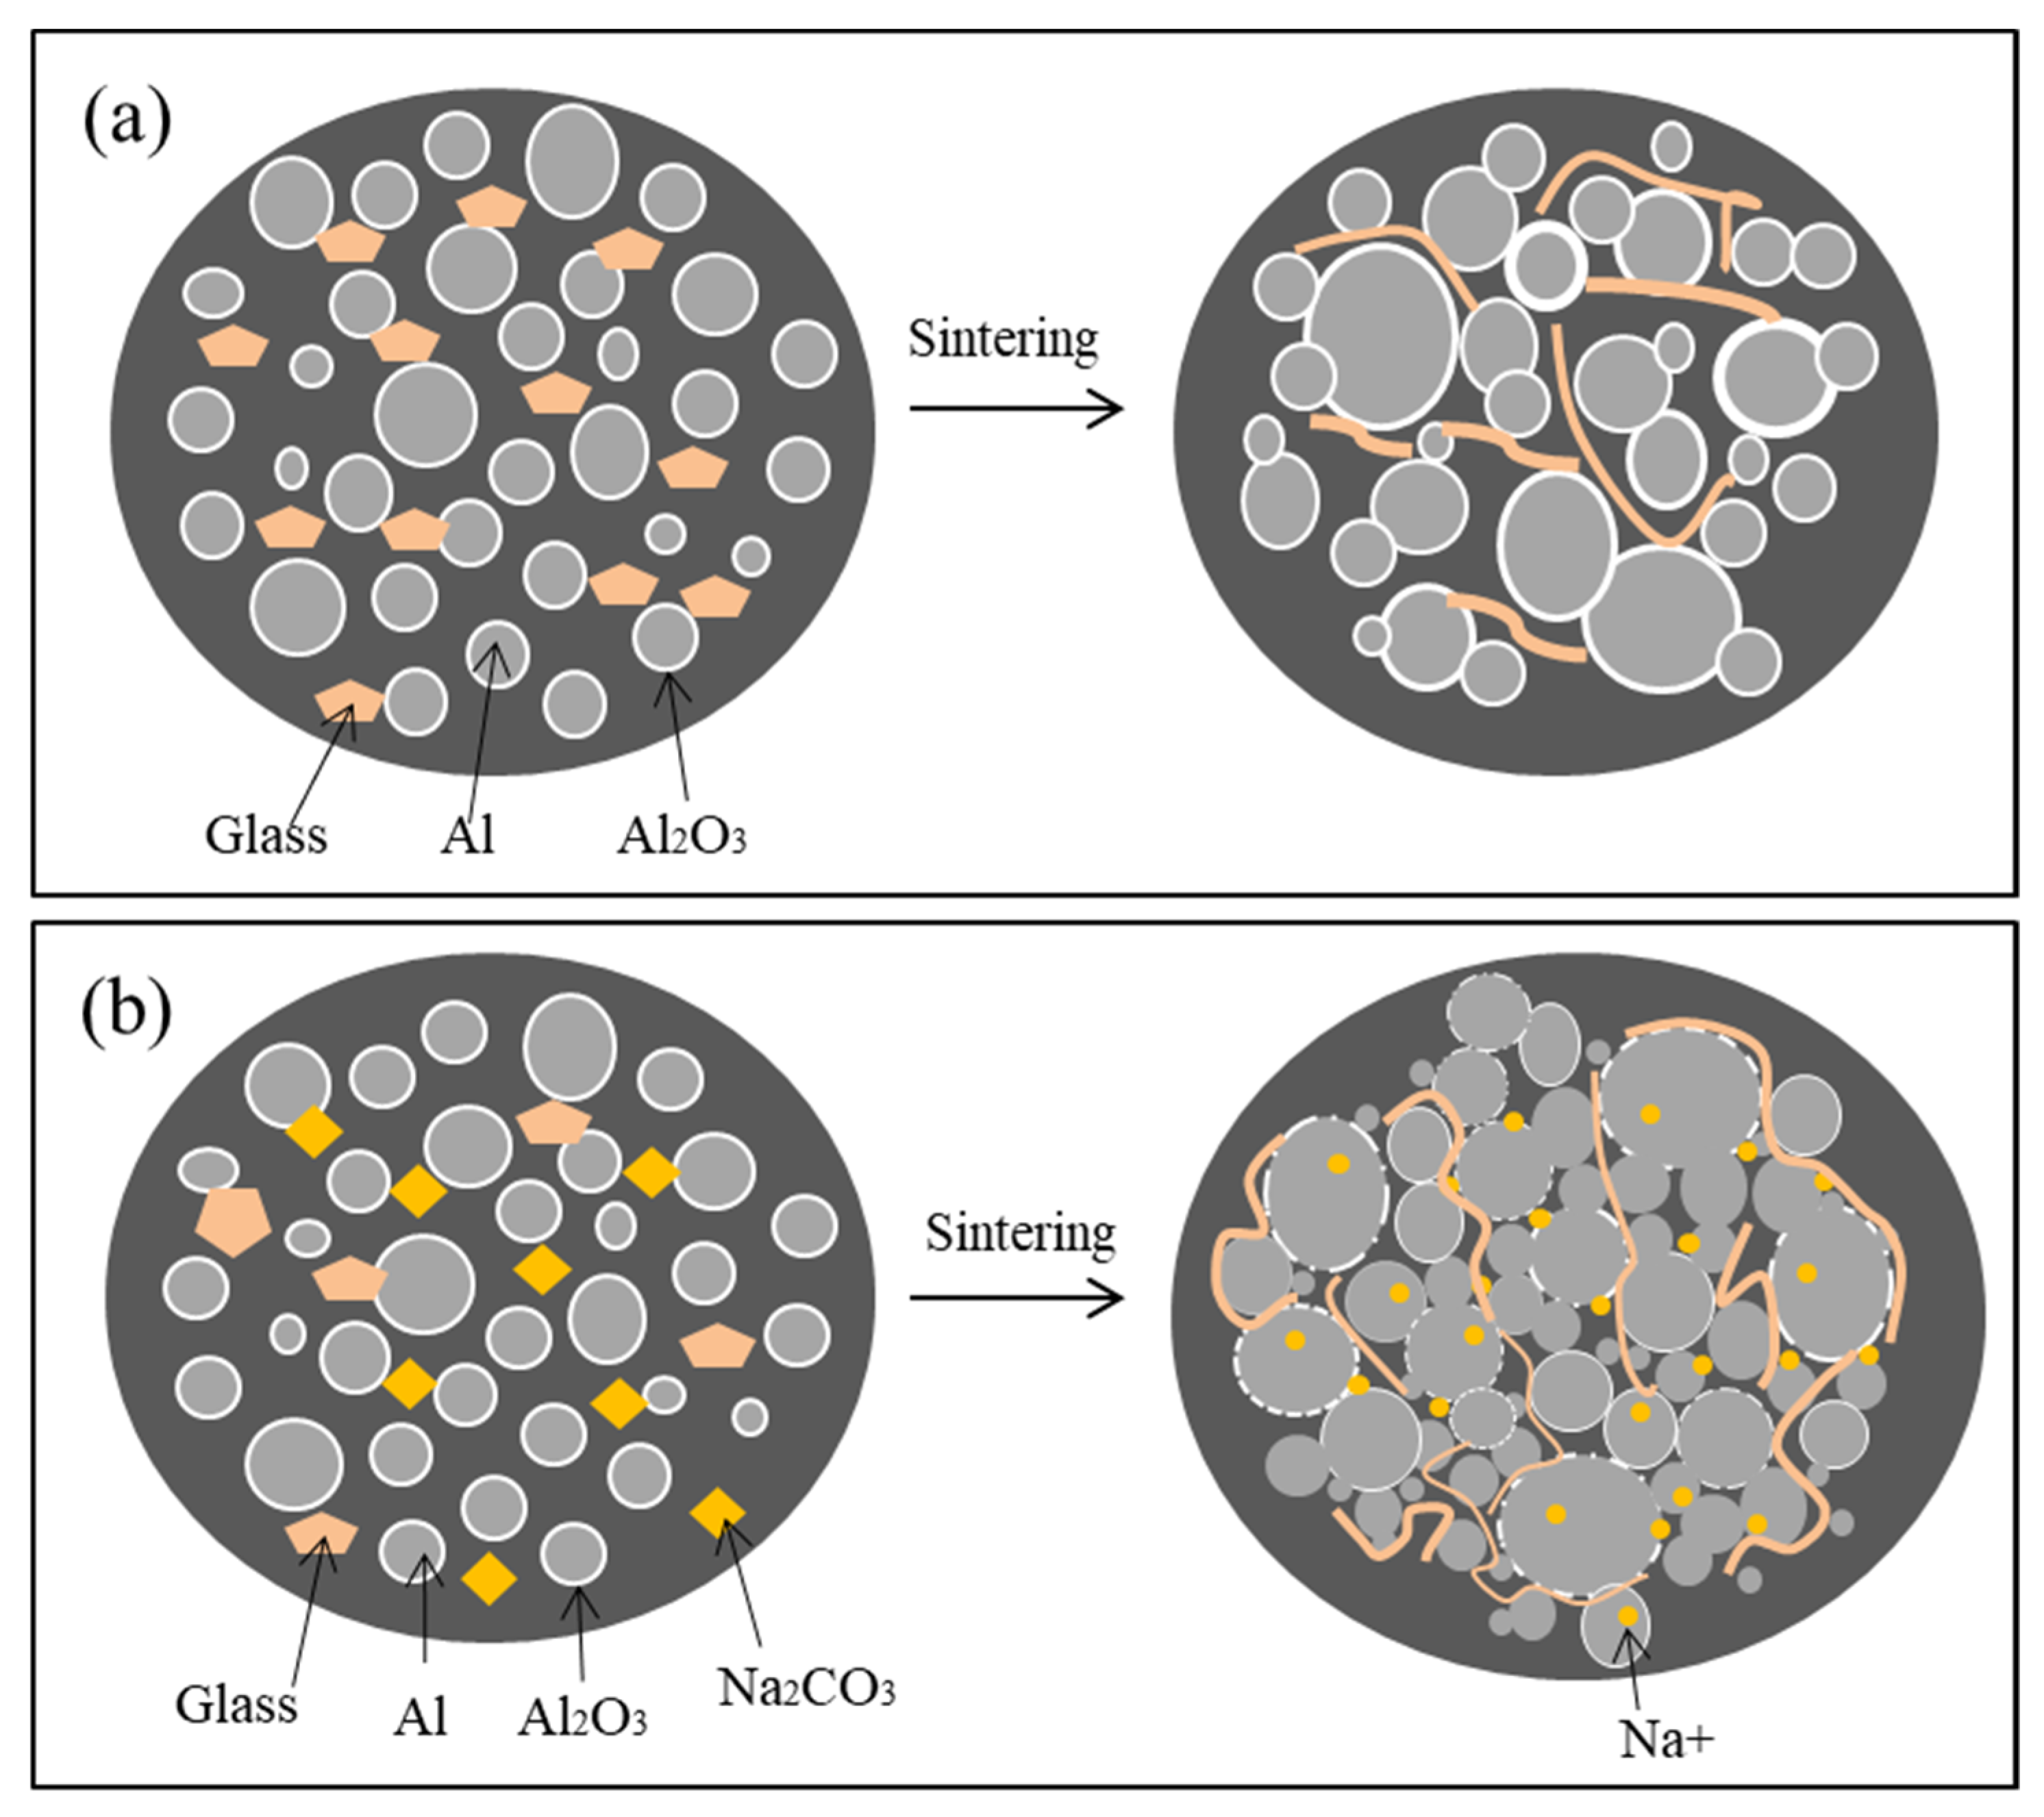
Figure 13 shows a schematic representation of the effect of the sodium carbonate addition on electrical conductivity, with a clear understanding that this addition process improves the performance of aluminum electrode. As can be seen from the figure, before adding sodium carbonate (Figure 13a), the contact between aluminum particles is blocked by aluminum oxide film, and the electrical conductivity is poor. After adding sodium carbonate (Figure 13b), the melting of the glass powder is enhanced in the sintering process, and the fluidity is better, which is conducive to closer contacts in the aluminum powder. Sodium carbonate, glass, and aluminum oxide film react together, and the aluminum oxide film is partially dissolved by the reaction to produce defects. Sodium ions are doped into the aluminum lattice, and, at the same time, the sodium ions displace the aluminum ions in the alumina, so that the alumina film has a certain ionic conductivity; thus, this reduces the contact resistance between aluminum powder particles and improves electrical conductivity.
4. Conclusions
During the sintering process of aluminum paste, sodium carbonate reacts with the aluminum oxide film on the surface of glass and aluminum powder, which causes the film to be partially dissolved and removed. The contact between the aluminum powder particles is increased and the square resistance decreases. During the sintering process, sodium ions can diffuse into the surface lattice of the aluminum powder through the location where the alumina film is removed by dissolution, causing the crystal lattice to expand. At the same time, the sodium ions displace the aluminum ions in the alumina, conferring the alumina film with a certain ionic conductivity, which contributes to an improvement in electrical conductivity. The addition of an appropriate amount of sodium carbonate to the aluminum paste reduced the square resistance from 96.51 mΩ/□ to 49.56 mΩ/□, by about 50%.
Author Contributions
Data curation, S.L.; Formal analysis, S.L.; Supervision, X.Z. and J.L.; investigation, S.L., X.Z. and J.L.; Writing—original draft, S.L. All authors have read and agreed to the published version of the manuscript.
Funding
This research received no external funding.
Institutional Review Board Statement
Not applicable.
Informed Consent Statement
Not applicable.
Data Availability Statement
Data is contained within the article.
Conflicts of Interest
The authors declare no conflict of interest.
References
- Xu, D.; Shi, L.; Wu, Z.; Zhong, Q.; Wu, X. Microstructure and electrical properties of ZnO–Bi2O3-based varistor ceramics by different sintering processes. J. Eur. Ceram. Soc. 2009, 29, 1789–1794. [Google Scholar] [CrossRef]
- Wang, Q.; Qin, Y.; Xu, G.J.; Chen, L.; Li, Y.; Duan, L.; Li, Z.X.; Li, Y.L.; Cui, P. Low-voltage ZnO varistor fabricated by the solution-coating method. Ceram. Int. 2008, 34, 1697–1701. [Google Scholar] [CrossRef]
- Yuan, K.; Li, G.; Zheng, L.; Cheng, L.; Meng, L.; Yao, Z.; Yin, Q. Improvement in electrical stability of ZnO varistors by infiltration of molten Bi2O3. J. Alloys Comp. 2010, 503, 507–513. [Google Scholar] [CrossRef]
- Xu, D.; Shi, X.F.; Cheng, X.N.; Yang, J.; Fan, Y.; Yuan, H.M.; Shi, L.Y. Microstructure and electrical properties of Lu2O3-doped ZnO-Bi2O3-based varistor ceramics. Trans. Nonferrous Met. Soc. China 2010, 12, 2303–2308. [Google Scholar] [CrossRef]
- Gan, W.P.; Yue, Y.X.; L, L.; Pan, Q.Y.; Xiong, Z.J. Preparation of Lead-Free Conductive Silver Paste and Its Sintering Technology. Paint Coat. Ind. 2014, 44, 31–36, 42. [Google Scholar]
- Li, H.J.; Zhang, Z.X.; Qu, H.X.; Ji, L.J.; Xi, J.Q. The Preparation of the Silver Electronic Paste for the Varistors. Precious Met. 2017, 38 (Suppl. 1), 103–107. [Google Scholar]
- Liu, X.Q.; Su, X.L.; Liu, X.F.; Qu, Y.H. Preparation and properties of high temperature conductive copper paste. Electron. Compon. Mater. 2015, 34, 32–35. [Google Scholar]
- Ma, X.Q.; Zhu, X.Y.; Long, J.M.; Cao, M. Effect of Glass Powder on Performance of Copper Conductor Film Prepared via Sintering Cu-glass Paste. Chin. J. Mater. Res. 2017, 31, 472–480. [Google Scholar]
- C, F.H.; P, L.C.; S, C.H.; L, H.C. Effects of Fine Particle Content in Al Paste on Screen Printed Contact Formation and Solar Cell Performance. J. Electrochem. Soc. 2010, 157, H455–H458. [Google Scholar]
- Chiu, Y.S.; Cheng, C.L.; Whang, T.J.; Ji, G.Y. Effects of silicate glasses in aluminum pastes on physical and electrical characteristics of screen-printed multi-crystalline silicon solar cells. Mater. Lett. 2014, 126, 143–146. [Google Scholar] [CrossRef]
- Rauer, M.; Schmiga, C.; Raugewitz, A.; Glatthaar, M.; Glunz, S.W. Theoretical and experimental investigation of aluminum-boron codoping of silicon. Prog. Photovolt. Res. Appl. 2016, 24, 219–228. [Google Scholar] [CrossRef]
- Trunov, M.A.; Umbrajkar, S.M.; Schoenitz, M.; Mang, J.T.; Dreizin, E.L. Oxidation and melting of aluminum nanopowders. J. Phys. Chem. B 2006, 110, 13094–13099. [Google Scholar] [CrossRef] [PubMed]
- Trunov, M.A.; Schoenitz, M.; Zhu, X.; Dreizin, E.L. Effect of polymorphic phase transformations in Al2O3 film on oxidation kinetics of aluminum powders. Combust. Flame 2005, 140, 310–318. [Google Scholar] [CrossRef]
- Coulet, M.V.; Rufino, B.; Esposito, P.H.; Neisius, T.; Isnar, O.; Denoyel, R. Oxidation mechanism of aluminum nanopowders. J. Phys. Chem. C 2015, 119, 25063–25070. [Google Scholar] [CrossRef]
- Wang, D.X.; Jin, J.S. Analysis of several factors affecting the properties of glass. Glass 2004, 1, 34–37. (In Chinese) [Google Scholar]
- Kaur, K.; Singh, K.J.; Anand, V. Structural properties of Bi2O3–B2O3–SiO2–Na2O glasses for gamma ray shielding applications. Radiat. Phys. Chem. 2016, 120, 63–72. [Google Scholar] [CrossRef]
- Muto, D.; Hashimoto, S.; Daiko, Y.; Honda, S.; Iwamoto, Y. Growth mechanism of house-of-cards aggregates of alumina platelets containing Na2O-B2O3-SiO2 glass flux. Ceram. Int. 2020, 46, 9109–9118. [Google Scholar] [CrossRef]
- ElBatal, F.H.; Selim, M.S.; Marzouk, S.Y.; Azooz, M.A. UV-vis absorption of the transition metal-doped SiO2–B2O3–Na2O glasses. Phys. B Condens. Matter 2007, 398, 126–134. [Google Scholar] [CrossRef]
- El–Egili, K. Infrared studies of Na2O–B2O3–SiO2 and Al2O3–Na2O–B2O3–SiO2 glasses. J. Phys. B. 2003, 325, 340–348. [Google Scholar] [CrossRef]
- Mei-Yu, C.; Juuti, J.; Chi-Shiung, H.; Chih-Ta, C.; Heli, J. Dielectric BaTiO3-BBSZ glass ceramic composition with ultra-low sintering temperature. J. Eur. Ceram. Soc. 2015, 35, 139–144. [Google Scholar]
- Siriwardane, R.V.; Poston, J.A.; Robinson, C.; Simonyi, T. Effect of Additives on Decomposition of Sodium Carbonate: Precombustion CO2 Capture Sorbent Regeneration. Energy Fuels 2011, 25, 1284–1293. [Google Scholar] [CrossRef]
- Yoshimori, T.; Asano, Y.; Toriumi, Y.; Shiota, T. Investigation on the drying and decomposition of sodium oxalate. Talanta 1978, 25, 603–605. [Google Scholar] [CrossRef]
- Pujar, P.; Gupta, B.; Sengupta, P.; Gupta, D. Mandal, Sodium ion incorporated alumina—A versatile anisotropic ceramic. J. Eur. Ceram. Soc. 2019, 39, 4473–4486. [Google Scholar] [CrossRef]
Figure 1.
Sintered aluminum electrode sample.

Figure 2.
Sintering curve of aluminum electrode at 620 ℃ in air.

Figure 3.
TG−DSC curves of glass, sodium carbonate, and the glass and sodium carbonate mixture. A1, B1: TG−DSC curve of glass, A2, B2: TG−DSC curve of glass and sodium carbonate mixture, A3, B3: TG−DSC curve of sodium carbonate.
Figure 3.
TG−DSC curves of glass, sodium carbonate, and the glass and sodium carbonate mixture. A1, B1: TG−DSC curve of glass, A2, B2: TG−DSC curve of glass and sodium carbonate mixture, A3, B3: TG−DSC curve of sodium carbonate.

Figure 4.
XRD patterns of glass before and after sintering and glass and sodium carbonate mixture after sintering. C1: glass and sodium carbonate mixed powder sintering, C2: Glass after sintering, C3: Unsintered glass.
Figure 4.
XRD patterns of glass before and after sintering and glass and sodium carbonate mixture after sintering. C1: glass and sodium carbonate mixed powder sintering, C2: Glass after sintering, C3: Unsintered glass.

Figure 5.
XPS spectra of different elements. (a) Al element, (b) Na element.

Figure 6.
XRD patterns of samples with and without sodium carbonate. A: Sample with sodium carbonate added; B: Sample without sodium carbonate added.
Figure 6.
XRD patterns of samples with and without sodium carbonate. A: Sample with sodium carbonate added; B: Sample without sodium carbonate added.

Figure 7.
TEM image and EDS analysis of aluminum powder after sintering at 620 °C. (a): TEM image of aluminum powder, (b): EDS spectrum of point 1 of (a).
Figure 7.
TEM image and EDS analysis of aluminum powder after sintering at 620 °C. (a): TEM image of aluminum powder, (b): EDS spectrum of point 1 of (a).

Figure 8.
TEM images of the mixture of aluminum powder, glass powder and sodium carbonate after sintering at 620 °C. (a): TEM image of a single aluminum particle in the mixed powder; (b): TEM image of the connection between aluminum particles in the mixed powder.
Figure 8.
TEM images of the mixture of aluminum powder, glass powder and sodium carbonate after sintering at 620 °C. (a): TEM image of a single aluminum particle in the mixed powder; (b): TEM image of the connection between aluminum particles in the mixed powder.

Figure 9.
Surface SEM of aluminum film samples with different added sodium carbonate content. (a): 0%, (b): 3%, (c): 4%, (d): 5%, (e): 6%.
Figure 9.
Surface SEM of aluminum film samples with different added sodium carbonate content. (a): 0%, (b): 3%, (c): 4%, (d): 5%, (e): 6%.

Figure 10.
Effect of sodium carbonate content on the square resistance of aluminum electrode specimens.
Figure 10.
Effect of sodium carbonate content on the square resistance of aluminum electrode specimens.

Figure 11.
The cross-sectional SEM photographs of aluminum electrode sections with different contents of sodium carbonate added. (a): 0%, (b): 3%, (c): 4%, (d): 5%, (e): 6%.
Figure 11.
The cross-sectional SEM photographs of aluminum electrode sections with different contents of sodium carbonate added. (a): 0%, (b): 3%, (c): 4%, (d): 5%, (e): 6%.

Figure 12.
Square resistance curves of aluminum electrodes sintered with 4% sodium carbonate content at different peak temperatures from 580 °C to 640 °C.
Figure 12.
Square resistance curves of aluminum electrodes sintered with 4% sodium carbonate content at different peak temperatures from 580 °C to 640 °C.

Figure 13.
Model diagram of conductive mechanism enhanced by addition of sodium carbonate. (a): Sintering without addition of sodium carbonate; (b): Sintering with addition of sodium carbonate.
Figure 13.
Model diagram of conductive mechanism enhanced by addition of sodium carbonate. (a): Sintering without addition of sodium carbonate; (b): Sintering with addition of sodium carbonate.


Table 1.
Elemental analysis results of aluminum electrodes.
| Sample | Content/% | ||
|---|---|---|---|
| C | Al | Na | |
| Aluminum electrode without added sodium carbonate | 25.18 | 67.93 | 6.89 |
| Aluminum electrode with added sodium carbonate | 27.38 | 29.55 | 43.07 |
Publisher’s Note: MDPI stays neutral with regard to jurisdictional claims in published maps and institutional affiliations. |
© 2021 by the authors. Licensee MDPI, Basel, Switzerland. This article is an open access article distributed under the terms and conditions of the Creative Commons Attribution (CC BY) license (https://creativecommons.org/licenses/by/4.0/).
Share and Cite
MDPI and ACS Style
Liu, S.; Zhu, X.; Long, J. The Effect of Adding Sodium Carbonate on the Electrical Conductivity of Aluminum Paste. Coatings 2021, 11, 1557. https://0-doi-org.brum.beds.ac.uk/10.3390/coatings11121557
AMA Style
Liu S, Zhu X, Long J. The Effect of Adding Sodium Carbonate on the Electrical Conductivity of Aluminum Paste. Coatings. 2021; 11(12):1557. https://0-doi-org.brum.beds.ac.uk/10.3390/coatings11121557
Chicago/Turabian StyleLiu, Shunke, Xiaoyun Zhu, and Jinming Long. 2021. "The Effect of Adding Sodium Carbonate on the Electrical Conductivity of Aluminum Paste" Coatings 11, no. 12: 1557. https://0-doi-org.brum.beds.ac.uk/10.3390/coatings11121557
Note that from the first issue of 2016, this journal uses article numbers instead of page numbers. See further details here.