Electro-Oxidation of Ammonia at Novel Ag2O−PrO2/γ-Al2O3 Catalysts
by
 , ,
, ,
Mariam Khan
1,2 ,
,
Naveed Kausar Janjua
2,*,
Safia Khan
2 ,
,
Ibrahim Qazi
3,
Shafaqat Ali
4,5 and
Tahani Saad Algarni
6 1
School of Applied Sciences and Humanity, National University of Technology, Islamabad 44000, Pakistan
2
Department of Chemistry, Quaid-i-Azam University, Islamabad 45320, Pakistan
3
Department of Materials Science and Engineering, Institute of Space Technology, Islamabad 44000, Pakistan
4
Department of Environmental Science and Engineering, Government College University, Faisalabad 38000, Pakistan
5
Department of Biological Sciences and Technology, China Medical University, Taichung 40402, Taiwan
6
Chemistry Department, College of Science, King Saud University, Riyadh 11451, Saudi Arabia
*
Author to whom correspondence should be addressed.
Coatings 2021, 11(2), 257; https://0-doi-org.brum.beds.ac.uk/10.3390/coatings11020257
Submission received: 25 January 2021
/
Revised: 11 February 2021
/
Accepted: 11 February 2021
/
Published: 22 February 2021
(This article belongs to the Special Issue Synthesis, Chracterization and Applications of Coated Composite Materials for Energy Applications)
Abstract
:An Ag2O(x)−PrO2(y)/γ-Al2O3 electrocatalyst series (X:Y is for Ag:Pr from 0 to 10) was synthesized, to use synthesized samples in electrochemical applications, a step in fuel cells advancements. Ag2O(x)−PrO2(y)/γ-Al2O3/Glassy-Carbon was investigated for electrochemical oxidation of ammonia in alkaline medium and proved to be highly effective, having high potential utility, as compared to commonly used Pt-based electrocatalysts. In this study, gamma alumina as catalytic support was synthesized via precipitation method, and stoichiometric wt/wt.% compositions of Ag2O−PrO2 were loaded on γ-Al2O3 by co-impregnation method. The desired phase of γ-Al2O3 and supported nanocatalysts was obtained after heat treatment at 800 and 600 °C, respectively. The successful loadings of Ag2O−PrO2 nanocatalysts on surface of γ-Al2O3 was determined by X-rays diffraction (XRD), Fourier-transform Infrared Spectroscopy (FTIR), and energy dispersive analysis (EDX). The nano-sized domain of the sample powders sustained with particle sizes was calculated via XRD and scanning electron microscopy (SEM). The surface morphology and elemental compositions were examined by SEM, transmission electron microscopy (TEM) and EDX. The conductive and electron-transferring nature was investigated by cyclic voltammetry and electrochemical impedance (EIS). Cyclic voltammetric profiles were observed, and respective kinetic and thermodynamic parameters were calculated, which showed that these synthesized materials are potential catalysts for ammonia electro-oxidation. Ag2O(6)−PrO2(4)/γ-Al2O3 proved to be the most proficient catalyst among all the members of the series, having greater diffusion coefficient, heterogeneous rate constant and lesser Gibbs free energy for this system. The catalytic activity of these electrocatalysts is revealed from electrochemical studies which reflected their potentiality as electrode material in direct ammonia fuel cell technology for energy production.
1. Introduction
Energy generation from hydrogen in a sustainable and continuous manner is the foremost concern of scientists and engineers across the globe [1,2]. Fuel cells are considered to be a great contributor of energy production which changes the chemical energy to electrical energy through an electrochemical reaction in the cell [3,4,5]. Among several fuel cells, the ammonia fuel cell is a better substitute of carbon-based conventional energy generating technologies [6,7]. Liquid ammonia is a promising hydrogen carrier, owing to its favorable properties, like high storage capacity, hydrogen density (17.8 wt.%, 10.7 kg H2/100 L at 1 MPa and 298 K), carbon free fuel, high boiling point and odor; thus, the challenges associated with storage of hydrogen can be overcome [8]. Volumetric hydrogen density of ammonia is 1.5 times higher than pure hydrogen, because ammonia is effortlessly liquefiable at room temperature and 1 MPa [9]. Moreover, ammonia-derived electricity is under constant research for running gas turbines, steam turbines and alkaline fuel cells, which are being commercialized at lower-scale off-grid power plants [10,11]. However, the larger-scale implementation of ammonia fuel cells is currently hindered due to less efficient and much expensive electrodes [12]. A variety of electrode materials are being investigated for ammonia electro-oxidation in basic conditions [13,14,15]. Although Pt and Pt based materials are being employed as electrodes in ammonia fuel cells, due to sufficient catalytic significance, their industrial-scale applications still encounter critical challenges due to non-affordability [16,17]. Hence, development of novel Pt free cheaper electrodes is required as an alternative to accelerate ammonia fuel cells in energy generating technology [17]. Moreover, multiple factors affect the catalytic performance of electrodes towards ammonia electro-oxidation, including the nature of the support material and modifiers/promotor, as well as the synthesis conditions [18,19].
Gamma alumina (γ-Al2O3) is a highly used catalyst support, owing to its worthy mechanical properties, high thermal stability and ability to disperse the active oxide precursors [20,21]. Moreover, the introduction of metal oxides into γ-Al2O3 support is found to promote the catalyst’s efficiency towards electro-oxidation processes [22,23,24]. With this intent, Ag2O is used as a catalyst promotor in several oxidation processes [25,26]. Furthermore, lanthanide and lanthanide oxides seemed to be efficient promotors, exhibiting enhanced catalytic activity in many electro-oxidation processes [20]. Therefore, catalytic materials based on praseodymium oxide and praseodymium containing mixed metal oxides of high-surface area also provide efficient energy production [27]. Moreover, mixed metal oxides, including sieves supported metal oxides and bulk mixed metal oxides, have experienced an intense paradigm in electrocatalysis over the past few years [28,29,30].
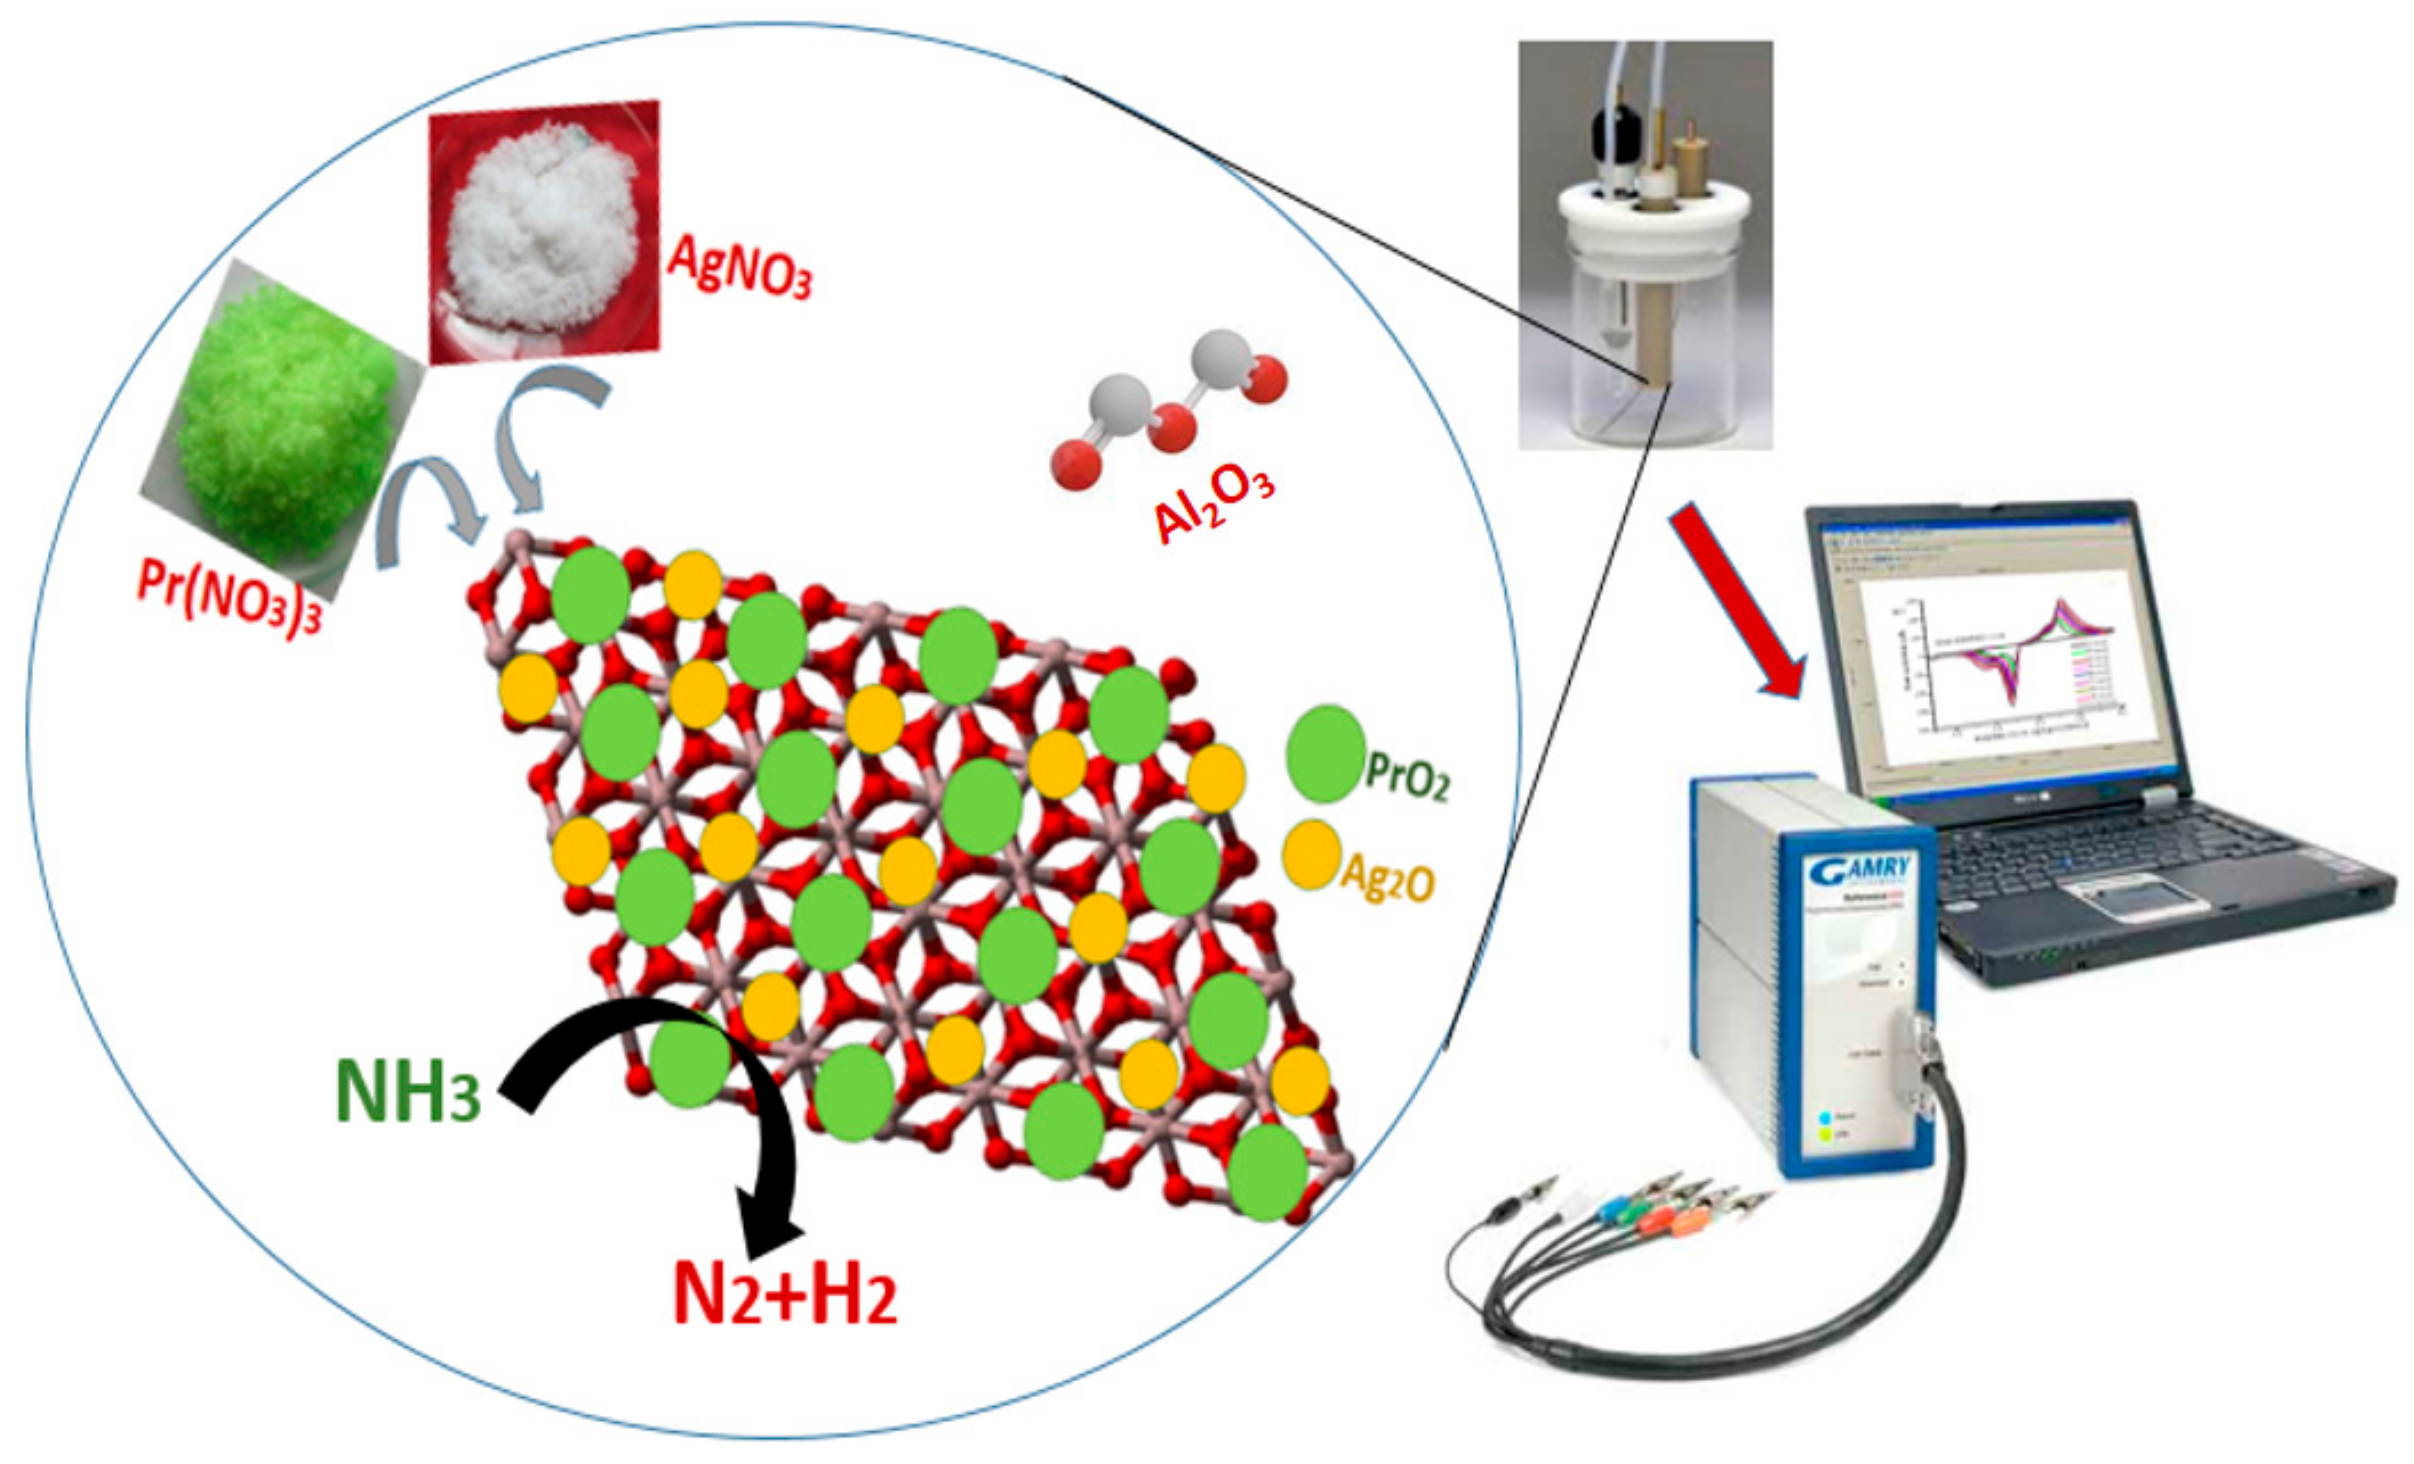
Herein, a series of novel mixed metal oxides Ag2O−PrO2/γ-Al2O3 electrocatalysts were prepared by an incipient wet impregnation method. The aim of present research was to observe the effect of variation in percentage composition of PrO2 and Ag2O supported on γ-Al2O3 towards ammonia electro-oxidation. Physical and electrochemical properties of as-synthesized catalysts were investigated for NH3 electro-oxidation via different techniques, i.e., XRD, FTIR, SEM, EDS, EIS and cyclic voltammetry. Figure 1 shows the schematic diagram for experimental procedure of electro-oxidation of ammonia over as synthesized electrocatalysts.
2. Catalyst Preparation
2.1. Materials
Chemicals used for synthesis were bought from Sigma Aldrich (St. Louis, MO, USA). The chemicals used for the present work are aluminum nitrate (Al(NO3)3·9H2O), ammonia solution (NH3), praseodymium nitrate hexahydrate (Pr(NO3)3·6H2O), silver nitrate (AgNO3), potassium hydroxide (KOH), sulfur acid (H2SO4), potassium hexacyanoferrate (III) (K4[Fe(CN)6]), alumina powder and Nafion.
2.2. Synthesis of γ-Al2O3
In total, a 1 M solution of aluminum nitrate nonahydrate and a 3 M ammonia solution were prepared in deionized water. The ammonia solution was added dropwise into precursor solution, under constant stirring until formation of homogeneous precipitates of aluminum hydroxide. The temperature of solution was maintained at 60 °C. White gelatinous Al(OH)3 precipitates were formed and were kept on heating, until semi-solid material was formed. The precipitates were dried at 200 °C overnight. The Al(OH)3 precipitates were calcined at 800 °C, to form γ-alumina, for 2 h. The calcined sample was grinded with acetone, to form powdered γ-alumina.
2.3. Synthesis of Ag2O–PrO2/γ-Al2O3
The metal oxides composites catalysts were prepared via co-impregnation method. In this method, the solution of active element precursors was mixed before impregnating on support. We used an adapted method to synthesize the wt/wt.% alumina supported composites of silver and praseodymium oxides. Stoichiometric amounts of γ-alumina were taken and wetted with requisite volume of praseodymium nitrate hexahydrate 0.5 M and silver nitrate 0.5 M to load wt/wt.% Ag-Pr oxides. The mixtures were soaked overnight, evaporated and dried at 100 °C. The dried samples were calcined at 600 °C, for 2 h, and finely ground to Ag2O−PrO2/γ-Al2O3 catalysts.
3. Physical Characterization
3.1. X-Ray Diffraction Analysis
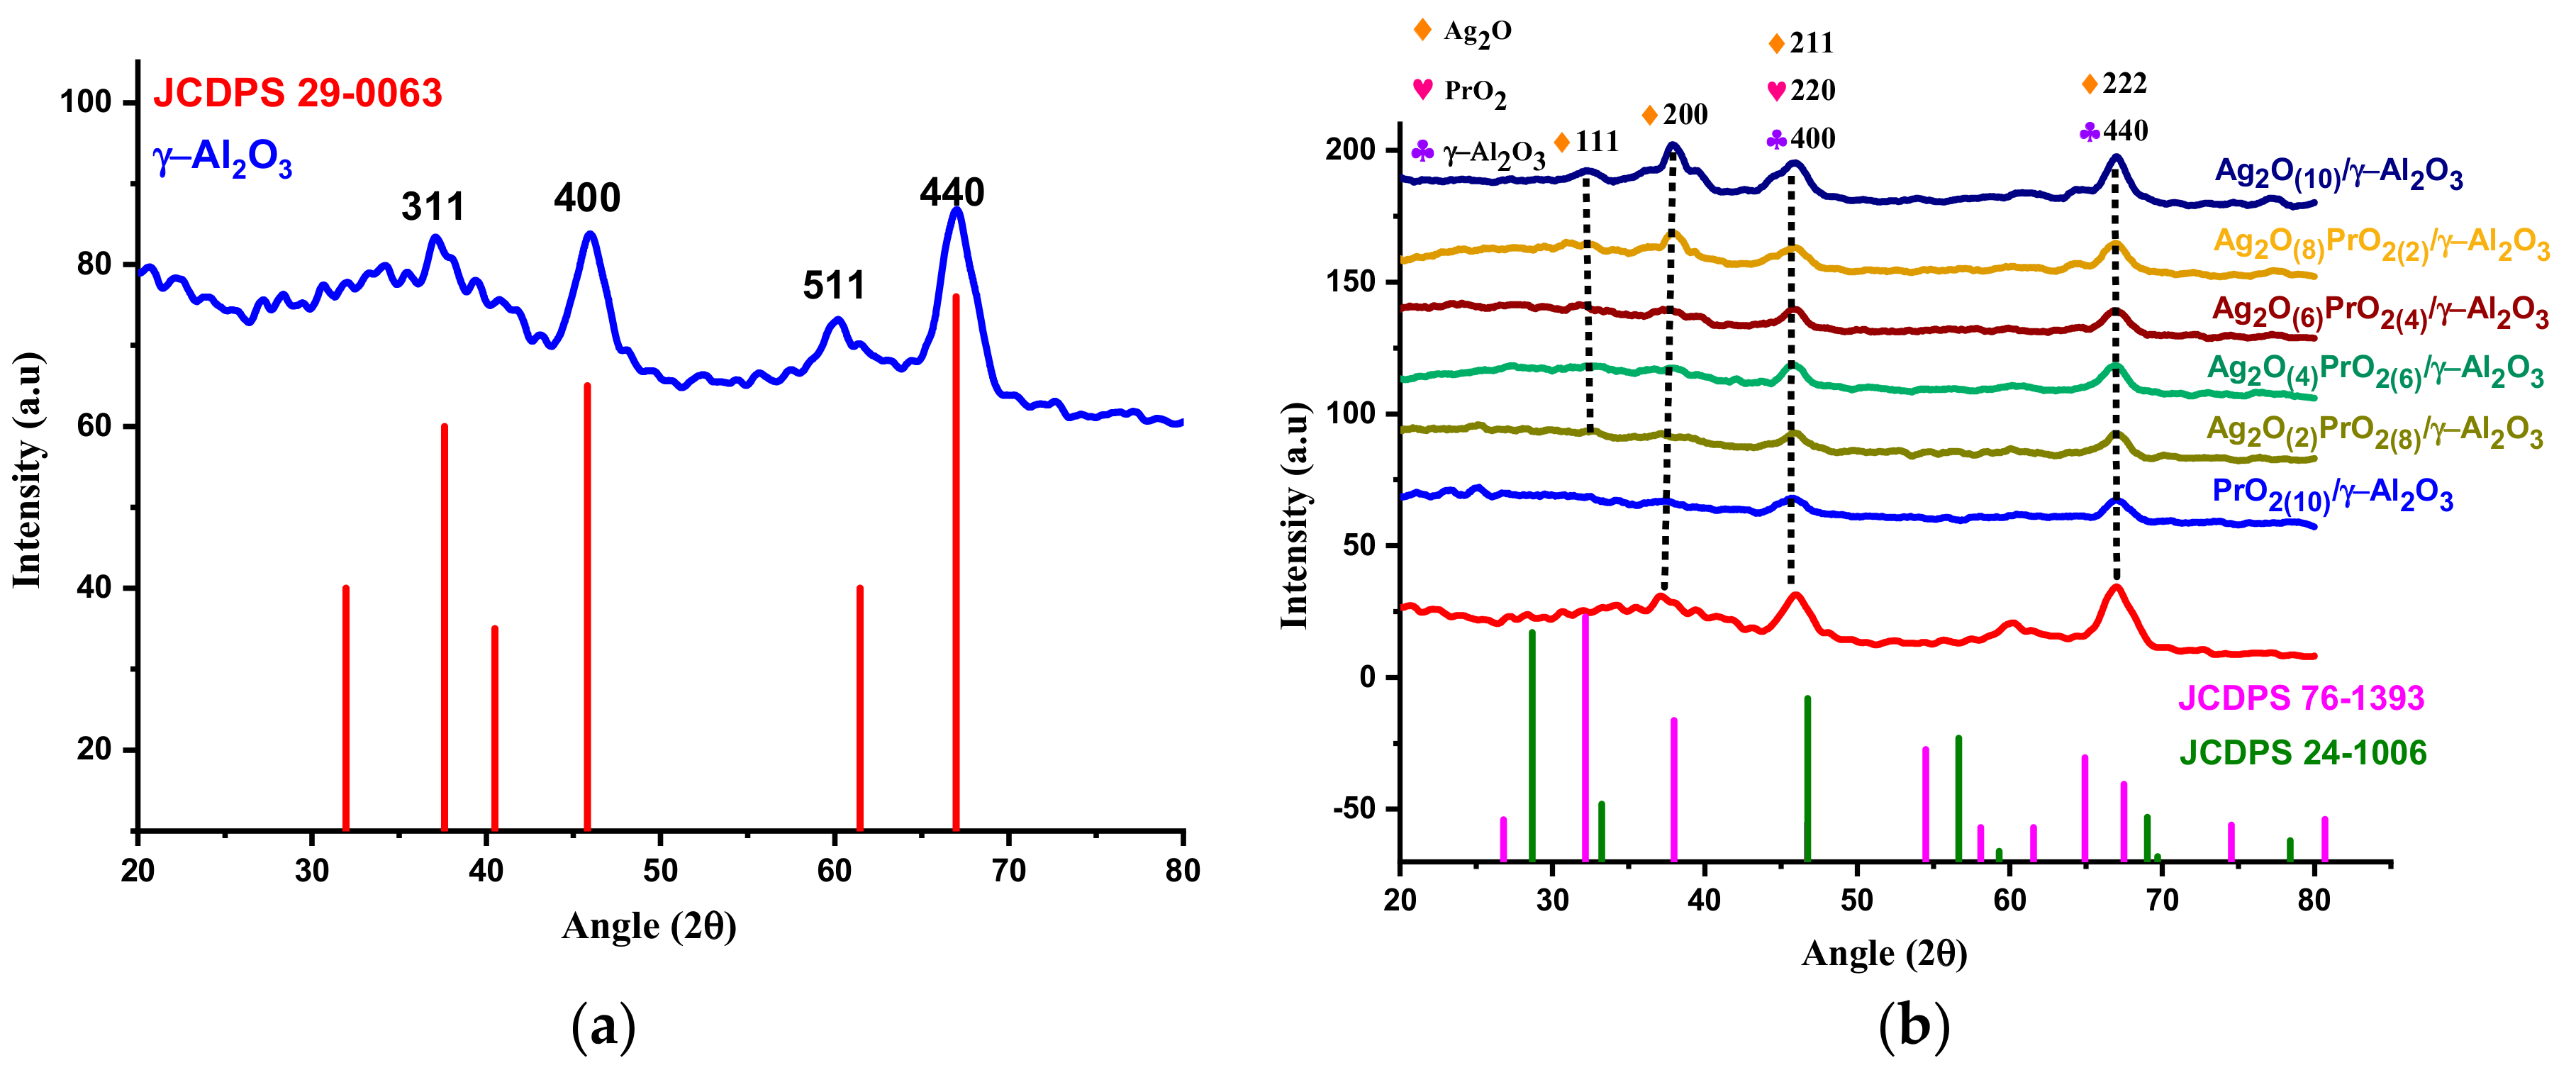
The size and phase of all synthesized materials (Ag2O(X)–PrO2(Y)/γ-Al2O3) were examined by X-ray diffraction using (PANalytical X’PERT High Score’s diffractometer, Malvern, UK), exhibiting Cu Kα radiation, works in the range of (10°–80°) Figure 2a,b. The peaks observed at 2θ of 37.0°, 40.20°, 45.78°, 61.30° and 66.99° were assigned to 311, 222, 400, 511 and 440 crystal planes. These are according to JCPDS (Joint Committee on Powder Diffraction Standards) card no. (29-0063) [31,32]. The gamma phase of synthesized alumina calcined at 800 °C is suggested by these peak positions. The XRD corroborate the characteristic peaks of Ag2O (26.78°, 32.14°, 38.04° and 67.48°), PrO2 (28.1°, 46.7°, 55.6° and 78.2°) and γ-Al2O3, which are related to JCPDS card no. (76-1393), (24-1006) and (29-0063), respectively [33,34]. The diffraction peaks at 67.48° are indexed to (222) planes of face-centered cubic silver oxide [35]. These peaks correspond to the successful loadings of promoting metal oxides on surface of support. Crystallinity of the catalysts increases with increasing the contents of silver oxide precursor on the γ-Al2O3 support as sharper peaks are observed with higher loadings of Ag2O. No phase segregation is observed as obvious from XRD patterns.
The average crystallite sizes (Davg), which are enlisted in Table 1, were calculated by the Scherrer equation [36]:
where Davg is the average crystallite size, constant k is shape factor (0.9), λ is the wavelength (0.154 nm), β corresponds to the peak width at half maximum intensity and θ is the peak position. Davg for support (γ-Al2O3) is 18.3 nm, while for nanomaterials, it lies is in the range of 25–42 nm.
Davg (nm) = 57.2kλ/βcosθ
3.2. FTIR Analysis
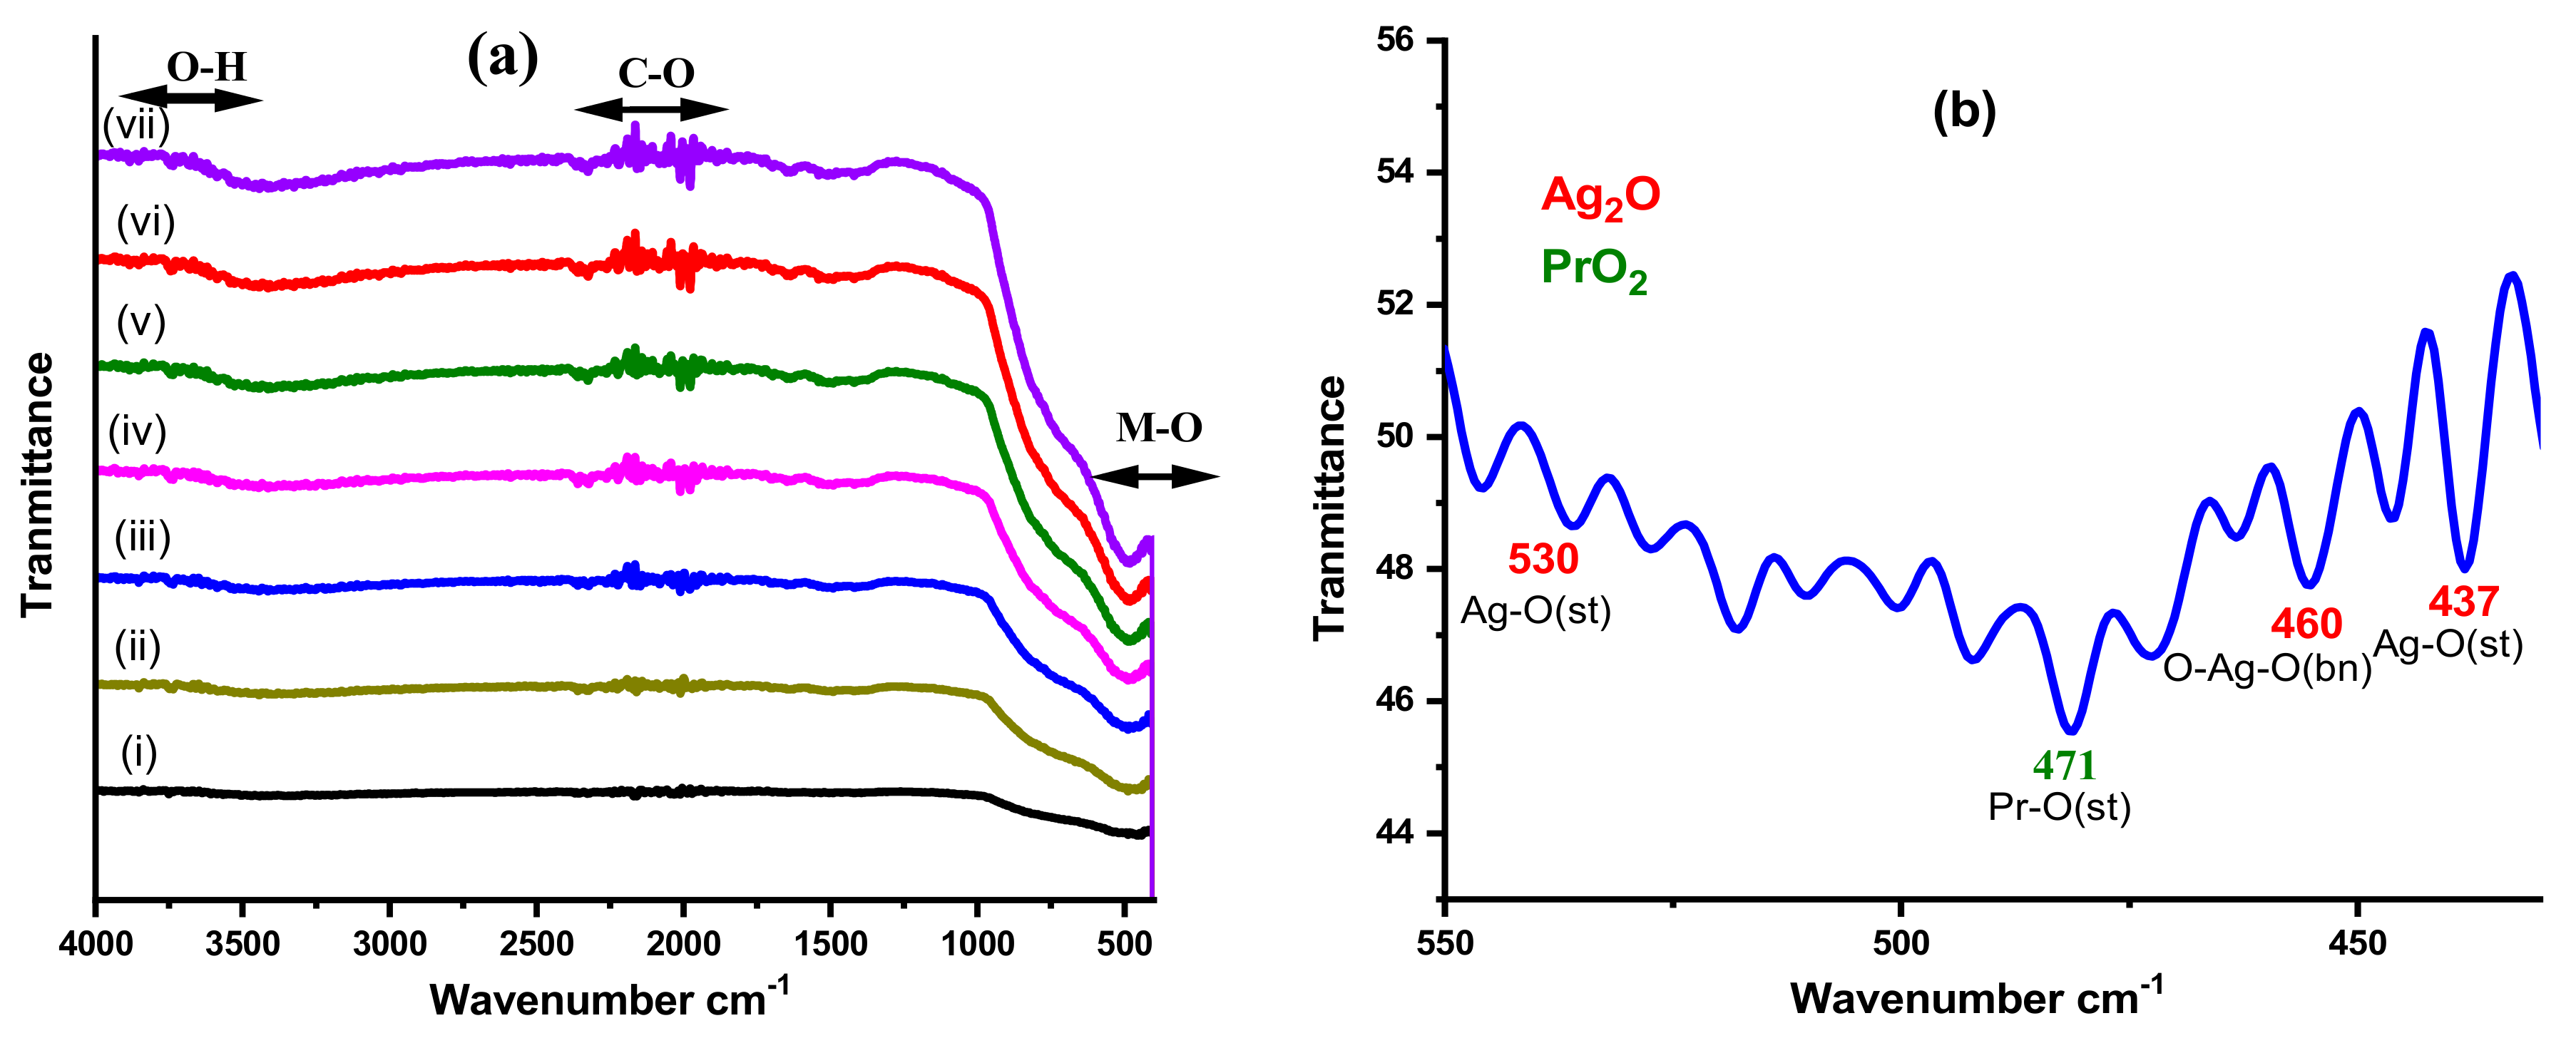
The Fourier-transform infrared spectroscopy (FTIR) spectra for γ-Al2O3 and all synthesized nanocomposites inserted in KBr powder system were investigated in wavelength range (400–4000) cm−1 by using Nicolet 5PC, Nicolet Analytical Instrument (Protea, Cambridgeshire, UK, Figure 3). The vibration bands observed in the range of (3500–4000) cm−1 correspond to O–H stretching vibrations. These bands appeared because of moisture absorbed by the samples [37]. C–O vibration bands due to adsorbed CO2 also appeared in the range of (1500–2500) cm−1 [38]. The metal oxides vibration bands are seen between 300 and 700 cm−1 [39]. The bands in Figure 3b represent the stretching and bending vibration modes of Ag2O [40] and stretching vibration bands of PrO2 [41].
3.3. SEM, TEM and EDX Analysis
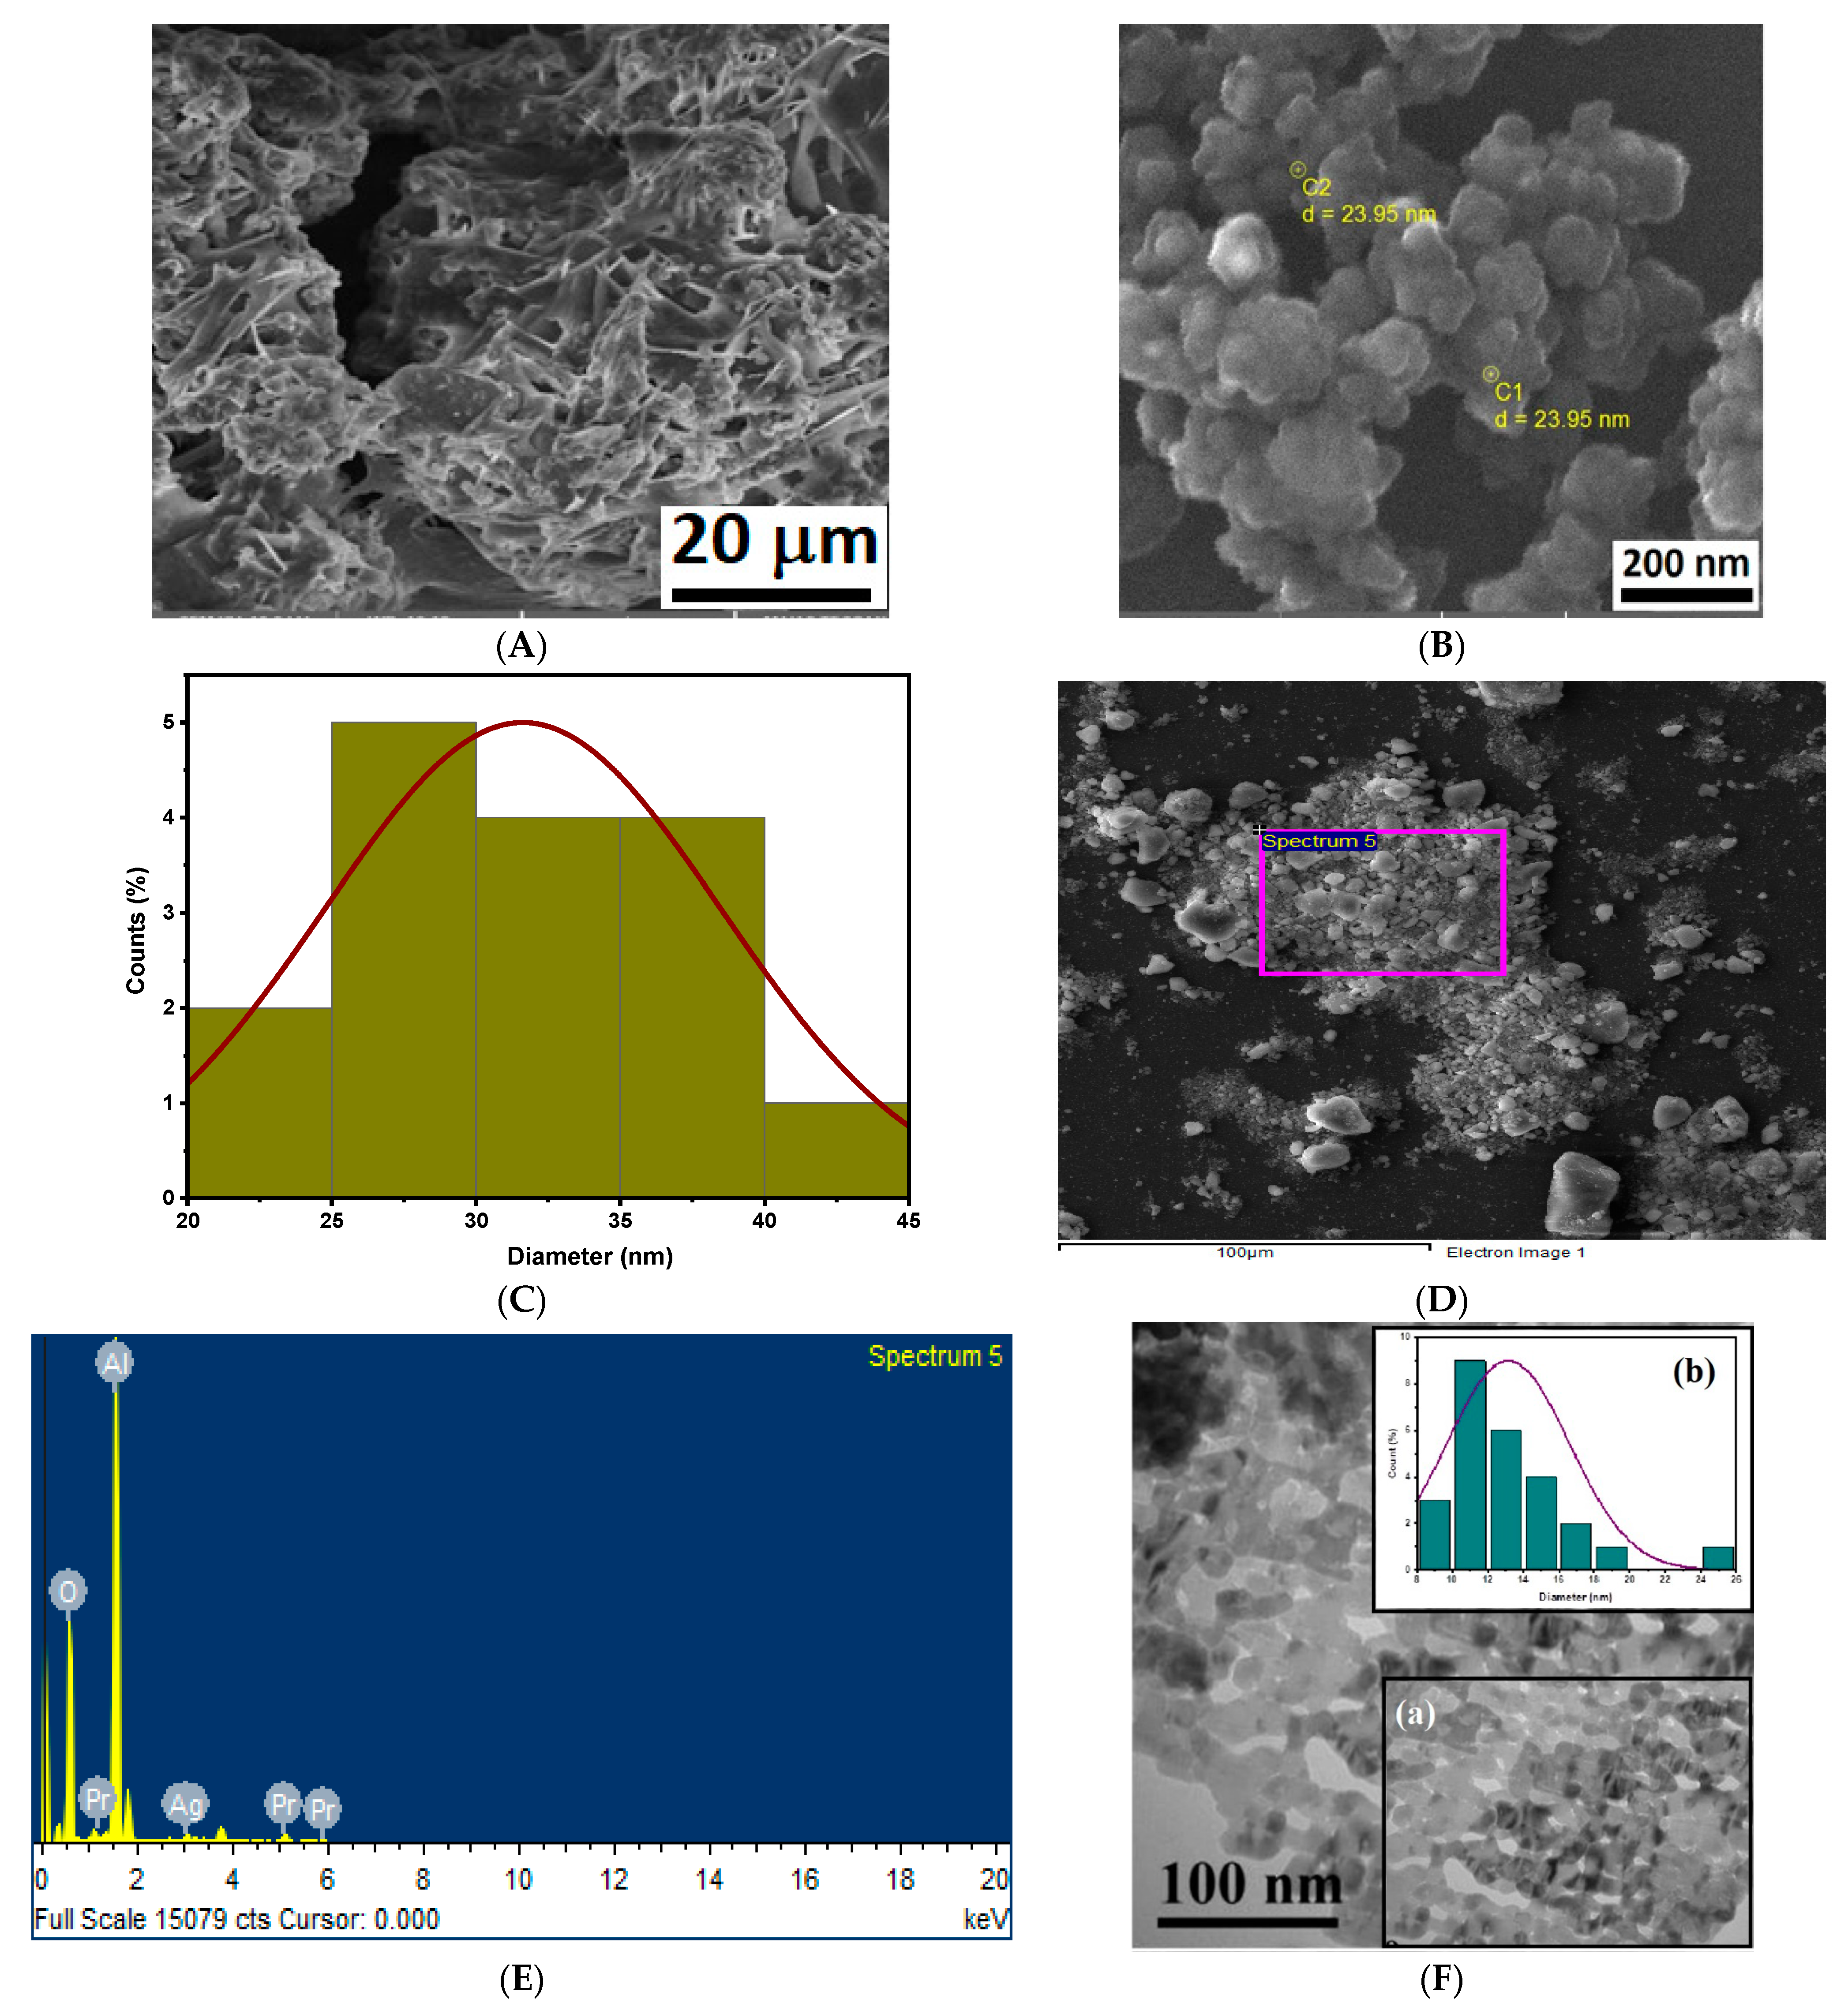
Surface structure investigation of the nanomaterials was evaluated via scanning electron microscopy (SEM), armed with energy dispersive analysis (EDX), by using MIRA3 TESCAN (Brno, Czech Republic) microscope and transmission electron microscopy (TEM, Thermofisher, Manchester, UK). The SEM images for synthesized nanocomposites are given in figures on different scales. In Figure 4A, the first SEM micrograph corresponds to pure γ-Al2O3, which appeared to be like a plate-like interconnected network, which, upon impregnation, converted to globular structures. From Figure 4B, it is clear that there is no segregation of phase, which substantiates that metal oxide precursors are homogeneously dispersed on surface of support. The average particle size from these SEM micrographs was estimated by using the ImageJ software (Version: 1.52v) and is tabulated in Table 1. Figure 4D represents the distributions of diameters of nanoparticles (Ag2O(6)–PrO2(4)/γ-Al2O3) via histograms presenting the Davg. The estimated average particle sizes from SEM are also in dimensions and slightly in accordance with that calculated by XRD. Figure 4C,D represents the EDX spectra of Ag2O(4)–PrO2(6)/γ-Al2O3 composition which confirms the presence of desired components in synthesized nanomaterial. These EDX analyses are in accordance with XRD, as we have not seen any extra peak in XRD diffraction pattern. The wt/wt.% elemental composition of all supported nanocomposites is given in Table 2.
The Transmission Electron Microscopy (TEM) analysis in Figure 4F showed that nanocomposites are in good contact with the surface of support and have nanosized morphology also shown by SEM micrographs. The TEM images supported the agreement that particles are closed spheres with a smooth surface and are uniform in size. There is a low contrast shell around them that is attributed to the layer of silver oxides [42]. The histogram in inset (b) of Figure 4F describes the distribution of nanoparticles presenting the synthesized materials that are nanosized, and inset (a) describes the area of TEM micrograph where distributions of particles are taken.
4. Electrochemical Characterization
An electrochemical study of the as-prepared electrocatalysts was performed, using Gamry potentiostat interface 1000 (Gamry, Warminster, PA, USA). A three-electrode system was established by modifying glassy carbon (GC) as working electrode, platinum wire as counter electrode and Ag/AgCl (3 M KCl) as reference electrode. The glassy carbon (GC) electrode was first polished by using alumina slurry and then cleaned with ethanol, prior to pouring the catalyst ink prepared in ethanol, and a solution of 5% Nafion (2.0 μL) was added to catalyst, to bind the powder catalyst at the GC surface. We used 5% Nafion as binders, as it has greater stability over others polymer. It also helps in the passivation of surface from by-products formed during reactions, to protect the catalyst from chemical attack [43].
4.1. Estimation of Electrochemical Surface Area (ECSA) of As-Synthesized Electrocatalysts
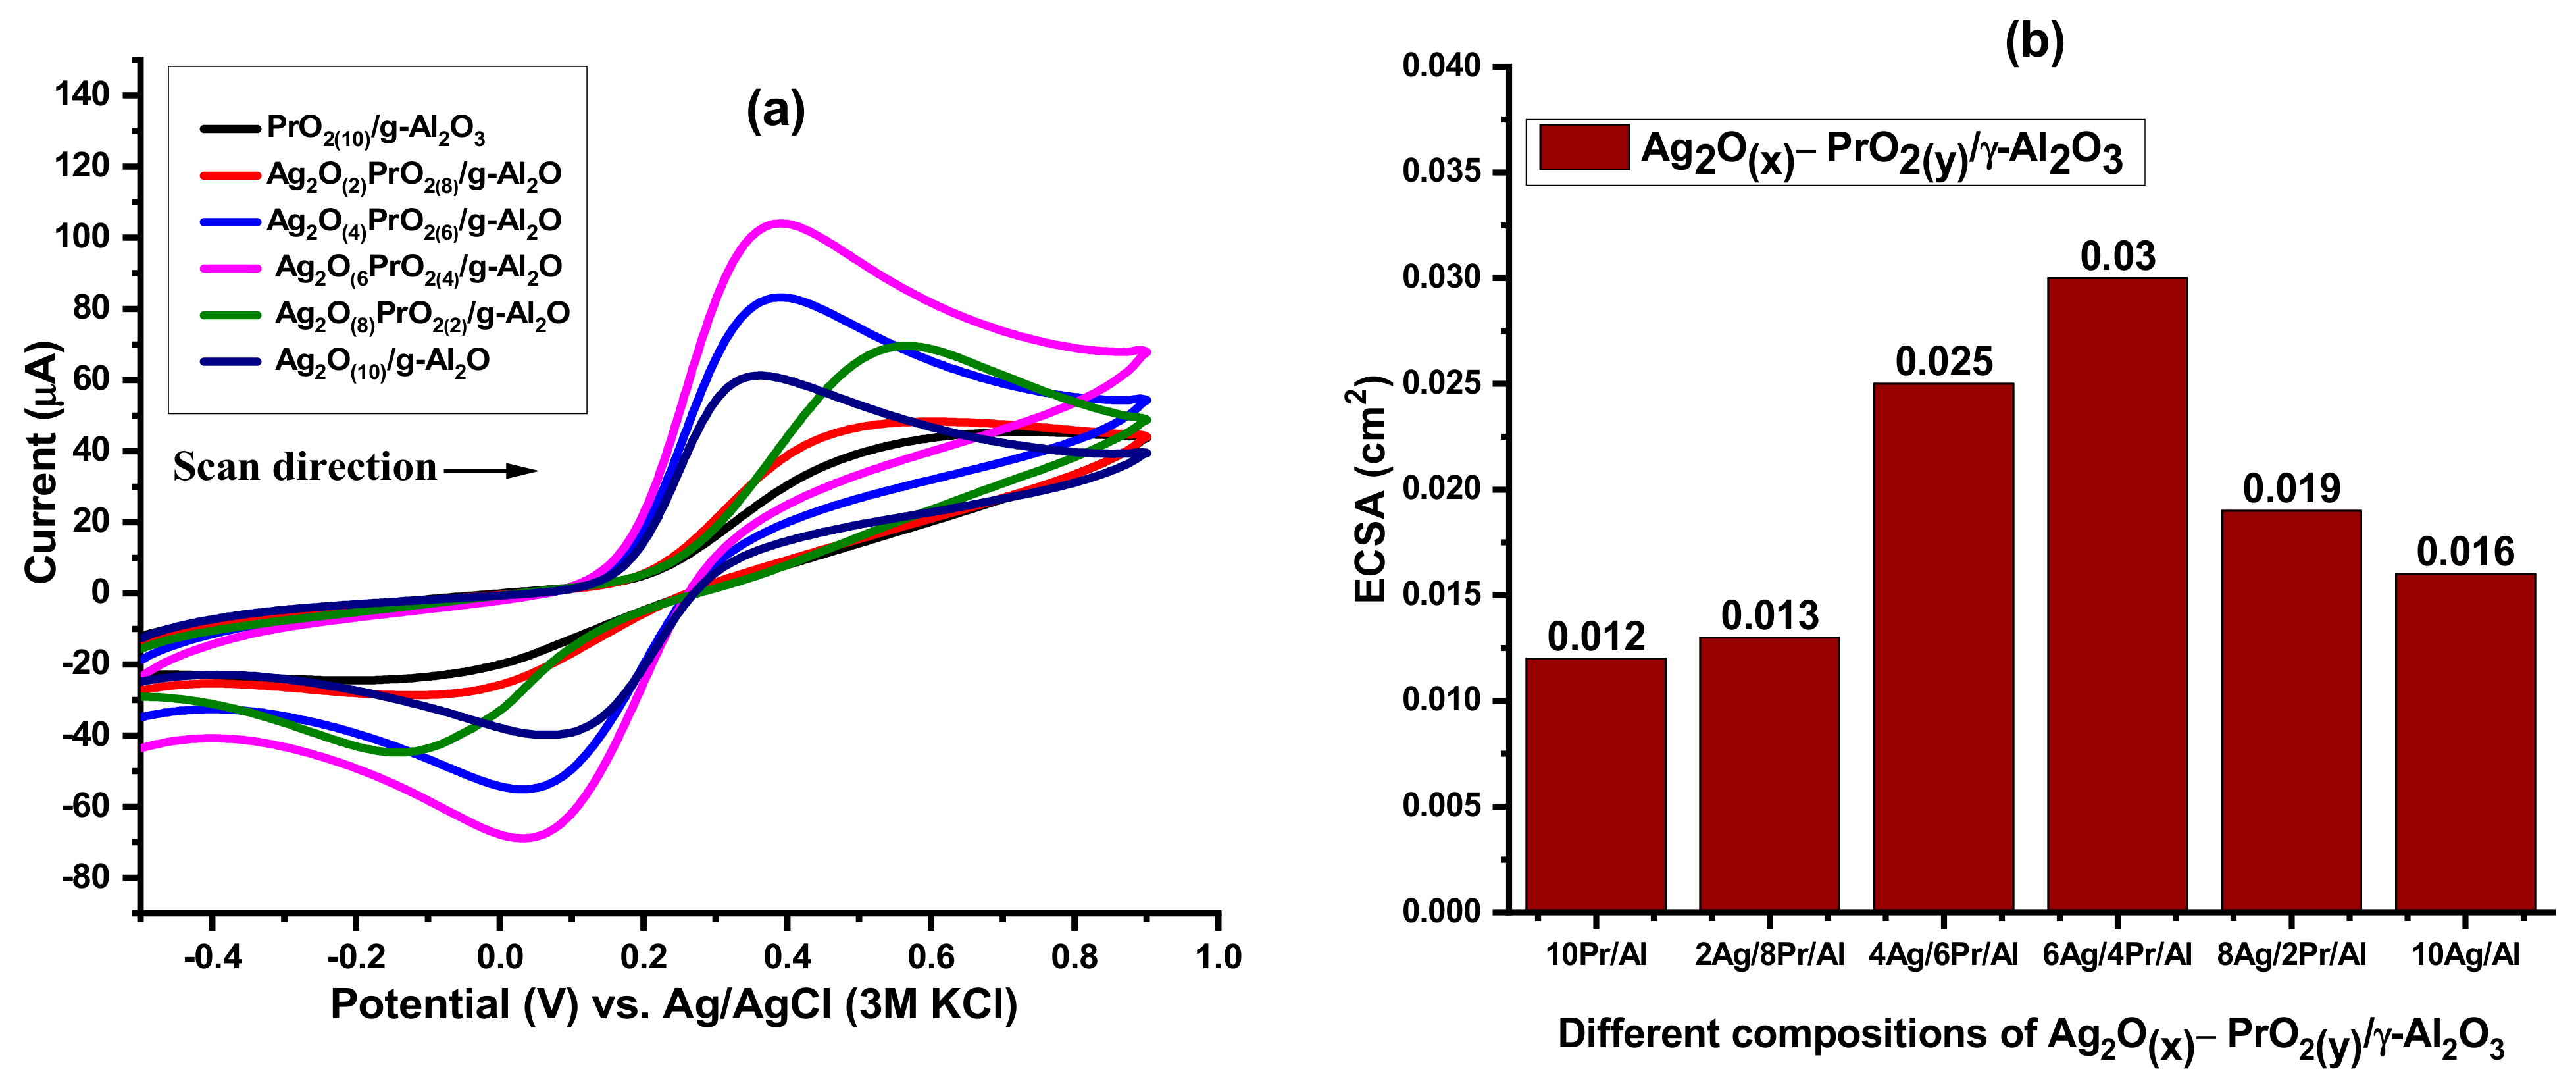
Electrochemical active surface area (ECSA) of Ag2O–PrO2/γ-Al2O3 samples was estimated by cyclic voltammetric profile, using a redox couple having 5 mM potassium ferrocyanide in 3 M KCl, as shown in Figure 5a. The peak current responses at various scan rates are plotted against ν1/2, applying the Randles–Ševčík equation [44]:
where, A is ECSA (cm2); Ip is peak current (µA); n represents the number of electrons transferred (1 in this case); Do is the diffusion co-efficient, which is 0.76 × 10⁻⁵ cm2·s−1 at standard temperature and pressure (S.T.P); and C is the concentration of K4[Fe(CN)6]. Corresponding ECSA values are calculated from slope, and the comparative ECSA for the whole series is presented in Figure 5b. The Ag2O(6)–PrO2(4)/γ-Al2O3 modified electrode has a greater ECSA value, as compared to other modified electrodes, which means this composition provides greater surface area to catalyze the respective reaction on its surface and facilitates the reaction more efficiently.
Ip = 2.69 × 10⁵·n3/2·A· (Do)1/2·ν1/2·C
4.2. Electrochemical Impedance Spectroscopy EIS
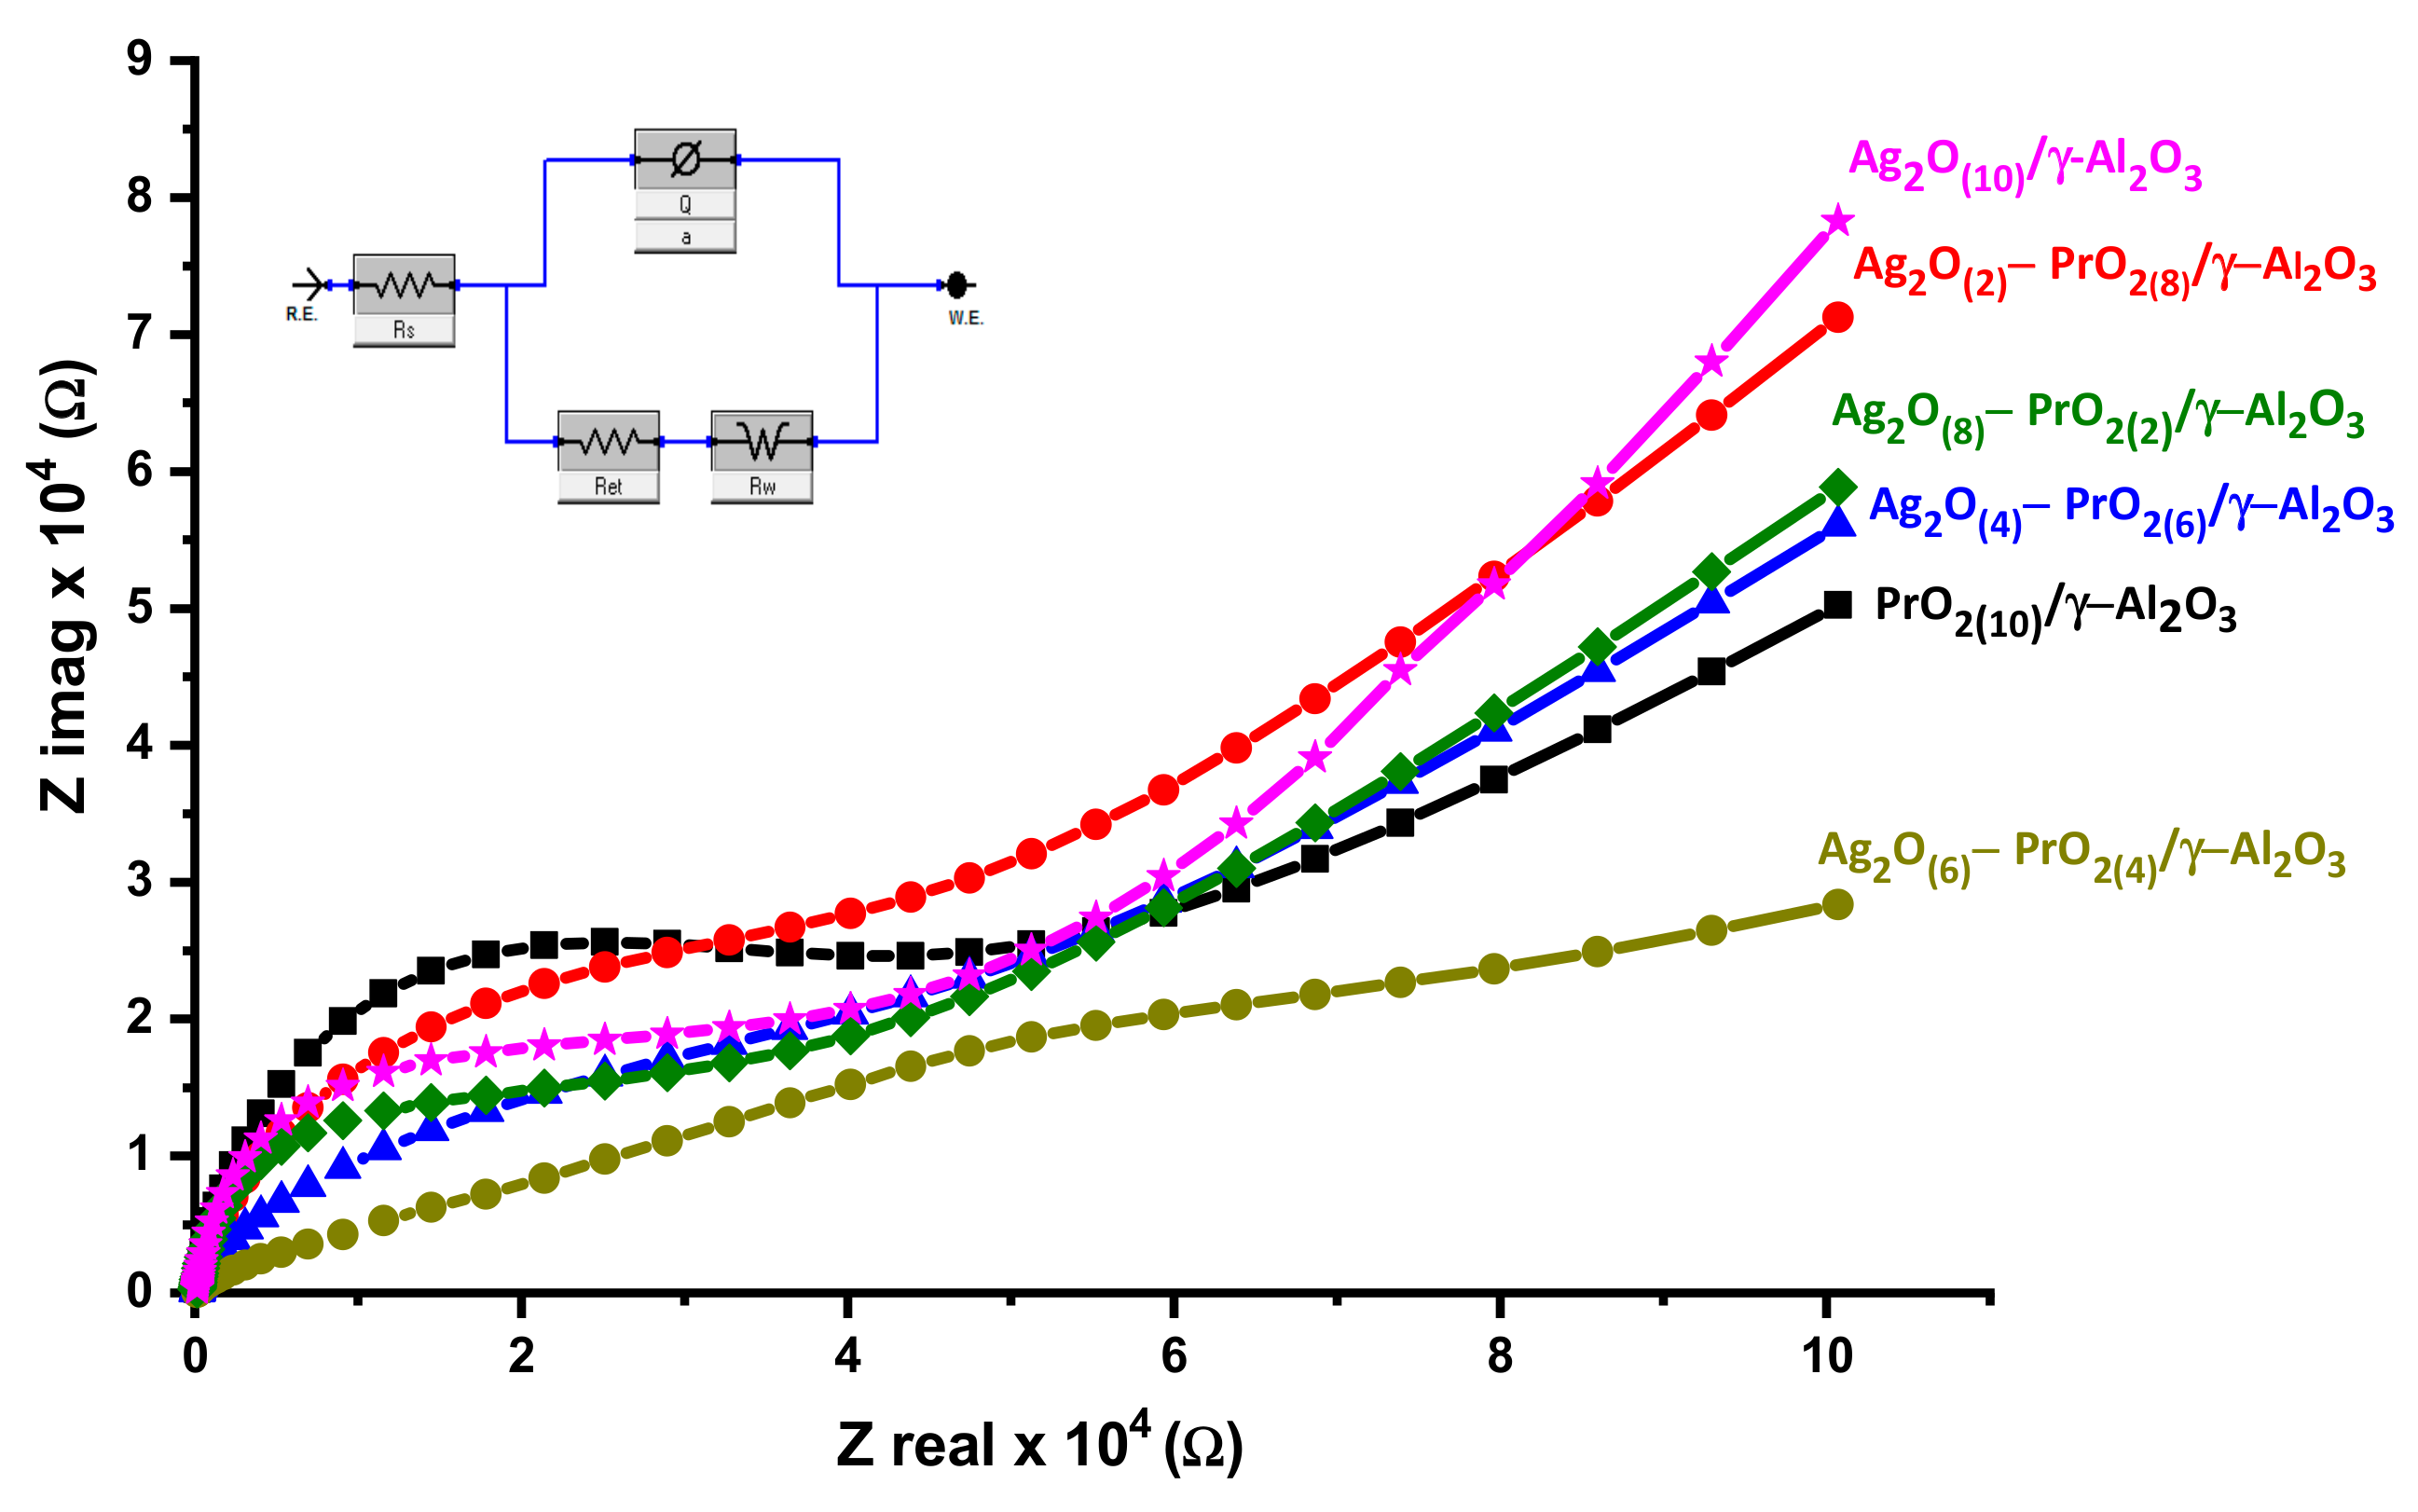
The electron transfer capacities of all modified electrodes were inspected via EIS with Fe2+/Fe3+ system in 0.1 M KOH. The Nyquist plots observed for Ag2O(X)–PrO2(Y)/γ-Al2O3 modified electrodes are presented in Figure 6, and respective EIS parameters are tabulated in Table 3. The electron transfer resistance systematically reduced from composition (Ag:Pr 0:10) to (Ag:Pr 6:4), and then it increased with increase of Ag content, which endorses that 6:4 wt.% ratio of Ag2O and PrO2 on alumina surface is optimum for electrochemical applications. The low value of Rct reflects the greater conductivity and electrocatalytic activity of Ag2O(6)–PrO2(4)/γ-Al2O3, as compared to other compositions. The variation in electrochemical behavior of all modified electrodes is due to relative ease in electron transferring, which reveals that nanocatalysts are well dispersed on the alumina surface, in the case of Ag2O(6)–PrO2(4)/γ-Al2O3, as compared to the other compositions.
The modification of electrodes has no effect on solution resistance (Rs) and Warburg resistance (Rw), as these are characteristics of electrolyte solution and diffusion of electroactive specie (which are the same in all measurements), while charge transfer resistance (Rct) and constant phase element (CPE) are affected by modification of electrodes, because these are related to conductive properties of the active material. CPE constitutes two elements, and Q and α represent capacitance and surface roughness, respectively. The value of α varies from 0 to 1 [45]. The modified electrode systems have α value ranging from 0.85 to 0.92, revealing that catalysts show fair surface roughness, which agrees with the SEM results. The electron transfer rate constant for all modified system was calculated by Equation (3) [46].
kapp = RT/F2·Rct·C
Where kapp is electron transfer rate constant, F is Faraday’s constant and R is universal constant in SI units.
It can be seen from Table 2 that the value of electron transfer rate constant for Ag2O(6)–PrO2(4)/γ-Al2O3 is higher than the other series materials, showing its higher capacity to facilitate the reaction.
5. Results and Discussion
5.1. Ammonia Electro-Oxidation at Ag2O(x)–PrO2(y)/γ-Al2O3 Modified GC Electrodes
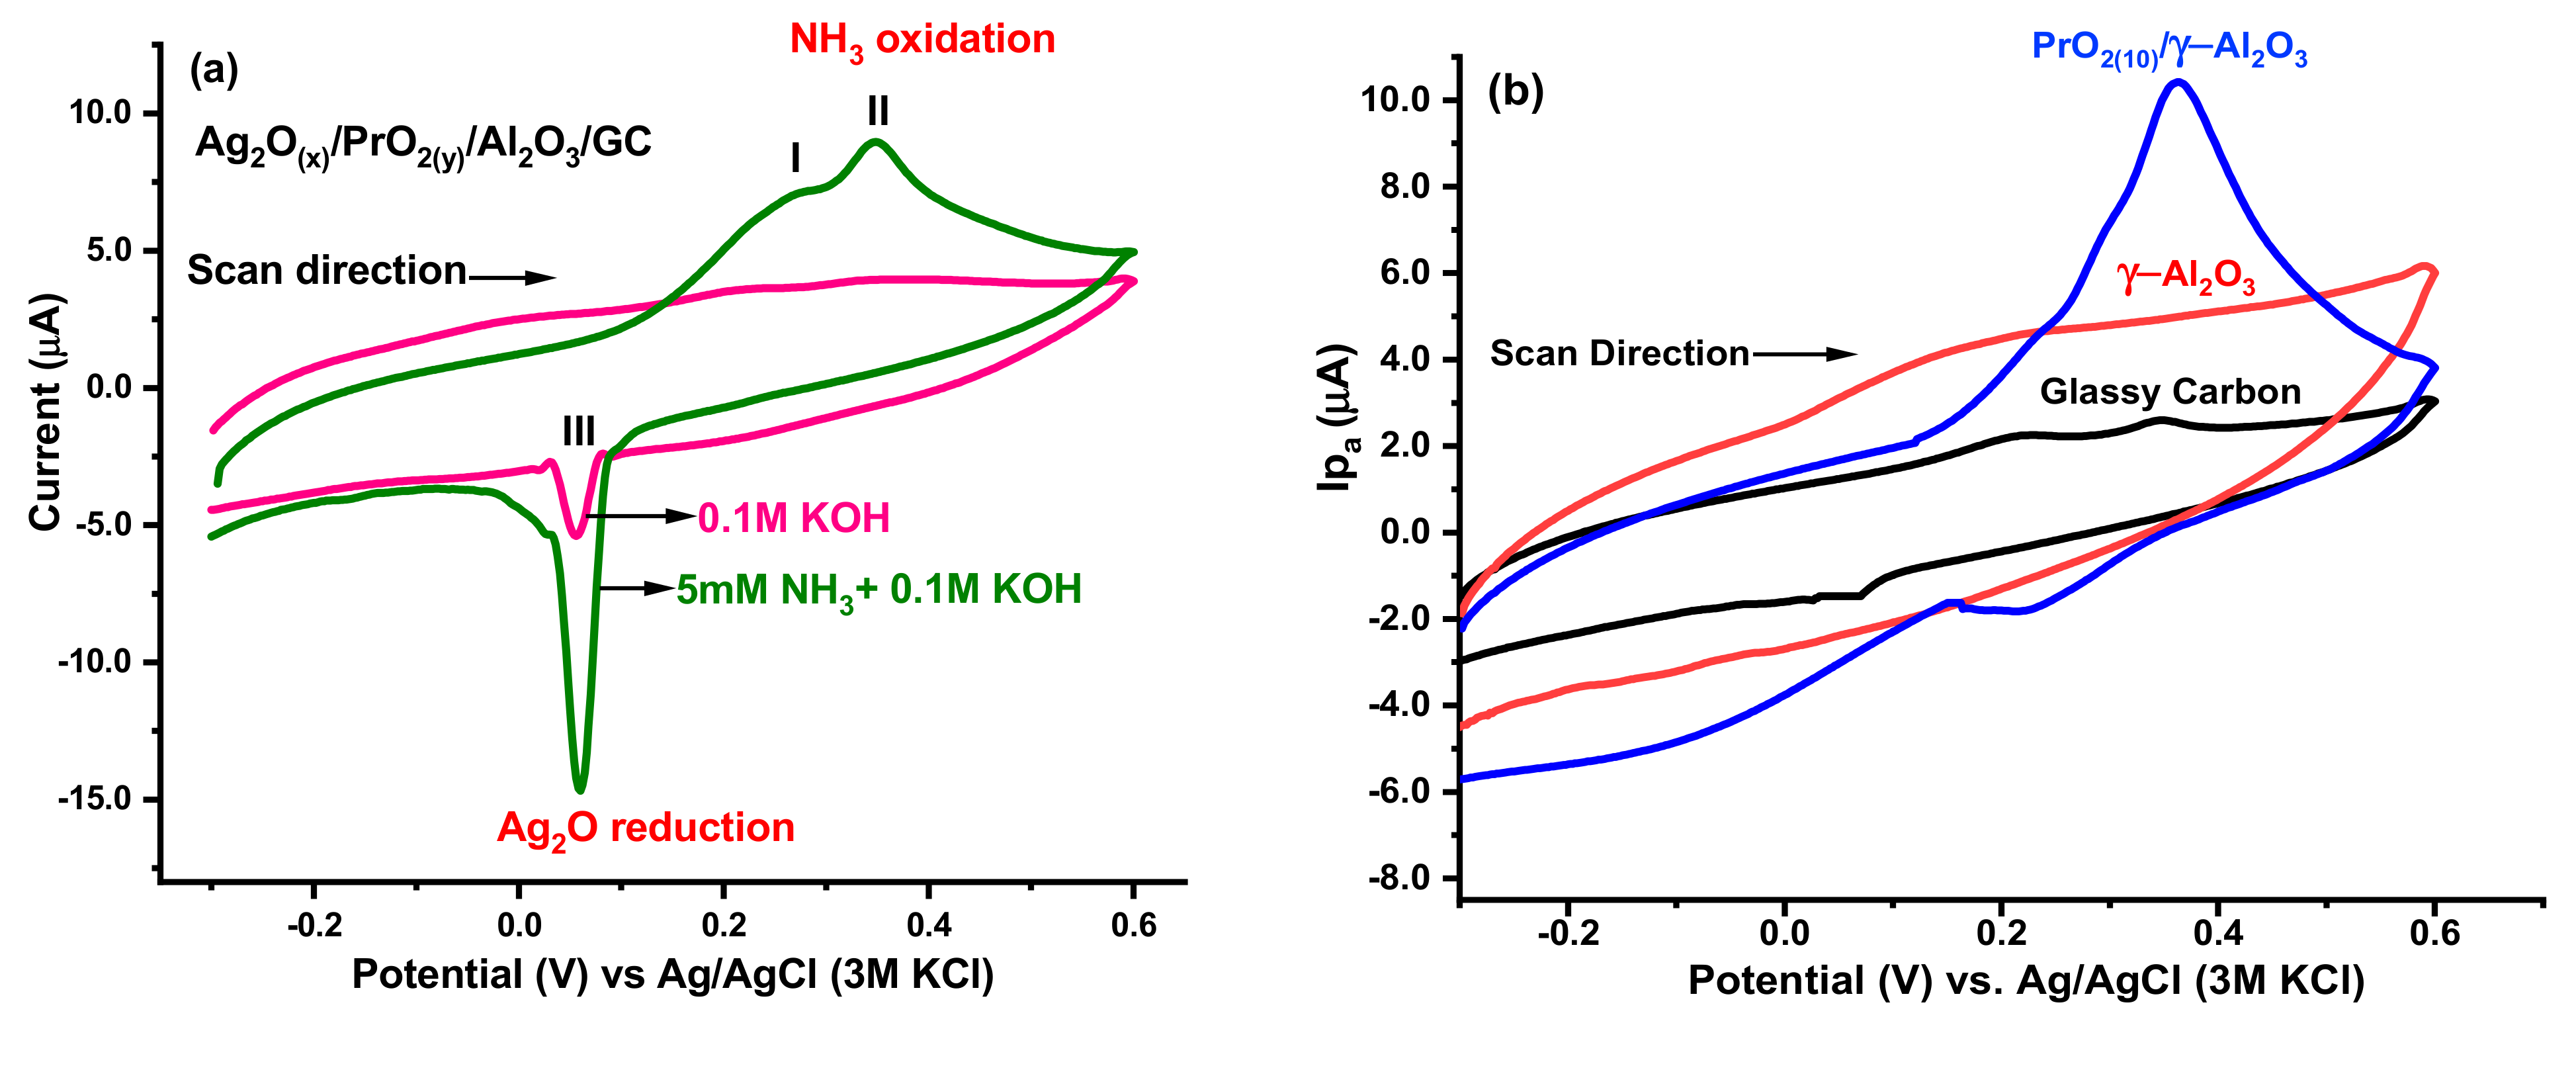
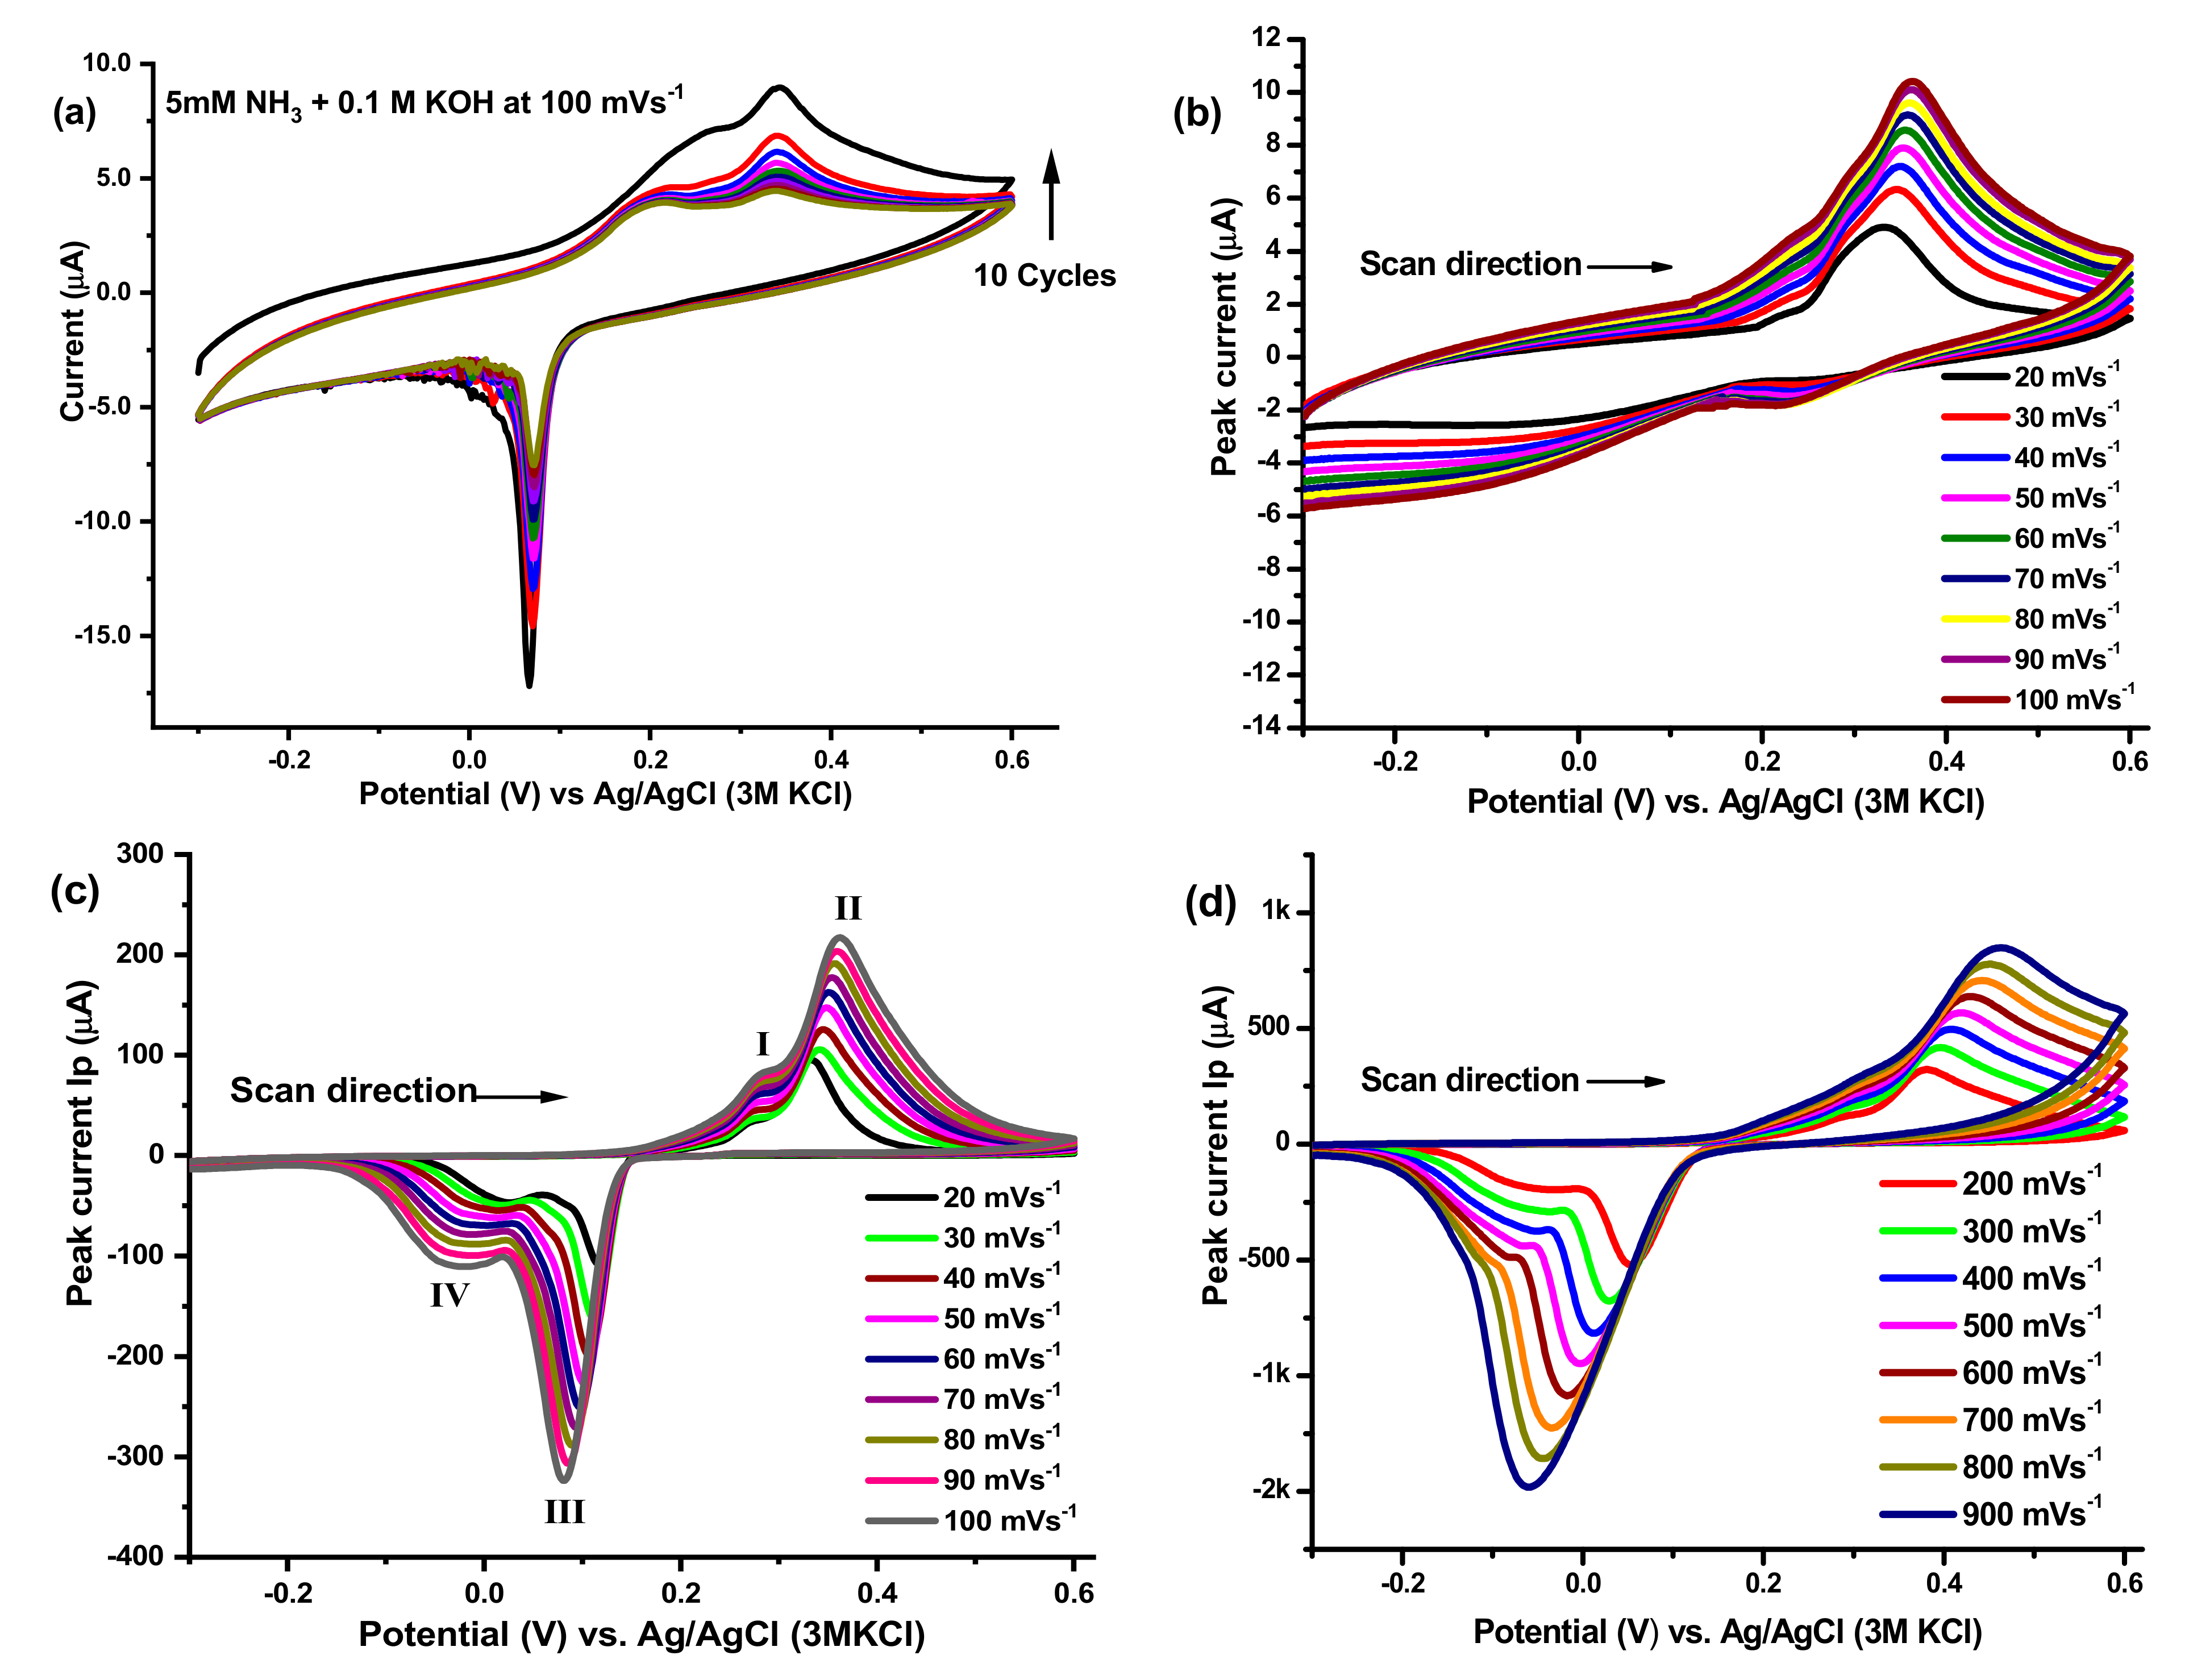
As-synthesized nanocomposites Ag2O(x)–PrO2(y)/γ-Al2O3 were investigated to check their activities towards the oxidation of NH3 in alkaline medium. The potential window for ammonia oxidation was from −0.3 to 0.6 mV, in forward and reverse scan. When ammonia oxidation was carried out on modified electrodes at room temperature, two anodic peaks were observed which are related to adsorption/oxidation of ammonia in positive going scan (I and II) Figure 7a. A strong cathodic peak (III) is observed at around 0.05 volts, in the absence (pink curve) and presence (green curve) of ammonia, which is the reduction peak of silver oxide converted into metallic silver [47,48]. An anodic shoulder peak (I) appearing at 0.23–0.27 V is due to the oxidation of pre-adsorbed hydrogen/nitrogen-containing intermediates species at the surface of modified electrode, which shows the structural sensitivity of nanocatalysts for these adsorbed species [49,50]. There is appearance of cathodic shoulder peak (IV) in ammonia oxidation catalyzed on the surface of higher members of synthesized series (Figure 8c,d), which is due to desorption of hydrogen on the surface [50]. With higher scan rates, the anodic and cathodic shoulder peaks diminished. The onset potential for ammonia oxidation is 0.03 V vs. Ag/AgCl (i.e., 0.023 V vs. NHE approximately) on the surface of modified electrodes and the oxidation peak appear in the range of 0.32–0.51 volts, which is a low input potential range, as compared to reported systems illustrated in Table 4, in the same medium.
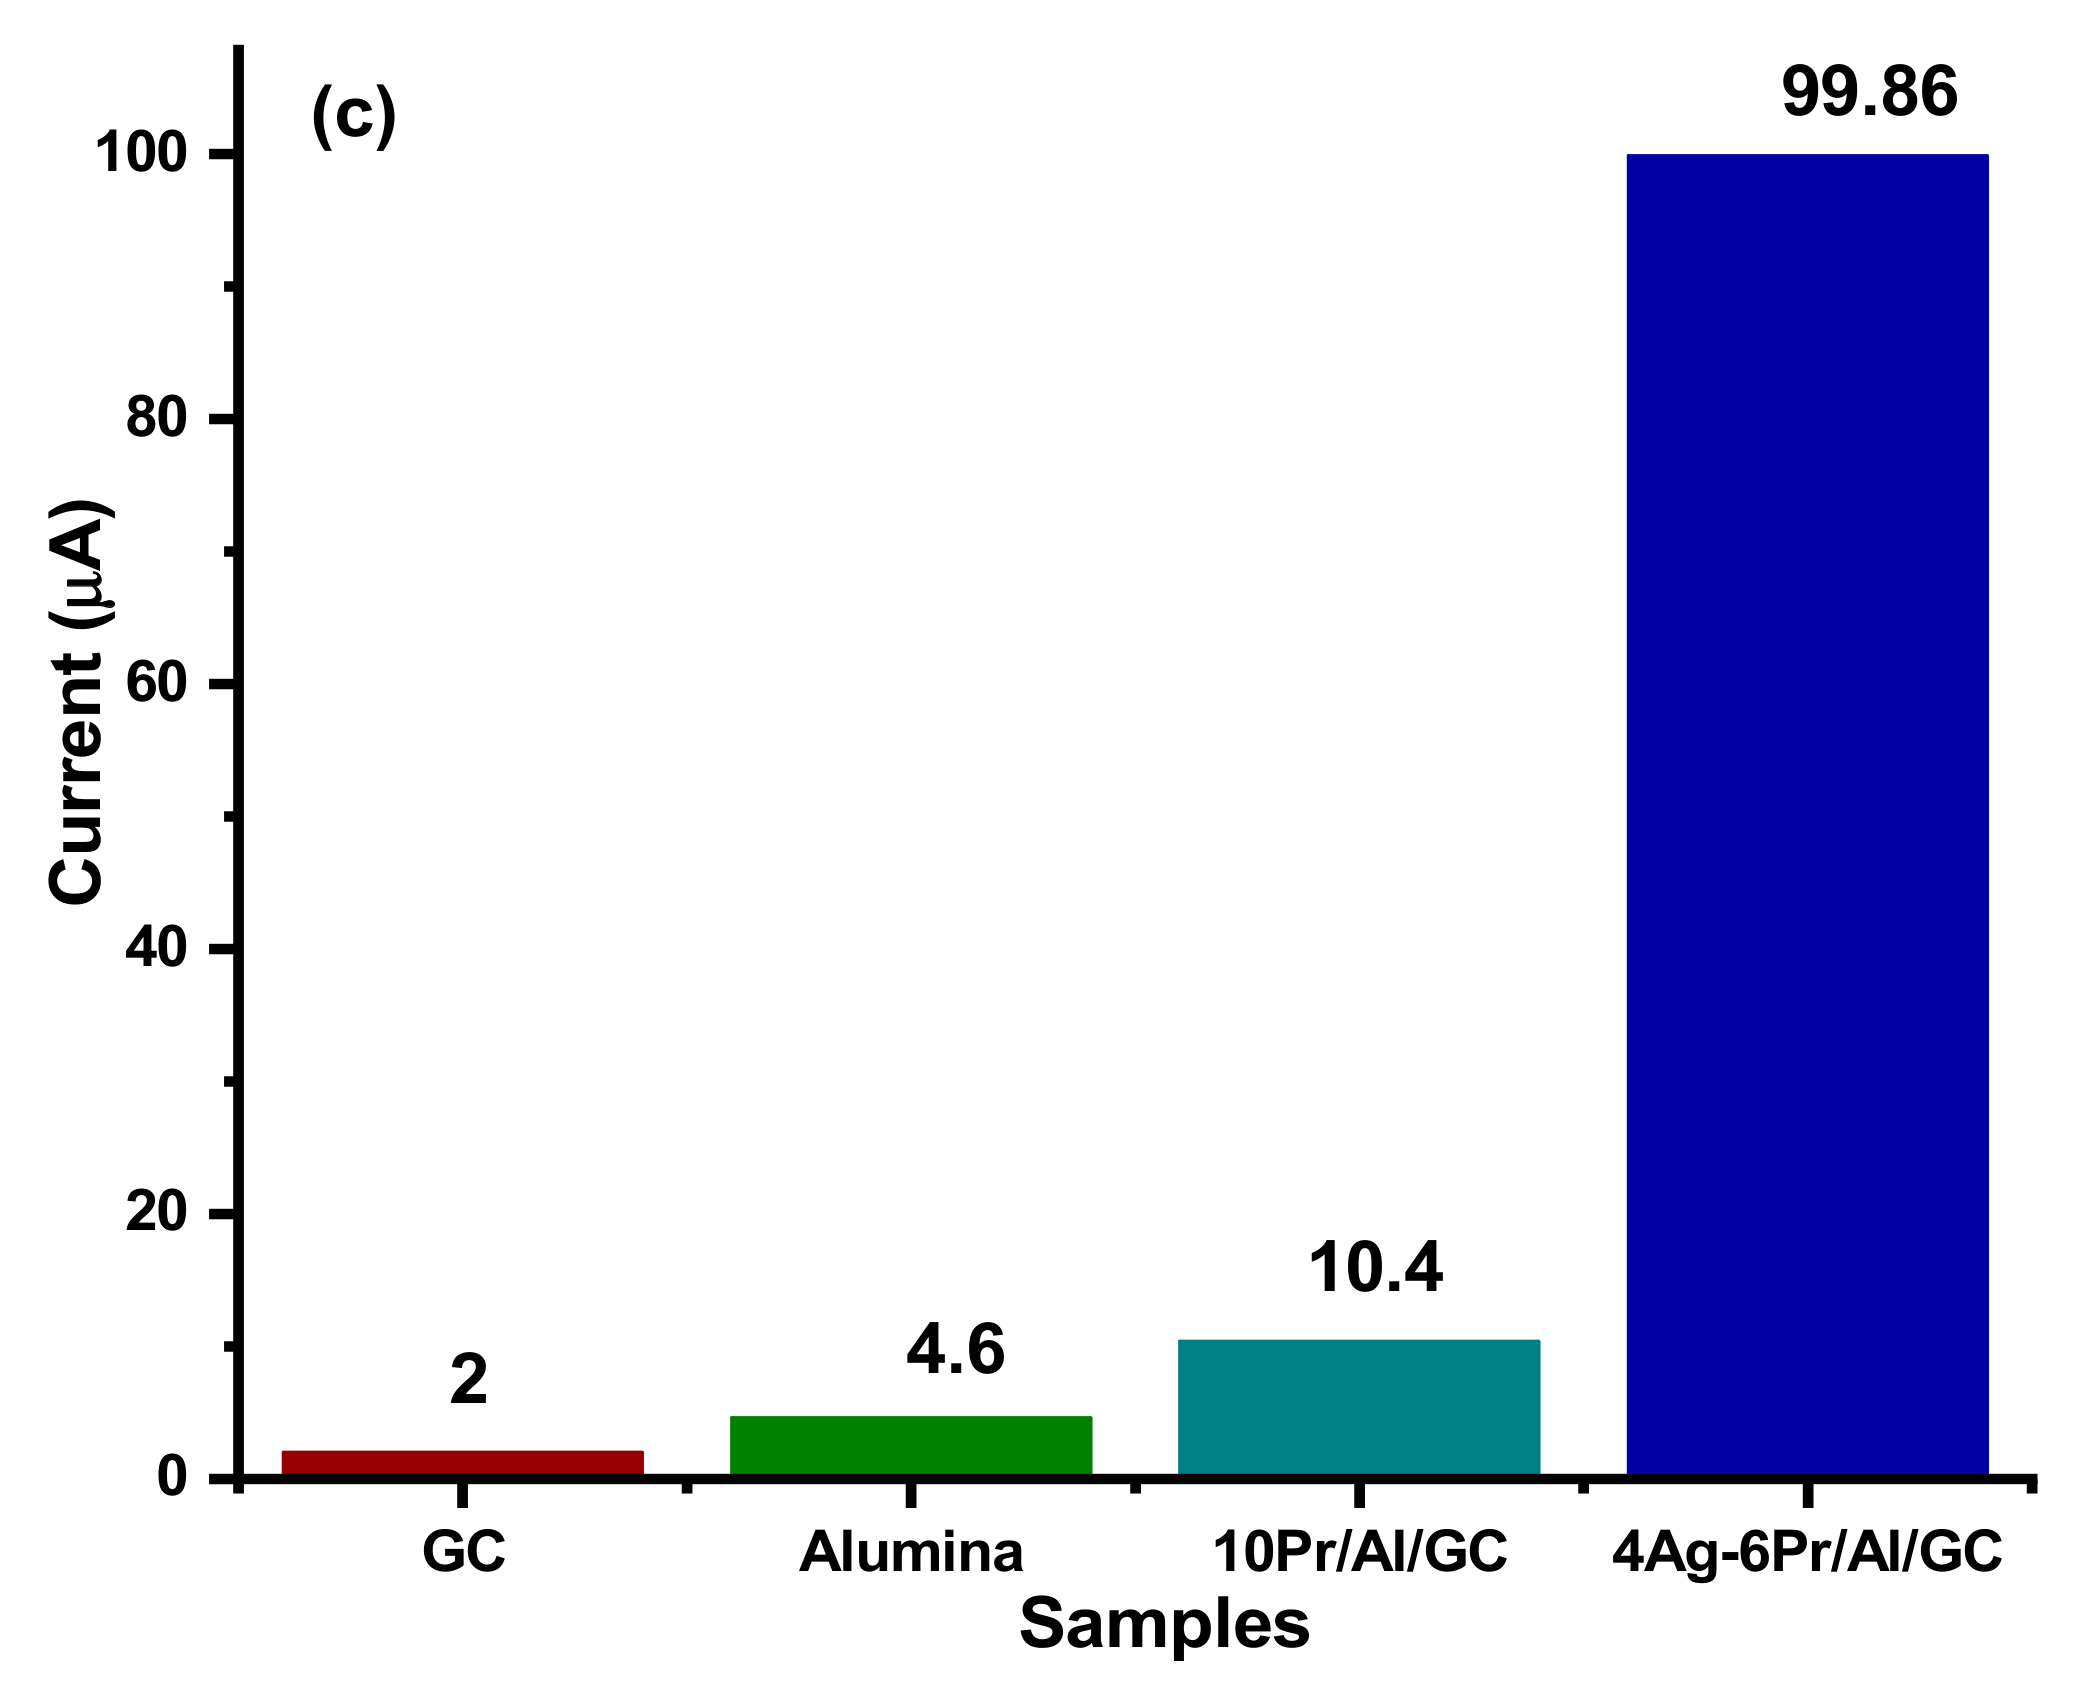
The cyclic voltammetric response of bare glassy carbon and γ-Al2O3/GC with (red curve) and without (black curve) Ag2O–PrO2 loadings was studied in a 5 mM NH3 + 0.1 M KOH system, as shown in Figure 7b,c. The electrochemical oxidation of ammonia in KOH is not observed on bare glassy carbon and γ-Al2O3/GC, while the peak appeared on Ag2O(x)–PrO2(y)/γ-Al2O3/GC, confirming the electrocatalytic response of Ag2O–PrO2/γ-Al2O3 towards the electrochemical oxidation of ammonia, as elucidated by Figure 7b,c.
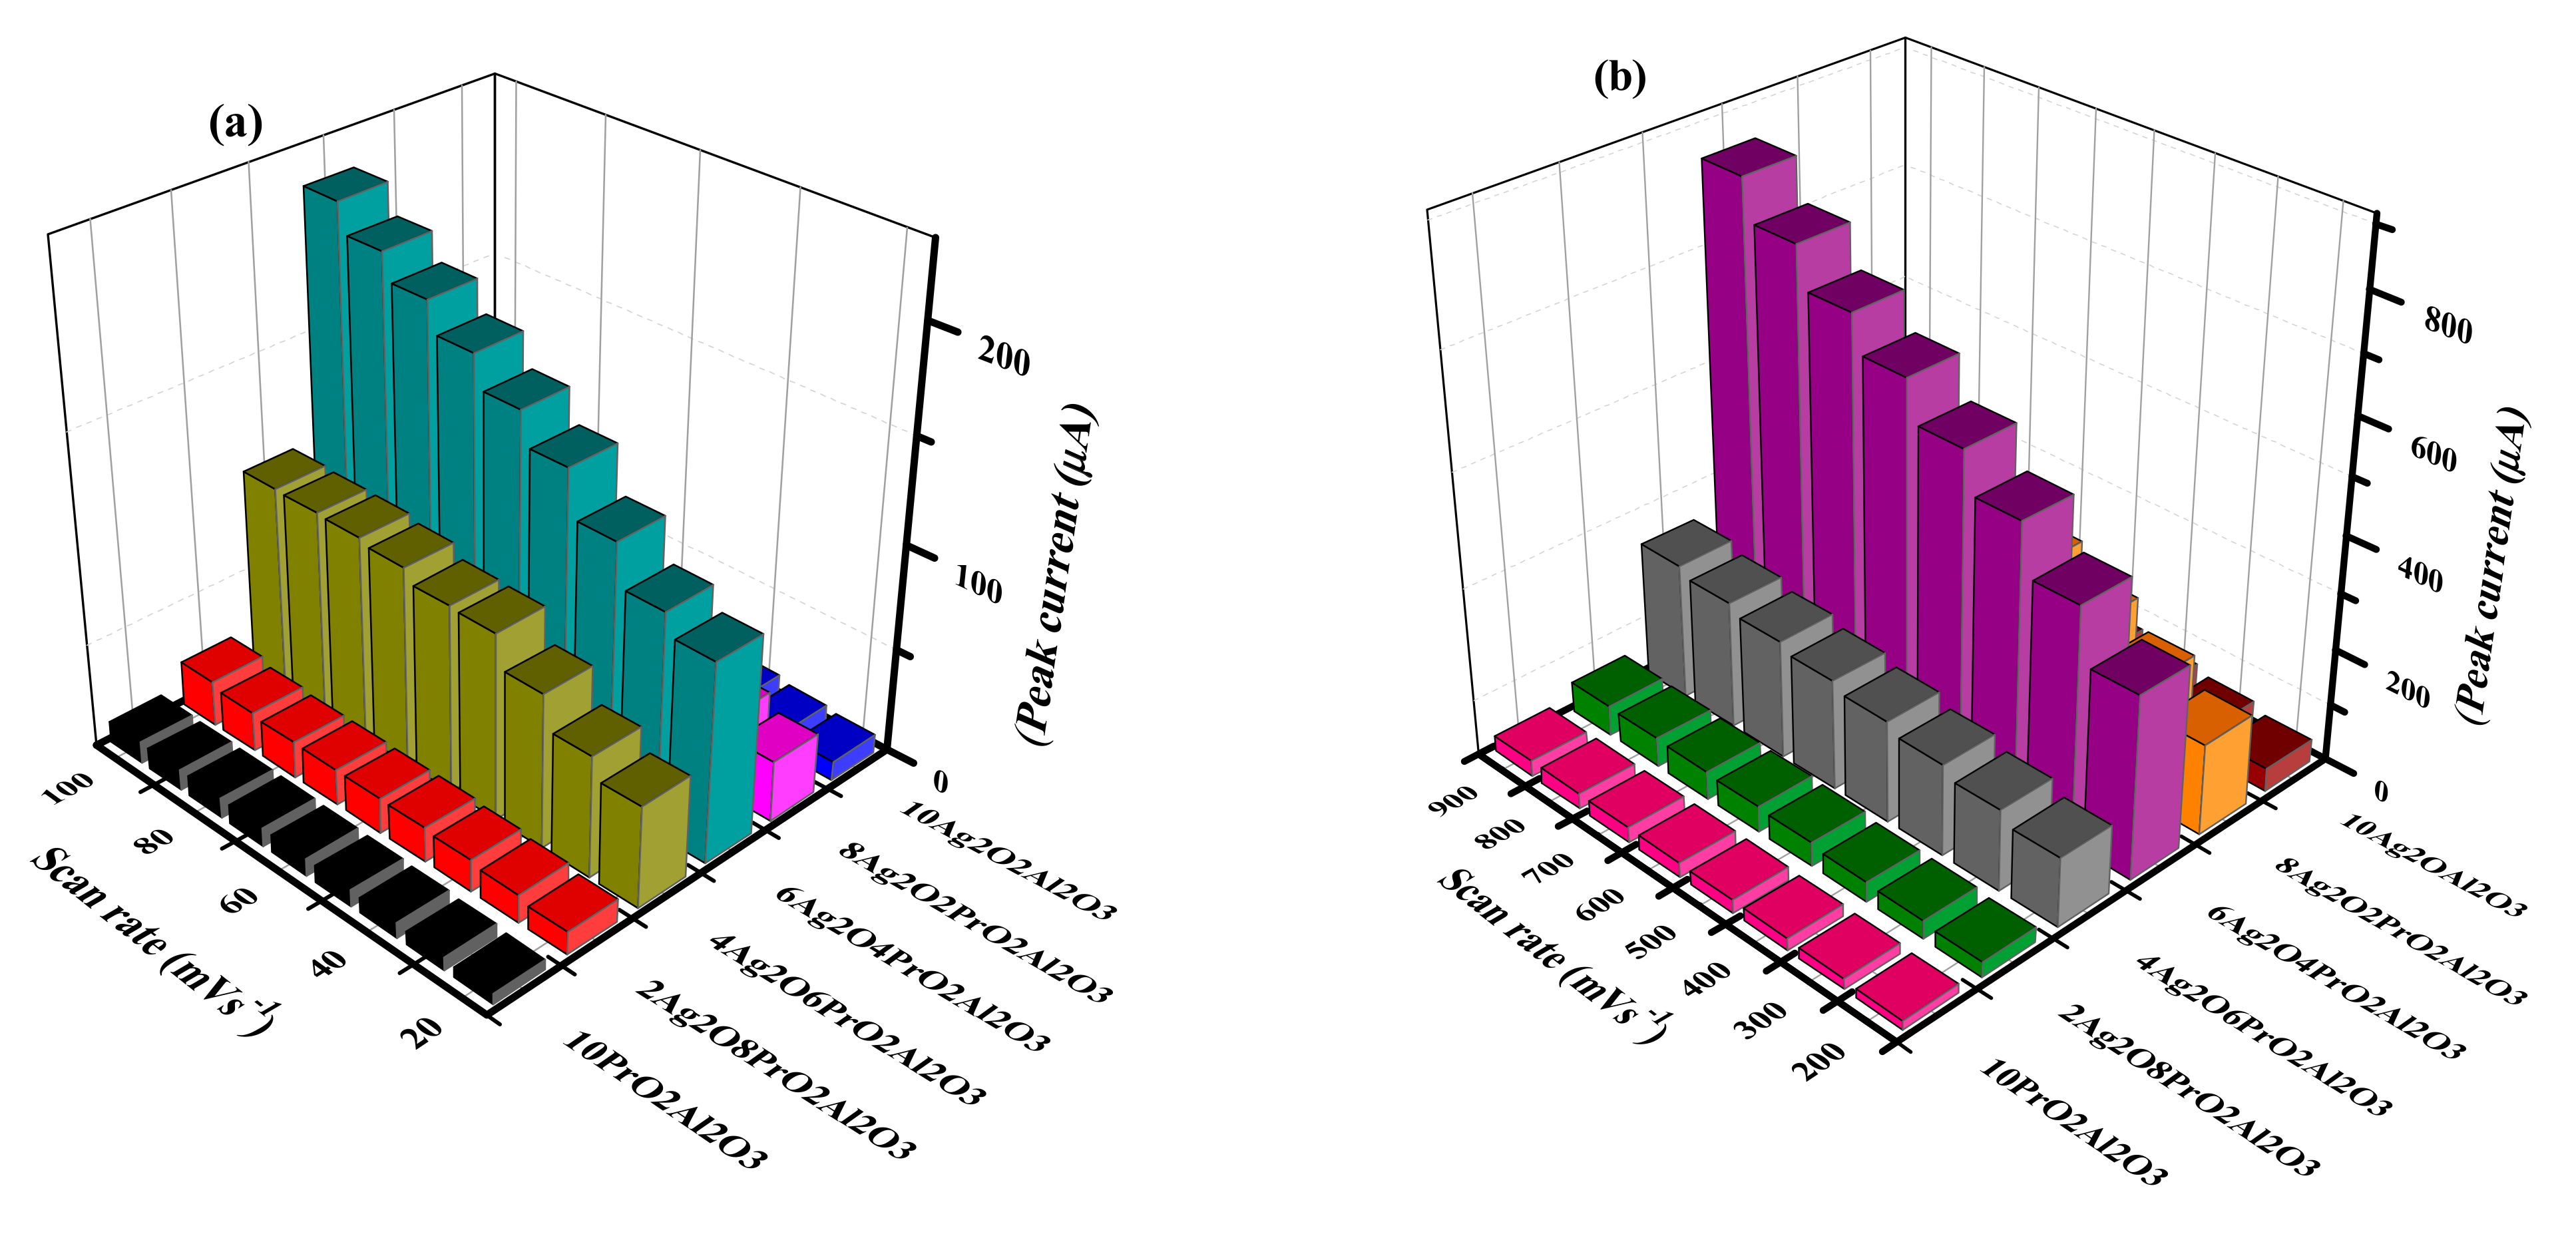
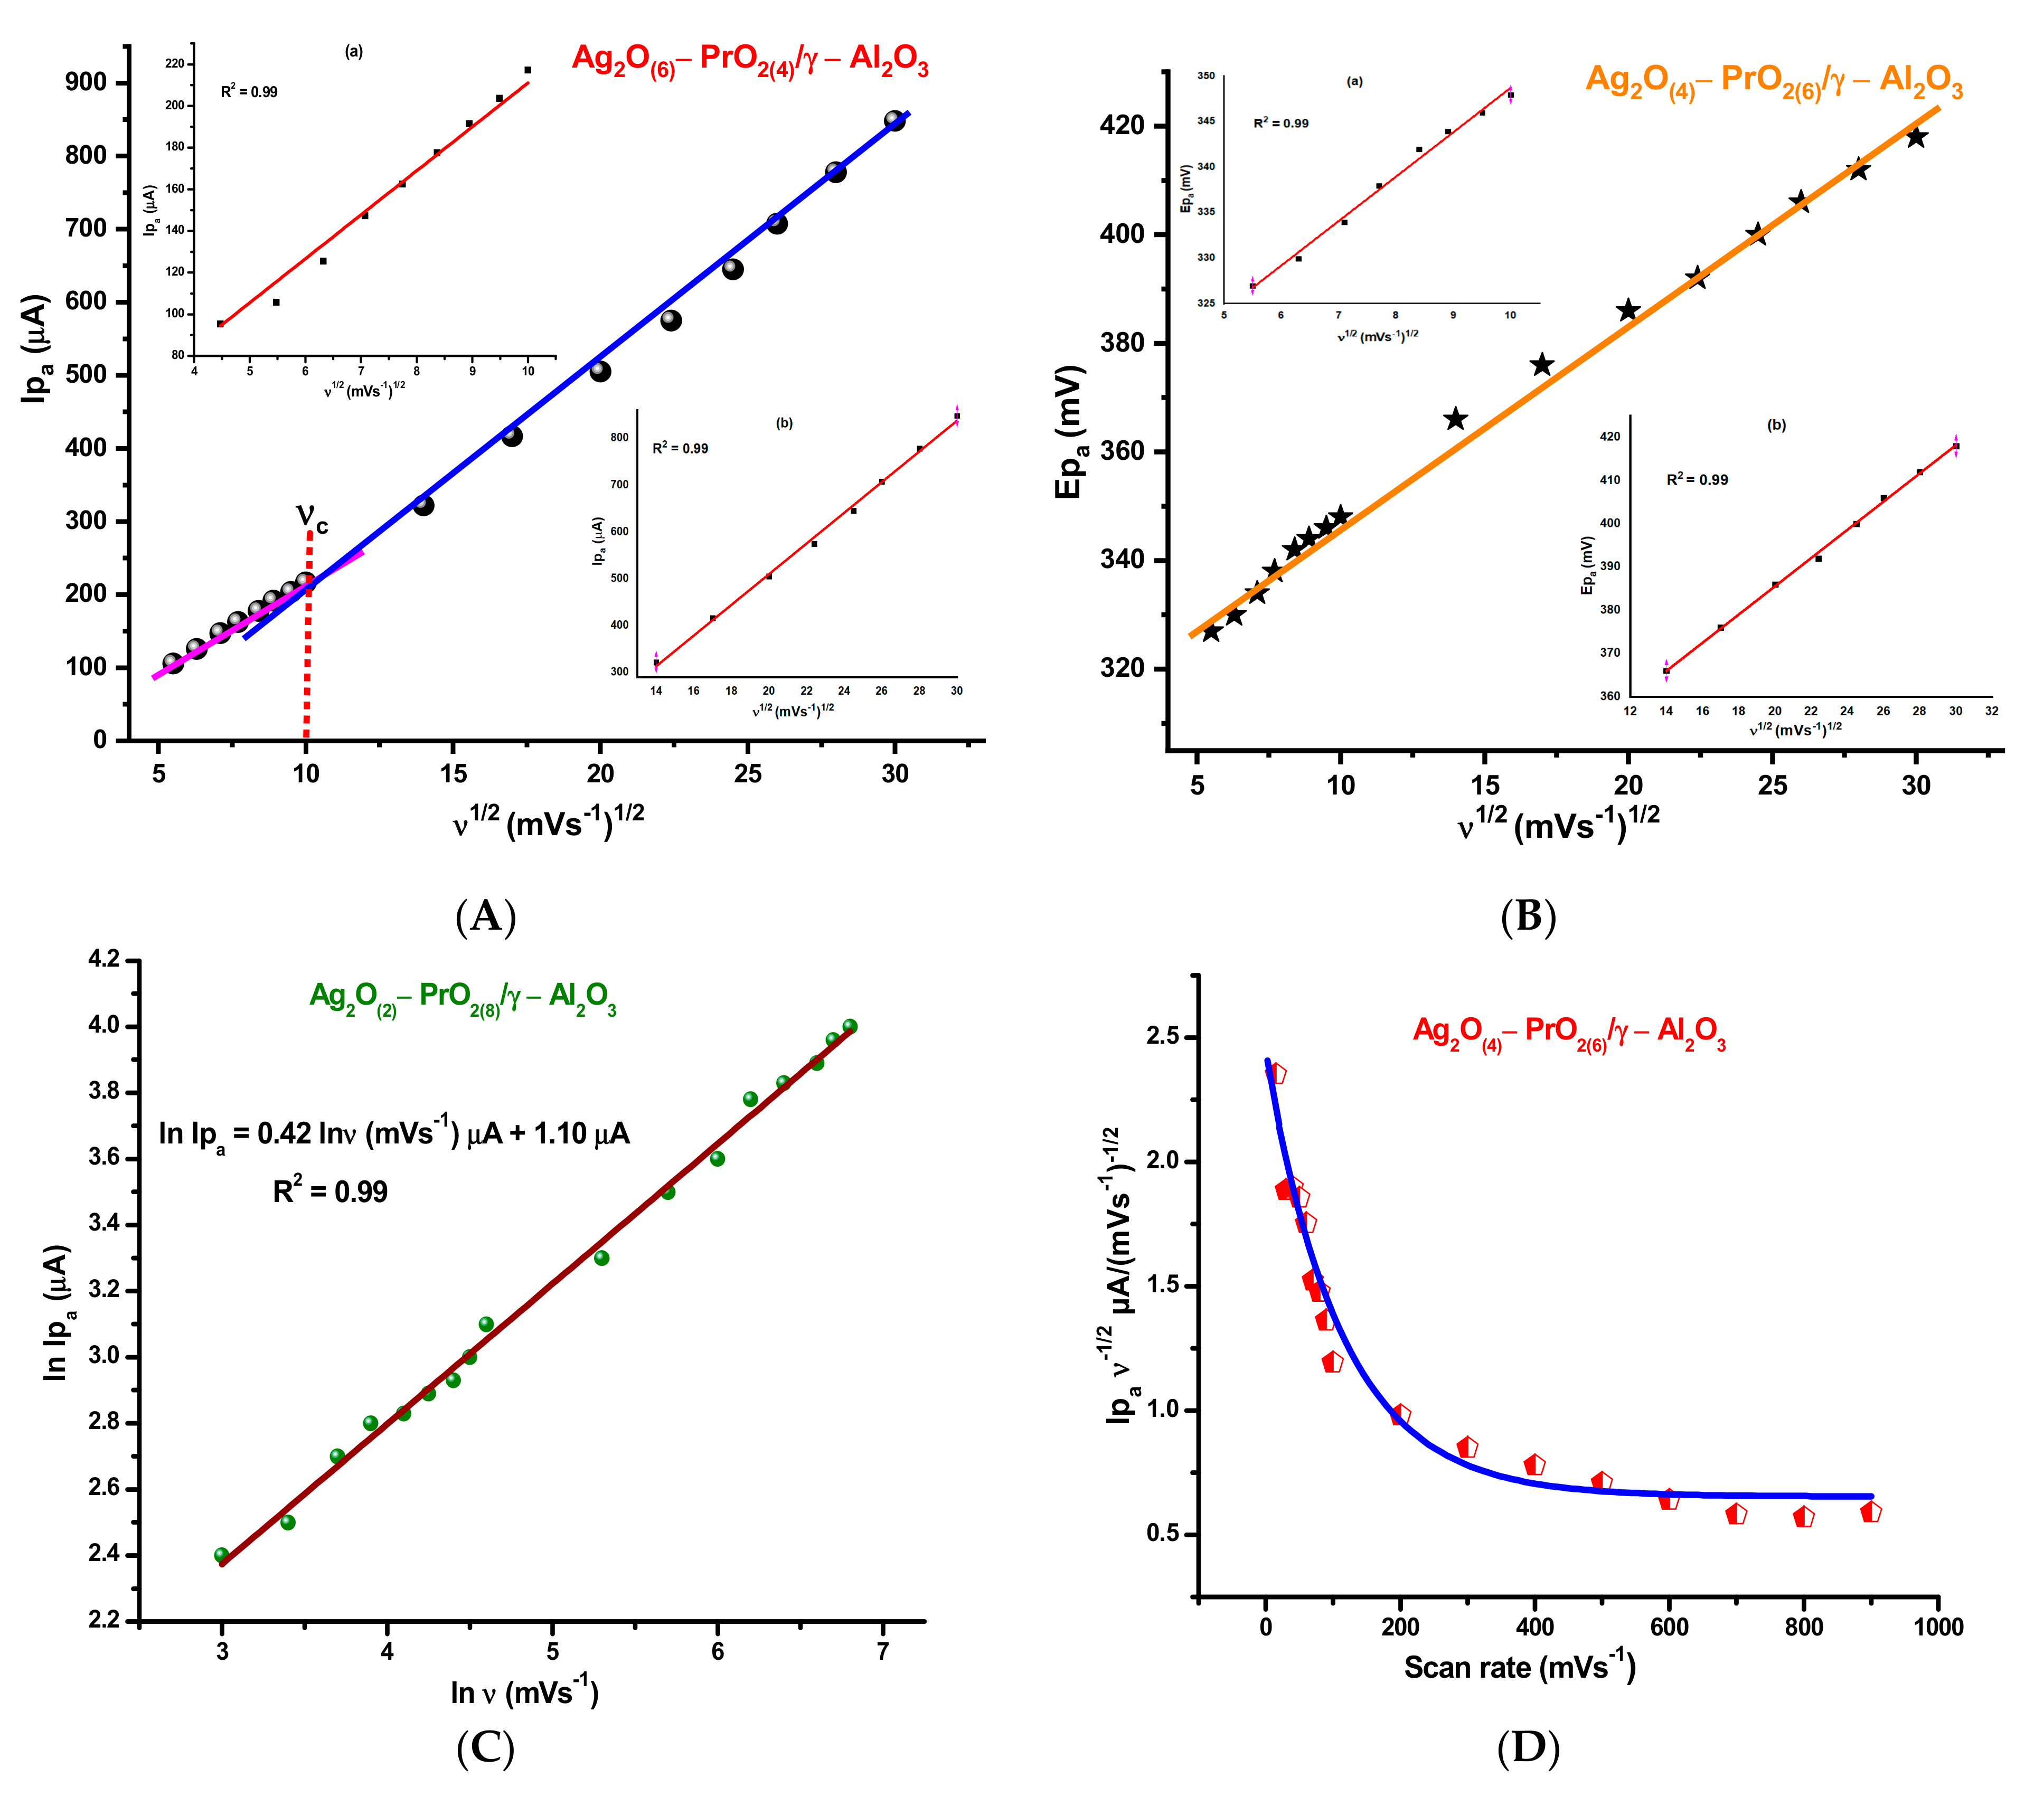
For commercialization of electrocatalysts, it is essential to check the electrochemical stability of catalysts; for this purpose, multiple scans have been observed at the surface of modified electrode in 5 m mM NH3 + 0.1 M KOH. The current became constant, and no further decrease was observed, which shows the stability of modified electrode in the system (Figure 8a). The ammonia oxidation was observed at different scan rates on modified GC electrode and is given in Figure 8b–d. Figure 8b tells about the redox behavior of PrO2(10)/γ-Al2O3 response towards ammonia electro-oxidation. It is revealed from the scan rate effect for all the electrochemical systems that the current increases with the increase of scan rate, and the peak potential is shifted towards more a positive potential region. A linear increase in peak current of ammonia oxidation is observed with sweep rate that specifies facilitation of electron transfer process of ammonia electro-oxidation; therefore, as-synthesized nanocatalysts behave like the adsorptive species on the surface of glassy carbon [54]. Figure 8c,d represents the voltammetric behavior of Ag2O(6)–PrO2(4)/γ-Al2O3 at lower and higher scan rates, from which it is seen that separation in positive and negative peak potentials is smaller at low scan rate values, i.e., 20 to 100 mV−1; hence, it is assumed that the facilitation of ammonia oxidation on surface of all catalysts is more manifested at the lower scan rates. Figure 8c,d shows the peak current dependence upon scan rate, which elaborates that the process of ammonia electro-oxidation over as-proposed catalysts is a diffusion-controlled reaction. Moreover, Figure 9a,b expresses the comparative peak current output of all compositions at lower and higher scan rates, which shows that Ag2O(6)–PrO2(4)/γ-Al2O3 has a maximum current for NH3 oxidation, as compared to the other members of the series.
The shift in peak potential with increasing scan rate is further confirmed by linear relationship of Epa and scan rate as shown in Figure 10b, which is one of the criteria to judge irreversibility of system [55,56]. The diffusion character of ammonia oxidation is substantiated by linear dependence of anodic peak current on scan rate, which is depicted by plots of ln Ipa vs. ln ν [55,57], as shown in Figure 10c The slope values close to 0.5 represent diffusion-controlled electrode processes, whereas close to 1.0 will be for adsorption-controlled processes [58,59,60]. The behavior of current function with scan rate is also examined for oxidation of ammonia figures (Figure 10D). The current function decreases exponentially with increasing sweep rate, which is suitable for electrode process. The negative slopes from these exponential plots determine that electrochemical oxidation of ammonia on the surface of all modified electrodes is expedited and the process is electrocatalytic [61].
It is revealed from the scan rate effect for all the electrochemical systems that the current increases with the increase of scan rate, and the peak potential is shifted towards a more positive potential region.
5.2. Kinetics of Ammonia Electro-Oxidation
The diffusion character of ammonia oxidation is demonstrated by linear dependence of anodic peak current on scan rate, which is depicted by plots of ln Ipa vs. ln v (Figure 10C). For the determination of diffusion coefficient, the Randles–Ševčík equation is used [62]:
where Ip is the anodic peak current; n is the no. of electrons involved in reaction; α is the transfer co-efficient whose value lies in the (0.3–0.7) range; nα is the number of electrons in the rate-determining step, i.e., 3; A is area of the electrode, which is 0.07 cm2; D° is the diffusion co-efficient in cm2·s−1; C is the bulk concentration in mol·cm−3; and ν is the scan rate in mV·s−1 The parameter α is calculated by using the following:
where, Epa is anodic peak potential and Epa/2 is peak potential at Ipa/2.
Ip = (2.99 × 10⁵)·n·{(1−α)·nα}·A·D°1/2·C·ν1/2
Epa − Epa/2 = [0.048 /(αn)]
It is deduced that the reaction is diffusion controlled at low sweep rates, while it is kinetically controlled at higher scan rate (Figure 10C) [55,57].
The mass transport coefficient (mT) is given by Equation (5) [63]:
mT = [D°/(RT/(F·ν))]1/2
The values of the ammonia diffusion and mass transport coefficients for the entire series of the synthesized samples are given in Table 4. The diffusion coefficient and mass transport coefficient are higher for Ag2O(6)–PrO2(4)/γ-Al2O3, revealing that it is a better electro-active material for NH3 oxidation among all the samples. The value of diffusion coefficients for ammonia oxidation in alkaline medium (10−9) is smaller than that of H2O (10−5), due to presence of hydroxyl groups of the supporting electrolyte present in bulk [64]. These hydroxyl groups from the KOH electrolyte hinder the diffusion process of ammonia; that could be the reason for the low diffusion coefficient. The diffusion coefficient value estimated for ammonia over Ag2O(6)-PrO2(4)/γ-Al2O3 nanocomposite seems similar to ammonia diffusion over the Pt-Ni composite [65]. Moreover, these diffusion coefficient values are obtained for the current of major peak, i.e., around 0.4 V, which increases linearly with the scan rate, as seen from Figure 8. It suggests that oxidation of ammonia over Ag2O(6)-PrO2(4)/γ-Al2O3 is governed by diffusion significantly.
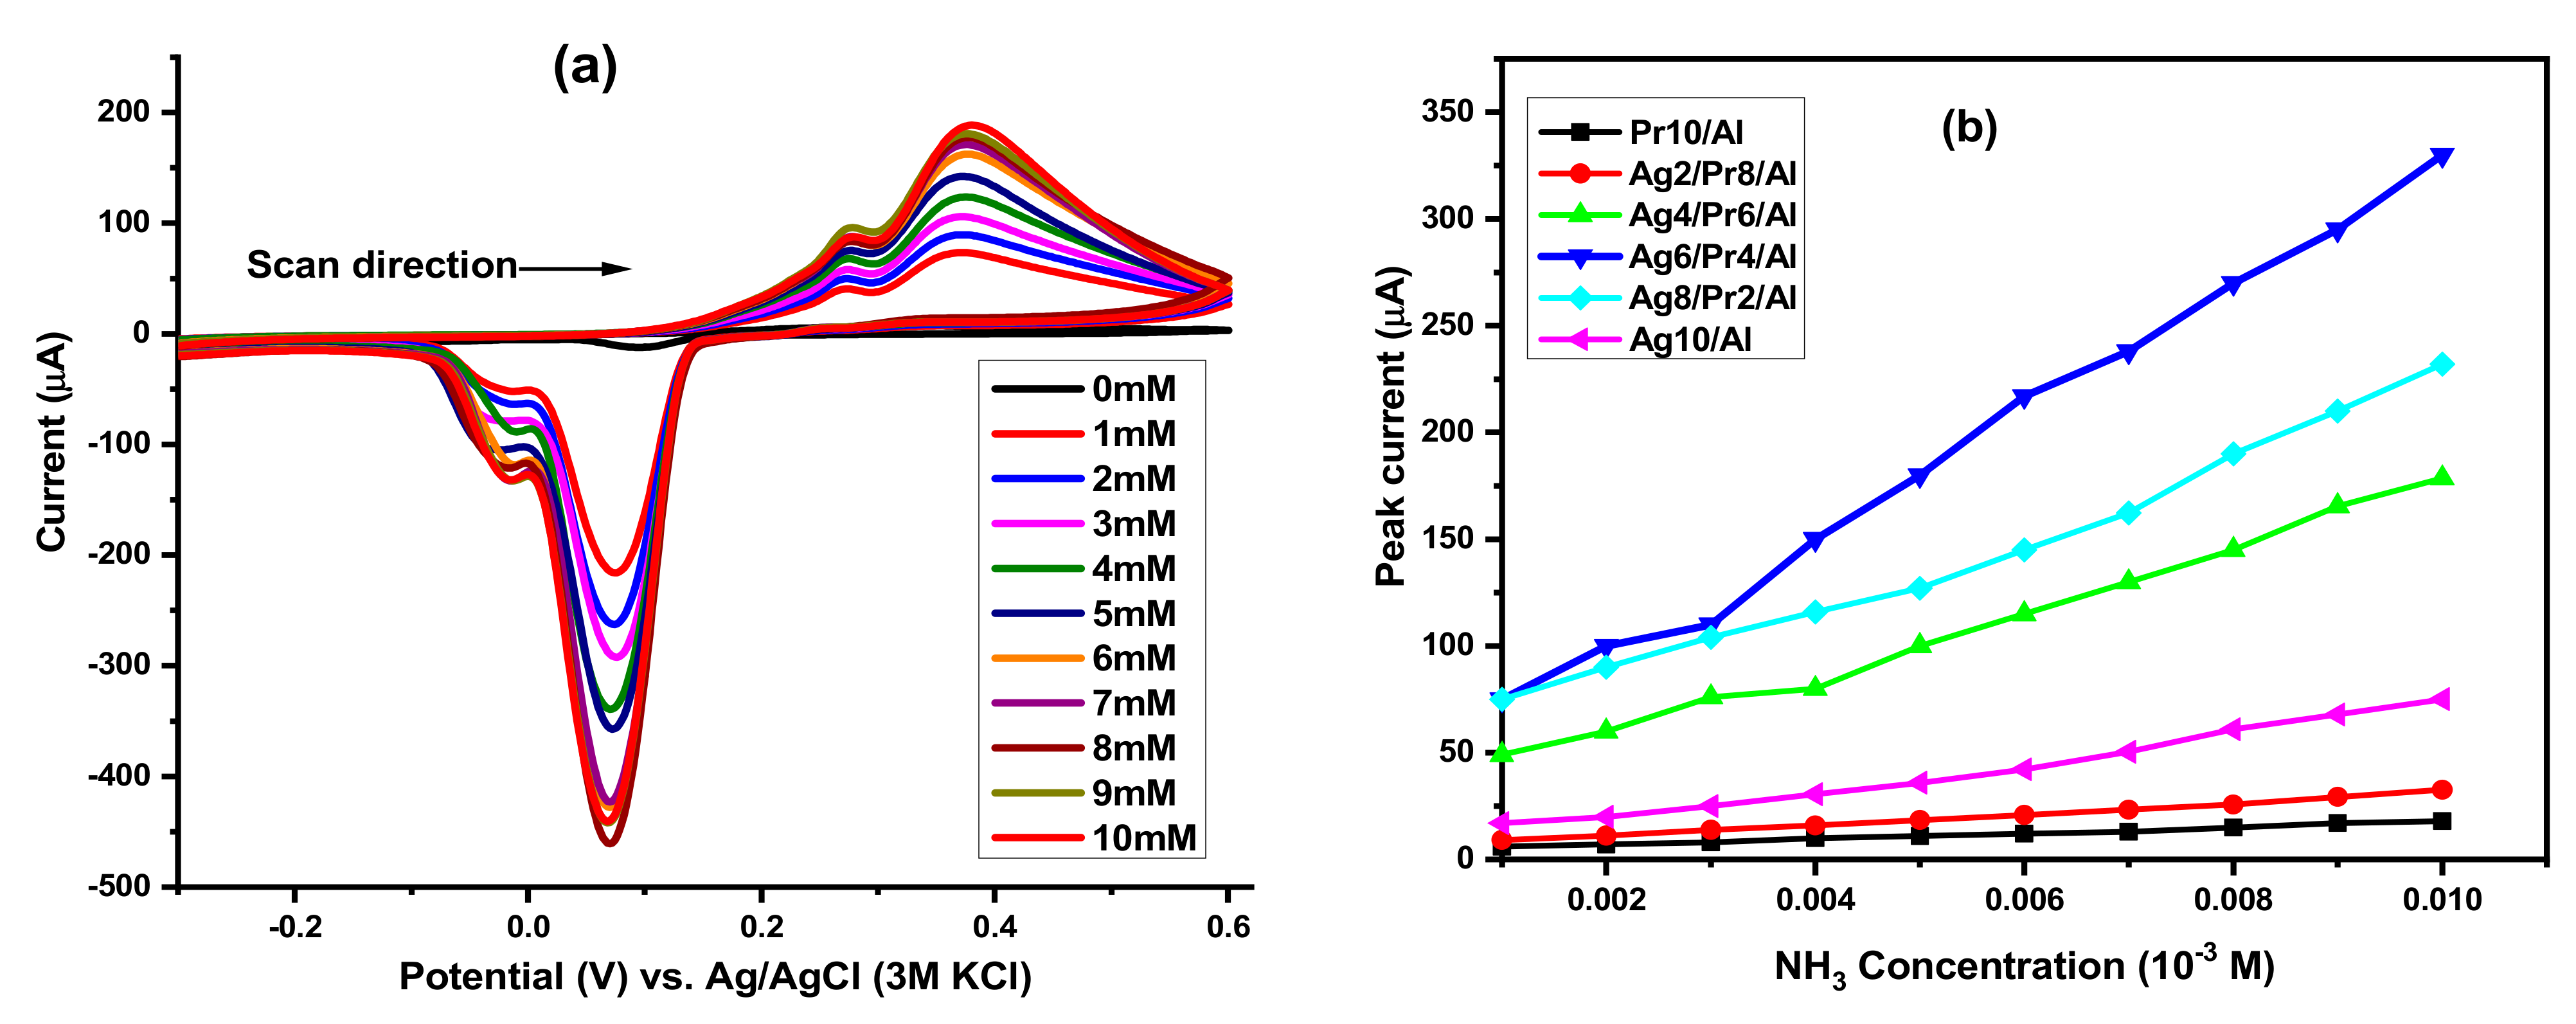
The catalytic properties of synthesized materials can be determined by heterogeneous kinetics for ammonia oxidation. The value of heterogeneous rate constant was determined by taking cyclic voltammograms and varying the concentration of ammonia (Figure 11a). The Reinmuth equation is used to calculate heterogeneous rate constants, k°, for all supported mixed metal oxide electrocatalysts.
where ko is the heterogeneous rate constant, and F is Faraday’s constant. By plotting the anodic peak current vs. concentration of NH3, the values of the rate constant, ko, for oxidation are obtained from the slope, as illustrated in Table 5, which reveals the facilitated electron transfer process, and it gives valuable information about the nature of system, which is irreversible. The heterogeneous rate constant decreases in the following order:
Ip = 0.227n·F·A·C·k°
k°(6Ag-4Pr/Al) > k°(4Ag-6Pr/Al) > k°(8Ag-2Pr/Al) > k°(10Ag/Al) > k°(2Ag-8Pr/Al) > k°(10Pr/Al)
5.3. Thermodynamic Studies for Ammonia Electro-Oxidation
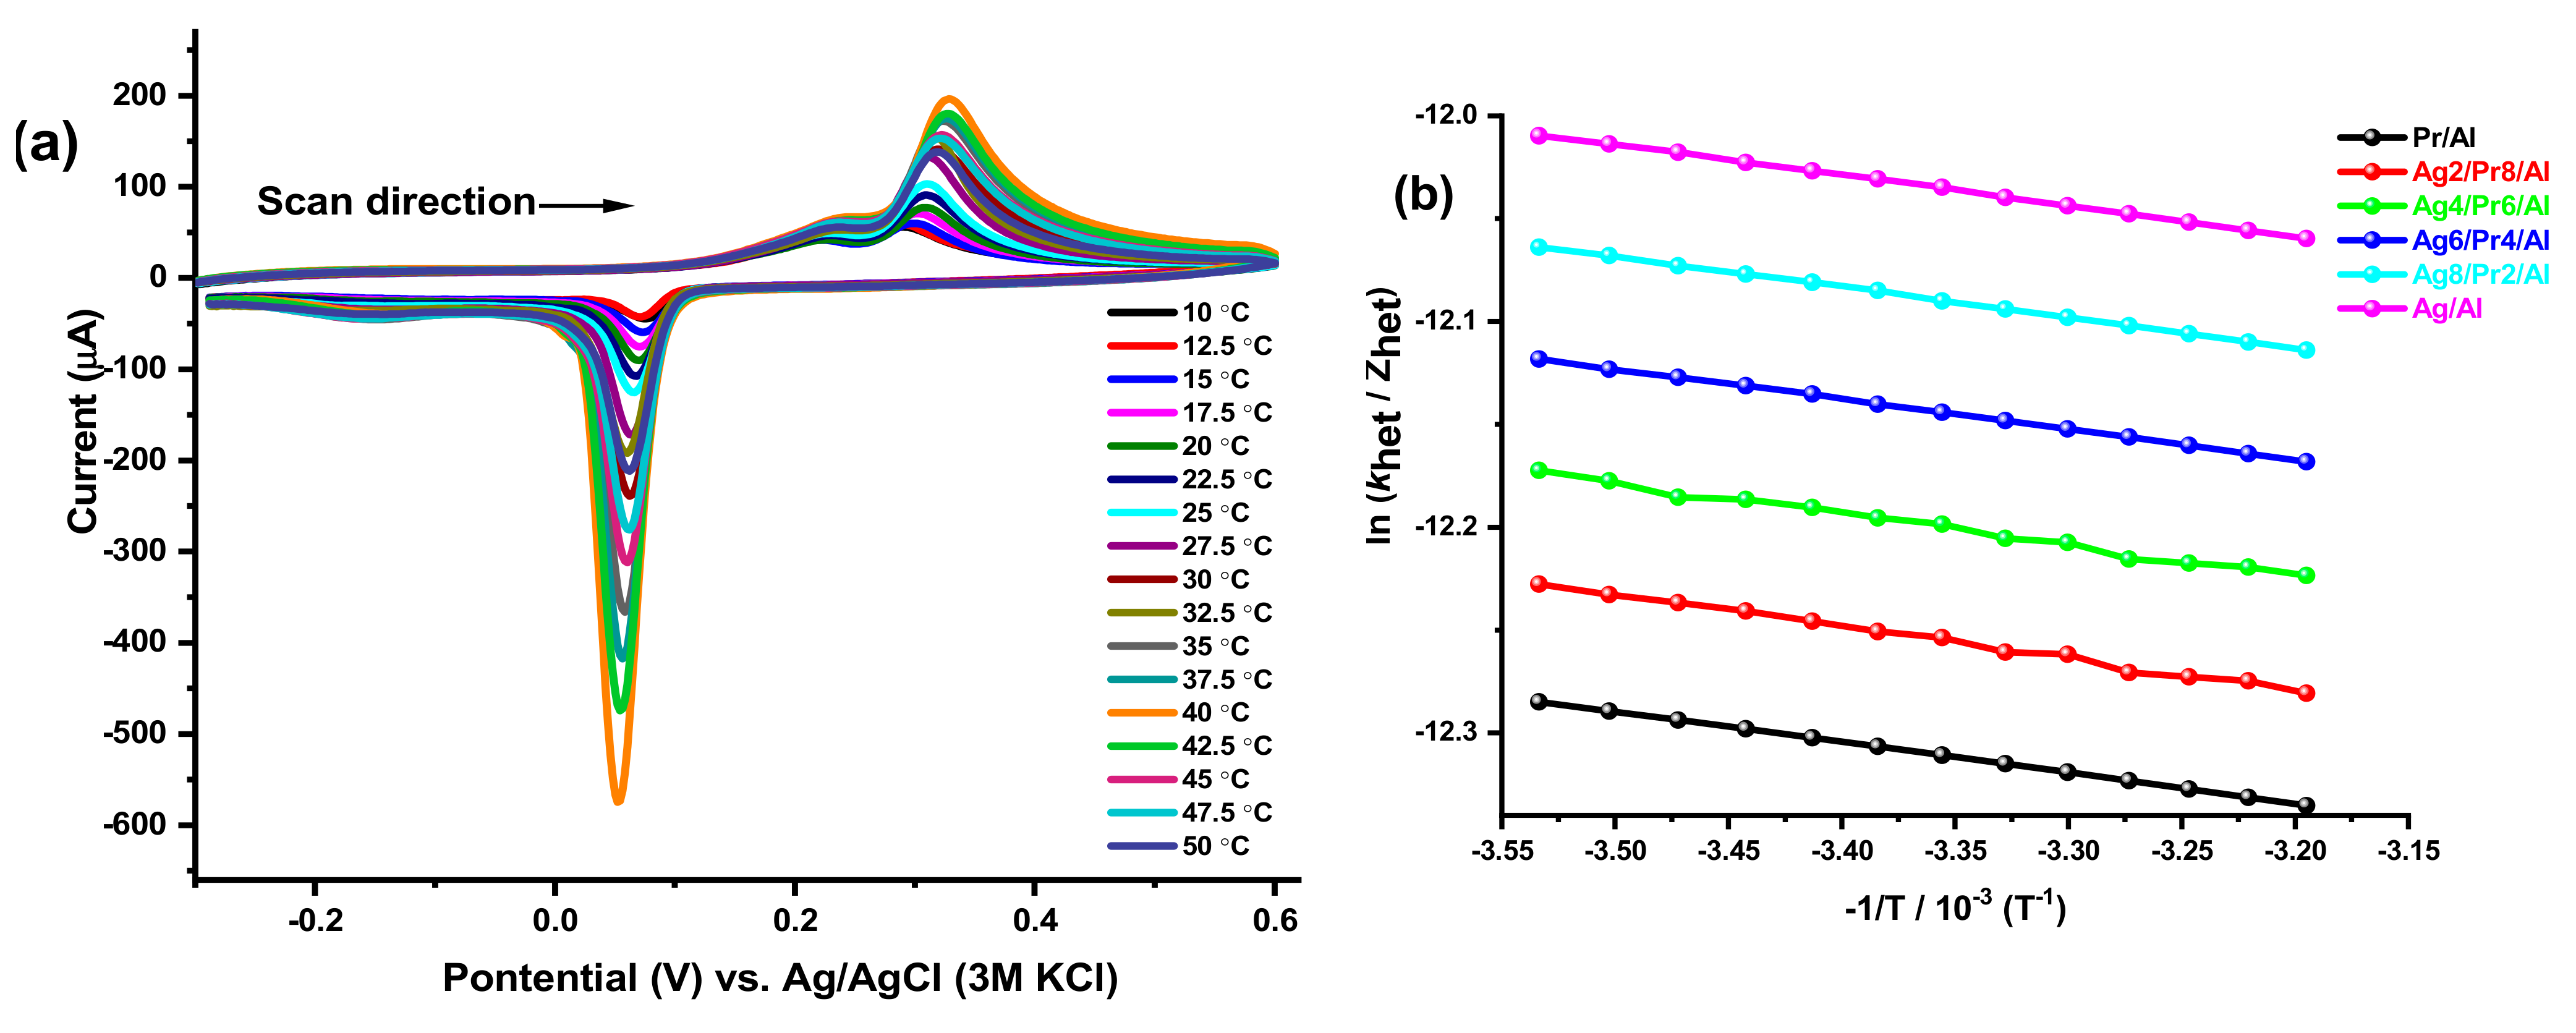
Cyclic voltammograms were observed by varying the temperature of the system from 10 to 50 °C with the Ag2O(6)–PrO2(4)/γ-Al2O3 catalyst, as shown in Figure 12a. The observed thermodynamic parameters tabulated below show that electro-oxidation of ammonia in alkaline solution is exothermic and non-spontaneous reaction. The entropy of ammonia electro-oxidation is negative because it is an adsorption-controlled process. Before adsorption, the molecules are free to move in three dimensions; when these get adsorbed on the surface of catalyst, their motion is restricted. As a result, disorderliness decreases, and entropy of the system decreases. The free energy of activation is less for Ag2O(6)–PrO2(4)/γ-Al2O3 modified electrode, which reveals that this composition exhibits superior catalytic properties among this series because it lowers the activation energy of system to a greater extent.
All the compositions in the series exhibit a similar response towards the increase in temperature of the system. Different thermodynamic parameters enlisted in Table 6 are deduced for the NH3 electro-oxidation, with the help of the Marcus equation. It is a straight-line equation and gives the value of enthalpy of reaction (∆H) from the slope of the Marcus plot, i.e., Figure 12b between ln [k°/Zhet] vs. −1/T, while change in entropy (∆S) can be estimated from the intercept.
Equations (5) and (6) may be expressed in a simpler form:
Here, ΔG is free energy of activation, k° heterogeneous rate constant and Zhet is collision number whose values Zhet at different temperatures (T) can be calculated by Equation (9) [66].
M is the molar concentration of NH3, according to thermodynamic equation.
ΔG = ΔH − TΔS
5.4. Mechanism of Ammonia Oxidation
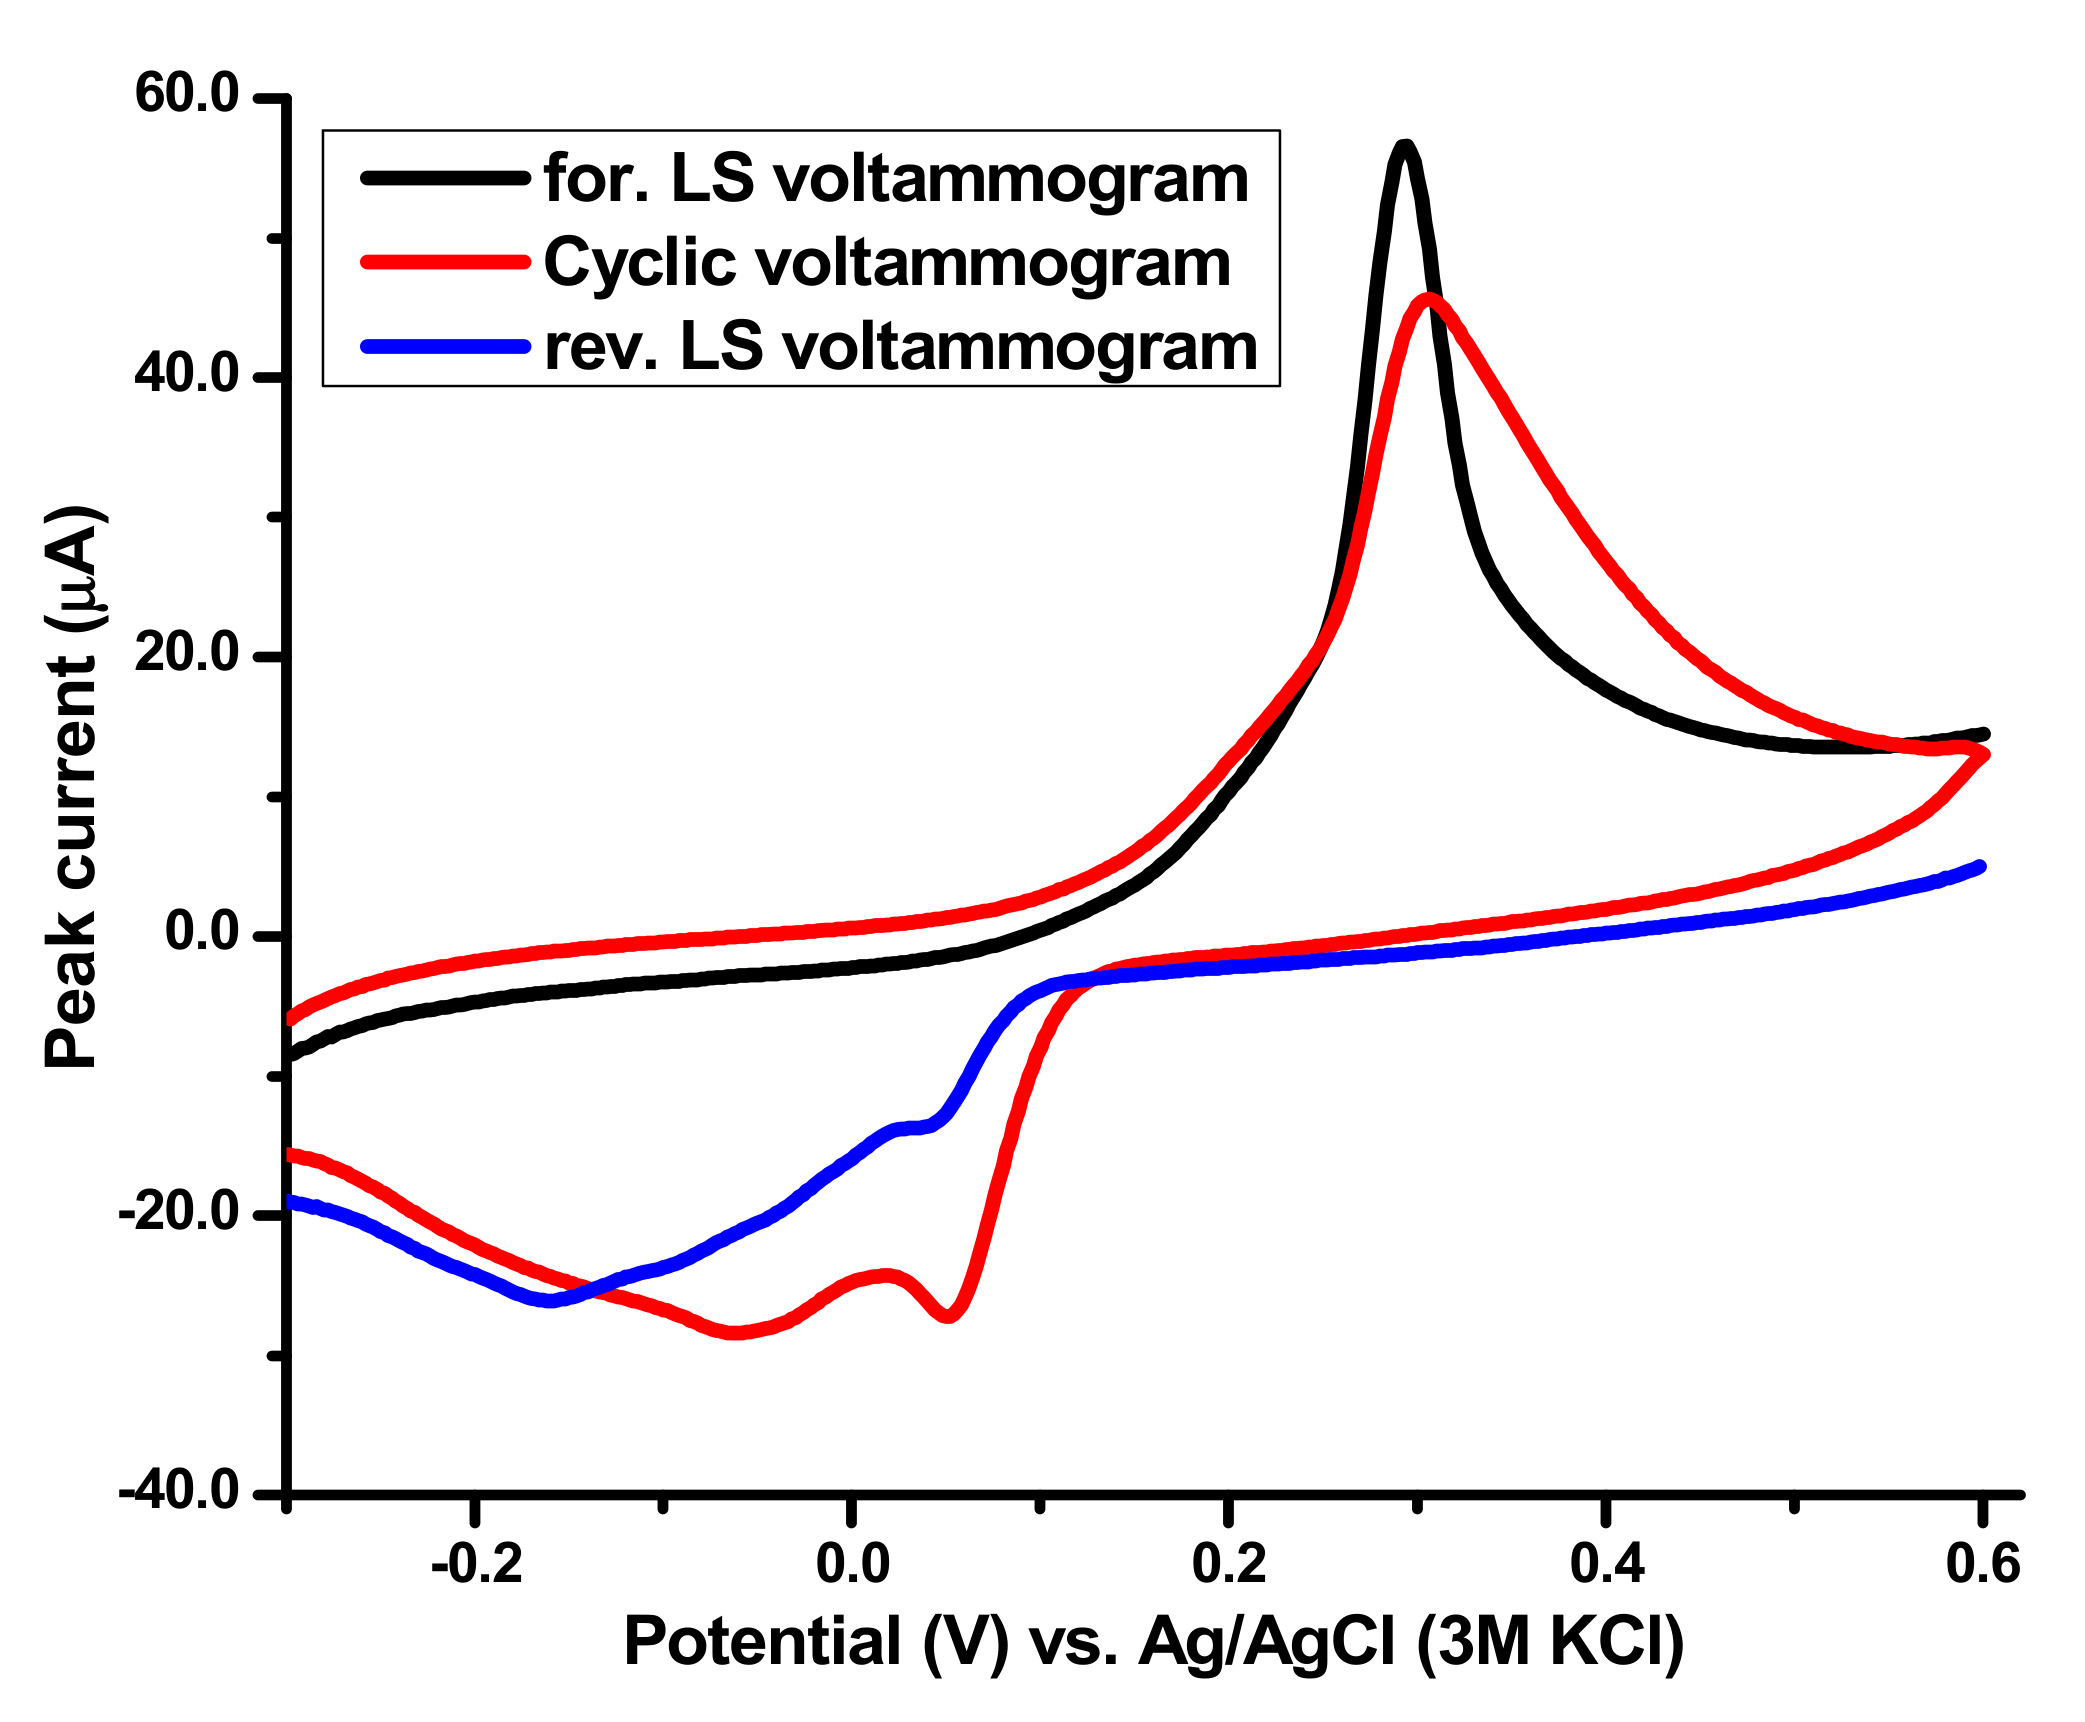
The independent behavior of cathodic and anodic reactions was further confirmed by comparing the linear-sweep voltammograms (LSV) with cyclic voltammogram (CV) observed for 5 mM NH3 in 0.1 M KOH at 100 mV·s−1, as represented in Figure 13. It reveals that the anodic peak (black curve) is purely for ammonia oxidation, and the cathodic peak (blue curve) is for the reduction of silver oxide into metal silver. The comparison of LSV with CV will help to propose a mechanism for ammonia oxidation on surface of electrocatalysts.
These responses correspond to the mechanism of ammonia oxidation. NH3 is firstly adsorbed on electrode surface from bulk solution. After adsorption, it undergoes the 3e− oxidation process, forming water and N2 as by-products [67].
Overall reaction
NH3 + 3OH− → ½ N2 + 3H2O + 3e−
Mechanism
NH3(aq) → NH3(ad)
NH3(ad) + OH− → NH2ˉ(ad) + H2O + e−
NH2−(ad) + OH− → NHˉ(ad) + H2O + e−
NH−(ad) + OH− → N(ad) + H2O + e−
2N(ad) → N2
6. Conclusions
The γ-Al2O3 supported Ag2O(x)-PrO2(y) nanocatalysts were synthesized via simple synthetic routes. Moreover, γ-Al2O3 was synthesized by precipitation method, and metal oxide promotors were loaded on γ-Al2O3 by co-impregnation method. All the as-synthesized materials were subjected to characterization techniques, including FTIR, XRD, EDX, SEM, CV and EIS. The sizes of the proposed nanocatalysts were calculated by XRD and SEM, which confirms that synthesized materials are in nano-range and are well dispersed on the support. The successful loading of xAg2O-yPrO2 nanocomposites on support was confirmed by XRD, FTIR and EDX. The surface morphology of samples was examined by SEM, which shows that metal oxide precursors are homogeneously dispersed on the surface of the support. The active surface area and electron transfer constant were calculated by CV and EIS. All the compositions gave appreciable current output in ammonia electro-oxidation reaction, owing to their estimated ECSA values and electron transfer properties. Among all the catalysts in the series, Ag2O(6)–PrO2(4)/γ-Al2O3 gave the higher values for both, making it an optimum composition for electrochemical applications.
The cyclic voltammetric investigations were employed for analyzing the electrochemical properties of materials. The catalytic activity of all synthesized samples was investigated towards oxidation of ammonia, considering scan rate, concentration and temperature effects in focus. All modified electrodes showed adequate catalytic behavior towards ammonia oxidation, whereby modified electrodes behaved as anodic material. The calculated kinetic parameters revealed that ammonia oxidation on these catalysts was of diffusion control nature and irreversible. The thermodynamic parameters declared that the overall process of ammonia on catalysts surface was exothermic (negative enthalpy) and non-spontaneous (positive Gibbs free energy). The entropy of the system was negative, as disorderliness decreases in the system due to adsorption of intermediate species on the catalyst surface before oxidation, which reveals that ammonia electro-oxidation is an adsorption-controlled process. Among all modified electrodes, the Ag2O(6)−/PrO2(4)/γ-Al2O3 modified electrode exhibited better catalytic response, owing to its higher diffusion coefficient, mass transport coefficient, heterogeneous rate constant and lowest free energy of activation.
Author Contributions
Conceptualization, M.K. and N.K.J.; Methodology, M.K. and N.K.J.; Validation, S.K.; Formal Analysis, T.S.A.; Investigation, N.K.J.; Resources, S.A.; Data Curation, N.K.J.; Writing—Original Draft Preparation, M.K.; Writing—Review and Editing, N.K.J.; Visualization, S.K.; Supervision, N.K.J.; Project Administration, N.K.J.; SEM characterization, I.Q.; TEM characterization, S.A.; Funding Acquisition, T.S.A. All authors have read and agreed to the published version of the manuscript.
Funding
This research received no external funding.
Data Availability Statement
Data is contained within article.
Acknowledgments
The authors acknowledge the Fuel Cell Lab, Department of Chemistry, Quaid-I-Azam University, Islamabad, which furnished this novel research, and the researchers collaborative Project Number (RSP-2020/254), King Saud University, Riyadh, Saudi Arabia.
Conflicts of Interest
The authors declare no conflict of interest.
References
- Nowotny, J.; Hoshino, T.; Dodson, J.; Atanacio, A.J.; Ionescu, M.; Peterson, V.; Prince, K.E.; Yamawaki, M.; Bak, T.; Sigmund, W.; et al. Towards sustainable energy. Generation of hydrogen fuel using nuclear energy. Int. J. Hydrogen Energy 2016, 41, 12812–12825. [Google Scholar] [CrossRef]
- Pervaiz, M.; Ahmad, I.; Yousaf, M.; Kirn, S.; Munawar, A.; Saeed, Z.; Adnan, A.; Gulzar, T.; Kamal, T.; Ahmad, A.; et al. Synthesis, spectral and antimicrobial studies of amino acid derivative Schiff base metal (Co, Mn, Cu, and Cd) complexes. Spectrochim. Acta Part A Mol. Biomol. Spectrosc. 2019, 206, 642–649. [Google Scholar] [CrossRef] [PubMed]
- Kashif, M.; Ngaini, Z.; Harry, A.V.; Vekariya, R.L.; Ahmad, A.; Zuo, Z.; Sahari, S.K.; Hussain, S.; Khan, Z.A.; Alarifi, A. An experimental and DFT study on novel dyes incorporated with natural dyes on titanium dioxide (TiO2) towards solar cell application. Appl. Phys. A 2020, 126, 1–13. [Google Scholar] [CrossRef]
- Ahmad, A.; Jini, D.; Aravind, M.; Parvathiraja, C.; Ali, R.; Kiyani, M.Z.; Alothman, A. A novel study on synthesis of egg shell based activated carbon for degradation of methylene blue via photocatalysis. Arab. J. Chem. 2020, 13, 8717–8722. [Google Scholar] [CrossRef]
- Hussain, S.; Khan, A.J.; Arshad, M.; Javed, M.S.; Ahmad, A.; Shah, S.S.A.; Khan, M.R.; Akram, S.; Zulfiqar; Ali, S.; et al. Charge storage in binder-free 2D-hexagonal CoMoO4 nanosheets as a redox active material for pseudocapacitors. Ceram. Int. 2020. [Google Scholar] [CrossRef]
- Afif, A.; Radenahmad, N.; Cheok, Q.; Shams, S.; Kim, J.H.; Azad, A.K. Ammonia-fed fuel cells: A comprehensive review. Renew. Sustain. Energy Rev. 2016, 60, 822–835. [Google Scholar] [CrossRef]
- Zhang, X.Z.; Xu, P.H.; Liu, G.W.; Ahmad, A.; Chen, X.H.; Zhu, Y.L.; Alothman, A.; Hussain, S.; Qiao, G.J. Synthesis, Characterization and Wettability of Cu-Sn Alloy on the Si-Implanted 6H-SiC. Coatings 2020, 10, 906. [Google Scholar] [CrossRef]
- Aravind, M.; Ahmad, A.; Ahmad, I.; Amalanathan, M.; Naseem, K.; Mary, S.M.M.; Parvathiraja, C.; Hussain, S.; Algarni, T.S.; Pervaiz, M.; et al. Critical green routing synthesis of silver NPs using jasmine flower extract for biological activities and photocatalytical degradation of methylene blue. J. Environ. Chem. Eng. 2021, 9, 104877. [Google Scholar] [CrossRef]
- Naseem, K.; Rehman, M.Z.U.; Ahmad, A.; Dubal, D.; Algarni, T.S. Plant Extract Induced Biogenic Preparation of Silver Nanoparticles and Their Potential as Catalyst for Degradation of Toxic Dyes. Coatings 2020, 10, 1235. [Google Scholar] [CrossRef]
- Zhan, M.; Hussain, S.; Algarni, T.S.; Shah, S.; Liu, J.; Zhang, X.; Ahmad, A.; Javed, M.S.; Qiao, G.; Liu, G. Facet controlled polyhedral ZIF-8 MOF nanostructures for excellent NO2 gas-sensing applications. Mater. Res. Bull. 2021, 136, 111133. [Google Scholar] [CrossRef]
- Khan, F.S.A.; Mubarak, N.M.; Khalid, M.; Walvekar, R.; Abdullah, E.C.; Ahmad, A.; Karri, R.R.; Pakalapati, H. Functionalized multi-walled carbon nanotubes and hydroxyapatite nanorods reinforced with polypropylene for biomedical application. Sci. Rep. 2021, 11, 1–10. [Google Scholar] [CrossRef] [PubMed]
- Kashif, M.; Jafaar, E.; Sahari, S.K.; Low, F.W.; Hoa, N.D.; Ahmad, A.; Abbas, A.; Ngaini, Z.; Shafa, M.; Qurashi, A. Organic sensitization of graphene oxide and reduced graphene oxide thin films for photovoltaic applications. Int. J. Energy Res. 2021. [Google Scholar] [CrossRef]
- Vidal-Iglesias, F.J.; Solla-Gullón, J.; Montiel, V.; Feliu, J.; Aldaz, A. Screening of electrocatalysts for direct ammonia fuel cell: Ammonia oxidation on PtMe (Me: Ir, Rh, Pd, Ru) and preferentially oriented Pt(100) nanoparticles. J. Power Sources 2007, 171, 448–456. [Google Scholar] [CrossRef]
- Thou, C.Z.; Khan, F.S.A.; Mubarak, N.; Ahmad, A.; Khalid, M.; Jagadish, P.; Walvekar, R.; Abdullah, E.; Khan, S.; Khan, M.; et al. Surface charge on chitosan/cellulose nanowhiskers composite via functionalized and untreated carbon nanotube. Arab. J. Chem. 2021, 14, 103022. [Google Scholar] [CrossRef]
- Saleem, M.; Irfan, M.; Tabassum, S.; Albaqami, M.D.; Javed, M.S.; Hussain, S.; Pervaiz, M.; Ahmad, I.; Ahmad, A.; Zuber, M. Experimental and theoretical study of highly porous lignocellulose assisted metal oxide photoelectrodes for dye-sensitized solar cells. Arab. J. Chem. 2021, 14, 102937. [Google Scholar] [CrossRef]
- Zou, P.; Chen, S.; Lan, R.; Tao, S. Investigation of Perovskite Oxide SrCo0.8Cu0.1Nb0.1O3–δ as a Cathode Material for Room Temperature Direct Ammonia Fuel Cells. ChemSusChem 2019, 12, 2788–2794. [Google Scholar] [CrossRef] [Green Version]
- Adli, N.M.; Zhang, H.; Mukherjee, S.; Wu, G. Review—Ammonia Oxidation Electrocatalysis for Hydrogen Generation and Fuel Cells. J. Electrochem. Soc. 2018, 165, J3130–J3147. [Google Scholar] [CrossRef]
- Suzuki, S.; Muroyama, H.; Matsui, T.; Eguchi, K. Fundamental studies on direct ammonia fuel cell employing anion exchange membrane. J. Power Sources 2012, 208, 257–262. [Google Scholar] [CrossRef]
- Li, L.; Zhu, Z.; Yan, Z.; Lu, G.; Rintoul, L. Catalytic ammonia decomposition over Ru/carbon catalysts: The importance of the structure of carbon support. Appl. Catal. A: Gen. 2007, 320, 166–172. [Google Scholar] [CrossRef]
- Schaper, H.; Doesburg, E.; Van Reijen, L. The influence of lanthanum oxide on the thermal stability of gamma alumina catalyst supports. Appl. Catal. 1983, 7, 211–220. [Google Scholar] [CrossRef]
- Mardkhe, M.K.; Huang, B.; Bartholomew, C.H.; Alam, T.M.; Woodfield, B.F. Synthesis and characterization of silica doped alumina catalyst support with superior thermal stability and unique pore properties. J. Porous Mater. 2015, 23, 475–487. [Google Scholar] [CrossRef]
- Jo, J.-O.; Trinh, Q.H.; Kim, S.H.; Mok, Y.S. Plasma-catalytic decomposition of nitrous oxide over γ-alumina-supported metal oxides. Catal. Today 2018, 310, 42–48. [Google Scholar] [CrossRef]
- Yang, X.; Sun, M.; Liu, B.; Lin, W. NOx removal by oxidation on alumina supported metal oxide catalysts followed by alkaline absorption. China Pet. Process. Petrochem. Technol. 2019, 21, 1–9. [Google Scholar]
- Sandupatla, A.S.; Ray, K.; Thaosen, P.; Sivananda, C.; Deo, G. Oxidative dehydrogenation of propane over alumina supported vanadia catalyst–Effect of carbon dioxide and secondary surface metal oxide additive. Catal. Today 2020, 354, 176–182. [Google Scholar] [CrossRef]
- Adil, S.F.; Assal, M.E.; Khan, M.; Shaik, M.R.; Kuniyil, M.; Sekou, D.; Dewidar, A.Z.; Al-Warthan, A.; Siddiqui, M.R.H. Eco-Friendly Mechanochemical Preparation of Ag2O–MnO2/Graphene Oxide Nanocomposite: An Efficient and Reusable Catalyst for the Base-Free, Aerial Oxidation of Alcohols. Catalysts 2020, 10, 281. [Google Scholar] [CrossRef] [Green Version]
- Yin, Z.; Xie, L.; Cao, S.; Xiao, Y.; Chen, G.; Jiang, Y.; Wei, W.; Wu, L. Ag/Ag2O confined visible-light driven catalyst for highly efficient selective hydrogenation of nitroarenes in pure water medium at room temperature. Chem. Eng. J. 2020, 394, 125036. [Google Scholar] [CrossRef]
- Tankov, I.; Arishtirova, K.; Bueno, J.M.; Damyanova, S. Surface and structural features of Pt/PrO2–Al2O3 catalysts for dry methane reforming. Appl. Catal. A: Gen. 2014, 474, 135–148. [Google Scholar] [CrossRef]
- Wachs, I.E. Recent conceptual advances in the catalysis science of mixed metal oxide catalytic materials. Catal. Today 2005, 100, 79–94. [Google Scholar] [CrossRef]
- Sharma, R.V.; Kumar, P.; Dalai, A.K. Selective hydrogenolysis of glycerol to propylene glycol by using Cu:Zn:Cr:Zr mixed metal oxides catalyst. Appl. Catal. A Gen. 2014, 477, 147–156. [Google Scholar] [CrossRef]
- Berenguer Betrián, R.; Quijada, C.; Morallón, E. The nature of the electro-catalytic response of mixed metal oxides: Pt-and Ru-doped SnO2 anodes. ChemElectroChem 2019, 6, 1057–1068. [Google Scholar] [CrossRef] [Green Version]
- Gangwar, J.; Gupta, B.K.; Kumar, P.; Tripathi, S.K.; Srivastava, A.K. Time-resolved and photoluminescence spectroscopy of θ-Al2O3nanowires for promising fast optical sensor applications. Dalton Trans. 2014, 43, 17034–17043. [Google Scholar] [CrossRef] [PubMed]
- Domínguez-Crespo, M.; Díaz-García, L.; De La Paz, M.C.; Zárate-Ramos, R.; Santes, V.; Pérez, G.L.; Arce-Estrada, E.; Torres-Huerta, A. Influence of Alumina Crystal Size on the Hydrotreating Activity of Supported NiMo Catalysts Using Real Feedstock. Pet. Sci. Technol. 2006, 24, 485–506. [Google Scholar] [CrossRef]
- Xu, L.; Wei, B.; Liu, W.; Zhang, H.; Su, C.; Che, J. Flower-like ZnO-Ag2O composites: Precipitation synthesis and photocatalytic activity. Nanoscale Res. Lett. 2013, 8, 536. [Google Scholar] [CrossRef] [Green Version]
- Zhu, L.; Wei, B.; Xu, L.; Lu, Z.; Zhang, H.; Gao, H.; Che, J. Ag2O–Bi2O3 composites: Synthesis, characterization and high efficient photocatalytic activities. CrystEngComm 2012, 14, 5705–5709. [Google Scholar] [CrossRef]
- Dhoondia, Z.H.; Chakraborty, H. Lactobacillus mediated synthesis of silver oxide nanoparticles. Nanomater. Nanotechnol. 2012, 2, 15. [Google Scholar] [CrossRef] [Green Version]
- Vorokh, A. Scherrer formula: Estimation of error in determining small nanoparticle size. Nanosyst. Physics, Chem. Math. 2018, 9. [Google Scholar] [CrossRef] [Green Version]
- Ghosh, M.; Dilawar, N.; Bandyopadhyay, A.K.; Raychaudhuri, A.K. Phonon dynamics of Zn(Mg,Cd)O alloy nanostructures and their phase segregation. J. Appl. Phys. 2009, 106, 084306. [Google Scholar] [CrossRef] [Green Version]
- Mahan, G.D.; Lucas, A.A. Collective vibrational modes of adsorbed CO. J. Chem. Phys. 1978, 68, 1344–1348. [Google Scholar] [CrossRef]
- Cheng, B.; Xiao, Y.; Wu, G.; Zhang, L. The vibrational properties of one-dimensional ZnO: Ce nanostructures. Appl. Phys. Lett. 2004, 84, 416–418. [Google Scholar] [CrossRef]
- Tripathi, S.; Mehrotra, G.K.; Dutta, P.K. Chitosan–silver oxide nanocomposite film: Preparation and antimicrobial activity. Bull. Mater. Sci. 2011, 34, 29–35. [Google Scholar] [CrossRef] [Green Version]
- Waterhouse, G.I.N.; Bowmaker, G.A.; Metson, J.B. The thermal decomposition of silver (I, III) oxide: A combined XRD, FT-IR and Raman spectroscopic study. Phys. Chem. Chem. Phys. 2001, 3, 3838–3845. [Google Scholar] [CrossRef]
- González Hernández, N.N.; Contreras, J.L.; Pinto, M.; Zeifert, B.; Flores Moreno, J.L.; Fuentes, G.A.; Hernández-Terán, M.E.; Vázquez, T.; Salmones, J.; Jurado, J.M. Improved NOx reduction using C3H8 and H2 with Ag/Al2O3 catalysts promoted with Pt and WOx. Catalysts 2020, 10, 1212. [Google Scholar] [CrossRef]
- Yiğitalp, A. Nafion Modified NCA Cathode Synthesis for Superior Cycling Performance of Lithium-Ion Batteries. Ph.D. Thesis, Sabancı University, Istanbul, Turkey, 2019. [Google Scholar]
- Kashif, M.; Jaafar, E.; Bhadja, P.; Low, F.W.; Sahari, S.K.; Hussain, S.; Loong, F.K.; Ahmad, A.; Algarni, T.S.; Shafa, M.; et al. Effect of potassium permanganate on morphological, structural and electro-optical properties of graphene oxide thin films. Arab. J. Chem. 2021, 14, 102953. [Google Scholar] [CrossRef]
- Sharifi, E.; Salimi, A.; Shams, E. Electrocatalytic activity of nickel oxide nanoparticles as mediatorless system for NADH and ethanol sensing at physiological pH solution. Biosens. Bioelectron. 2013, 45, 260–266. [Google Scholar] [CrossRef]
- Sharifi, E.; Salimi, A.; Shams, E.; Noorbakhsh, A.; Amini, M.K. Shape-dependent electron transfer kinetics and catalytic activity of NiO nanoparticles immobilized onto DNA modified electrode: Fabrication of highly sensitive enzymeless glucose sensor. Biosens. Bioelectron. 2014, 56, 313–319. [Google Scholar] [CrossRef]
- Guo, D.J.; Li, H.L. Highly dispersed Ag nanoparticles on functional MWNT surfaces for methanol oxidation in alkaline solution. Carbon 2005, 43, 1259–1264. [Google Scholar] [CrossRef]
- Droog, J.M.; Huisman, F. Electrochemical formation and reduction of silver oxides in alkaline media. J. Electroanal. Chem. 1980, 115, 211–224. [Google Scholar] [CrossRef]
- Sun, Z.; Han, Y.; Gao, M.; Wei, X.; Hu, X. Cetyl trimethyl ammonium bromide-assisted electrochemical preparation of palladium-nickel bimetallic electrode. Int. J. Electrochem. Sci. 2011, 6, 5626–5638. [Google Scholar]
- Matinise, N.; Mayedwa, N.; Ikpo, C.O.; Hlongwa, N.W.; Ndipingwi, M.M.; Molefe, L.; Dywili, N.; Yonkeu, A.L.D.; Waryo, T.; Baker, P.G.L.; et al. Bimetallic Nanocomposites of Palladium (100) and Ruthenium for Electrooxidation of Ammonia. J. Nano Res. 2016, 44, 100–113. [Google Scholar] [CrossRef]
- Lomocso, T.L.; Baranova, E.A. Electrochemical oxidation of ammonia on carbon-supported bi-metallic PtM (M=Ir, Pd, SnOx) nanoparticles. Electrochim. Acta 2011, 56, 8551–8558. [Google Scholar] [CrossRef]
- Matsui, T.; Suzuki, S.; Katayama, Y.; Yamauchi, K.; Okanishi, T.; Muroyama, H.; Eguchi, K. In Situ Attenuated Total Reflection Infrared Spectroscopy on Electrochemical Ammonia Oxidation over Pt Electrode in Alkaline Aqueous Solutions. Langmuir 2015, 31, 11717–11723. [Google Scholar] [CrossRef]
- Katayama, Y.; Okanishi, T.; Muroyama, H.; Matsui, T.; Eguchi, K. Electrochemical oxidation of ammonia over rare earth oxide modified platinum catalysts. J. Phys. Chem. C 2015, 119, 9134–9141. [Google Scholar] [CrossRef]
- Zhang, H.; Wang, Y.; Wu, Z.; Leung, D.Y. An ammonia electrolytic cell with NiCu/C as anode catalyst for hydrogen production. Energy Procedia 2017, 142, 1539–1544. [Google Scholar] [CrossRef]
- Chrzescijanska, E.; Wudarska, E.; Kusmierek, E.; Rynkowski, J. Study of acetylsalicylic acid electroreduction behavior at platinum electrode. J. Electroanal. Chem. 2014, 713, 17–21. [Google Scholar] [CrossRef]
- Mujtaba, A.; Janjua, N.K. Fabrication and electrocatalytic application of CuO@Al2O3 hybrids. J. Electrochem. Soc. 2015, 162, H328. [Google Scholar] [CrossRef]
- Castilho, M.; Almeida, L.E.; Tabak, M.; Mazo, L.H. Voltammetric oxidation of dipyridamole in aqueous acid solutions. J. Braz. Chem. Soc. 2000, 11, 148–153. [Google Scholar] [CrossRef]
- Holze, R.; Brett, C.M.A.; Brett, A.M.O. Electrochemistry—Principles, Methods and Applications; Oxford University Press Inc.: New York, NY, USA, 1993. [Google Scholar]
- Soleymani, J.; Hasanzadeh, M.; Shadjou, N.; Jafari, M.K.; Gharamaleki, J.V.; Yadollahi, M.; Jouyban, A. A new kinetic–mechanistic approach to elucidate electrooxidation of doxorubicin hydrochloride in unprocessed human fluids using magnetic graphene based nanocomposite modified glassy carbon electrode. Mater. Sci. Eng. C 2016, 61, 638–650. [Google Scholar] [CrossRef]
- Masek, A.; Chrzescijanska, E.; Zaborski, M. Electrooxidation of morin hydrate at a Pt electrode studied by cyclic voltammetry. Food Chem. 2014, 148, 18–23. [Google Scholar] [CrossRef] [PubMed]
- Mazloum-Ardakani, M.; Taleat, Z. Investigation of electrochemistry behavior of hydroxylamine at glassy carbon electrode by indigocarmine. Int. J. Electrochem. Sci. 2009, 4, 694–706. [Google Scholar]
- Janjua, N.K.; Jabeen, M.; Islam, M.; Yaqub, A.; Sabahat, S.; Mehmood, S.; Abbas, G. Electrochemical properties of barium cerate doped with zinc for methanol oxidation. J. Chem. Soc. Pak. 2015, 37. [Google Scholar]
- Mu, Y.; Jia, D.; He, Y.; Miao, Y.; Wu, H.-L. Nano nickel oxide modified non-enzymatic glucose sensors with enhanced sensitivity through an electrochemical process strategy at high potential. Biosens. Bioelectron. 2011, 26, 2948–2952. [Google Scholar] [CrossRef] [PubMed]
- Kapałka, A.; Cally, A.; Neodo, S.; Comninellis, C.; Wächter, M.; Udert, K.M. Electrochemical behavior of ammonia at Ni/Ni(OH)2 electrode. Electrochem. Commun. 2010, 12, 18–21. [Google Scholar] [CrossRef]
- Diaz, L.A.; Valenzuela-Muñiz, A.; Muthuvel, M.; Botte, G.G. Analysis of ammonia electro-oxidation kinetics using a rotating disk electrode. Electrochim. Acta 2013, 89, 413–421. [Google Scholar] [CrossRef]
- Marcus, R.A. On the Theory of Electron-Transfer Reactions. VI. Unified Treatment for Homogeneous and Electrode Reactions. J. Chem. Phys. 1965, 43, 679–701. [Google Scholar] [CrossRef] [Green Version]
- Oswin, H.G.; Salomon, M. The anodic oxidation of ammonia at platinum black electrodes in aqueous koh electrolyte. Can. J. Chem. 1963, 41, 1686–1694. [Google Scholar] [CrossRef]
Figure 1.
Graphical abstract elucidating the experimental, mechanistic and electrochemical insight.

Figure 2.
X-ray diffraction peaks of (a) γ-Al2O3 with Joint Committee on Powder Diffraction Standards (JCPDS) card numbers. (b) Overlay of XRD peaks of γ-Al2O3 and Ag2O(X)–PrO2(Y)/γ-Al2O3, along with JCPDS card numbers.
Figure 2.
X-ray diffraction peaks of (a) γ-Al2O3 with Joint Committee on Powder Diffraction Standards (JCPDS) card numbers. (b) Overlay of XRD peaks of γ-Al2O3 and Ag2O(X)–PrO2(Y)/γ-Al2O3, along with JCPDS card numbers.

Figure 3.
(a) FTIR spectra of γ-Al2O3 and Ag2O(X)–PrO2(Y)/γ-Al2O3 nanomaterials. (b) FTIR spectrum representing vibration modes of Ag-O and Pr-O bonds.
Figure 3.
(a) FTIR spectra of γ-Al2O3 and Ag2O(X)–PrO2(Y)/γ-Al2O3 nanomaterials. (b) FTIR spectrum representing vibration modes of Ag-O and Pr-O bonds.

Figure 4.
SEM micrographs for (A) Al2O3 and (B) Ag2O(10)/γ-Al2O3 nanocatalysts. (C) Particle size distribution of Ag2O(6)–PrO2(4)/γ-Al2O3. (D,E) EDX spectrum of Ag2O(4)–PrO2(6)/γ-Al2O3 composition. (F) TEM analysis of sample Ag2O(2)–PrO2(8)/γ-Al2O3, the inset (a) describes the area where distribution of particles taken and inset (b) represents the distributions of particles.

Figure 5.
(a) Cyclic voltammograms for Ag2O(X)–PrO2(Y)/γ-Al2O3 in K4[Fe(CN)6] + 3 M KCl redox solution. (b) Bar graph presenting the variation of electrochemical surface area (ECSA) with composition of catalysts.
Figure 5.
(a) Cyclic voltammograms for Ag2O(X)–PrO2(Y)/γ-Al2O3 in K4[Fe(CN)6] + 3 M KCl redox solution. (b) Bar graph presenting the variation of electrochemical surface area (ECSA) with composition of catalysts.

Figure 6.
Nyquist plots of Ag2O(x)–PrO2(y)/γ-Al2O3 modified electrodes recorded in 5 mM K4[Fe(CN)6] + 3 M KCl. Inset represents the equivalent circuit.
Figure 6.
Nyquist plots of Ag2O(x)–PrO2(y)/γ-Al2O3 modified electrodes recorded in 5 mM K4[Fe(CN)6] + 3 M KCl. Inset represents the equivalent circuit.

Figure 7.
(a) Electrochemical responses and peak position in 0.1 M KOH and 5 mM NH3. (b) Cyclic voltammograms towards ammonia oxidation over the surface of bare glassy carbon, γ-Al2O3 and PrO2(10)/γ-Al2O3 modified electrodes 0.1 M KOH and 5 mM NH3. (c) Comparative peak current response for bare GC, γ-Al2O3, and lowest and optimal composition, respectively.


Figure 8.
(a) Ten cycles in 5m mM NH3 + 0.1M KOH at Ag2O(2)–PrO2(8)/γ-Al2O3/GC. Scan rate variation for (b) PrO2(10)/γ-Al2O3, (c) Ag2O(6)–PrO2(4)/γ-Al2O3 at low scan rates and (d) Ag2O(6)–PrO2(4)/γ-Al2O3, at high scan rates.
Figure 8.
(a) Ten cycles in 5m mM NH3 + 0.1M KOH at Ag2O(2)–PrO2(8)/γ-Al2O3/GC. Scan rate variation for (b) PrO2(10)/γ-Al2O3, (c) Ag2O(6)–PrO2(4)/γ-Al2O3 at low scan rates and (d) Ag2O(6)–PrO2(4)/γ-Al2O3, at high scan rates.

Figure 9.
Comparative Ipa values at modified electrodes surface on (a) low and (b) high scan.

Figure 10.
(A) Dependence of Ipa on ν1/2; insets (a) and (b) show linear fitting for lower and higher scan rates for Ag2O(6)–PrO2(4)/γ-Al2O3/GC. (B) Characteristic shift in peak potential with ν1/2 for Ag2O(4)–PrO2(6)/γ-Al2O3/GC, insets (a) and (b) show linear fitting for lower and higher scan rates. (C) Dependence of Ipa on potential scan rate in double logarithm coordinates for ammonia oxidation on Ag2O(2)–PrO2(8)/γ-Al2O3/GC. (D) Variation of current function (Ipa ν−1/2) with ν for Ag2O(4)–PrO2(6)/γ-Al2O3/GC.

Figure 11.
(a) Cyclic voltammograms with Ag2O(8)–PrO2(2)/γ-Al2O3 electrode at different concentrations of NH3 and (b) Reinmuth plots between Ipa and CNH3, showing variation of peak current with CNH3 for and for all modified electrodes.
Figure 11.
(a) Cyclic voltammograms with Ag2O(8)–PrO2(2)/γ-Al2O3 electrode at different concentrations of NH3 and (b) Reinmuth plots between Ipa and CNH3, showing variation of peak current with CNH3 for and for all modified electrodes.

Figure 12.
(a) Peak current output varied with increase in temperature and (b) Marcus plots between temperature and rate constants.
Figure 12.
(a) Peak current output varied with increase in temperature and (b) Marcus plots between temperature and rate constants.

Figure 13.
Linear-sweep voltammograms (LSV) vs. cyclic voltammogram (CV) for oxidation of ammonia in 0.1 M KOH at 100 mV·s−1 on the surface of optimum composition/GC.
Figure 13.
Linear-sweep voltammograms (LSV) vs. cyclic voltammogram (CV) for oxidation of ammonia in 0.1 M KOH at 100 mV·s−1 on the surface of optimum composition/GC.


Table 1.
Calculated values for average crystallite size and average particle size.
| Electrocatalysts | Davg(XRD) (nm) | Davg(SEM) (nm) |
|---|---|---|
| PrO2(10)/γ-Al2O3 | 41.3 | 26.02 |
| Ag2O(2)–PrO2(8)/γ-Al2O3 | 25.4 | 20.76 |
| Ag2O(4)–PrO2(6)/γ-Al2O3 | 28.9 | 29.41 |
| Ag2O(6)–PrO2(4)/γ-Al2O3 | 32.3 | 31.01 |
| Ag2O(8)–PrO2(2)/γ-Al2O3 | 20.3 | 23.02 |
| Ag2O(10)/γ-Al2O3 | 25.0 | 31.04 |
Table 2.
Elemental compositions (wt.%) from EDX analysis of samples.
| Samples | wt.% Al | wt.% O | wt.% Pr | wt.% Ag |
|---|---|---|---|---|
| PrO2(10)/γ-Al2O3 | 26.90 | 69.90 | 9.20 | − |
| Ag2O(2)–PrO2(8)/γ-Al2O3 | 42.40 | 48.86 | 8.19 | 1.56 |
| Ag2O(4)–PrO2(6)/γ-Al2O3 | 42.57 | 51.88 | 5.87 | 3.45 |
| Ag2O(6)–PrO2(4)/γ-Al2O3 | 38.70 | 57.76 | 3.54 | 6.30 |
| Ag2O(8)–PrO2(2)/γ-Al2O3 | 35.24 | 61.00 | 1.54 | 7.39 |
| Ag2O(10)/γ-Al2O3 | 32.95 | 64.36 | − | 8.95 |
Table 3.
Parameters corresponding to electrochemical impedance (EIS) response of electrocatalysts.
| Electrocatalysts | Rs (Ω) | Rct (kΩ) | CPE (µF) | A | Rw (Ω) | kapp/10−9 (cm·s−1) |
|---|---|---|---|---|---|---|
| PrO2(10)/γ-Al2O3 | 390.0 | 50.0 | 3.70 | 0.90 | 24.0 | 1.10 |
| Ag2O(2)–PrO2(8)/γ-Al2O3 | 389.0 | 40.4 | 3.00 | 0.89 | 29.0 | 1.30 |
| Ag2O(4)–PrO2(6)/γ-Al2O3 | 388.0 | 27.0 | 1.40 | 0.90 | 24.4 | 1.97 |
| Ag2O(6)–PrO2(4)/γ-Al2O3 | 243.0 | 24.7 | 43.0 | 0.90 | 21.9 | 2.20 |
| Ag2O(8)–PrO2(2)/γ-Al2O3 | 388.2 | 29.7 | 2.00 | 0.85 | 25.6 | 1.80 |
| Ag2O(10)/γ-Al2O3 | 388.3 | 36.5 | 2.20 | 0.92 | 29.7 | 1.50 |
Table 4.
Comparison of oxidation potentials for different systems.
| Sr. No. | Modified Electrode Systems | Oxidation Potential Range (V) | Reference |
|---|---|---|---|
| 1 | Carbon-supported Pt/HOPG electrode | 0.55–0.75 | [51] |
| 2 | Pt film electrode/Si prism | 0.45–0.85 | [52] |
| 3 | Pt disk electrode and Pt/PBI/MWNT | 0.45–0.90 | [53] |
| 4 | Ag−Pr/Al/GC electrode | 0.32–0.51 | This work |
GC, glassy carbon.
Table 5.
Kinetic parameters for NH3 electro-oxidation at the electrode surfaces.
| Electrocatalysts | α | (D°)/10−9 cm2·s−1 | (mT)/cm·s−1 | k°/10−3 cm·s−1 |
|---|---|---|---|---|
| PrO2(10)/γ-Al2O3 | 0.5 | 0.063 | 0.0005 | 0.40 |
| Ag2O(2)–PrO2(8)/γ-Al2O3 | 0.5 | 0.140 | 0.0007 | 0.72 |
| Ag2O(4)–PrO2(6)/γ-Al2O3 | 0.7 | 11.00 | 0.0070 | 6.10 |
| Ag2O(6)–PrO2(4)/γ-Al2O3 | 0.6 | 36.50 | 0.0120 | 7.40 |
| Ag2O(8)–PrO2(2)/γ-Al2O3 | 0.4 | 4.040 | 0.0040 | 5.20 |
| Ag2O(10)/γ-Al2O3 | 0.4 | 0.300 | 0.0011 | 1.60 |
Table 6.
Thermodynamic parameters calculated from the Marcus equation.
| Electrocatalysts | (ΔH)/kJ·mol−1 | (ΔS)/kJ·mol−1K−1 | (ΔG)/kJ·mol−1 |
|---|---|---|---|
| PrO2(10)/γ-Al2O3 | −1.24 | −0.119 | 32.0 |
| Ag2O(2)–PrO2(8)/γ-Al2O3 | −1.30 | −0.100 | 29.0 |
| Ag2O(4)–PrO2(6)/γ-Al2O3 | −1.23 | −0.080 | 23.6 |
| Ag2O(6)–PrO2(4)/γ-Al2O3 | −1.22 | −0.082 | 23.0 |
| Ag2O(8)–PrO2(2)/γ-Al2O3 | −1.23 | −0.085 | 24.0 |
| Ag2O(10)/γ-Al2O3 | −1.24 | −0.094 | 27.0 |
Publisher’s Note: MDPI stays neutral with regard to jurisdictional claims in published maps and institutional affiliations. |
© 2021 by the authors. Licensee MDPI, Basel, Switzerland. This article is an open access article distributed under the terms and conditions of the Creative Commons Attribution (CC BY) license (http://creativecommons.org/licenses/by/4.0/).
Share and Cite
MDPI and ACS Style
Khan, M.; Janjua, N.K.; Khan, S.; Qazi, I.; Ali, S.; Saad Algarni, T. Electro-Oxidation of Ammonia at Novel Ag2O−PrO2/γ-Al2O3 Catalysts. Coatings 2021, 11, 257. https://0-doi-org.brum.beds.ac.uk/10.3390/coatings11020257
AMA Style
Khan M, Janjua NK, Khan S, Qazi I, Ali S, Saad Algarni T. Electro-Oxidation of Ammonia at Novel Ag2O−PrO2/γ-Al2O3 Catalysts. Coatings. 2021; 11(2):257. https://0-doi-org.brum.beds.ac.uk/10.3390/coatings11020257
Chicago/Turabian StyleKhan, Mariam, Naveed Kausar Janjua, Safia Khan, Ibrahim Qazi, Shafaqat Ali, and Tahani Saad Algarni. 2021. "Electro-Oxidation of Ammonia at Novel Ag2O−PrO2/γ-Al2O3 Catalysts" Coatings 11, no. 2: 257. https://0-doi-org.brum.beds.ac.uk/10.3390/coatings11020257
Note that from the first issue of 2016, this journal uses article numbers instead of page numbers. See further details here.