Effect of Glass Bubbles on Friction and Wear Characteristics of PDMS-Based Composites


Department of Mechanical Engineering, Chosun University, Gwangju 61452, Korea
*
Author to whom correspondence should be addressed.
Coatings 2021, 11(5), 603; https://0-doi-org.brum.beds.ac.uk/10.3390/coatings11050603
Submission received: 17 April 2021
/
Revised: 11 May 2021
/
Accepted: 15 May 2021
/
Published: 19 May 2021
(This article belongs to the Section Tribology)
Abstract
:The purpose of this study is to improve the mechanical durability and surface frictional characteristics of polymer/ceramic-based composite materials. Polydimethylsiloxane (PDMS)/glass bubble (GB) composite specimens are prepared at various weight ratios (PDMS:GB) by varying the amount of micro-sized GBs added to the PDMS. The surface, mechanical, and tribological characteristics of the PDMS/GB composites are evaluated according to the added ratios of GBs. The changes in internal stress according to the indentation depth after contacting with a steel ball tip to the bare PDMS and PDMS/GB composites having different GB densities are compared through finite element analysis simulation. The elastic modulus is proportional to the GB content, while the friction coefficient generally decreases as the GB content increases. A smaller amount of GB in the PDMS/GB composite results in more surface damage than the bare PDMS, but a significant reduction in wear rate is achieved when the ratio of PDMS:GB is greater than 100:5.

1. Introduction
Polydimethylsiloxane (PDMS) is not only biofriendly with properties similar to those of the human flesh and skin, but it is also highly plasticized and affordable [1]. Therefore, it is used as a substrate and a surface protection coating material for advanced parts, such as electrodes, displays, MEMS, electrical parts, optical devices, and medical devices [2,3,4,5,6,7,8]. However, PDMS exhibits relatively weak mechanical properties when used unmodified; therefore, it cannot completely replace the mechanical parts of metals and ceramic materials. The mechanical properties and surface durability of PDMS must be improved such that it can be applied widely. It is known that polymeric materials such as PDMS, epoxy, and polyurethane are significantly affected by experimental conditions such as vertical loads, sliding speed/distance/cycles, and curing conditions [9,10,11,12,13]. In particular, it has been reported that the friction and wear characteristics differed depending on the vertical load or the stiffness of the specimen [12].
The mechanical properties such as the elastic modulus and stiffness of PDMS specimens fabricated by varying the addition ratio of the curing agent changed, and it was proven that these changes significantly affected the friction and wear characteristics [11,12]. A study regarding the friction and wear characteristics of PDMS under different load conditions conducted, and it confirmed that the wear mechanism differed depending on the load condition [12]. Based on results of previous studies, bare PDMS demonstrated different friction and wear and mechanical properties depending on the experimental conditions, and the friction coefficient was typically 1.0 or higher. Various studies have been conducted to reduce the large friction coefficient of PDMS, and it has been reduced primarily using surface patterning or lubricants [14,15].
Recently, studies have been conducted to analyze changes in the mechanical properties of PDMS by adding micro/nanosized iron, carbon nanotubes, boron nitride particles, etc., to PDMS [16,17,18]. In general, the mechanical properties of PDMS improved with the addition of certain particles. As described above, many studies have been conducted to improve the mechanical properties by adding high-strength particles to PDMS, which exhibit weak mechanical properties; however, the added particles might corrode, or biological applications or environmental aspects might be affected adversely. In addition, the expensive nanomaterials used as the particles limit the commercialization of composite materials. For application to various machinery and material fields, it is necessary to develop polymeric composite materials that are bio/environment-friendly, do not cause oxidation/corrosion, and relatively inexpensive.
Therefore, in this study, micro-sized glass bubble (GB) particles with high fracture strength and low density were added to PDMS to produce PDMS/GB composites and to evaluate the surface, mechanical and friction and wear characteristics based on the GB addition ratio. In addition, the wear mechanism of PDMS/GB composites according to the GB addition ratio was analyzed, and finite element analysis simulations were performed on the contact behavior.
2. Materials and Methods
2.1. Materials
PDMS/GB composite specimens were prepared by mixing a PDMS base, a curing agent, and GBs. The density and the molecular weight of the PDMS (Sylgard 184 base & Curing agent, DOW, Seoul, Korea) are 965 kg/m3 and 28,000 g/mol, respectively. The added GB (iM30K, 3M, Seoul, Korea) was a soda-lime-borosilicate glass component in the form of a hollow sphere with a thin wall thickness. The GBs had a density of 0.6 g/cm3 and a fracture strength of 186 MPa. GBs measuring less than 30 µm in diameter were used. The physical properties of these GBs are summarized in Table 1. By varying the amount of GB added to bare PDMS, PDMS/GB composite specimens were prepared. First, PDMS/GB composite solutions of different densities were produced by adding 4 g of PDMS base to a 60 mm diameter Petri dish and adding GBs at weight ratios of 100:0.5, 100:1, 100:5, 100:20, and 100:30 to the PDMS base. Subsequently, the PMDS/GB composite solutions were mixed with a curing agent at a weight ratio of 10:1 compared with the PDMS base. The mixed PDMS/GB composite solutions were cured for more than 24 h at room temperature. After being cured completely, they were cut into approximately 35 mm × 35 mm squares to fabricate sheet-shaped specimens with a thickness of about 2 mm.
2.2. Experiments
The surface morphology and roughness of bare PDMS and various ratios of PDMS/GB composite specimens were analyzed using a scanning electron microscope (SEM, JSM-IT300, JEOL, Tokyo, Japan) and a three-dimensional (3D) laser scanning confocal microscope (VK-X200, KEYENCE, Osaka, Japan) [19]. The SEM measurement was performed under the conditions of a beam energy of 10 kV and a working distance of 8.4 mm. The surface roughness of all specimens was measured under the same conditions, and the average surface roughness values of the entire measured area were obtained.
Using a micropipette (S Series Variable Micropipettes, Top Science, Incheon, Korea), 10 µL of deionized water was constantly deposited onto the specimen surface. The contact angle of the water droplet formed on the surface was measured. The side image of the water droplet formed on the surface of the specimen was captured using a microscope camera (U1000X, Wtong Industry Group, Seoul, Korea). In the photographed images, the contact angles of the water droplets were analyzed. The contact angles were repeatedly measured three or more times to ensure the reliability of the result.
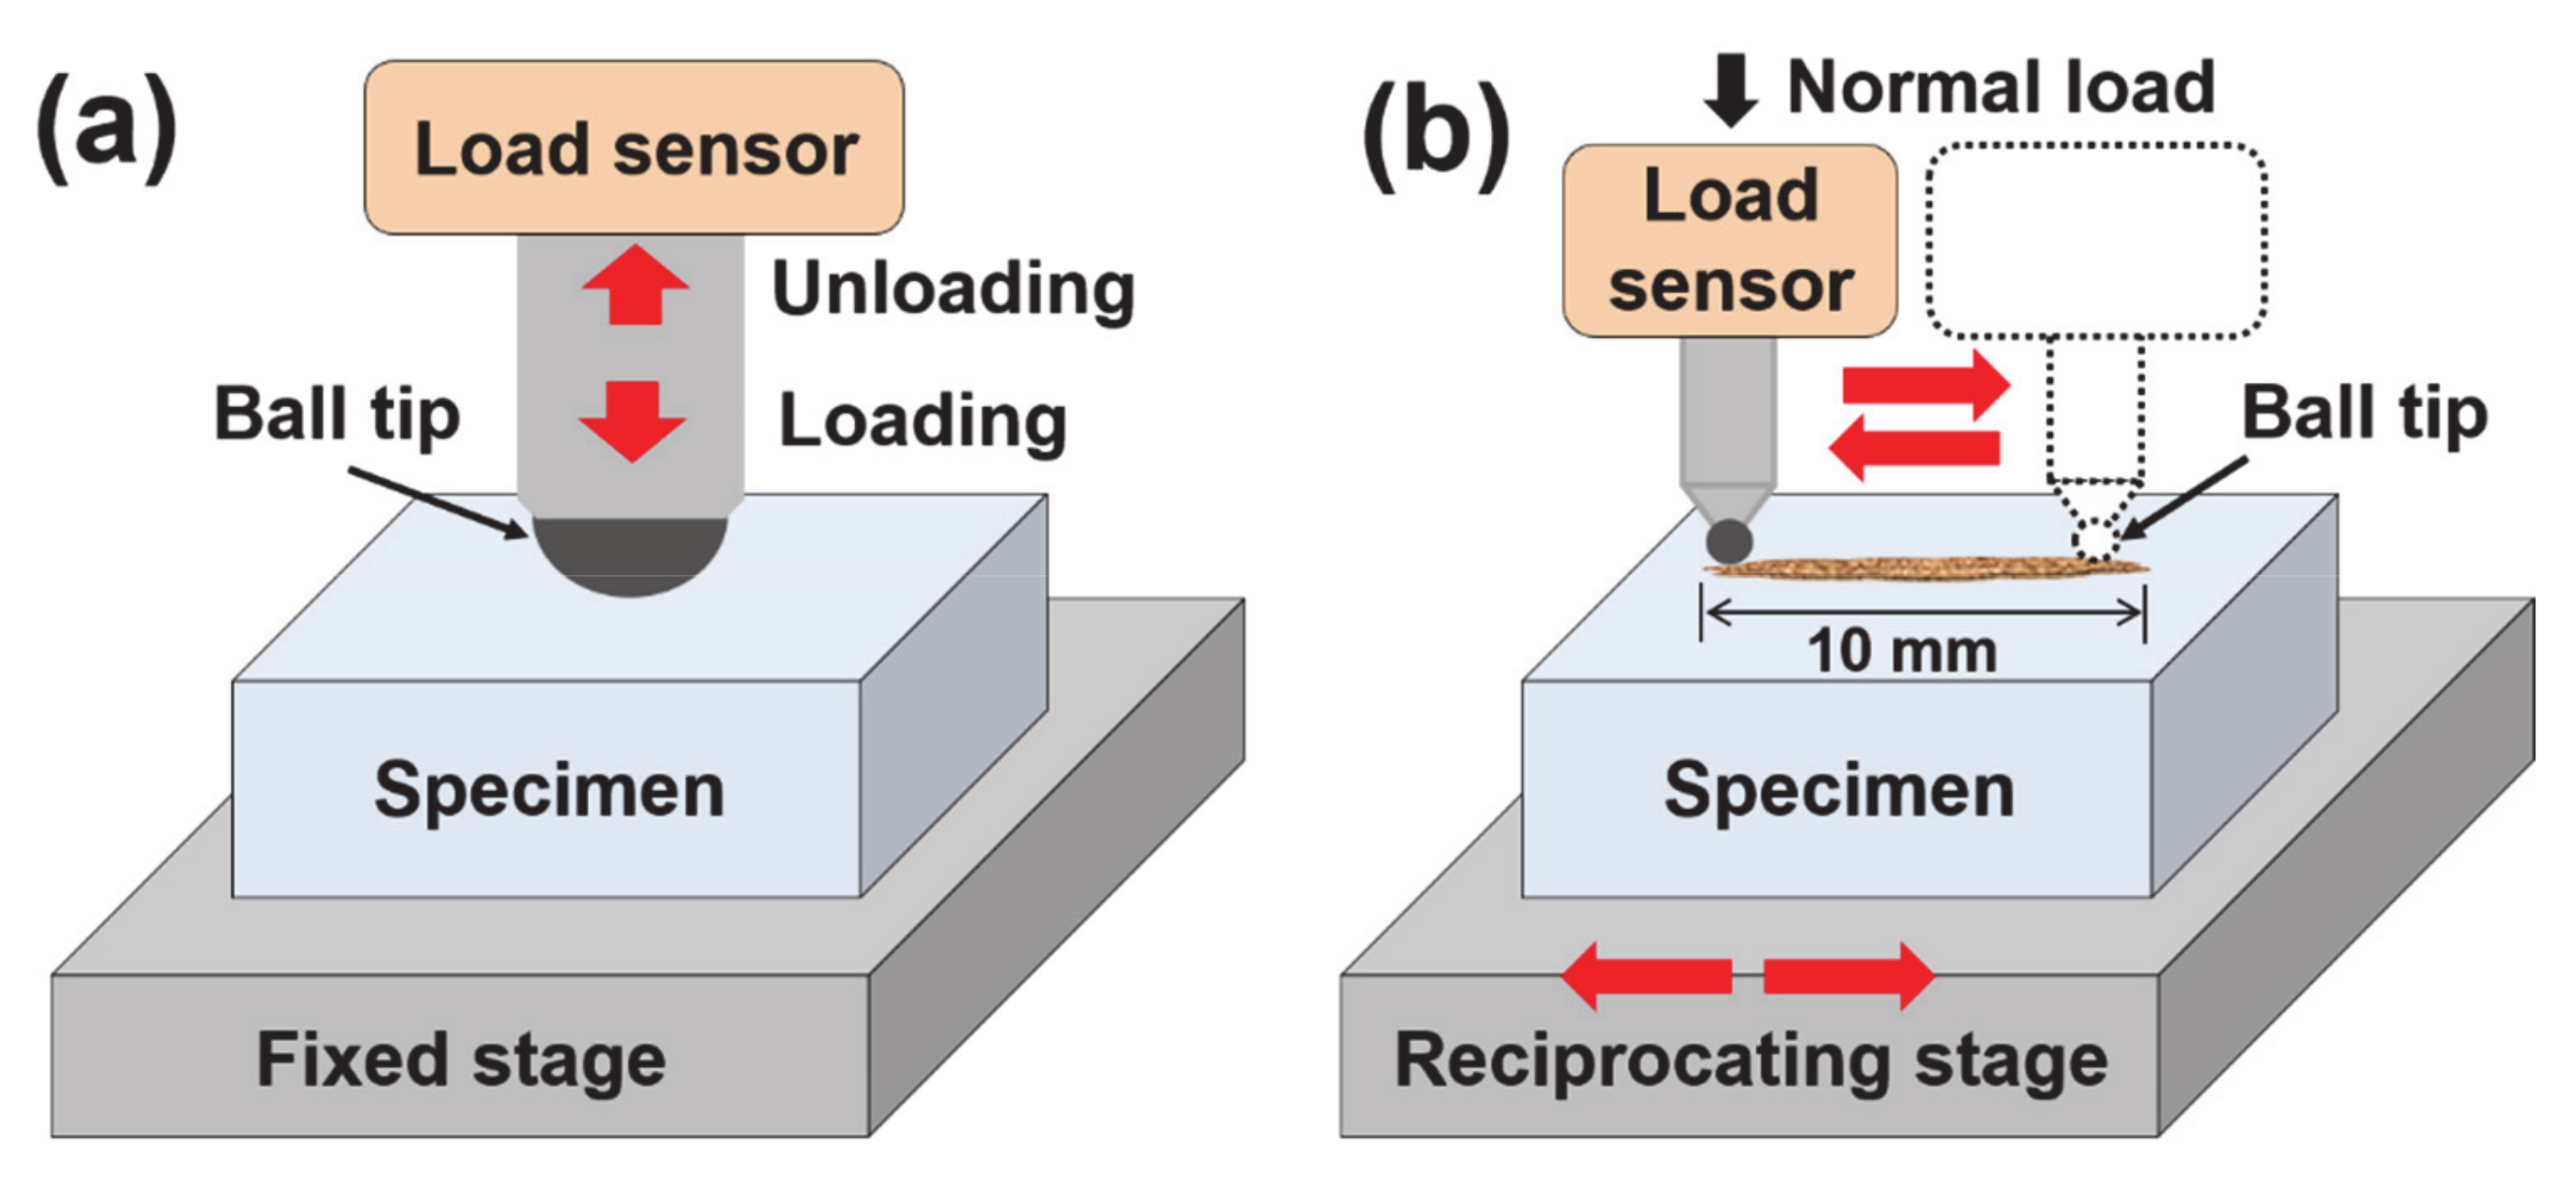
As shown in Figure 1a, a custom-built indentation tester was used to measure the mechanical properties of the composite specimens according to GB addition. A steel ball with a diameter of 25.4 mm was used as the indenter tip to compress the micro-sized GBs with a wide surface. The maximum load was set to 1.5 N, and the loading/unloading motions were of a constant speed of 0.05 mm/s. The experimental indentation conditions are summarized in Table 2. The change in the load size based on the applied indentation depth was measured through the load cell attached to the ball tip. Based on the experimental results, force-depth (F-D) curves were drawn, and the elastic modulus values of the specimens were calculated based on these F-D curves [20,21,22]. To ensure the reliability of the experimental results, all experiments were repeated three or more times under the same conditions.
To evaluate the friction and wear characteristics of the PDMS/GB composites, tribotests (RFW 160, NEOPLUS, Co., Ltd., Daejeon, Korea) of the reciprocating-type sliding motion method were conducted, as shown in Figure 1b. In these experiments, a steel ball with a diameter of 1 mm was used as the tip. Steel balls have higher mechanical properties than PDMS and are applied in various fields such as abrasives and bearings. They are primarily used as parts that require corrosion resistance, durability, and wear resistance. Furthermore, it is used as a counterpart for evaluating the friction and wear characteristics of high-hardness coatings [23]. After a vertical load of 100 mN was applied, a reciprocating sliding motion of a 10 mm sliding stroke was performed for 5000 cycles at a sliding speed of 40 mm/s. These friction and wear experimental conditions are summarized in Table 3.
The friction forces generated during the reciprocating sliding motion were measured in real-time through the load cell, and data calculated as the friction coefficient, which were values obtained by dividing the friction forces by the applied load, were obtained. All experiments were repeated more than three times under the same conditions at room temperature and humidity. After the friction test was completed, the wear track formed on the surface of the specimen was measured using a 3D laser scanning confocal microscope and the SEM. The wear volume was calculated by multiplying the cross-sectional area of the wear track measured using the analysis program by the length of the wear track. The wear rate is a value obtained by dividing the average wear volume by the applied normal load and the total sliding distance. It is primarily used for the relative comparison of wear resistance [24].
3. Results and Discussion
3.1. Surface Property
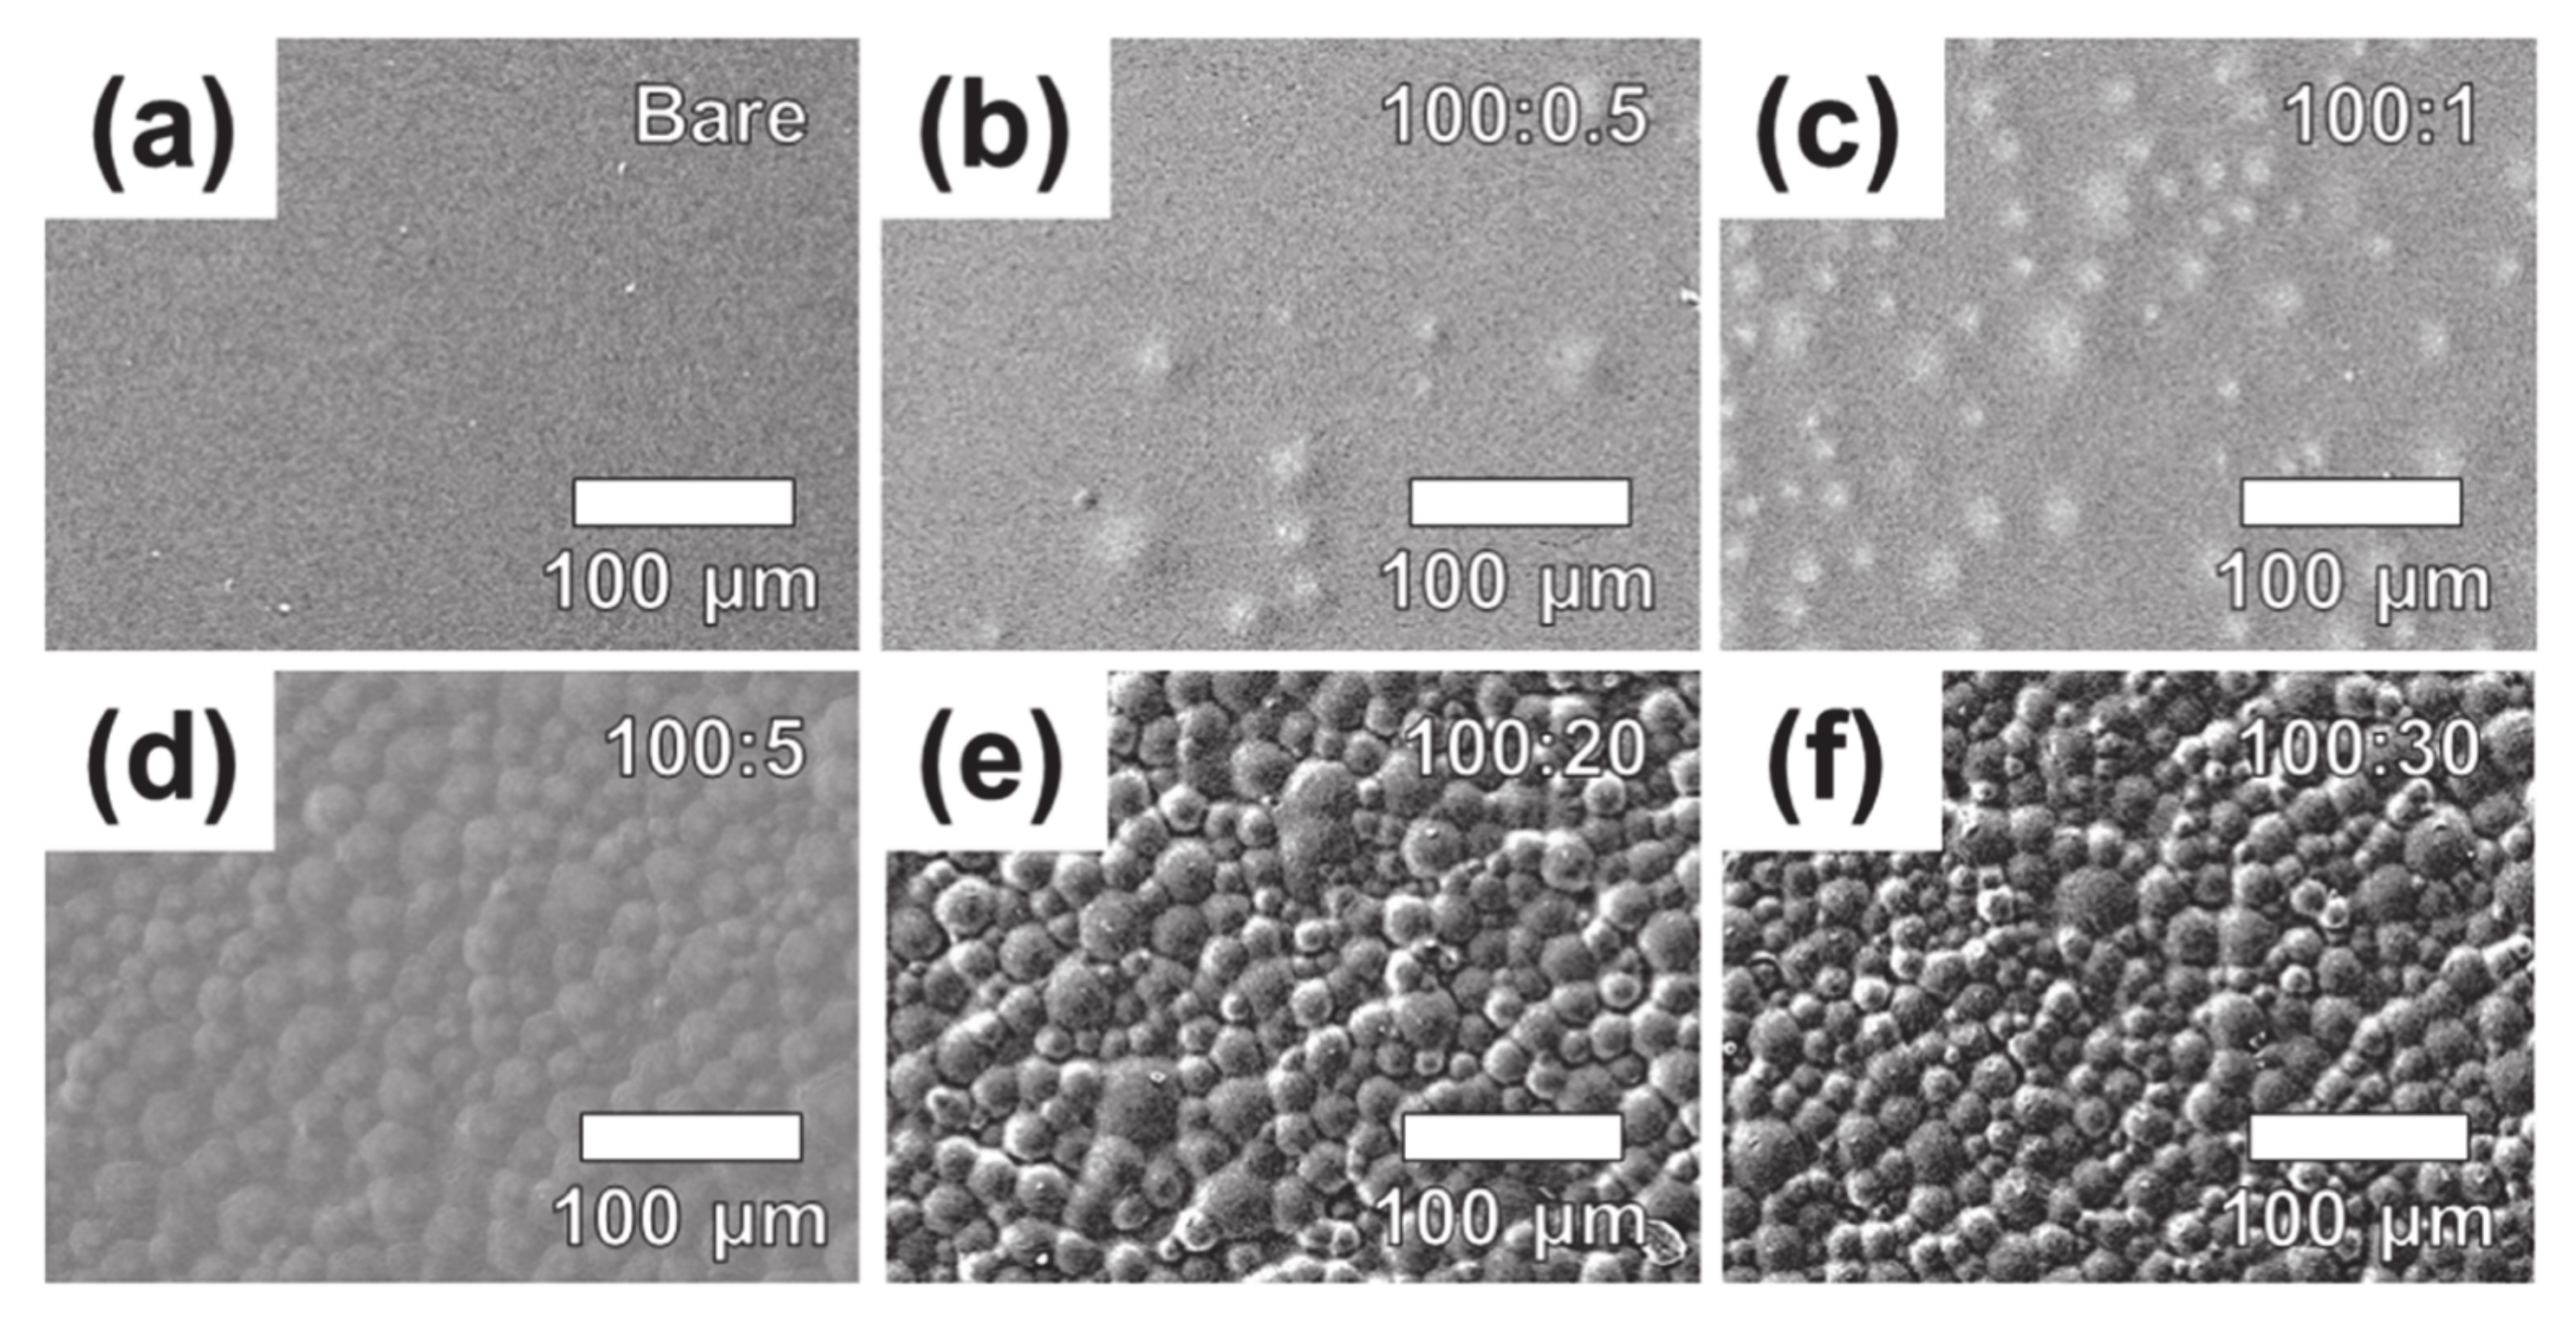
The surface morphologies of bare PDMS and PDMS/GB composite specimens with different GB content ratios were measured using the SEM, as shown in Figure 2. The surface of bare PDMS is smooth, while the surfaces of PDMS/GB composites are uneven by GBs. PDMS/GB composites with ratios greater than 100:5 were full of GBs over the entire surface, while those with 100:0.5 and 100:1 ratios showed sparse GBs and smooth PDMS surfaces. It can be seen that GBs were almost saturated on the surface of PDMS/GB composites with a ratio of 100:5 or higher, and as the content ratio of GBs increased, the GBs were formed slightly more densely on the surfaces.
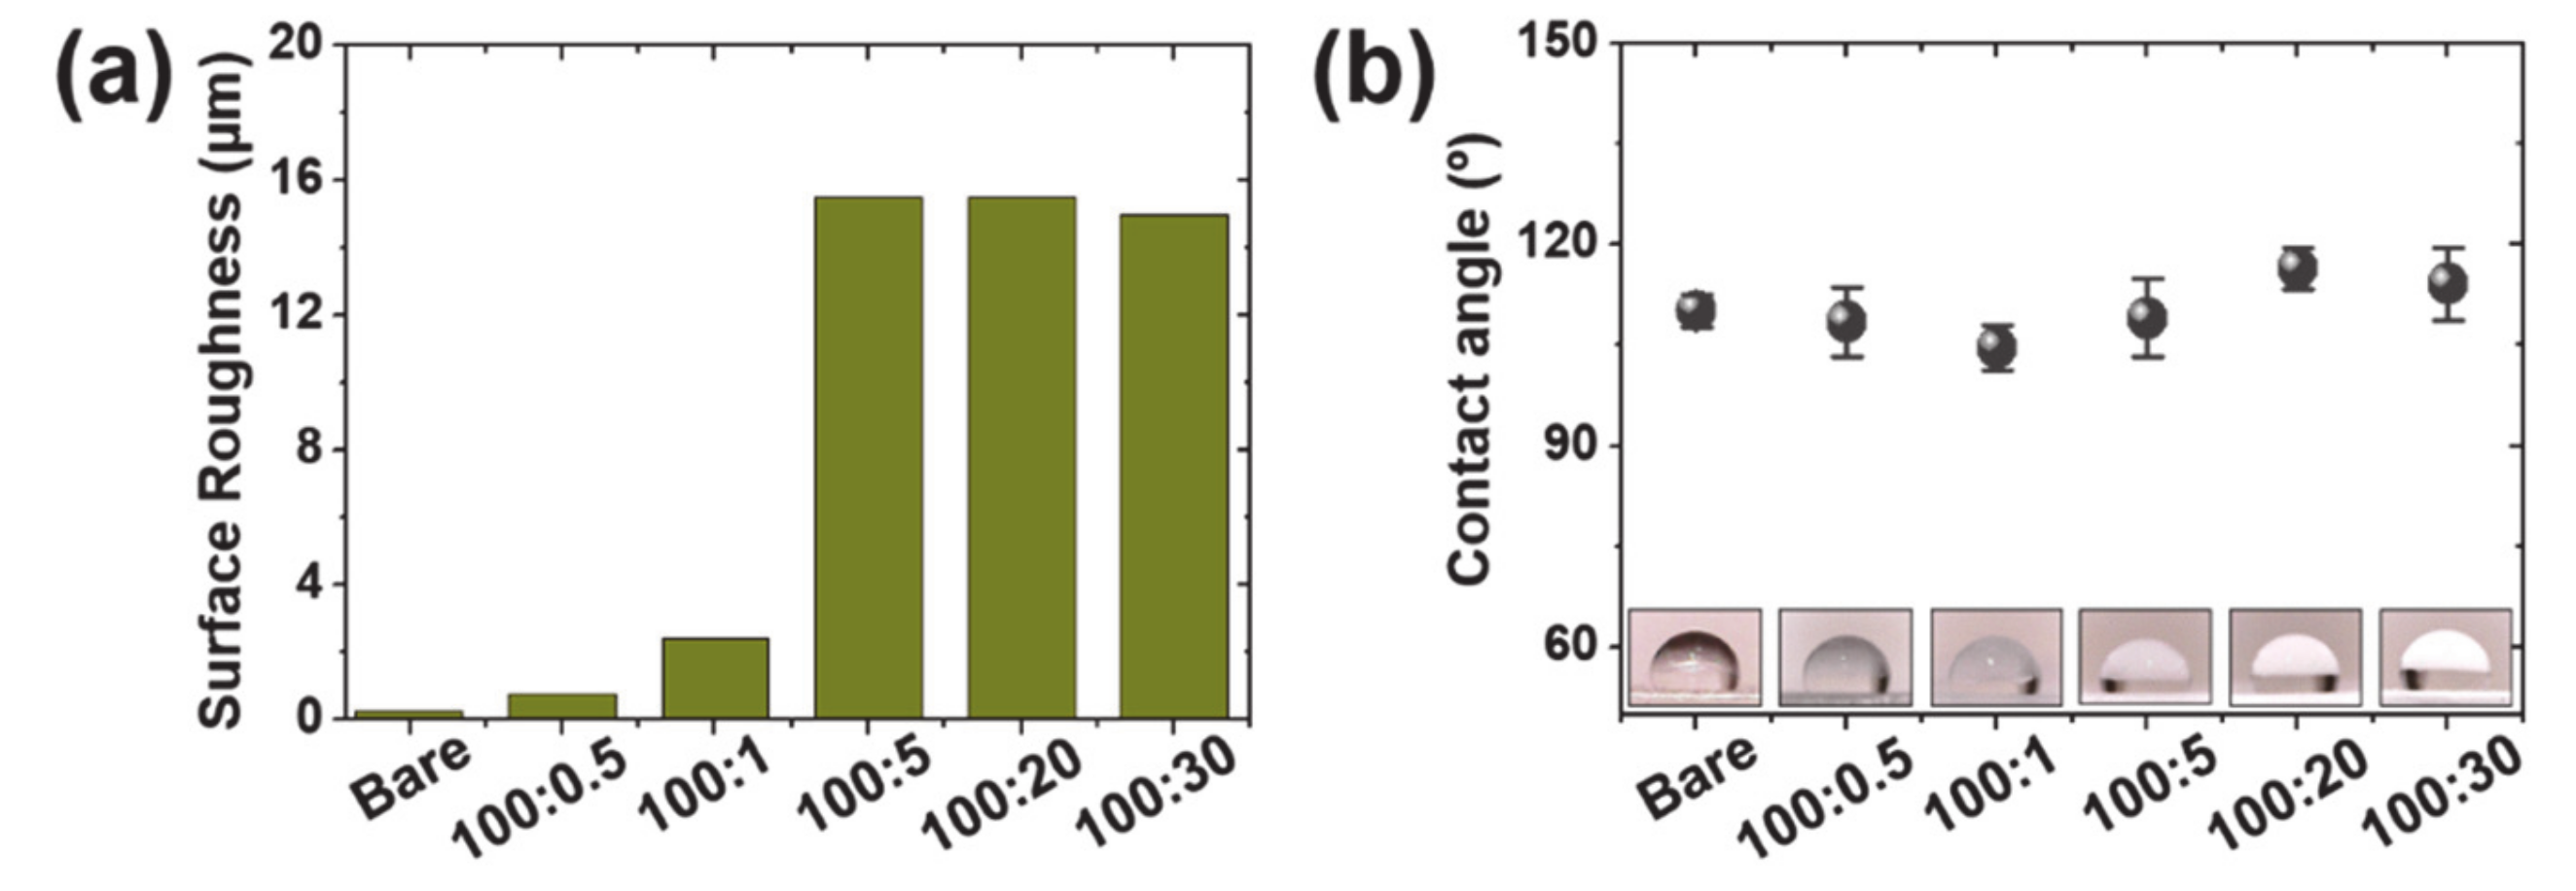
The surface roughness of the bare PDMS and PDMS/GB composite specimens with various ratios measured using the 3D laser scanning confocal microscope are shown in Figure 3a. Owing to the shape of the GB particles, the surface roughness of the PDMS/GB composites (Ra: 0.79–15 µm) increased compared with that of the bare PDMS (Ra: 0.25 µm). The surface roughness increased significantly in specimens with a large amount of GBs (100:5 or more) than in specimens with a relatively small amount of GBs (100:0.5 and 100:1). This is attributable to the presence of GB particles on the surface of the specimen. In the 100:0.5 (Ra:0.79 µm) and 100:1 specimens (Ra: 2.39 µm), because the density of the added GB particles was low and the PDMS had relatively large flat surfaces owing to the long distance between the particles, the measured surface roughness was small.
Meanwhile, in specimens with ratios of 100:5 or higher (Ra: ~15 µm), the surface roughness increased significantly because it was almost filled with GB particles compared with the PDMS surface because of their high density. In the specimens with high-density GB particles added, the surface roughness was similar. Beyond the 100:5 ratio, it is believed that the values of surface roughness will be similar because the densities of GB particles on the surface are almost saturated. The contact angles of the water droplets formed on the specimen surfaces measured using the microscope camera are shown in Figure 3b. The magnitudes of the contact angles were measured as 104–116°, resulting in no significant difference in general. Whereas the average size of the contact angles of the specimens, which contain low GB ratios of 100:0.5 and 100:1, decreased compared with that of bare PDMS, that with the 100:5 ratio was similar and those in the 100:20 ratio or above increased slightly. As the amount of GB increased, the surface roughness of the PDMS/GB composite increased, and the contact angles of the water droplets also changed. In particular, when the content of GB is large, it can be considered that the hydrophobicity of the surface is increased due to the large contact angle [25,26].
3.2. Mechanical Property
The indentation depth according to the load was measured through an indentation experiment. Using the measured data, F-D graphs were obtained, and the elastic modulus values of the specimens were calculated using Equations (1)–(4) based on these F-D curves [20,21,22]. In the equations, S is the stiffness, hc is the contact depth, hm is the maximum indentation depth, ε is the geometric constant of the indenter (sphere: 0.75), p is the normal load, R is the radius of the indenter, Er is the reduced elastic modulus, E1 is the elastic modulus of the specimen, E2 is the elastic modulus of the indenter, ν1 is the Poisson’s ratio of the specimen, and ν2 is the Poisson’s ratio of the indenter.
The elastic modulus value of the bare PDMS was calculated as 0.55 MPa. In comparison, the elastic modulus values of the PDMS/GB composite specimens were 0.77–1.59 MPa, which were larger than that of bare PDMS. The elastic modulus values of all the specimens are listed in Table 4. As the added amount of GBs increased, the elastic modulus increased. Because the maximum load was fixed at 1.5 N, the mechanical properties of the specimen can be investigated based on the added amount of GBs by analyzing the indentation depth compared with the load. The indentation depth under the same load tended to decrease as the added amount of GBs increased. It means that the specimen containing more GBs is stiffer. It is speculated that the mechanical strength improved owing to the added GB particles, and as the added amount of GBs increased, the resistance to deformation increased owing to the press by the indenter tip, and then the indentation depth against the load decreased. Consequently, the elastic modulus values of the PDMS/GB composites increased.
3.3. Finite Element Analysis
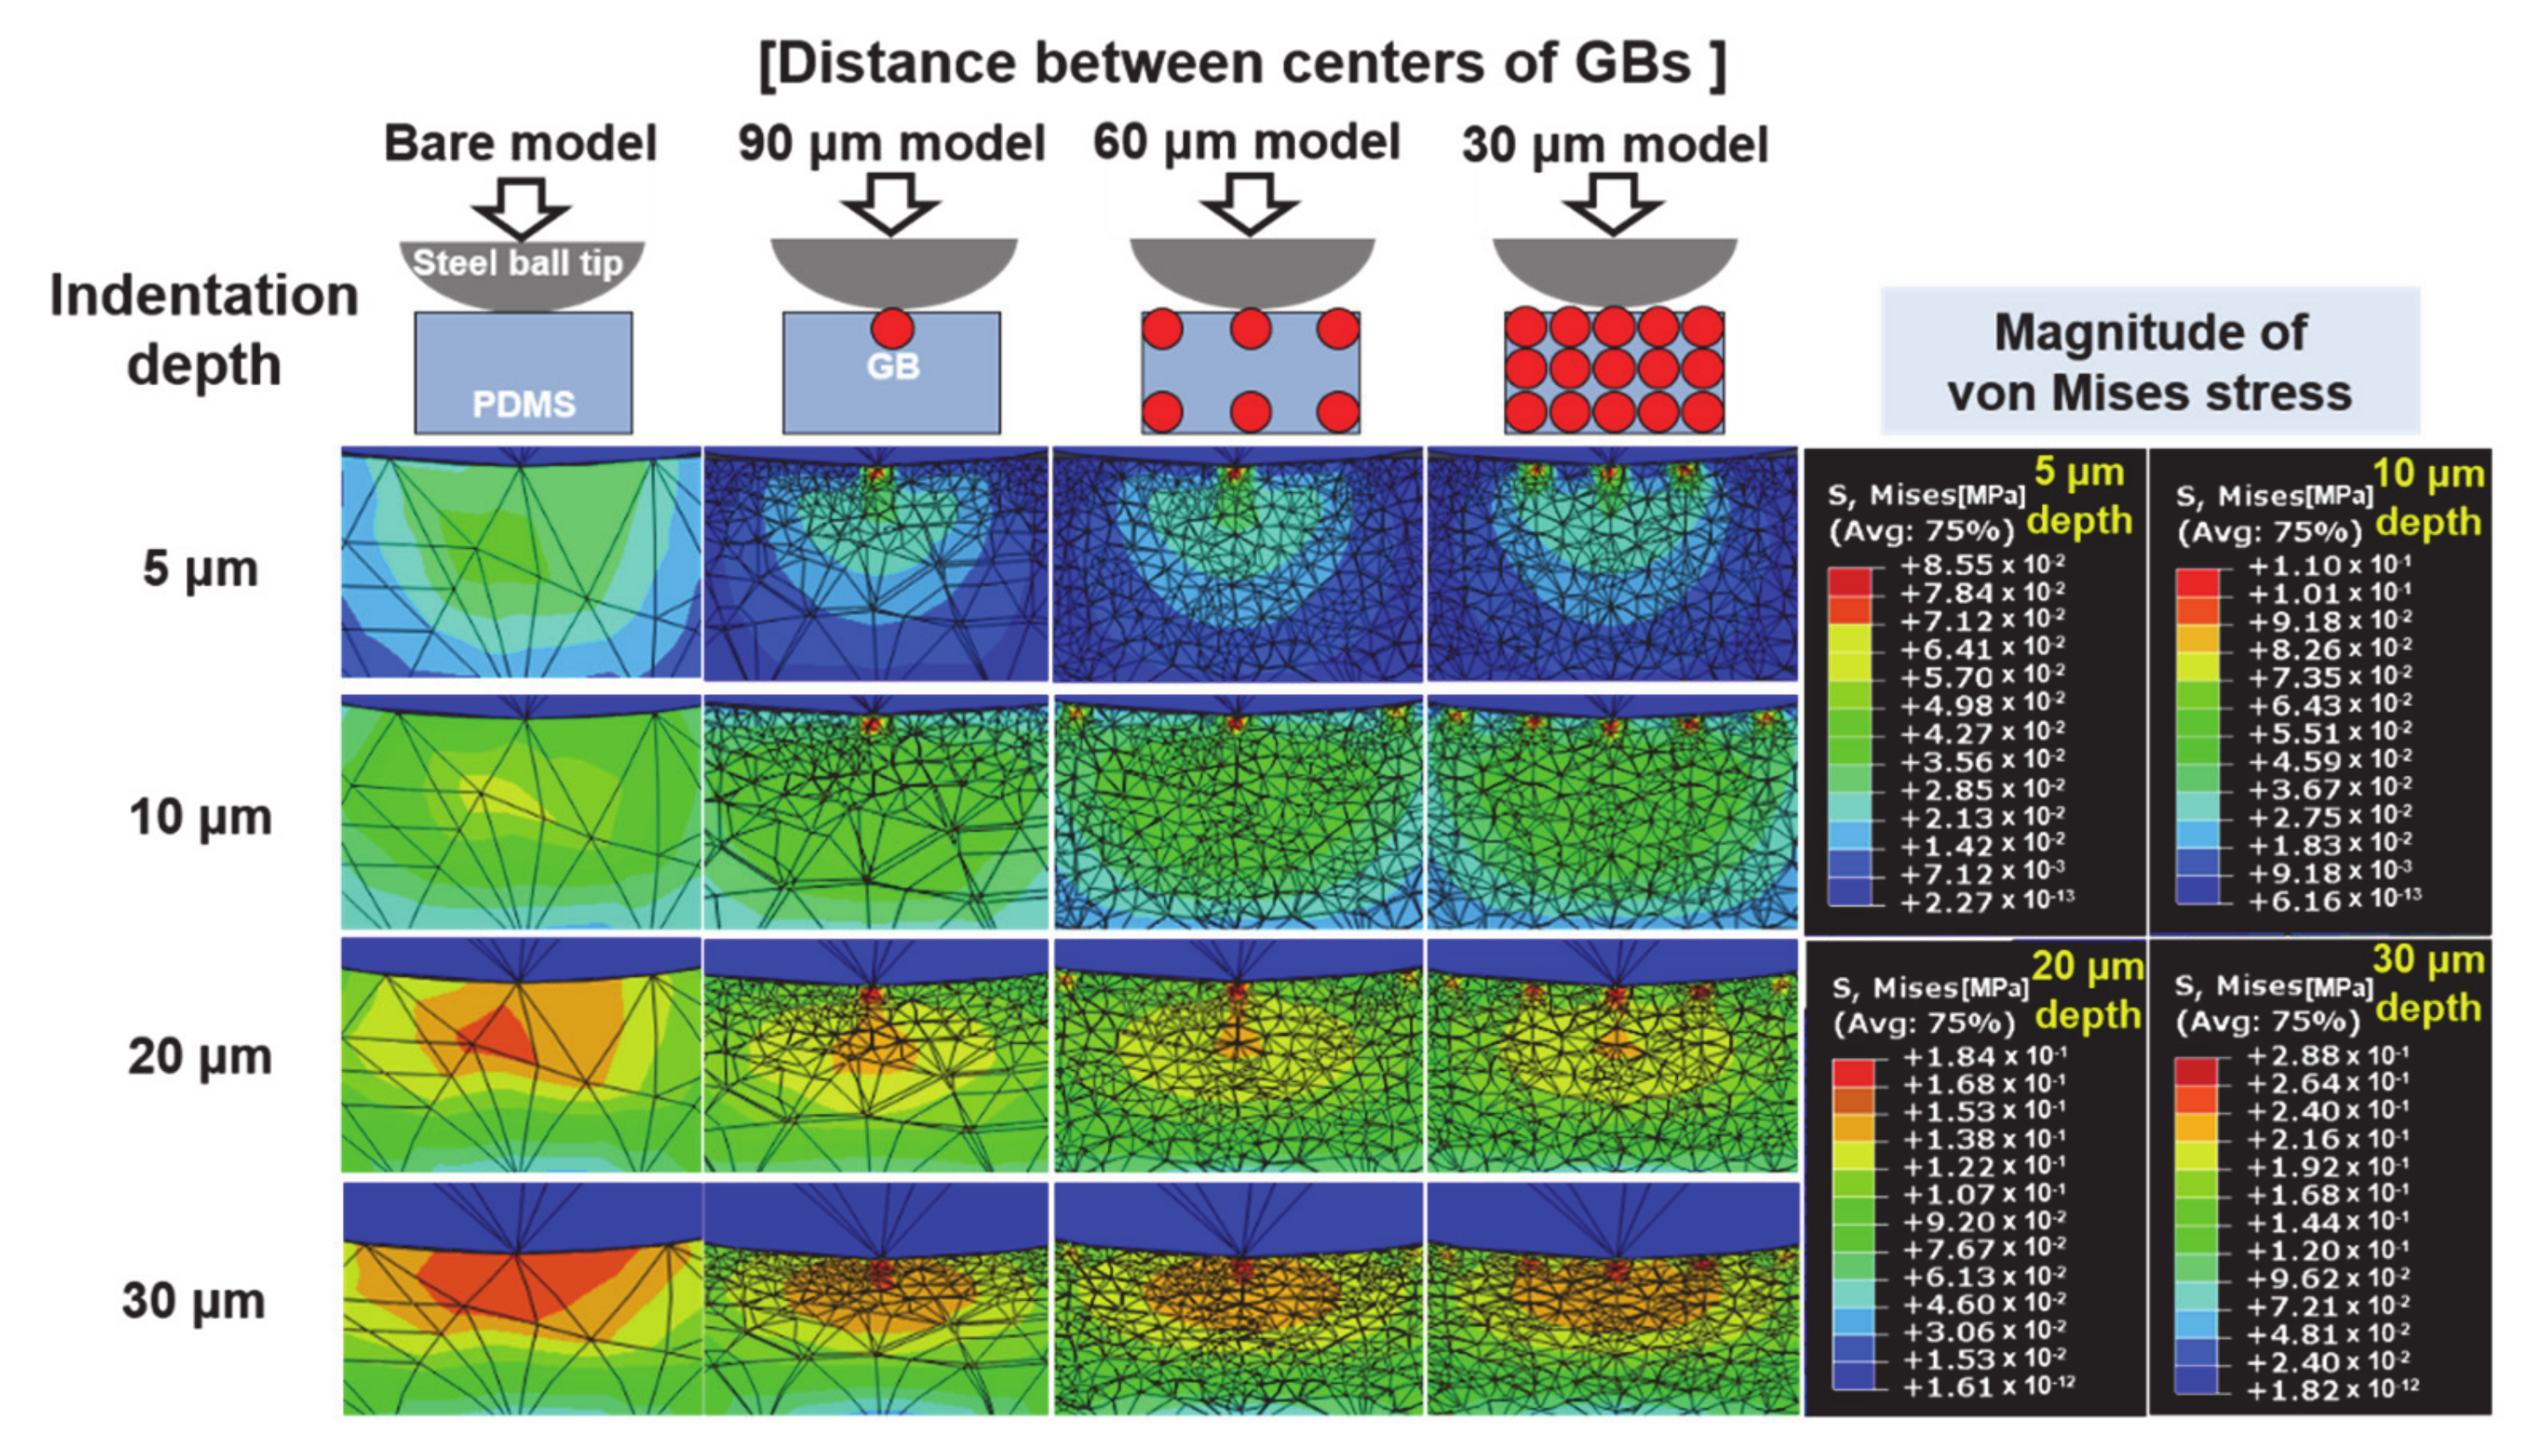
A commercial simulation program ABAQUS was used for the finite element analysis (FEA) on the contact stresses of the bare PDMS and PDMS/GB composite specimens, and the results are shown in Figure 4. The structural design models of the PDMS/GB composite specimens were set by varying the interval, which is the distance between the centers of GB particles, by 30, 60 and 90 μm. The contact behaviors of the bare PDMS and PDMS/GB composite specimens according to the amount of GB added were analyzed. The elastic modulus and Poisson’s ratio were set at 0.55 MPa and 0.5 for PDMS, 64 GPa and 0.2 for GB particles, and 210 GPa and 0.3 for a steel ball tip, respectively. While indenting the fixed specimen surface with the steel ball tip, changes in the stress generated inside the specimen according to the indentation depth were analyzed.
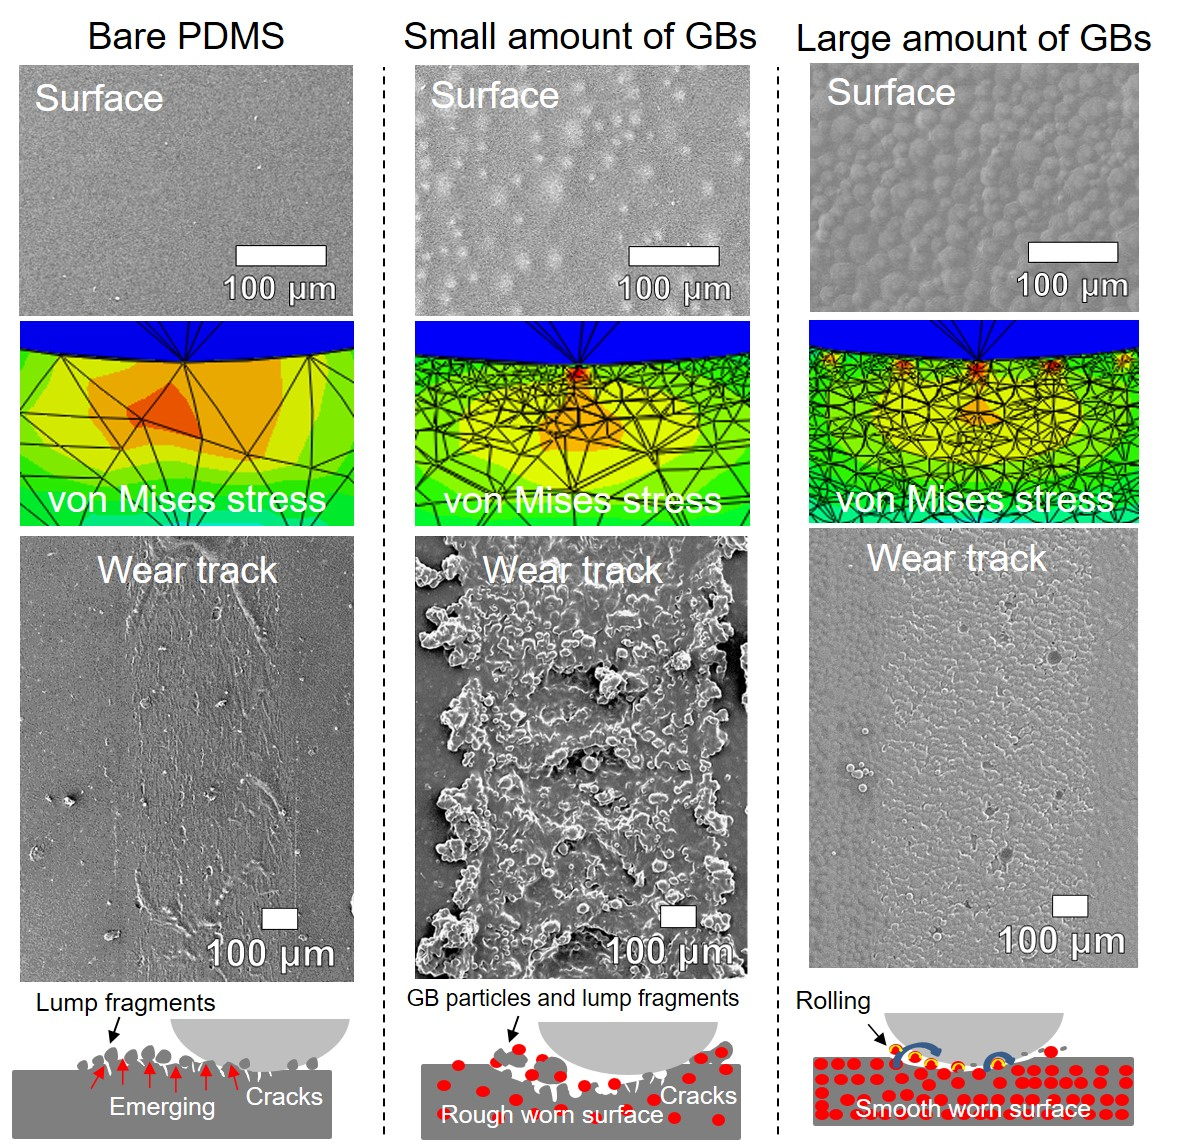
To eliminate the effect of the lower bottom of the specimen, the indentation depth was set up to 30% less than the specimen thickness used in the FEA simulation, and the steel ball tip was indented at 5, 10, 20 and 30 μm, comparing the internal stress changes. As a result of the experiment, the stress generated to the specimen tends to increase as the indentation depth increases in all four models. In the case of bare PDMS, the stress was generated on the entire surface in contact with the steel ball tip at an indentation depth of 5 μm, and the generated stress was propagated around the contact surface. In addition, as the indentation depth increased, the propagation area of the stress increased, and the maximum equivalent stress at the indentation depth of 30 μm was analyzed to be about 270 kPa. In the PDMS/GB composite specimens, the stress distribution and maximum stress values were different according to the densities of GB particles. As the stress was concentrated on the GB particles of the PDMS/GB composite, the stress propagation to the PDMS was greatly reduced. As the density of the GB particles added to the PDMS increased, the stress propagated to the PDMS decreased. The maximum stress concentrated on the GB particle of the PDMS/GB composite specimen was about 280 kPa at 30 μm indentation depth and was slightly increased compared to bare PDMS. This is expected to be a result of the relatively high elastic modulus of GB particles. As the density of GB particles of PDMS/GB composite increased, the number of GB particles in contact with the steel ball tip increased. At the indentation depth of 10 μm, when the gaps between GB particles were 30, 60, and 90 μm, the number of GB particles in contact with the steel ball tip were 5, 3, and 1, respectively. As the number of GB particles in contact with the steel ball tip increases, it is expected that the stress propagating to the PDMS is blocked and the stress concentrated on the GB particles is also dispersed. As such, the stress is concentrated on the GB particles and the stress propagated to the surrounding PDMS is reduced, which is expected to alleviate the stress concentration phenomenon caused by contact with the PDMS, which is a weak part of the composite.
3.4. Friction and Wear Characteristics
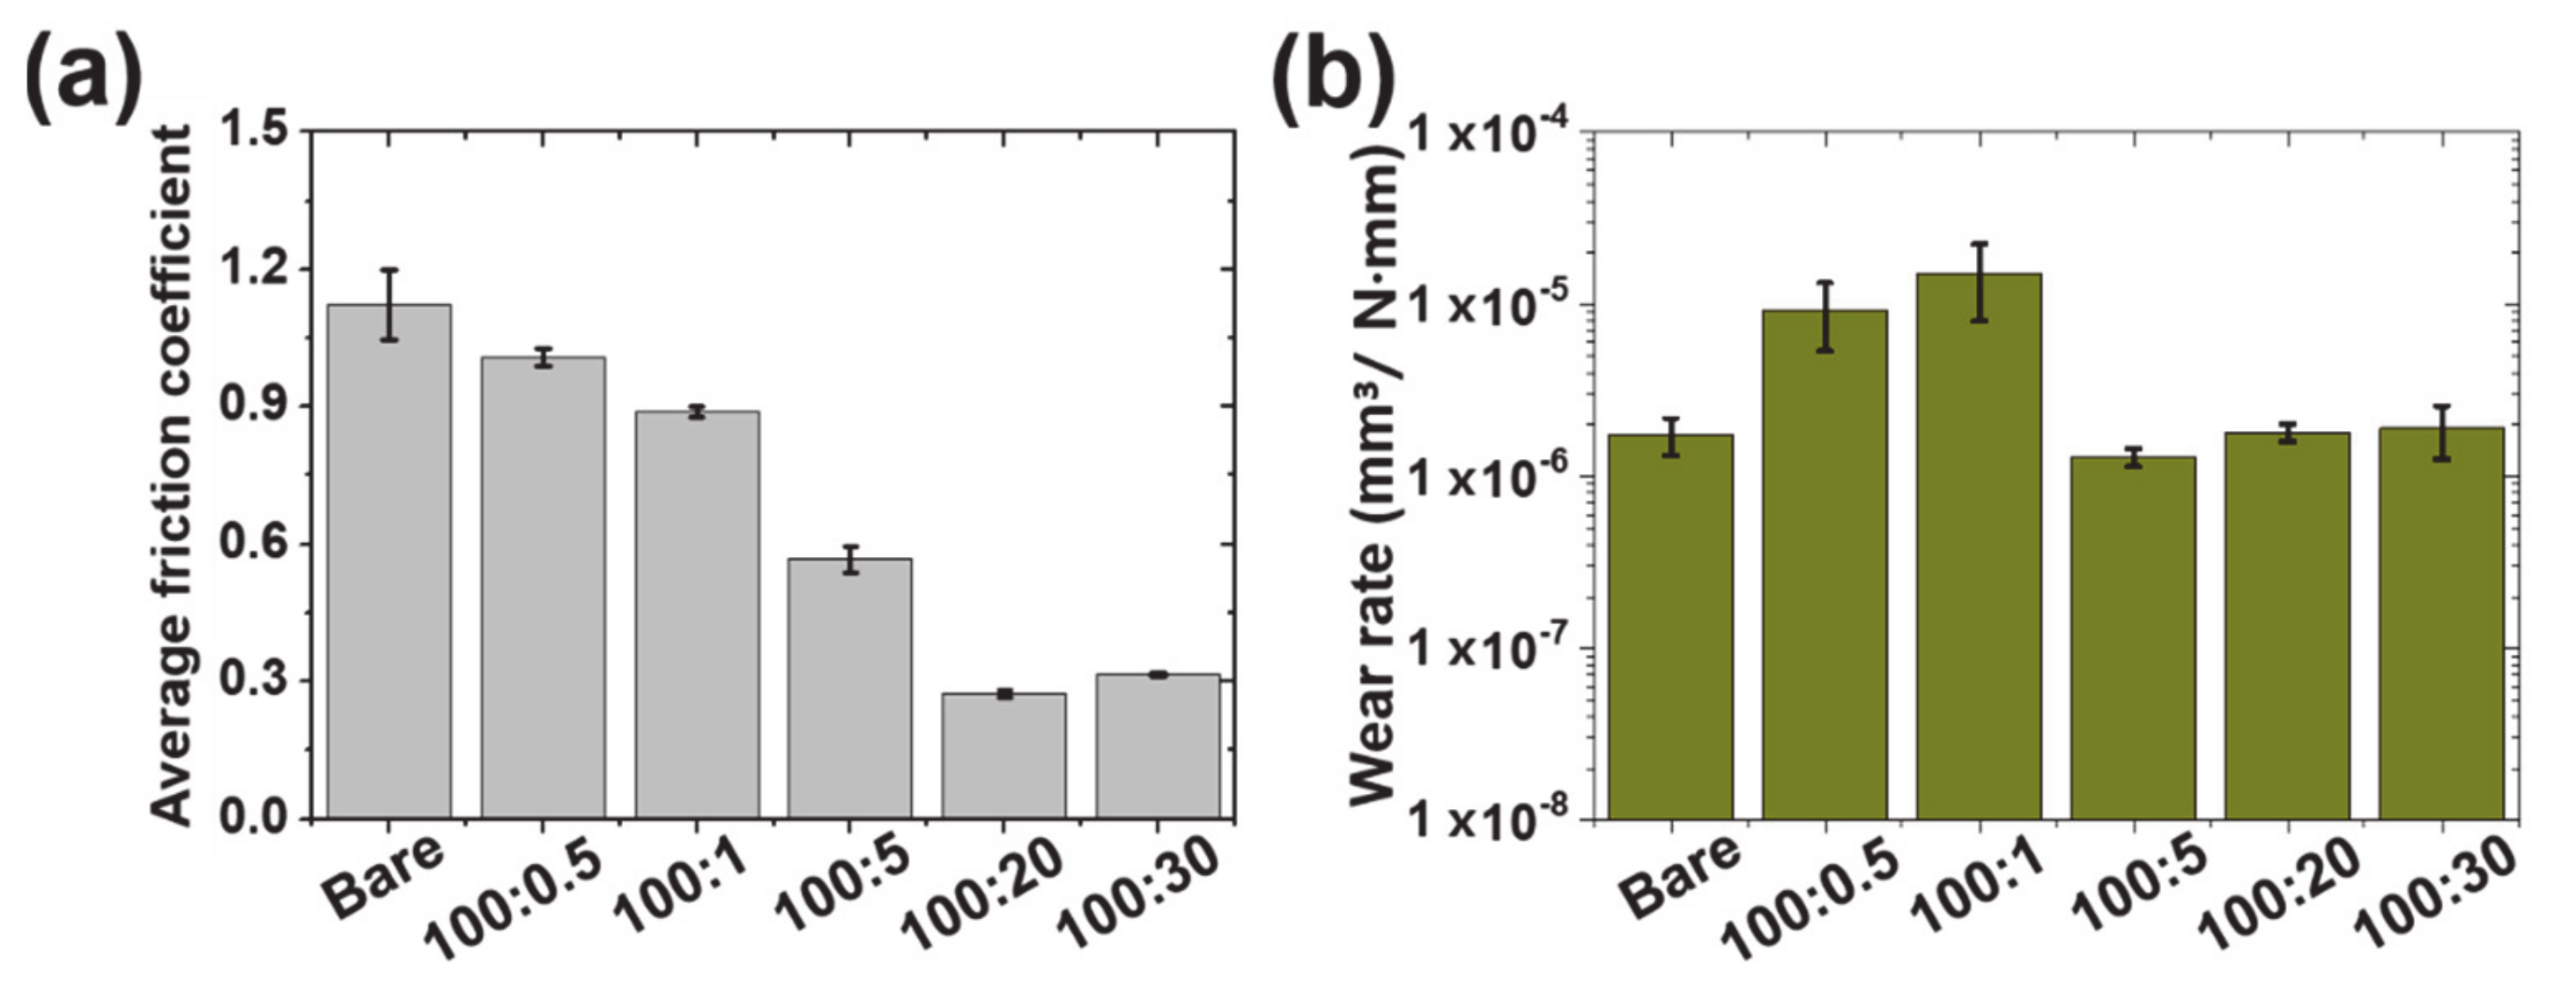
The friction characteristics of the PDMS/GB composite specimens with GB addition were evaluated. Under the experimental conditions shown in Table 3, the Hertzian contact pressure was calculated as about 0.3 MPa based on the bare PDMS specimen [27]. Because the elastic modulus of the PDMS/GB composite was measured to be larger, theoretically, the contact pressures (0.4–0.7 MPa) of the composite specimens would be higher. All experiments were conducted under contact pressure and dry conditions. Figure 5a shows the average friction coefficient of each specimen. The overall friction coefficients of the PDMS/GB composites with GBs were lower than those of bare PDMS. This was presumed to be due to the sticking phenomenon in the case of bare PDMS, caused by the high and increased adhesion in the PDMS surface due to the high pressure by the normal load, preventing the progress of the slide motion of the tip [11,12]. It has been confirmed in previous studies that the friction coefficient of the PDMS specimen is typically high [11,12]. Regarding the PDMS/GB composite specimens proposed in this study, because the GB particles added to the PDMS increased the tolerable stiffness to the normal load, the degree of compression reduced, and the particles were in contact with the ball tip; therefore, it was assumed that the friction coefficient would decrease. Hence, it was assumed that the contact characteristics of the surface varied based on the presence and degree of GB addition and that the flexible properties of PDMS provided the adequate degree to absorb/disperse contact and friction stresses [28,29,30,31].
Comparing the friction coefficient between the PDMS/GB composite specimens, the friction coefficient value decreased as the added amount of GBs increased up to the 100:20 ratio of the PDMS/GB composite. This phenomenon can be explained as follows: First, the relationship between the mechanical properties and the compressed depth of the specimen showed that a large stiffness reduced the compressed depth even when the same load was applied. As the compressed depth decreased, the real contact area between the tip and the specimen surface decreased, reducing the friction resistance caused by sticking. Therefore, owing to the difference in the contact area between the tip and the specimen, the higher the GB content, the lower was the friction coefficient. In addition, the amount of GB particles distributed on the surface varied depending on the GB addition, resulting in different spacing between the particles. The smaller the number of GB particles on the surface, the wider was the interparticle spacing, and the more frequently the tip established contact with the PDMS surface, thereby inducing high friction. Conversely, as the added amount of GBs increased, the gap between the particles decreased, and the probability of contact between the tip and GBs increased. Hence, the more GBs were added, the greater was the contact between the tip and GBs, and the lower was the friction coefficient.
Furthermore, as friction progressed, wear began occurring on the surface of the PDMS/GB composite specimen, eliminating GB particles from the PDMS; this is presumed to reduce the friction coefficient because a higher GB content translates to a higher probability that more GB particles will be exposed to the surface and roll up subsequently [32]. Therefore, it is assumed that the friction characteristics improve as the GB addition of PDMS/GB composites increases. The friction coefficient of the PDMS/GB composite specimen with a ratio of 100:20 was 0.27, which was a reduction by approximately 76% compared with that of the bare PDMS of 1.12. This is attributable to the significant improvement in the friction characteristics of PDMS, as the friction coefficient was reduced by more than four times. However, when GBs were added at a ratio of 100:30, the friction coefficient increased slightly. This was because the stiffness of the PDMS/GB composite specimen with a ratio of 100:30 was extremely high, causing the resistance preventing the tip from sliding across the surface of the specimen to be high. In other words, as described above, the degree to absorb/disperse stresses generated inside the PDMS/GB composite by the vertical load and the friction force is insufficient, thereby preventing the movement of the tip to slide off by the GBs embedded in the surface of the specimen, resulting in an increased friction force. Consequently, it was assumed that the friction coefficient of the 100:30 ratio specimen was slightly higher than that of the 100:20 ratio specimen. Therefore, it can be inferred that a critical condition exists for optimizing the friction characteristics because the 100:20 PDMS/GB composite specimen (0.27) indicated the lowest value compared with the 100:5 (0.57) and 100:30 ratios (0.32) of the specimens.
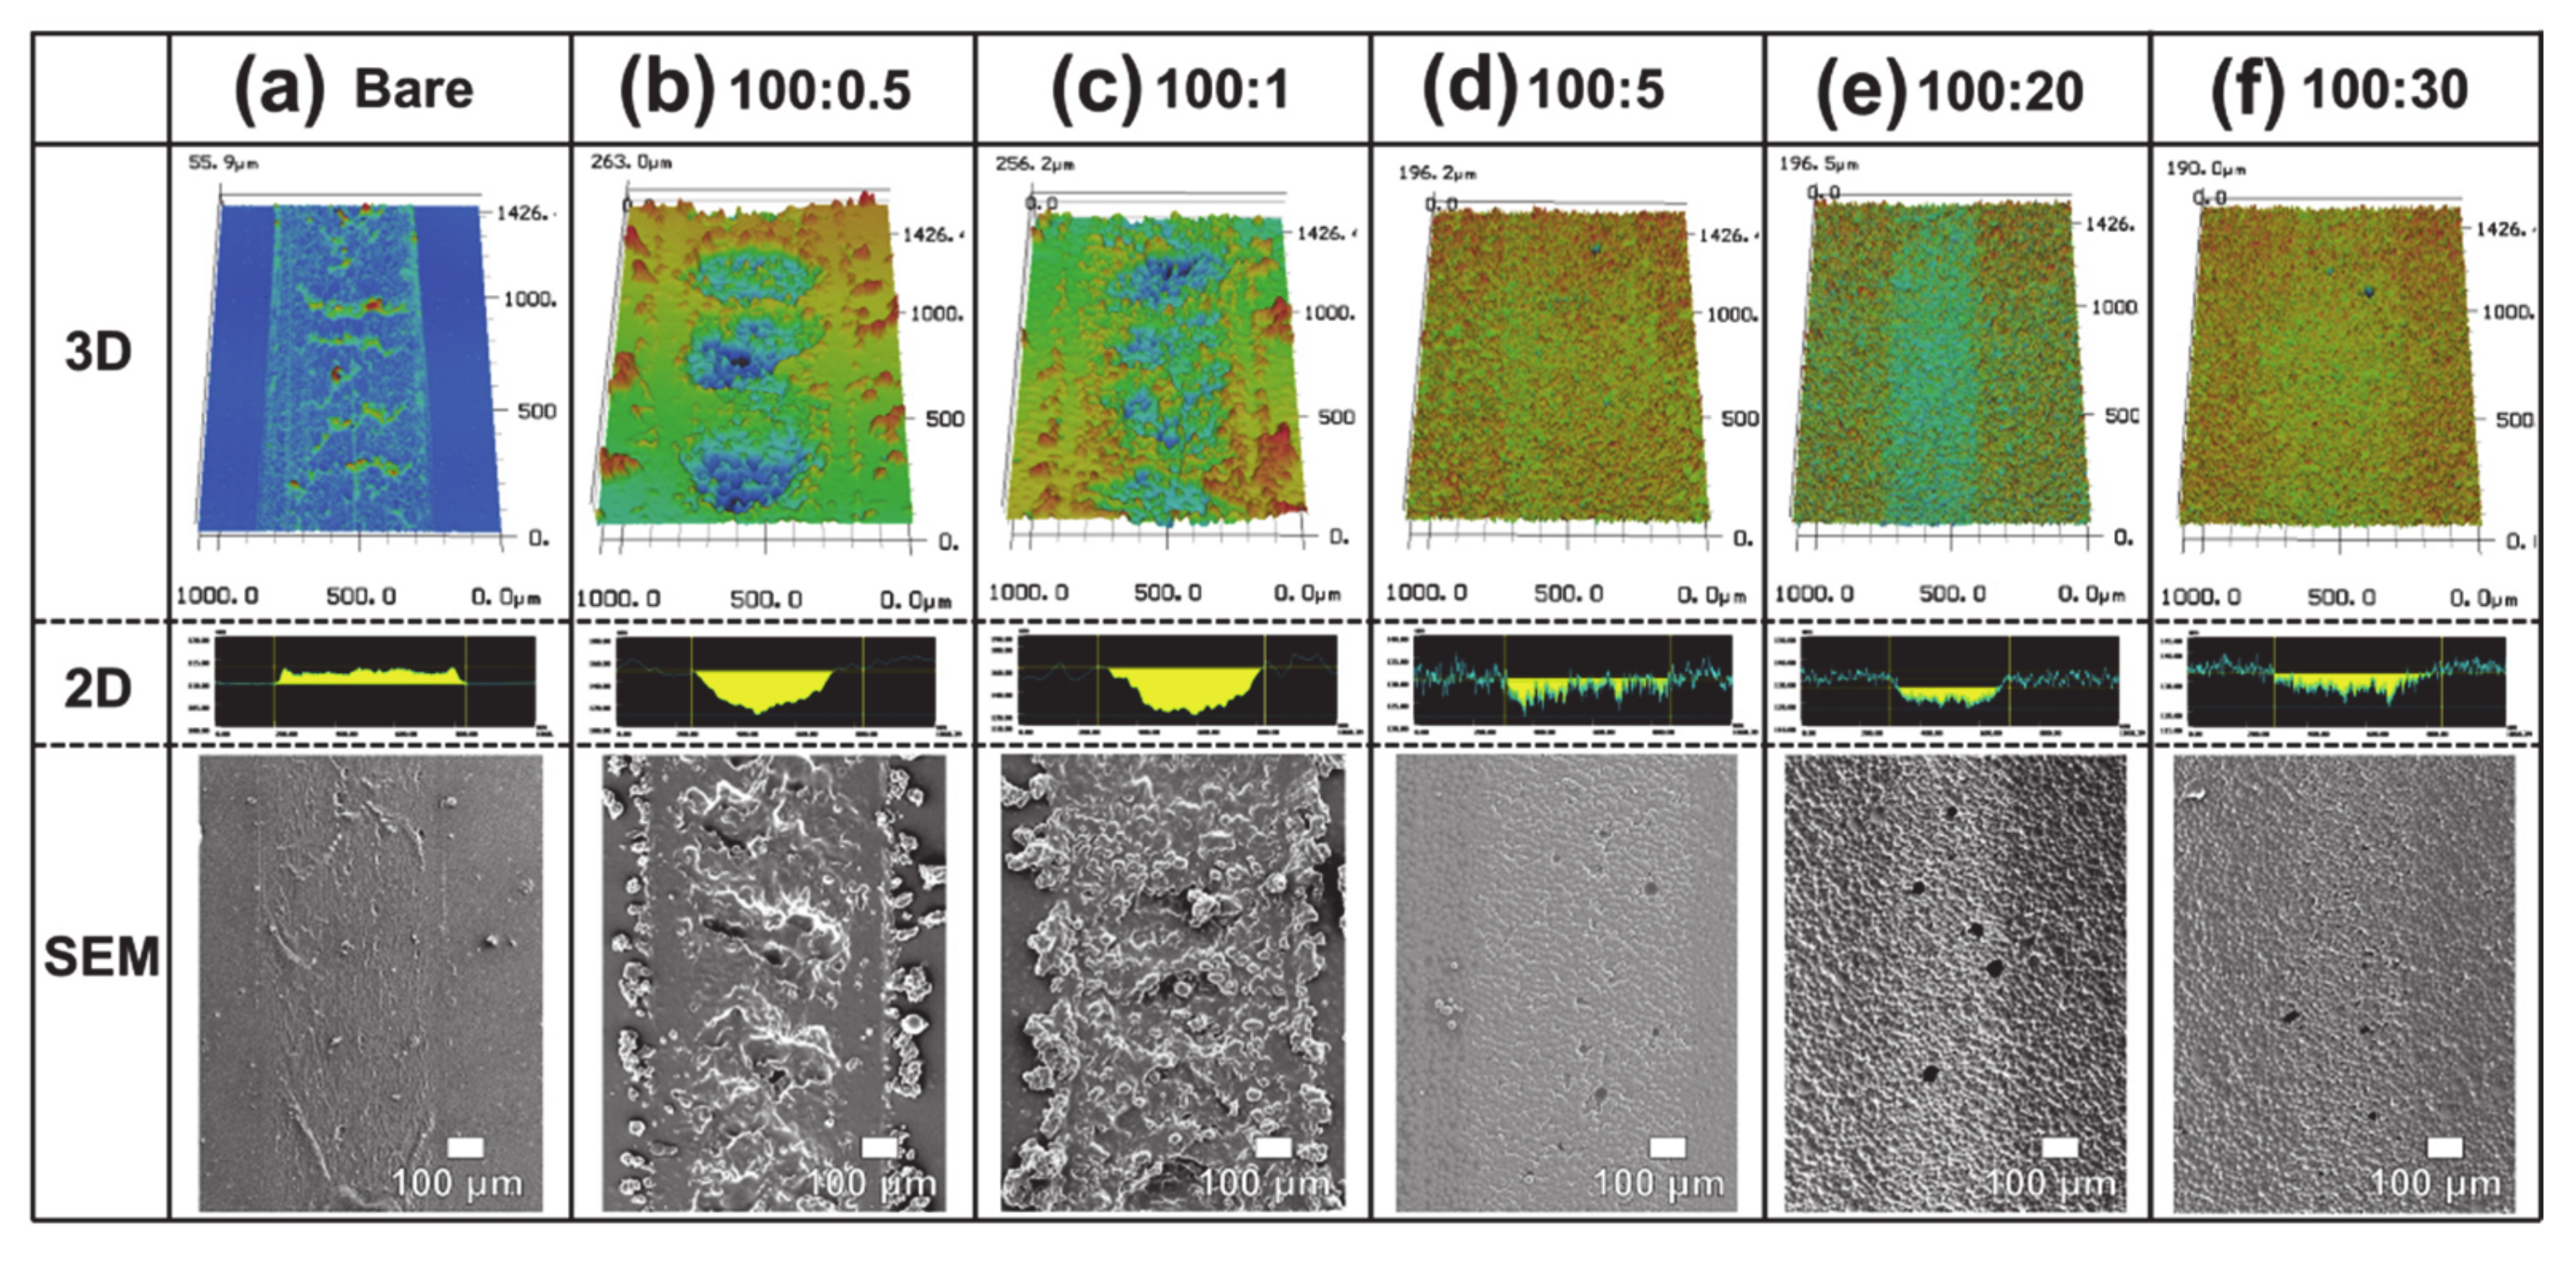
As shown in Figure 5b, the wear rate of each specimen surface was calculated and compared through a graph. To obtain the wear rate, as shown in Figure 6, the wear tracks formed on the surfaces of the specimens were analyzed using a 3D laser scanning confocal microscope. The 3D morphology of the wear track of each specimen was observed, and the average wear area was obtained through a cross-sectional two-dimensional (2D) profile analysis of the wear track. The wear rate is the value obtained by dividing the wear volume, which is the value of the wear area multiplied by the length of the wear track by the total sliding distance and the normal load, as shown in Equation (5).
where W.R. is the wear rate (mm3/N·mm), W.V. the wear volume (mm3), L the normal load (N), and D the total sliding distance (mm).
As shown in Figure 6a, the bare PDMS shows a wear morphology in which the worn area emerges above the surface. As a form of initial surface damage of typical polymer materials, it has been reported in previous studies that such damaged morphologies appear due to the contact sliding friction behavior, even in PDMS [12]. Based on the method of calculating the wear amount of PDMS reported in the previous study, in this study, the wear volume was calculated by measuring the damaged parts emerging above the surface. As shown in Figure 5b, the wear rates of the PDMS/GB composites of 100:0.5 (9.34 × 10⁻⁶ mm3/N·mm) and 100:1 (1.52 × 10⁻⁵ mm3/N·mm) ratios with less GB addition amount were higher than those of bare PDMS (1.75 × 10⁻⁶ mm3/N·mm) calculated using this method. Meanwhile, the wear rates of the PDMS/GB composites with 100:5, 100:20, and 100:30 ratios were lower than those in the cases of less GB addition, and they were slightly lower or similar to that of bare PDMS.
In contrast to the significant improvement in the friction characteristics of the PDMS/GB composites compared with the bare PDMS, the improvement in wear rate was insufficient. However, by comparing the wear track images in Figure 6, it can be seen that the worn surfaces of bare PDMS (Figure 6a) appeared rough. In contrast, those of the PDMS/GB composites with a large amount of added GBs (Figure 6d–f) were relatively smooth and the degree of wear was slight. As described above, the bare PDMS appeared to have formed an extremely rough worn surface because it exhibited a pattern of wear emerging, as if the surface had burst and scratched. In the bare PDMS specimen, the contact area between the tip and specimen increased owing to the adhesive properties of the surface due to the direct contact with the tip and by its relatively low stiffness, thereby increasing the resistance force received by the tip. This caused the PDMS to be scratched, be torn into lumps, or burst. Such a wear pattern might cause a higher friction due to the rough surface, and more severe wear might occur as the contact sliding motion proceeds for a significant amount of time. During the relative sliding motion, the initial friction coefficient was high owing to the asperities and unevenness of the surfaces of the contact area. As the sliding motion proceeded, the surface became polished and formed a smooth worn surface, indicating the possibility of decreased friction coefficient. However, if the sliding motion continues for a significant amount of time, more serious damages will occur on the smooth, worn surface. The surface becomes rough again, and the friction coefficient will increase. The surface of the PDMS wear track exhibited a rough morphology, causing high friction from the beginning; as the sliding motion persisted, it tore into lumps and a more severe wear pattern appeared. This wear phenomenon supported the high friction coefficient of the bare PDMS.
On the contrary, as shown in Figure 6b–f, the wear tracks of the PDMS/GB composites appeared to be cut down to the surface. As shown in Figure 6b,c, in the cases of PDMS/GB composites with 100:0.5 and 100:1 ratios with a small amount of added GBs, severe dents were formed, particularly in the case of the 100:0.5 ratio, in which a worn surface that appeared to have been torn apart was observed. This was attributable to the insufficient amount of GB particles for protecting the PDMS surface. In other words, it was predicted that the distance between the GB particles in the PDMS was large. As the repetitive stress was applied, concentrated stress was induced in the PDMS parts surrounding the particles embedded in the PDMS/GB composite, resulting in microscopic cracking and the parts being connected to each other, before eventually causing a breakage that was torn off into a lump. Another reason might be that surface abrasion occurred due to repetitive stress generation and sliding friction. The GB particles that escaped from the PDMS exerted a high contact pressure on the surface of the PDMS. In other words, when the micro-sized GB particles were in contact with the PDMS surface and a load was applied, the contact pressure received on the PDMS surface increased significantly by the minute contact area. Hence, the relatively strong GBs scratched the PDMS surface, generating fine scratches and cracks, and as these scratches and cracks expanded, they became connected to each other and formed a lump. It was believed that the high wear rates were caused by the extruded GB particles and lump fragments.
As shown in Figure 6b–f, in the PDMS/GB composites (ratios of 100:5, 100:20, and 100:30) with relatively large amounts of GBs, slight wear tracks were formed below the surface, and the worn surface was smooth. It was assumed that owing to the sufficient amount of GB particles, the stiffness increased sufficiently to withstand deformation and breakage caused by external stress, thereby reducing the wear rate. In other words, because the GB particles were densely distributed within the PDMS, the probability of contact between the tip and GB particles, which were relatively stronger than PDMS, was high; as such, it can withstand the stresses caused by repetitive contact pressure and sliding friction. In addition, it was observed that the friction reduced by the rolling motion of many GB particles that were separated from the PDMS/GB composites as the surface was ground by the repeated sliding motion, thereby preventing further damage. In other words, the separated GB particles were stronger than the PDMS and served as ball bearings while being in contact with the GBs of the same material embedded in the PDMS, reducing friction and preventing damage to the PDMS. As shown in Figure 5b and Figure 6, the durability of the 100:5 PDMS/GB composite was the best, whereas the 100:20 and 100:30 PDMS/GB composites exhibited similar wear rates and wear patterns.
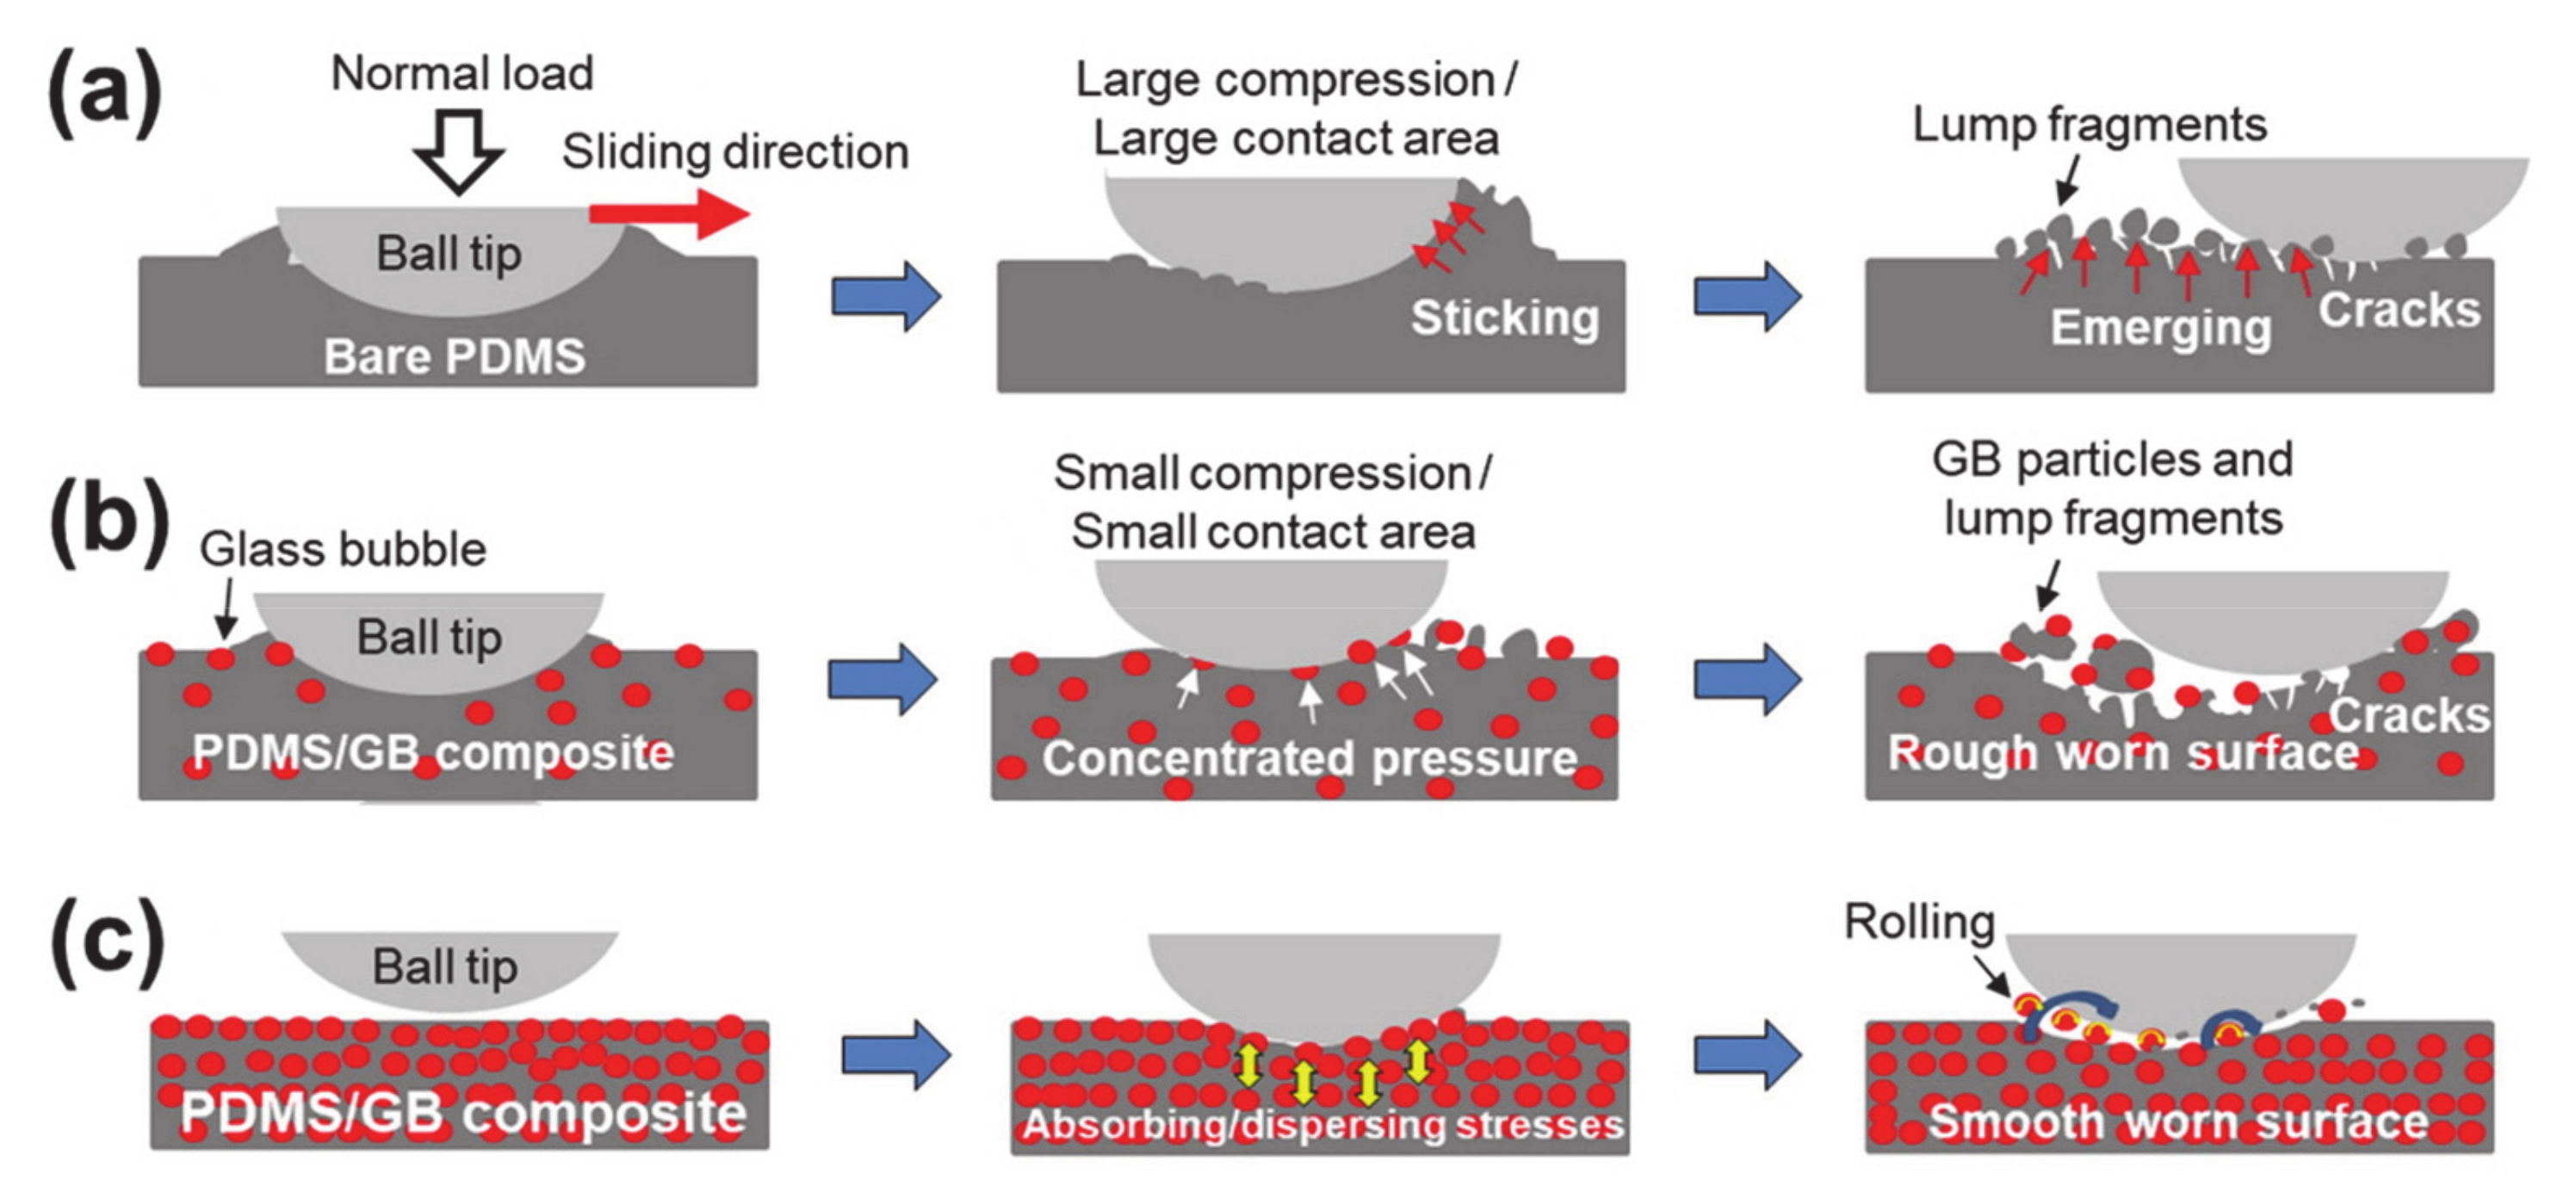
For the bare PDMS, it is illustrated in Figure 7a that the rough wear phenomenon in which the PDMS was torn into lumps appeared due to the large contact area and high surface adhesion properties caused by the large indentation on the surface with low stiffness. For the PDMS/GB composites, schematic designs of the wear mechanism are shown in Figure 7b,c, respectively, classified according to the cases where the added amount of GBs is small and large. Depending on the added amount of GBs, the stiffness of the PDMS/GB composite varied; hence, the contact area with the tip changed, and the durability against deformation and breakage varied. Because the probability of whether the tip and the separated GB particles were in contact with the PDMS surface or the GBs in the PDMS varied depending on the amount of GB particles in the PDMS, the degree of stress generated on the surface and inside of the PDMS/GB composite varied. Hence, the mechanisms by which stresses were absorbed/dispersed and transferred were different. The experimental results showed that the durability of the PDMS/GB composite improved when the added amount of GB particles was large. When GB particles were added at ratios of 100:5–100:20 to form a PDMS/GB composite, the disadvantages of PDMS (i.e., high friction coefficient) can be overcome, and the surface durability can be improved by reducing rough damages on the PDMS surface. Based on the comprehensive evaluation of tribological characteristics, including the friction characteristics, it was discovered that the friction and wear characteristics of the 100:20 PDMS/GB composite were the best.
4. Conclusions
In this study, the surface, mechanical, and tribological characteristics of PDMS/GB composites were evaluated based on the added amount of GB particles. No significant difference was observed in the contact angle of water droplets of the PDMS/GB composites with different added amounts of GBs; however, the surface roughness and the elastic modulus increased with the content of GBs. Through FEA simulation, it was confirmed that PDMS/GB composites alleviate the stress concentration phenomenon inside PDMS by focusing stress on the GB particles, which are relatively strong compared to bare PDMS. The contact stress distribution changed according to the indentation depth, and the closer the distance between GBs due to the high content of GBs, the greater the possibility of contact with the ball tip. As the contact with GBs increased, the effect of dispersing the contact stress appeared. The friction coefficients tended to decrease as the GB content increased; furthermore, the friction coefficient indicated the lowest value in the 100:20 PDMS/GB composite. When the GB content was low (less than 100:1), wear occurred more frequently compared with the bare PDMS, and the worn surface was extremely rough; however, when the GB content was 100:5 or more, the wear rate decreased and the wear surface was extremely smooth. As the densities of GB particles in the PDMS and the distance between GB particles varied based on the content of GBs, the degree to which contact pressure and friction stress propagated inside the PDMS varied, resulting in changes in the friction characteristics and wear mechanism. The results of this study are expected to facilitate the research and development of functional composite materials based on PDMS such that they apply to various fields.
Author Contributions
S.-J.L. and C.-L.K. conceived the project and designed the experiments. S.-J.L. and G.-M.K. conducted the experiments. S.-J.L., G.-M.K., and C.-L.K. analyzed the results. S.-J.L., G.-M.K. and C.-L.K. wrote and reviewed the manuscript. All authors have read and agreed to the published version of the manuscript.
Funding
This study was supported by a research fund from Chosun University, 2018.
Institutional Review Board Statement
Not applicable.
Informed Consent Statement
Not applicable.
Data Availability Statement
Data is available on request from the corresponding author.
Conflicts of Interest
The authors declare no conflict of interest.
References
- Zhou, J.; Ellis, A.V.; Voelcker, N.H. Recent developments in PDMS surface modification for microfluidic devices. Electrophoresis 2010, 31, 2–16. [Google Scholar] [PubMed]
- Chen, C.Y.; Chang, C.L.; Chien, T.F.; Luo, C.H. Flexible PDMS electrode for one-point wearable wireless bio-potential acquisition. Sens. Actuator A Phys. 2013, 203, 20–28. [Google Scholar]
- Lee, J.H.; Lee, H.S.; Lee, B.K.; Choi, W.S.; Choi, H.Y.; Yoon, J.B. Simple liquid crystal display backlight unit comprising only a single-sheet micropatterned polydimethylsiloxane (PDMS) light-guide plate. Opt. Lett. 2007, 32, 2665–2667. [Google Scholar] [PubMed]
- Schneider, F.; Draheim, J.; Kamberger, R.; Wallrabe, U. Process and material properties of polydimethylsiloxane (PDMS) for Optical MEMS. Sens. Actuator A Phys. 2009, 151, 95–99. [Google Scholar]
- Penskiy, I.; Gerratt, A.; Bergbreiter, S. Friction, adhesion and wear properties of PDMS films on silicon sidewalls. J. Micromech. Microeng. 2011, 21, 105013. [Google Scholar]
- Camou, S.; Fujita, H.; Fujii, T. PDMS 2D optical lens integrated with microfluidic channels: Principle and characterization. Lab Chip 2003, 3, 40–45. [Google Scholar]
- Hassler, C.; Boretius, T.; Stieglitz, T. Polymers for neural implants. J. Polym. Sci. Part B Polym. Phys. 2011, 49, 18–33. [Google Scholar]
- Wang, Y.; Huang, Q.; Zhu, W.; Yang, M.; Lewis, E. Novel optical fiber SPR temperature sensor based on MMF-PCF-MMF structure and gold-PDMS film. Opt. Express 2018, 26, 1910–1917. [Google Scholar]
- Seghir, R.; Arscott, S. Extended PDMS stiffness range for flexible systems. Sens. Actuator A Phys. 2015, 230, 33–39. [Google Scholar]
- El-Tayeb, N.; Gadelrab, R. Friction and wear properties of E-glass fiber reinforced epoxy composites under different sliding contact conditions. Wear 1996, 192, 112–117. [Google Scholar]
- Park, T.L.; Yang, Y.M.; Shin, D.G.; Kim, D.E. A study on frictional characteristics of PDMS under various conditions. J. Korean Soc. Precis. Eng. 2018, 35, 803–807. [Google Scholar]
- Johnson, C.L.; Dunn, A.C. Wear mode control of polydimethylsiloxane (PDMS) by load and composition. Wear 2019, 438, 203066. [Google Scholar]
- Elleuch, R.; Elleuch, K.; Salah, B.; Zahouani, H. Tribological behavior of thermoplastic polyurethane elastomers. Mater. Des. 2007, 28, 824–830. [Google Scholar]
- He, B.; Chen, W.; Wang, Q.J. Surface texture effect on friction of a microtextured poly (dimethylsiloxane)(PDMS). Tribol. Lett. 2008, 31, 187. [Google Scholar]
- Bongaerts, J.; Fourtouni, K.; Stokes, J. Soft-tribology: Lubrication in a compliant PDMS-PDMS contact. Tribol. Int. 2007, 40, 1531–1542. [Google Scholar]
- Fang, H.; Zhang, X.; Zhao, Y.; Bai, S.L. Dense graphene foam and hexagonal boron nitride filled PDMS composites with high thermal conductivity and breakdown strength. Compos. Sci. Technol. 2017, 152, 243–253. [Google Scholar]
- Palacios-Pineda, L.M.; Perales-Martinez, I.A.; Lozano-Sanchez, L.M.; Martínez-Romero, O.; Puente-Córdova, J.; Segura-Cárdenas, E.; Elías-Zúñiga, A. Experimental investigation of the magnetorheological behavior of PDMS elastomer reinforced with iron micro/nanoparticles. Polymers 2017, 9, 696. [Google Scholar]
- Keshoju, K.; Sun, L. Mechanical characterization of magnetic nanowire–polydimethylsiloxane composites. J. Appl. Phys. 2009, 105, 023515. [Google Scholar]
- Yu, W.; Sing, S.L.; Chua, C.K.; Tian, X. Influence of re-melting on surface roughness and porosity of AlSi10Mg parts fabricated by selective laser melting. J. Alloys Compd. 2019, 792, 574–581. [Google Scholar]
- Herbert, E.; Pharr, G.; Oliver, W.; Lucas, B.; Hay, J. On the measurement of stress-strain curves by spherical indentation. Thin Solid Films 2001, 398, 331–335. [Google Scholar]
- McKee, C.T.; Last, J.A.; Russell, P.; Murphy, C.J. Indentation versus tensile measurements of Young’s modulus for soft biological tissues. Tissue Eng. Part B Rev. 2011, 17, 155–164. [Google Scholar]
- Fischer-Cripps, A. A review of analysis methods for sub-micron indentation testing. Vacuum 2000, 58, 569–585. [Google Scholar]
- Li, H.; Xu, T.; Wang, C.; Chen, J.; Zhou, H.; Liu, H. Friction behaviors of hydrogenated diamond-like carbon film in different environment sliding against steel ball. Appl. Sur. Sci. 2005, 249, 257–265. [Google Scholar]
- Kraghelsky, I. Calculation of wear rate. J. Basic Eng. 1965, 87, 785–790. [Google Scholar]
- Lisuzzo, L.; Caruso, M.R.; Cavallaro, G.; Milioto, S.; Lazzara, G. Hydroxypropyl cellulose films filled with halloysite nanotubes/wax hybrid microspheres. Ind. Eng. Chem. Res. 2021, 60, 1656–1665. [Google Scholar]
- Cataldo, V.A.; Cavallaro, G.; Lazzara, G.; Milioto, S.; Parisi, F. Coffee grounds as filler for pectin: Green composites with competitive performances dependent on the UV irradiation. Carbohydr. Polym. 2017, 170, 198–205. [Google Scholar] [PubMed]
- Fischer-Cripps, A. The Hertzian contact surface. J. Mater. Sci. 1999, 34, 129–137. [Google Scholar]
- Kim, C.L.; Kim, D.E. Self-healing characteristics of collagen coatings with respect to surface abrasion. Sci. Rep. 2016, 6, 20563. [Google Scholar]
- Kim, C.L.; Kim, D.E. Durability and self-healing effects of hydrogel coatings with respect to contact condition. Sci. Rep. 2017, 7, 6896. [Google Scholar]
- Kim, D.E.; Kim, C.L.; Kim, H.J. A novel approach to wear reduction of micro-components by synthesis of carbon nanotube-silver composite coating. CIRP Ann. Manuf. Technol. 2011, 60, 599–602. [Google Scholar]
- Kim, C.L.; Jung, C.W.; Oh, Y.J.; Kim, D.E. A highly flexible transparent conductive electrode based on nanomaterials. NPG Asia Mater. 2017, 9, e438. [Google Scholar]
- Wang, D.Y.; Kim, C.L.; Kim, D.E. Development of flexible polymer sheet with high surface durability using discretely embedded micro-balls. CIRP Ann. Manuf. Technol. 2017, 66, 527–530. [Google Scholar]
Figure 1.
Schematic designs of (a) indentation tester and (b) reciprocating-type tribotester.

Figure 2.
SEM images of the specimen surfaces with respect to PDMS:GB mixing ratio: (a) bare, (b) 100:0.5, (c) 100:1, (d) 100:5, (e) 100:20, and (f) 100:30.
Figure 2.
SEM images of the specimen surfaces with respect to PDMS:GB mixing ratio: (a) bare, (b) 100:0.5, (c) 100:1, (d) 100:5, (e) 100:20, and (f) 100:30.

Figure 3.
(a) Surface roughness and (b) contact angles with respect to PDMS:GB mixing ratio (PDMS base 100: GB X). Inset images: Microscopic camera images of water drops on surfaces of specimens.
Figure 3.
(a) Surface roughness and (b) contact angles with respect to PDMS:GB mixing ratio (PDMS base 100: GB X). Inset images: Microscopic camera images of water drops on surfaces of specimens.

Figure 4.
FEA simulation models and results according to the indentation depths for 5, 10, 20, 30 μm and the ball distances for 30, 60, 90 μm. The scale indicates the magnitude of von Mises stress.
Figure 4.
FEA simulation models and results according to the indentation depths for 5, 10, 20, 30 μm and the ball distances for 30, 60, 90 μm. The scale indicates the magnitude of von Mises stress.

Figure 5.
(a) Average friction coefficient and (b) wear rate of each specimen with respect to PDMS/GB mixing ratio (PDMS 100: GB X).
Figure 5.
(a) Average friction coefficient and (b) wear rate of each specimen with respect to PDMS/GB mixing ratio (PDMS 100: GB X).

Figure 6.
Laser scanning confocal microscope(2D/3D profiles) and SEM images of wear tracks with respect to PDMS:GB mixing ratio: (a) bare, (b) 100:0.5, (c) 100:1, (d) 100:5, (e) 100:20, and (f) 100:30.
Figure 6.
Laser scanning confocal microscope(2D/3D profiles) and SEM images of wear tracks with respect to PDMS:GB mixing ratio: (a) bare, (b) 100:0.5, (c) 100:1, (d) 100:5, (e) 100:20, and (f) 100:30.

Figure 7.
Schematic designs of wear mechanisms with respect to GB mixing ratio: (a) bare PDMS, (b) 100:(0.5–1), and (c) 100:(5–30).
Figure 7.
Schematic designs of wear mechanisms with respect to GB mixing ratio: (a) bare PDMS, (b) 100:(0.5–1), and (c) 100:(5–30).


Table 1.
Physical properties of glass bubble.
| Glass Bubbles | |
|---|---|
| Density | 0.6 g/cm3 |
| Shape | Hollow spheres with thin walls |
| Fracture strength | 186 MPa |
| Composition | Soda-lime-borosilicate glass |
| Particle size | Average 16 μm |
Table 2.
Indentation test conditions.
| Indentation Test | |
|---|---|
| Tip | Steel ball (D: 25.4 mm) |
| Loading/Unloading speed | 0.05 mm/s |
| Max. load | ~1.5 N |
Table 3.
Tribotest conditions.
| Tribotest (Reciprocating Type) | |
|---|---|
| Tip | Steel ball (D: 1 mm) |
| Normal load | 100 mN |
| Sliding speed | 40 mm/s |
| Sliding stroke | 10 mm |
| Sliding cycle | 5000 cycles |
Table 4.
Elastic modulus values of specimens with respect to PDMS:GB mixing ratio.
| PDMS:GB Mixing Ratio | Bare (100:0) | 100:0.5 | 100:1 | 100:5 | 100:20 | 100:30 |
|---|---|---|---|---|---|---|
| Elastic Modulus [MPa] | 0.55 | 0.77 | 1.06 | 1.36 | 1.56 | 1.59 |
| (Standard Deviation) | (0.07) | (0.03) | (0.01) | (0.07) | (0.29) | (0.05) |
Publisher’s Note: MDPI stays neutral with regard to jurisdictional claims in published maps and institutional affiliations. |
© 2021 by the authors. Licensee MDPI, Basel, Switzerland. This article is an open access article distributed under the terms and conditions of the Creative Commons Attribution (CC BY) license (https://creativecommons.org/licenses/by/4.0/).
Share and Cite
MDPI and ACS Style
Lee, S.-J.; Kim, G.-M.; Kim, C.-L. Effect of Glass Bubbles on Friction and Wear Characteristics of PDMS-Based Composites. Coatings 2021, 11, 603. https://0-doi-org.brum.beds.ac.uk/10.3390/coatings11050603
AMA Style
Lee S-J, Kim G-M, Kim C-L. Effect of Glass Bubbles on Friction and Wear Characteristics of PDMS-Based Composites. Coatings. 2021; 11(5):603. https://0-doi-org.brum.beds.ac.uk/10.3390/coatings11050603
Chicago/Turabian StyleLee, Sung-Jun, Gang-Min Kim, and Chang-Lae Kim. 2021. "Effect of Glass Bubbles on Friction and Wear Characteristics of PDMS-Based Composites" Coatings 11, no. 5: 603. https://0-doi-org.brum.beds.ac.uk/10.3390/coatings11050603
Note that from the first issue of 2016, this journal uses article numbers instead of page numbers. See further details here.