Article

Non-Destructive Subsurface Inspection of Marine and Protective Coatings Using Near- and Mid-Infrared Optical Coherence Tomography

by
Christian R. Petersen
1,2,*,
Narayanan Rajagopalan
3,
Christos Markos
1,2,
Niels M. Israelsen
1,2,
Peter J. Rodrigo
4,
Getinet Woyessa
1,
Peter Tidemand-Lichtenberg
4,
Christian Pedersen
4,
Claus E. Weinell
3,
Søren Kiil
3 and
Ole Bang
1,2,5
1
Department of Photonics Engineering, Technical University of Denmark, 2800 Kgs. Lyngby, Denmark
2
NORBLIS IVS, Virumgade 35D, 2830 Virum, Denmark
3
CoaST, Department of Chemical and Biochemical Engineering, Technical University of Denmark, 2800 Kgs. Lyngby, Denmark
4
Department of Photonics Engineering, Technical University of Denmark, 4000 Roskilde, Denmark
5
NKT Photonics A/S, Blokken 84, 3460 Birkerød, Denmark
*
Author to whom correspondence should be addressed.
Submission received: 26 April 2021 / Revised: 29 May 2021 / Accepted: 15 July 2021 / Published: 22 July 2021

Abstract

:
Near- and mid-infrared optical coherence tomography (OCT) is evaluated as a non-destructive and non-contact reflection imaging modality for inspection of industrial and marine coatings. Near-infrared OCT was used to obtain high-resolution images (~6/2 µm lateral/axial) of hidden subsurface cracks and defects in a resin base coating, which had been exposed to high pressure and high temperature to study coating degradation in hostile environments. Mid-infrared OCT was employed for high-resolution (~15/8.5 µm lateral/axial) subsurface inspection of highly scattering marine coatings, demonstrating monitoring of wet film thickness and particle dispersion during curing of a 210 µm layer of antifouling coating, and detection of substrate corrosion through 369 µm of high-gloss alkyd enamel. Combining high-resolution and fast, non-invasive scanning, OCT is therefore considered a promising tool for studying coating performance and for industrial inspection.

1. Introduction

Coatings science is in constant development to meet the increasingly demanding requirements of the industry. Protective coatings are particularly important in hostile conditions, such as marine and downhole environments, where underfilm corrosion and coating defects can lead to equipment damage and potentially hazardous situations [1,2,3]. Consequently, it is essential to implement quality control steps for the inspection and testing of coatings at all stages during development and deployment. This includes both formulation and accelerated testing in a laboratory setting, as well as in the field in relation to surface preparation, coating application during and after curing, and monitoring of degradation during field exposure. Current standard methods for coating inspection are either destructive, based on subjective visual evaluation, or limited to covering only a few stages in the coating cycle. A standard method is to cut and polish the coated sample to inspect the cross-section using either optical microscopy or scanning electron microscopy (SEM). However, when cutting and polishing the sample, there is a significant risk of compromising the structural integrity of the coating by removing the traces of coating degradation, such as cracks and bubbles, which was the original target for the inspection. A common practice is the holiday testing, in which deviation in electrical conductivity due to coating defects is used to, for example, identify improper coating of the substrate resulting in pinholes. Such methods are simple and effective for locating defects but are also time-consuming and provide no information about the type or structure of the defect. In order to visualize subsurface defects, there are various imaging techniques for non-destructive testing (NDT) of coatings, including high-frequency ultrasound (US), terahertz pulsed imaging (TPI), X-ray, and thermographic imaging. The standard for single-point measurements is US due to its suitable penetration in a large range of materials and relatively high depth resolution. However, in imaging systems such as scanning acoustic microscopes (SAM), the transducer frequency introduces a trade-off between transverse spatial resolution and penetration depth, meaning that high resolution is only achieved in relatively thin coatings. In 2009, Alig et al. demonstrated detection of subsurface defects, such as cracks, bubbles, and delamination, in 20–130 µm thick polyurethane coatings on steel substrate with a lateral resolution of about 10–20 µm using 100–150 MHz transducer frequency [4]. More recently, in 2020, Bi et al. used SAM to assess corrosion creep in 200 µm thick epoxy coatings on a steel substrate using a 125 MHz transducer [5]. While useful, the main drawback of US-based techniques is the need for a contact medium to allow for the acoustic signal to propagate from the sample to the detection system, which renders it unable to measure on wet coatings non-invasively. Moreover, the contact medium can permeate pores and cracks in the coating, potentially causing structural or even chemical changes.
TPI can achieve lateral resolutions on the order of hundreds of microns, similar to that of mid-frequency US, without the need for a contact medium, but the technology is limited by long acquisition times, more complex data processing, and instrumentation [6]. Krimi et al. (2016) demonstrated accurate thickness measurements of a four-layer automotive coating system using TPI with a single-point acquisition rate of ~1 Hz, resolving individual coating layers between 5.4 and 47.9 µm thick by using advanced fitting algorithms [7].
X-ray-based techniques can offer submicron imaging resolution but are largely avoided in the field due to the hazards of ionizing radiation. Furthermore, X-ray systems are challenged by low imaging contrast in many samples, high computational complexity, and the transmission modality that requires a detector-array on the backside of the sample or a rotating system for 3D scanning [8,9,10]. Bradley et al. (2017) investigated the leaching of a corrosion inhibitor from a primer coating using X-ray nano-CT with a resolution of 64–128 nm, covering an area of interest of ~15–60 µm over a 6–24 h scan duration [9].
Thermographic methods infer the presence of subsurface defects from the surface thermal radiation, and as such, it is difficult to detect small or vertically stacked defects, and the results are highly dependent on the thermal properties of the sample [11,12]. Liu et al. (2017) were able to detect artificial bonding defects with a diameter of 2 mm through 400 µm of ceramic thermal barrier coating by scanning a 40 mm laser line with 1.25 mm/s [12].
One technique, which could bridge the gap between the aforementioned NDT techniques, is optical coherence tomography (OCT). OCT is a reflection modality method originally developed for medical imaging based on the interference of light reflected and scattered from within a sample. Since it is based on low-intensity laser light, it can reach a microscopic resolution, is non-destructive, and does not require a contact medium. The challenge of OCT is that light is gradually lost when propagating through a material due to scattering and absorption, which limits its penetration depth compared to THz or US. One way to improve the penetration of OCT is to employ longer wavelengths of light relative to the scattering particles, which results in reduced scattering. Unfortunately, when moving toward longer wavelengths, the depth (axial) resolution of OCT is reduced by a factor of the wavelength squared. However, the axial resolution in OCT depends not only on the wavelength of light but also on the bandwidth of the light source. For this reason, broadband supercontinuum (SC) lasers spanning hundreds or even thousands of nanometers have been successfully used to achieve ultra-high-resolution (UHR) OCT [13,14,15]. SC refers to the process whereby a relatively narrowband but high-intensity laser pulse is gradually broadened spectrally in a nonlinear optical medium, such as an optical fiber. Using this technology, researchers have demonstrated various applications within spectroscopy and imaging, including OCT [16,17,18,19]. There have been few reports on OCT applied for inspection of coatings, primarily for art and cultural heritage preservation, as well as automotive and pharmaceutical coatings [8,19,20,21,22,23,24,25,26,27,28]. Within automotive coatings, OCT operating around the 830 to 930 nm central wavelength range has been used to map the thickness of individual coating layers with an axial resolution of around 4–6 µm, but due to the short central wavelength, only the top clear coat layer is transparent, limiting the maximum penetration depth to about 100 µm [22,23,24,25]. Zhang et al. (2016) characterized automotive paints with metal flakes using OCT at 832 nm and were in some cases able to distinguish the clear coat, base coat, and primer layers, each around 20–60 µm with a depth resolution of 5 µm. In their system, a 2 × 2 mm scan of 1536 × 600 × 2048 pixels was acquired in ~45 s and took ~60 s to process [24]. Moving into the mid-infrared, Cheung et al. (2015) used a broadband SC laser to compare OCT at 930 and 1960 nm central wavelength for inspection of artistic oil paintings and found that despite the lower axial resolution of 13 µm, the longer wavelength was able to penetrate the ~340 µm layer of yellow ochre pigmented paint and provide more structural information about the chalk base layer below [21]. More recently, Zorin et al. presented improved penetration in oil paints using 4 µm central wavelength, although with a poor axial resolution of 50 µm and a slow line rate of 2.5 [19]. To the best of our knowledge, this is the first study to investigate structural coatings in the mid-infrared.
Marine coatings in particular make use of functional additives [2,29], which are highly scattering to visible and near-infrared (NIR) light, and so there is a need for developing OCT systems based on longer wavelength mid-infrared (MIR) light to improve the penetration depth. We recently demonstrated such a system for non-destructive, near real-time inspection of highly scattering samples, including imaging of microscopic channels through 775 µm of alumina ceramic plates, as well as imaging the internal circuitry of a credit card chip through laminated polymers and protective resins [9]. In this work, we have applied this novel approach to marine coatings and investigated the benefit of combining MIR and NIR light for different stages in coating development. One of the strategies was to include a coating devoid of pigments and additives, which is therefore transparent in the NIR where conventional OCT systems operate. The benefit of using NIR UHR-OCT is improved resolution and higher sensitivity. OCT can thus provide input on the resin degradation pathways or mechanisms, establishing a measurement base for developing a high-performing anti-corrosive coating for hostile environments. Subsequently, the penetration depth in commercial coatings with pigments and additives is compared using NIR and MIR OCT. The improved penetration of MIR OCT means that not only the coating-environment surface interactions can be probed, but also the metal-coating underfilm interactions. Lastly, we demonstrate the applicability of MIR OCT for monitoring the wet film thickness (WFT), particle dispersion, and surface roughness of a commercial coating during solvent evaporation, as well as for detecting underfilm corrosion.

2. Materials and Methods

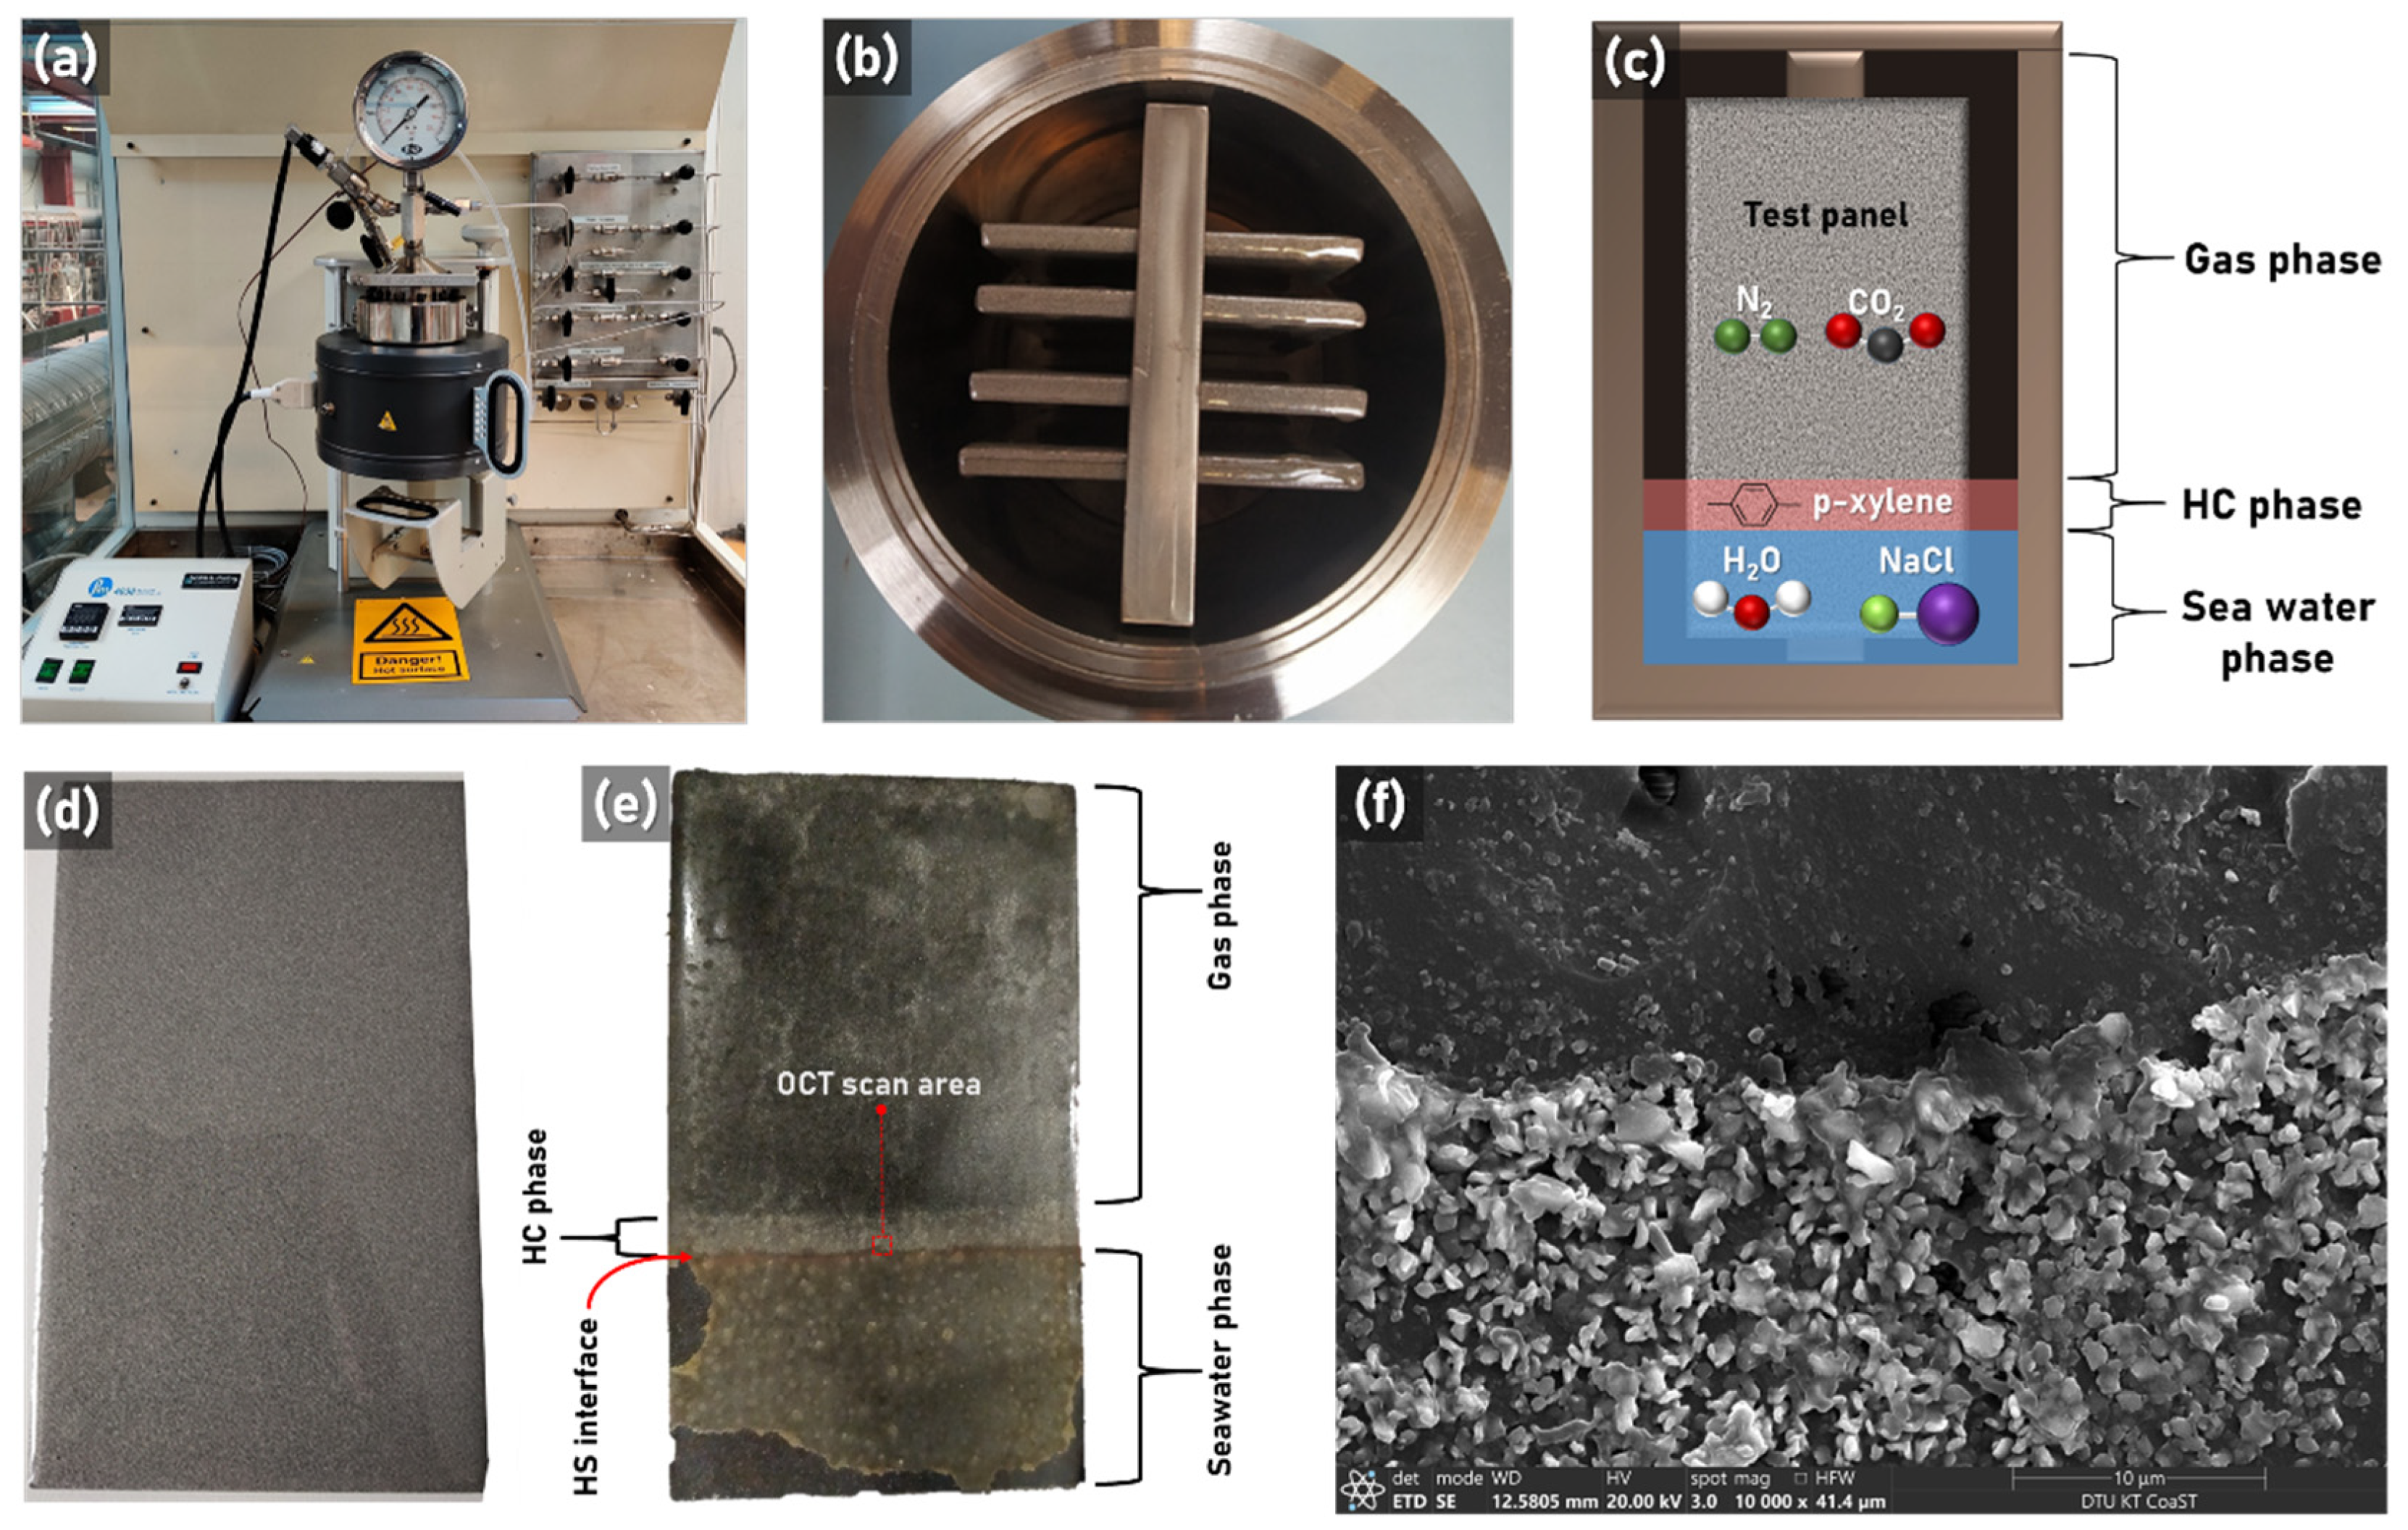
2.1. Transparent Coating Sample Preparation and Testing

The coating was formulated using a DEN 438 epoxy novolac resin base with a functionality (f) of 3.6 and an m-xylylene diamine (MXDA) curing agent. The sample substrate was sandblasted carbon (mild) steel with dimensions 5 × 70 × 120 mm. Using a paintbrush (smooth, natural bristle) of width 25 mm and aiming for a total dry film thickness (DFT) of 150 ± 25 µm, the coating was applied in two layers. The recoating interval for the two layers was 24 h, and the coating was allowed to cure completely for seven days at room temperature. To achieve a highly cross-linked network at room temperature, the stoichiometric ratio between the base and the curing agent was 0.9.
The cured sample Figure 1d was subsequently exposed to high pressure and high temperature (HPHT) environment, one of the extreme downhole application conditions of the oil and gas industry. The HPHT conditions in the present study were simulated in an autoclave batch reactor (model 4621, Parr Instruments) equipped with a non-stirred Hastelloy (C276) chamber that is resistant to extreme chemical environments and capable of maintaining temperatures of 350 °C and a pressure of 180 bar [3]. The autoclave and test chamber is shown in Figure 1a,b. The exposure conditions in the present experiment consisted of a gas mixture of N2 and CO2 as the gas phase, para-xylene as the hydrocarbon (HC) phase, and 3.5% NaCl solution as the seawater phase, as illustrated in Figure 1c. Inside the chamber, the pressure maintained for the coated samples was 130 bar at a temperature of 180 °C for an exposure time of 12 h.
HPHT exposure of the coating led to three distinct zones resulting from each of the three HPHT phases. The extent of coating degradation was visibly different in the three zones, as seen in Figure 1e. In the seawater region, the coating had formed large blisters and flakes, while in the gas phase region, the degradation was less severe. In the hydrocarbon region at the interface with the seawater (HS interface), a discrete red-colored deposition indicates the presence of iron oxide, which was verified by scanning electron microscopy (SEM) and energy dispersive X-ray (EDX) spectroscopy in a previous study [3].
Since iron oxide can only be introduced from the substrate, the coating degradation occurred to an extent where the corrosive elements penetrated through the coating network and reached the metal substrate. From inspection of the sample using an optical microscope, this region, in particular, had an abundance of cracks, and from preliminary inspection using OCT, this region showed the most subsurface features. Consequently, the HS zone was chosen for further inspection using OCT.

2.2. Commercial Marine Coatings

A set of two commercial marine coatings were tested: (1) A blue-pigmented, self-polishing antifouling (AF) hull coating based on cuprous oxide (Cu2O) with a low self-polishing rate, and (2) a white-pigmented, high-gloss (HG), alkyd enamel that is flexible and resistant to saltwater and other contaminants. In the scattering test, the coatings were applied manually by a paintbrush on a cleaned steel surface and left to dry in a fume hood for 12 h. The coated steel sample was subsequently imaged at the edge of the coated areas to obtain images with a gradually increasing layer thickness.

2.3. NIR UHR-OCT System

The NIR UHR-OCT used in this study was originally designed for clinical applications within dermatology. It comprises a 320 MHz SC laser source (SuperK Extreme EXR-9, NKT Photonics, Birkerød, Denmark) employing a bandpass filter to cover the 1–1.5 µm region. Light is coupled to a fiber-interferometer, where it is split into a reference and sample path. The sample path includes a scanning objective and a galvanometer, enabling scanning of the sample in a 3 × 3 mm area. The reference path includes a glass window that partially compensates for the dispersion of the scanning lens and a silver mirror to reflect light back into the coupler. The two light signals are then coupled back into the interferometer and detected with a 2048 pixel-array spectrometer covering the range of 1074–1478 nm. The detected interference signal is then processed in real-time to perform resampling and account for residual dispersion. Because of the broad bandwidth, the system is able to achieve an axial (depth) resolution of around 3 µm divided by the refractive index (n) of the sample medium (~1.4–1.6 for pure resins), and a lateral resolution of 6 µm was inferred by imaging a USAF 1951 resolution target. The signal sensitivity is 89 dB for 4 mW average power on the sample and a line-scan (A-scan) rate of 76 kHz. For more details on the system, see the work of [13].

2.4. MIR OCT System

The MIR OCT system is based on a custom SC fiber-laser that emits over a continuous spectral region from 2 to 4.6 µm, which was coupled into a free-space interferometer using a parabolic mirror. The interferometer splits the light into the sample and reference arms by a nitrocellulose membrane pellicle beam-splitter designed for the 3–5 µm wavelength range. Sample scanning was achieved using a two-axis gold-coated mirror galvanometric scanner and a BaF2 plano-convex lens, while the reference arm had two gold-coated plane mirrors and a BaF2 window for crude dispersion compensation. The two signals are then combined, and the resulting interference signal was then converted from the 4 µm MIR spectral region to the 0.8 µm NIR spectral region in order to benefit from the high sensitivity, resolution, and speed of NIR spectrometers. The converted interference signal was subsequently coupled by a single-mode fiber to a 2048-element array spectrometer, which allowed for high-resolution parallel detection of the entire wavelength band with a line rate of 333 Hz. The system achieved a high axial resolution of ~8.5 µm due to the wide bandwidth of the laser and a transverse spatial resolution of ~15 µm limited by the lens magnification. The signal sensitivity and 6 dB sensitivity roll-off were measured to be ~60 dB and 1.35 mm, respectively. For more details about the system, see the work of [18].

3. Results and Discussion

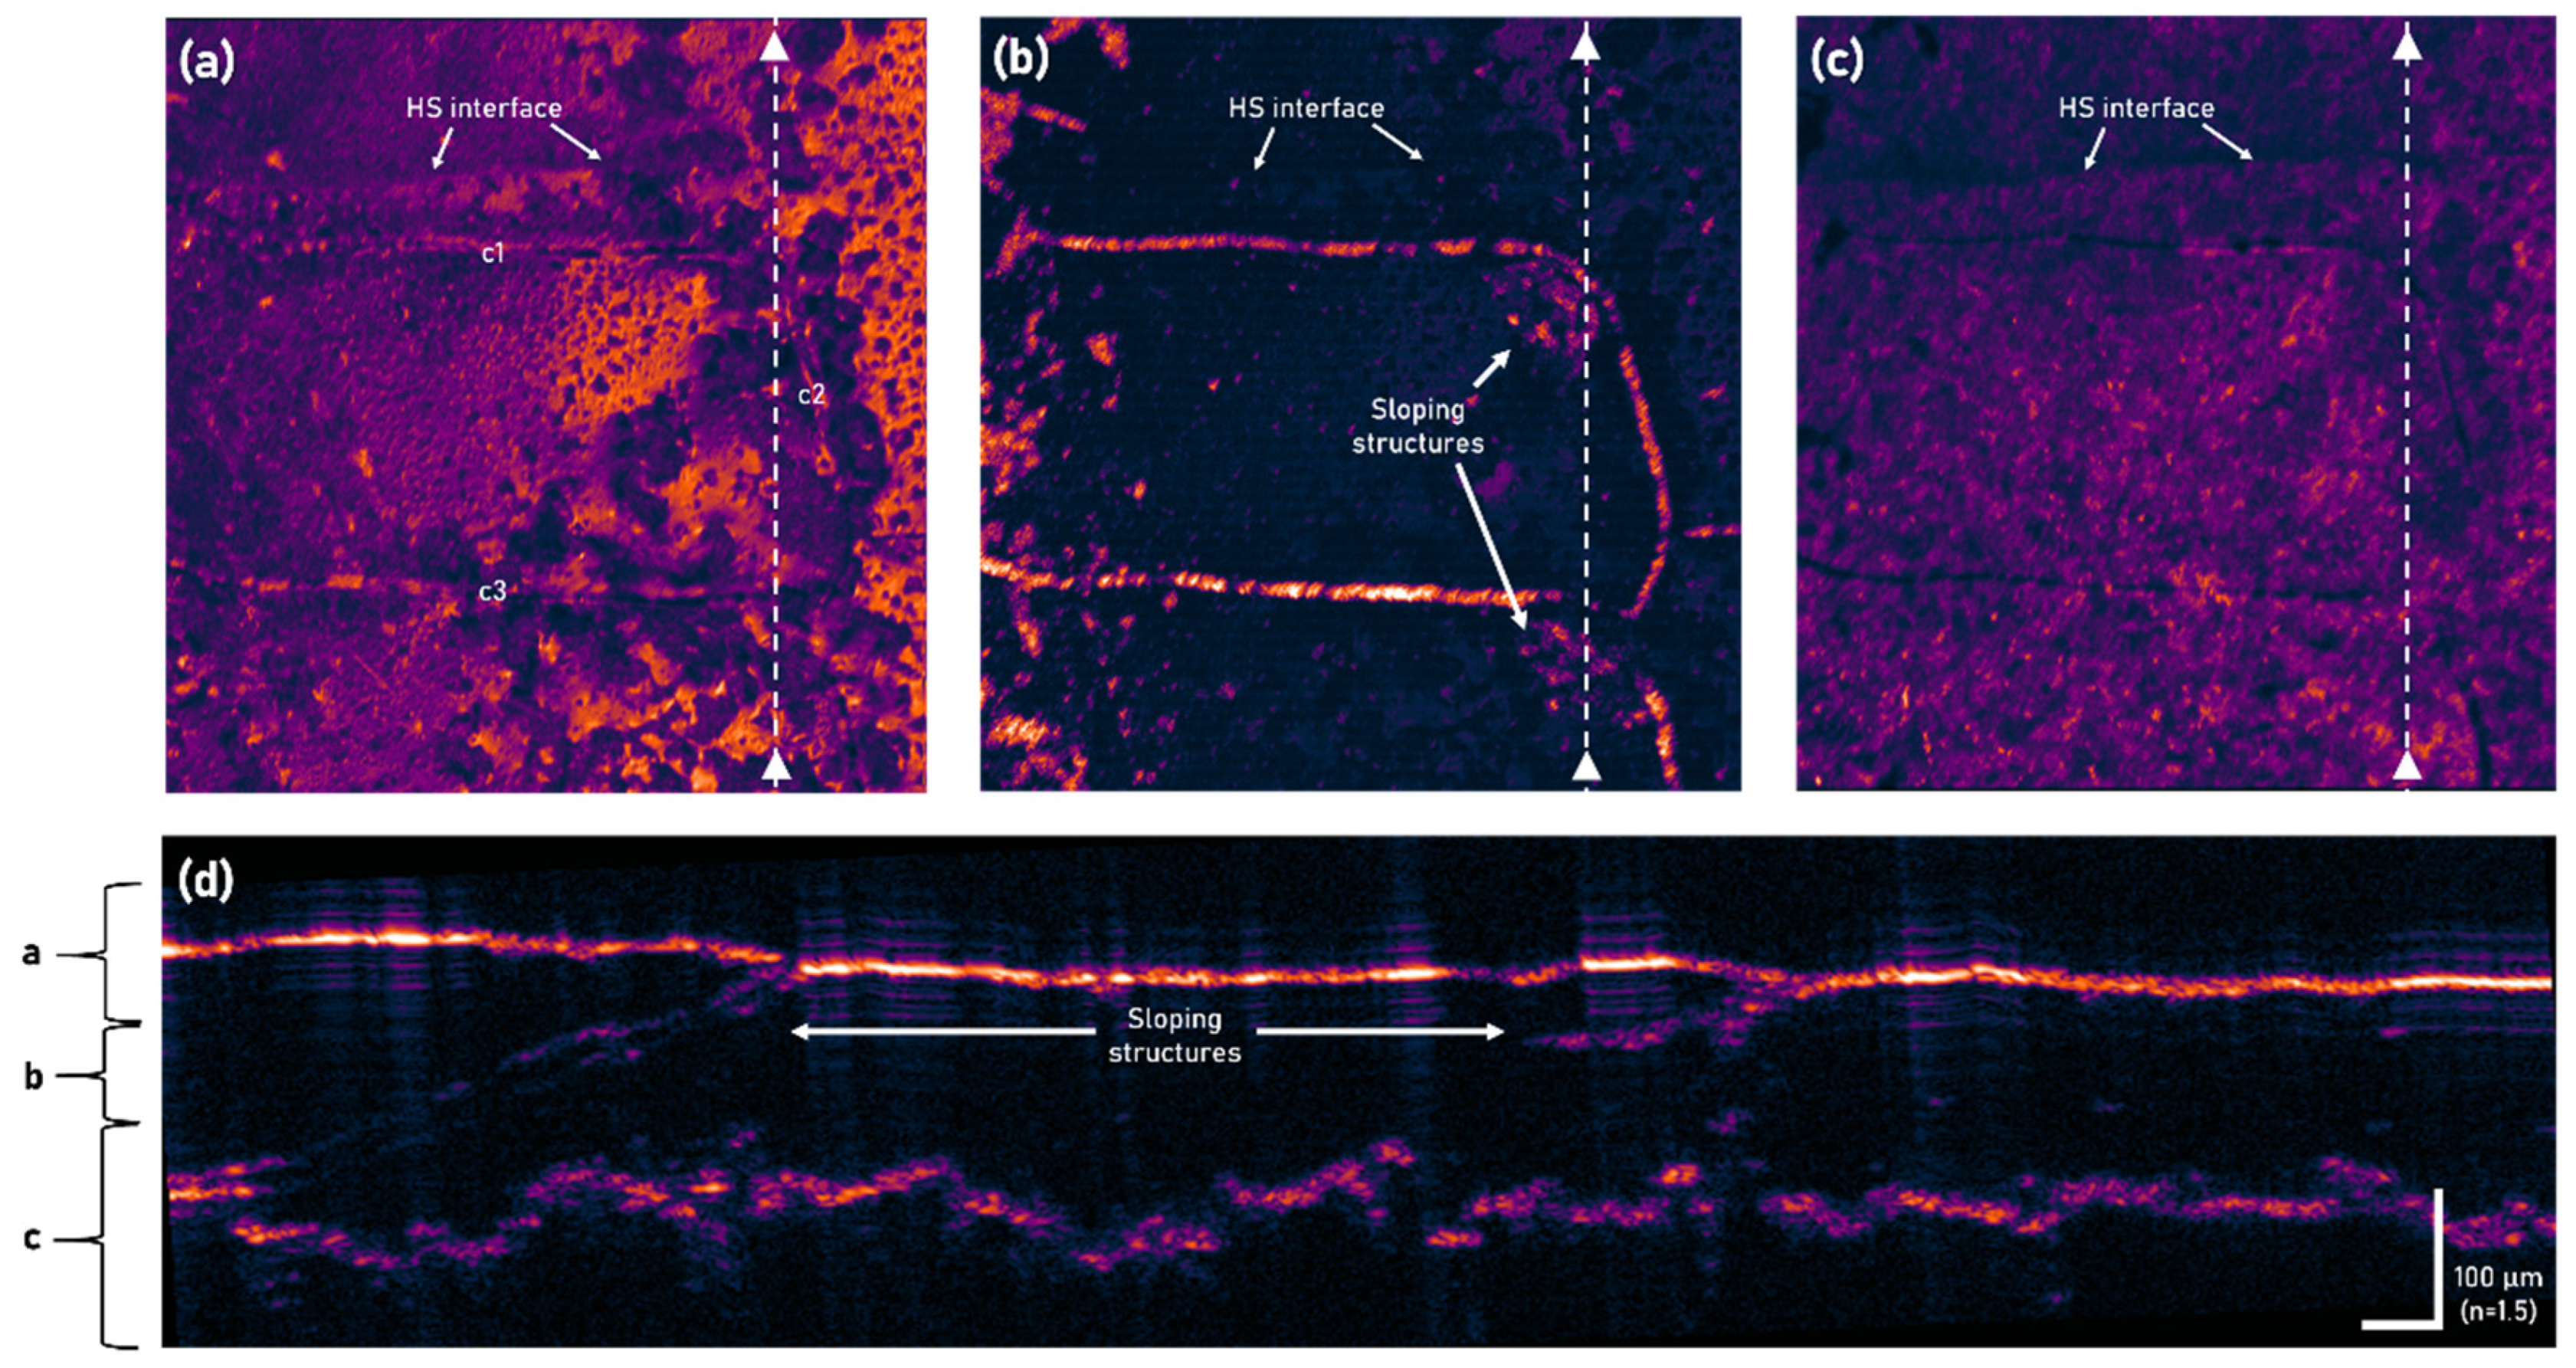
3.1. NIR UHR-OCT Inspection of Cracks and Defects in Transparent Coating Samples

The inspected region is shown in Figure 2a using reflectance microscopy (MS), and the corresponding OCT surface topography is shown in Figure 2b. This region was chosen due to its characteristic pattern of cracks and its proximity to the HS interface. Figure 2c–f are OCT cross-sectional images (B-scans) of the exposed sample taken along the direction of the white arrowheads across the 3 mm length of the scanned area. The vertical scale bars show the approximate scale in the axial direction, indicating a film thickness varying between ~140 and 180 µm, assuming a refractive index of n = 1.5.
Surprisingly, B-scans at the HS interface, such as Figure 2c, were found to have relatively few subsurface features. The main feature in this region is a weak change in reflectivity directly at the interface (indicated by dashed lines) due to the presence of iron-oxide particle agglomerations. On the other hand, the regions near the surface cracks have a multitude of complex subsurface structures. Figure 2d,e are B-scans along the direction of cracks c1 and c3, respectively, and perpendicular to c2. The images clearly show the bottom of the cracks as a plateau between the substrate and coating surface with detailed structures and debris deposited on top or near the surface. Figure 2f shows the cross-section near the intersection between c3 and c2. The discontinuity in the coating surface indicates the location of crack c2, but more interestingly, it shows a downwards sloping structure, which was found to span the area between c2 and c3. As a reference, OCT images of an unexposed sample are shown in Figure 2g–i. The unexposed sample images reveal a significant amount of non-uniformities, both near the surface as indicated in Figure 2g, but also beneath the surface, as shown by the superposition of 20 adjacent line scans in Figure 2h. The many dots spread out within the coating layer suggest the presence of particles or other deviations from the bulk coating, which may give rise to cracks or other defects during exposure.
To attain a better picture of these subsurface structures, the volume can be presented as a set of 2D projections. First, the volume was divided into three zones: surface (a), subsurface (b), and substrate (c), corresponding to the indicated regions in Figure 3d. Then, each volume was projected into a single 2D image, as shown in Figure 3a–c. Figure 3a shows the exposed coating surface, including a range of shallow pinholes of varying diameters. Figure 3b shows the network of subsurface cracks, as well as the sloped structures observed at the junction between the cracks. Figure 3c shows the highly irregular substrate region, which is affected by shadowing from the cracks and pinholes in the layers above, particularly in the HS zone.
From the OCT images, a few conclusions can be drawn. Firstly, the many pinholes on the coating surface are all superficial irrespective of their diameter and therefore do not appear to be the diffusion pathways for the water or the corrosive ions to reach the substrate. The same can be said for the HS interface because there are no visible subsurface defects. The red-colored deposition most likely formed when iron oxide was pulled from the substrate during the rapid decompression (i.e., depressurization to ambient), which then settled near the seawater-exposed surface. The only structures that directly connect the surface and the substrate are the cracks. In particular, the sloping cracks in Figure 3d very clearly show reflections from two interfaces between coating and air, indicating a significant gap. Furthermore, the sloping cracks are very broad compared to the narrow surface cracks, which could be an indication of initial cathodic delamination of the coating [2]. Such subsurface features were not identified in the previous study of Rajagopalan et al. [3] because the analysis was based on surface techniques, including visible light microscopy and SEM. Therefore, spectroscopic techniques were employed to study the chemical signatures of coating degradation present on the surface. In this case, electron dispersive X-ray spectroscopy (EDX) and attenuated total reflectance Fourier-transform infrared spectroscopy was used to map the elemental distribution of the corrosion products and functional group molecular changes in the coating network, respectively. Electrochemical impedance spectroscopy (EIS) is another widely used NDT technique for examining barrier properties of protective coatings [30]. Generally, EIS seeks to understand the degradation mechanisms by studying the change in impedance arising from electrochemical changes in the coating. However, it is usually difficult to interpret the EIS data since the results represent an average response for the entire coating area. Furthermore, the most common coating degradation, namely blistering, occurs locally, making the reproducibility of the impedance data low. One way of improving the limitations of EIS is to use new techniques that provide local measurement data, such as the scanning vibrating electrode technique (SVET) [30]. In this regard, OCT can provide complementary structural information that other surface techniques, such as profilometry and thermography, cannot provide.

3.2. Mid-Infrared OCT for Inspection of Commerical Marine Coatings

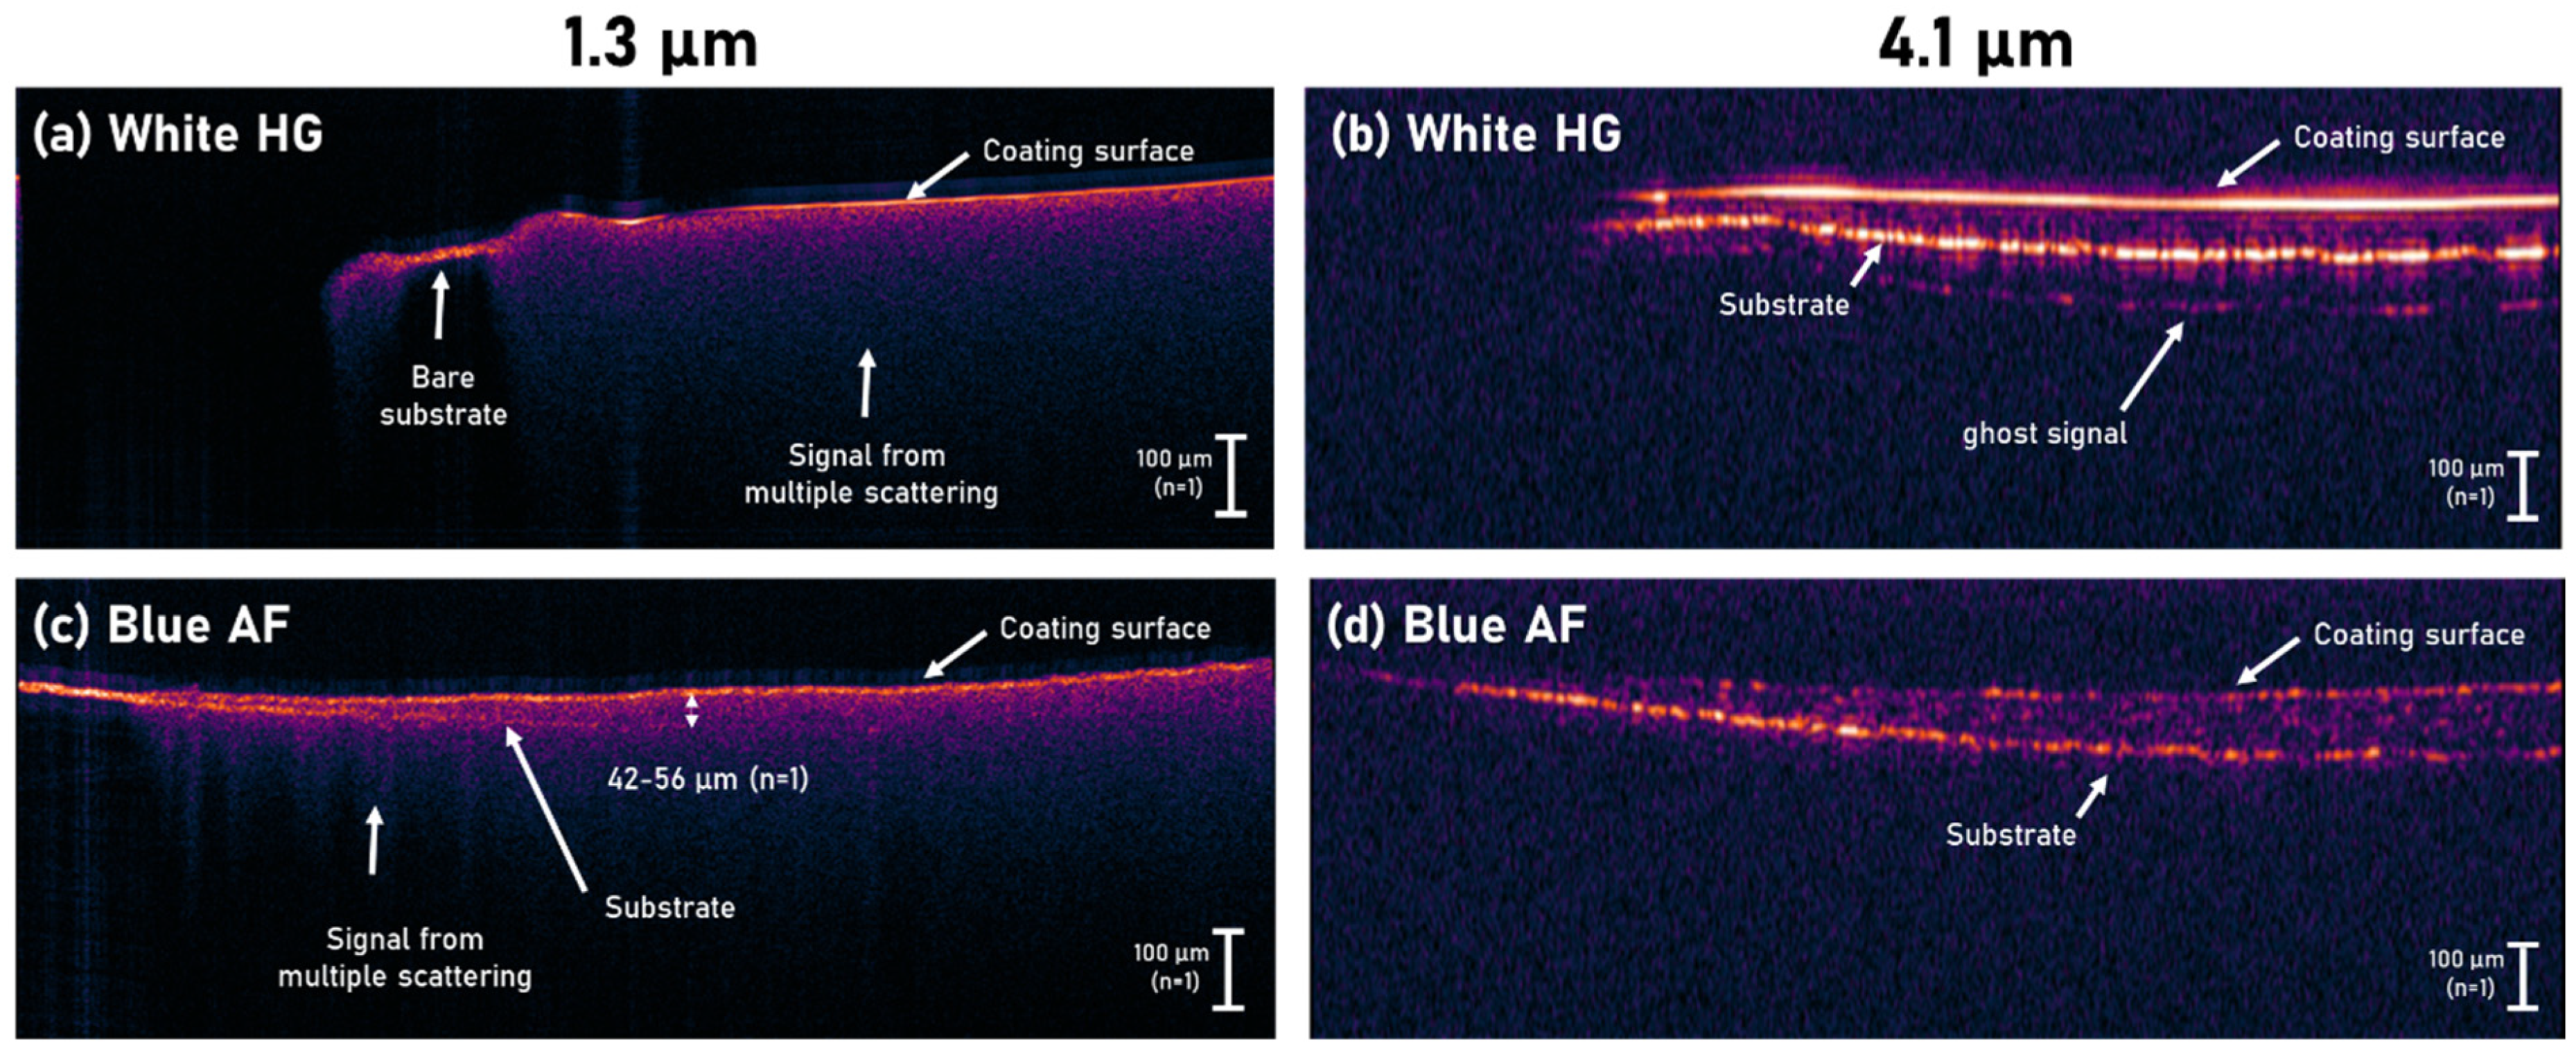
3.2.1. Scattering in NIR vs. MIR OCT

As illustrated in the previous section, NIR OCT can be a useful tool for high-resolution 3D inspection of transparent coatings, but with the addition of pigments and other additives, the operating wavelength of the OCT system becomes critical. In this section, the imaging penetration depth of OCT in pigmented coatings is evaluated both in the NIR at 1.3 µm wavelength and in the MIR at 4.1 µm wavelength. Figure 4 shows a comparison between OCT cross-sectional images of the coated surfaces obtained using 1.3 µm (Figure 4a,c) and 4.1 µm (Figure 4b,d) central wavelength. It is clear from the fading signal in the NIR images that the penetration is severely impeded by scattering when compared to the MIR. For the AF coating, the NIR signal is only able to penetrate about 42–56 µm (assuming for now n = 1) before the signal reflected from the substrate is lost, while for the HG coating, the substrate is not visible at all. In the MIR, the scattering is sufficiently low that individual scattering particles can be seen inside the AF coating, and in the HG coating, a strong signal is reflected from the substrate, giving rise to a double-reflection ghost signal.
The maximum penetration depth in the MIR depends on the number and size of scattering particles, in addition to the surface roughness. Figure 5a shows a cross-section of the blue AF coating, which shows that the Cu2O particles (brown/black) are dispersed throughout the coating in clusters of varying sizes, ranging from around 1 to 50 µm in diameter. Compared to the wavelength around 4.1 µm, it is therefore expected that many of these clusters will prevent light from reaching the substrate. Furthermore, as shown in Figure 5b, the surface of the blue AF coating (left) is very rough compared to the white HG coating (right), causing more light scattering at the surface and thus reducing the maximum penetration depth. To measure the coating thickness, the refractive index first has to be estimated. For this purpose, several scribe marks were made into the coated samples to expose the underlying substrate, as shown with the AF coating in Figure 5e. In this case, n was estimated from the ratio of the thickness in the coating (113.4 µm) and the corresponding distance in the air from the coating surface to the exposed substrate (68.8 µm), which gives n = 113.4 µm/68.8 µm = 1.65. In a second, thicker sample, the refractive index was estimated to be 193.2 µm/115.2 µm = 1.69. This discrepancy could be linked to the non-uniformity of the coating and the dispersion of scattering particles, whose impact increases with the thickness of the coating. For the HG coating, the refractive index was estimated to be n = 88.2 µm/50.4 µm = 1.75 using the same scribe approach. However, in this case, n was also estimated non-destructively from a naturally occurring pinhole. As shown in Figure 5d, a pinhole formed in the sample after applying the second layer of coating in an unscribed area of the sample. By measuring the thickness of the intact coating, the depth of the pinhole, and the thickness of the remaining coating layer at the bottom of the pinhole, the refractive index was estimated to be around n = 1.9, using the relation 403.2/n µm = (141.3 + 130.2/n) µm. Again, n is estimated higher in the thick sample, which suggests that calibration with a known sample may be required to obtain accurate thickness measurements. Figure 5f shows the cross-sectional image of a two-layer HG on AF-coated sample. The image is a superposition of 20 adjacent line scans to capture more of the larger Cu2O particles. In particular, a signal seen near the surface of the coating could be a large Cu2O particle that has migrated from the AF coating to the surface, similar to what is seen in the microscope cross-section of Figure 5c.
Compared to cross-sectional images from SEM or X-ray tomography, MIR OCT provides primarily information about changes in reflectivity and scattering arising from material interfaces. This makes MIR OCT able to clearly distinguish defects and larger particles, such as pigments and additives, while no signal is received from the surrounding binder matrix due to its low scattering properties. In contrast, SEM and X-ray tomography reveal details about the coating in its entirety. Mishnaevsky et al. (2020) used both SEM and X-ray tomography to study the mechanisms of leading-edge erosion of wind turbine blade coatings, revealing microscopic bubbles and cracks as well as the underlying substrate [31]. In comparison, MIR OCT is currently limited to a few hundred microns of coating depending on the surface roughness and particle sizes. However, the outermost coating layer is typically the most critical in terms of environmental protection, and since it is non-destructive, fast, and field-applicable, MIR OCT enables a range of new applications, such as time-lapse studies and coating inspection on larger structures.
Interestingly, because of the rough surface of the blue AF coating, it was found that the penetration depth was significantly enhanced when imaging the wet coating before curing when it is smooth and therefore has lower scattering. For this reason, a short study on imaging WFT and particle dispersion during curing was performed.

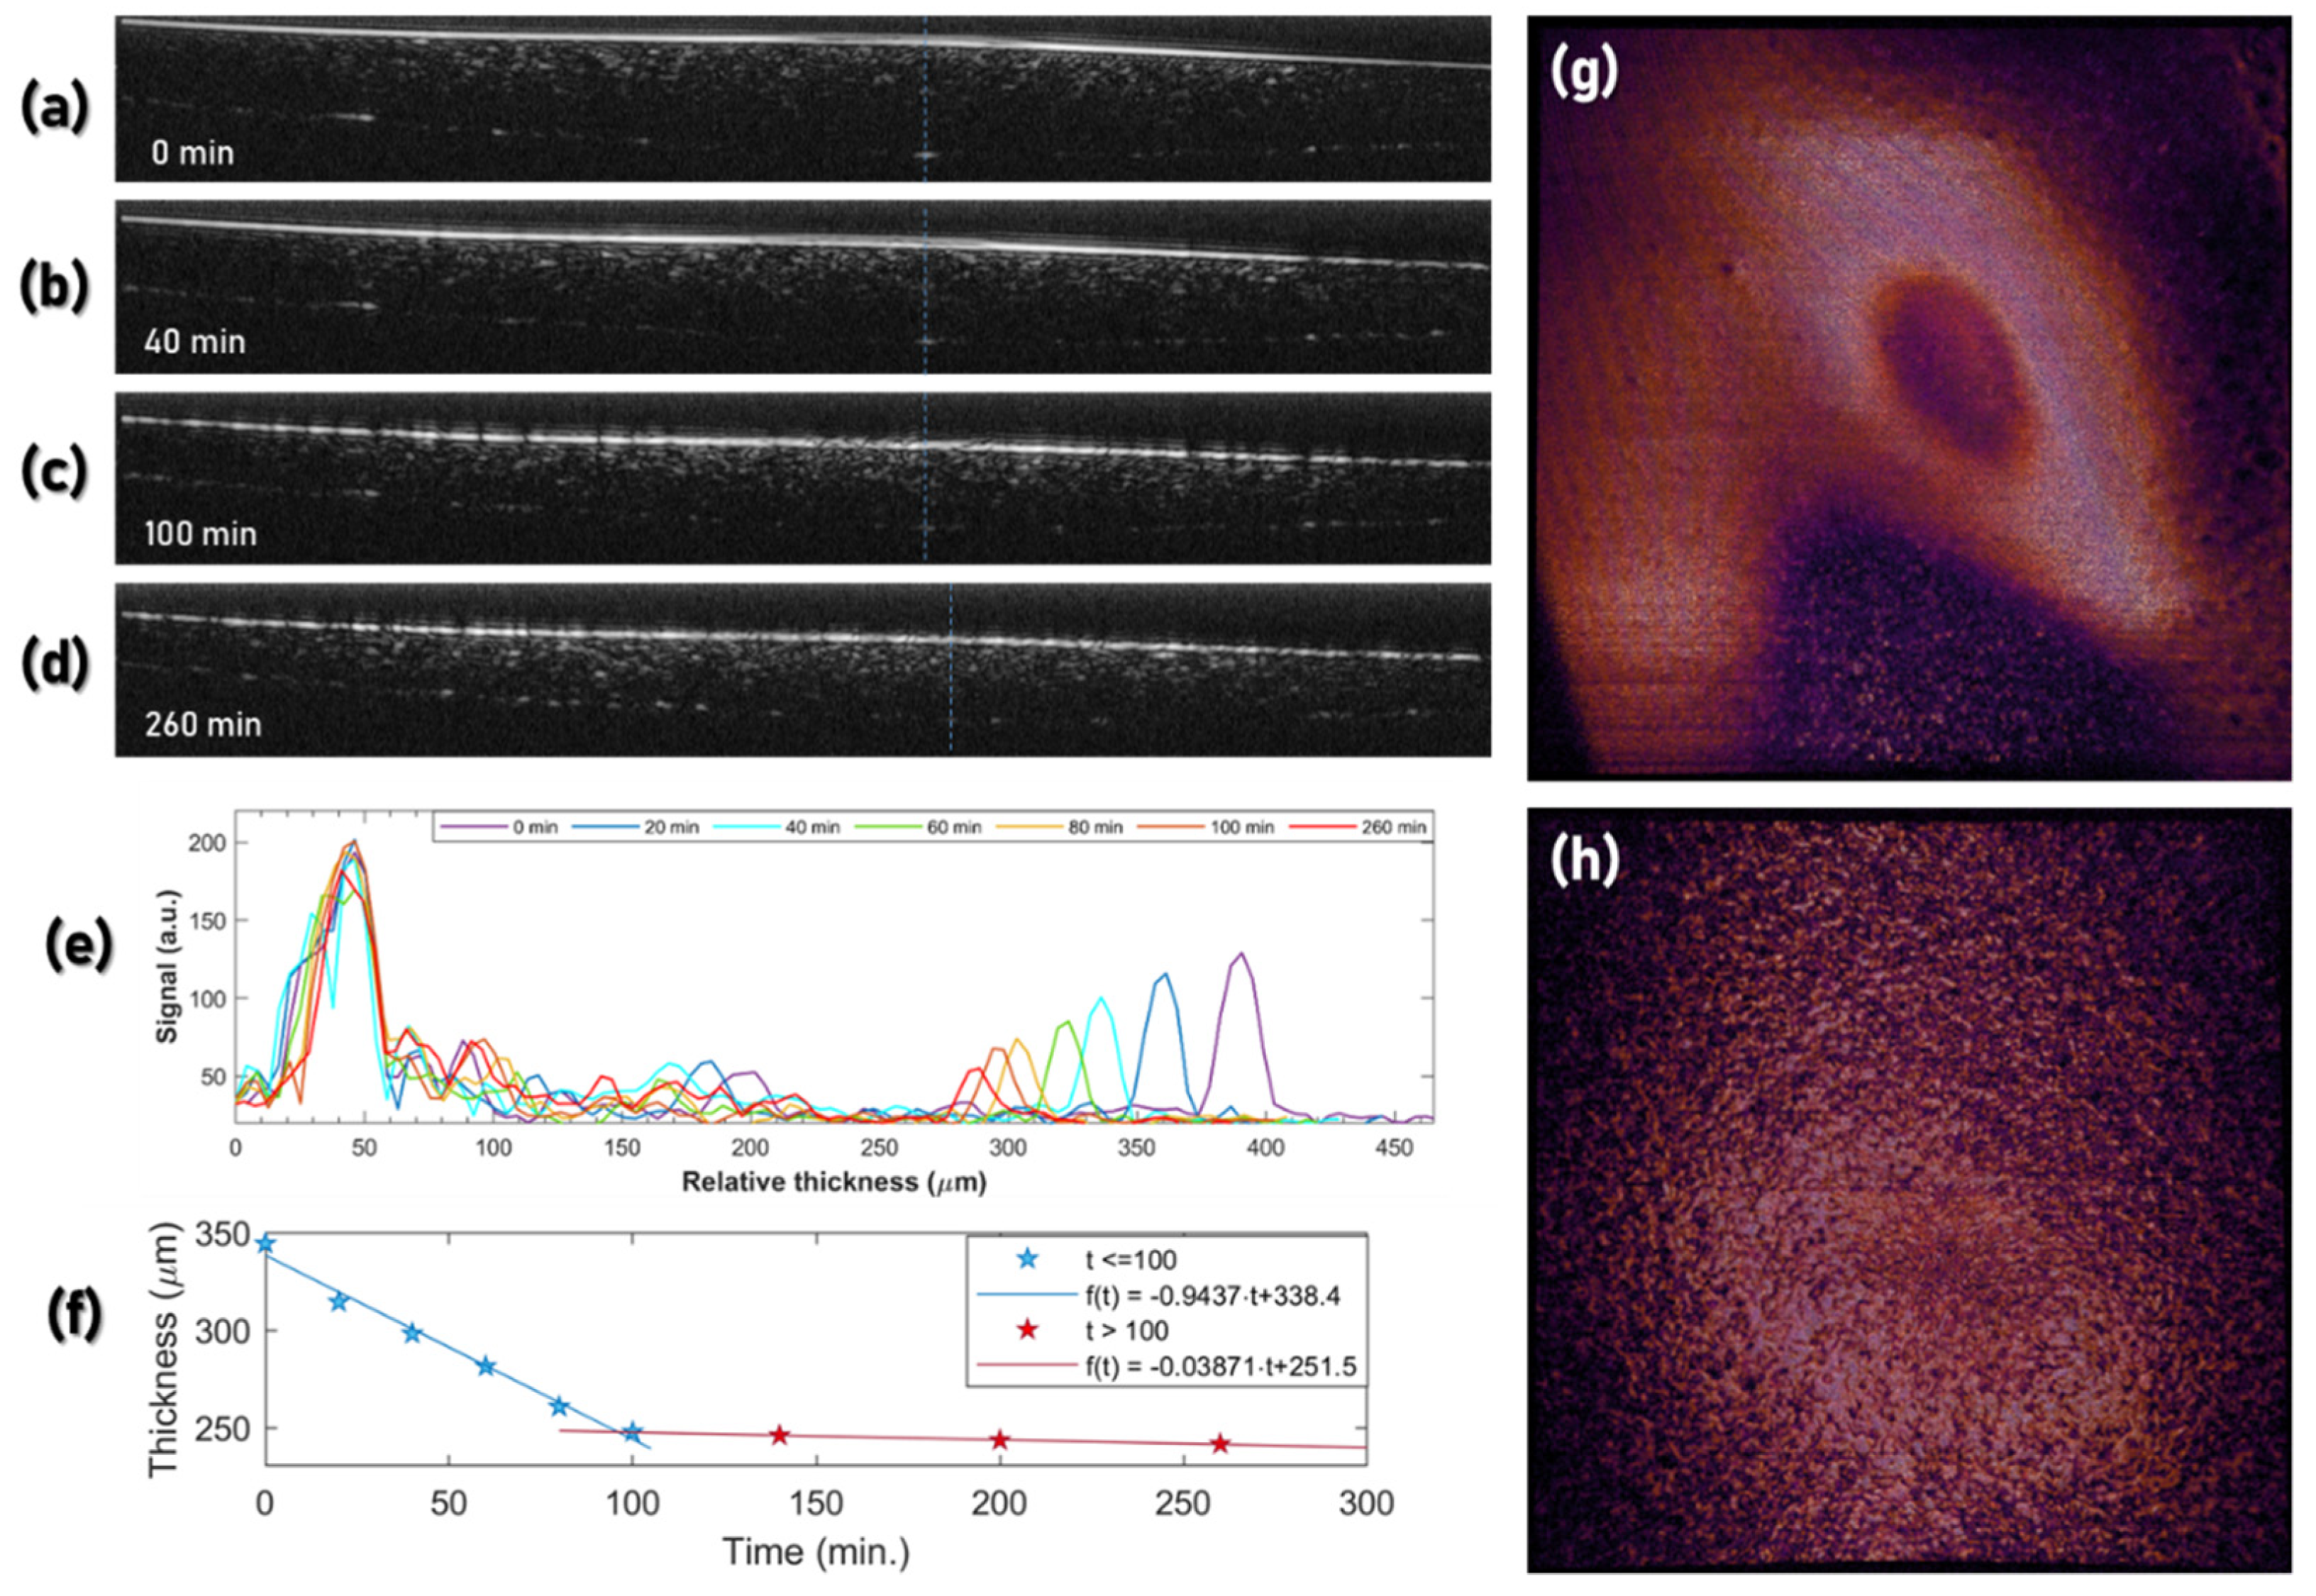
3.2.2. Measurements on Curing Wet Coating

Measurements of WFT are typically made by mechanically applying a comb-like thickness gauge with varying comb lengths or similar tools that require physical contact with the coating. As such, this measurement disturbs the coating layer and can, in the worst case, lead to contamination and defects that compromise the coating. In this case, ultrasound also cannot be used since this requires physical contact. Other methods, such as optical profilometry, are surface techniques that can only measure the relative reduction in film thickness and thus require that an inscription is made into the dry film to obtain the actual film thickness. OCT, on the other hand, is a non-contact method, which can be used to monitor not just how the coating thickness evolves over time, but also the dispersion of various particles and potentially the formation of defects. Here, we monitored the thickness of the AF coating over time just a few minutes after application by a paintbrush. Figure 6a–e shows the measured B-scans (10 averages) of the coating at select intervals, which clearly show that the thickness of the coating is reduced over time. To avoid any effect of the laser on the drying process, the laser was blocked between the measurements, and each measurement of 10 B-scans took only about 10 s with the laser spot rapidly scanning across the 3 mm. Figure 6e displays the evolution of the coating thickness over time from when the measurement started at t = 0 min and until t = 100 min in 20 min intervals. At this point, the coating thickness reduction slowed down significantly, and therefore the measurement frequency was reduced. At t = 0, the WFT of the AF coating was about 344.4/1.64 = 210 µm, which is 41% higher than what was achieved in the dry film. From t = 200 min to t = 260 min, the coating thickness was reduced by ~2 µm, and so at this point, the test was terminated. For these measurements, it is assumed that changes in the refractive index during solvent vaporization are negligible.
Currently, there are few non-contact methods for measuring wet coatings. Wang et al. (2019) measured solvent evaporation and leveling of AF coatings using profilometry, which, compared with an uncoated reference, is used to indirectly determine the coating thickness [32]. On the other hand, OCT can directly measure the thickness of the coating provided that the system is calibrated for the refractive index, just as it is done with US. More importantly, OCT can visualize particle dispersion and defects as they form inside the volume, while profilometry can only capture the surface topography.
Figure 6g,h show the surface topography of the sample at the start and end of the test, respectively. It is clear that the initially smooth surface of the wet coating became very irregular and rough after curing, which also resulted in the signal level from the substrate decreasing over time, as seen in Figure 6e. A similar effect occurs in the case where the substrate is affected by corrosion. The change in reflectivity at the coating-substrate interface can, therefore, in principle, be used to detect corrosion.

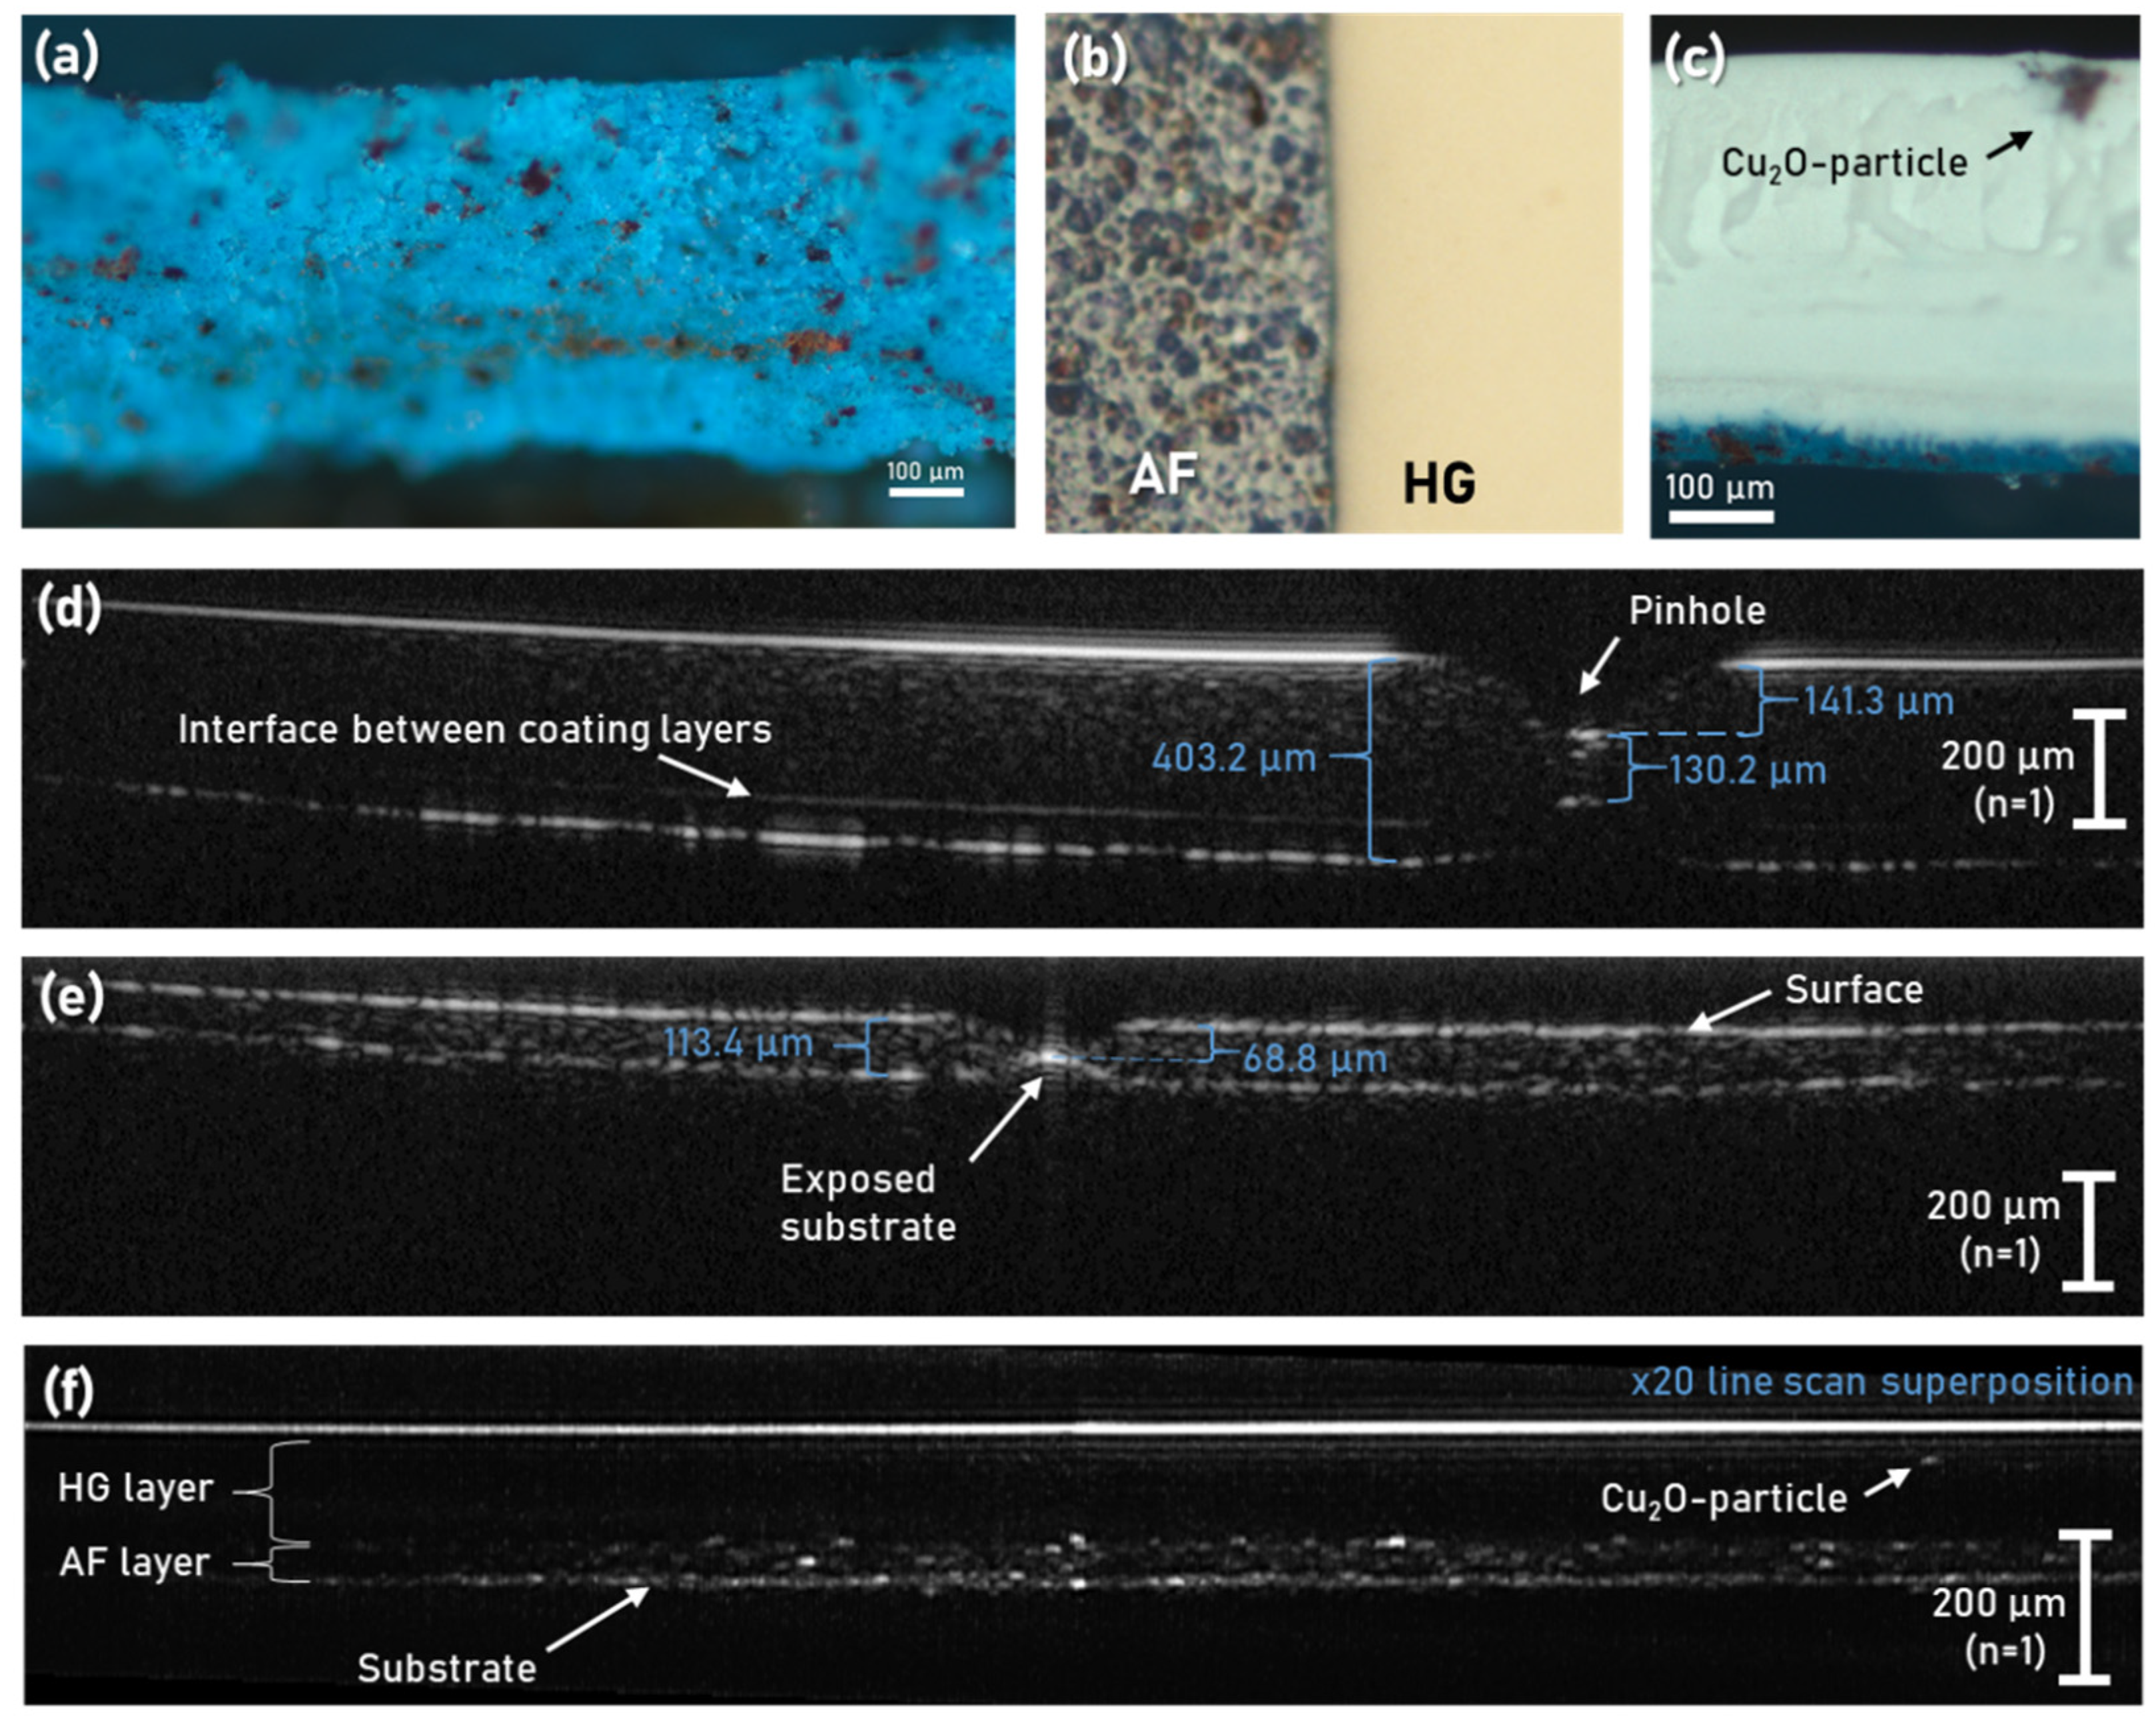
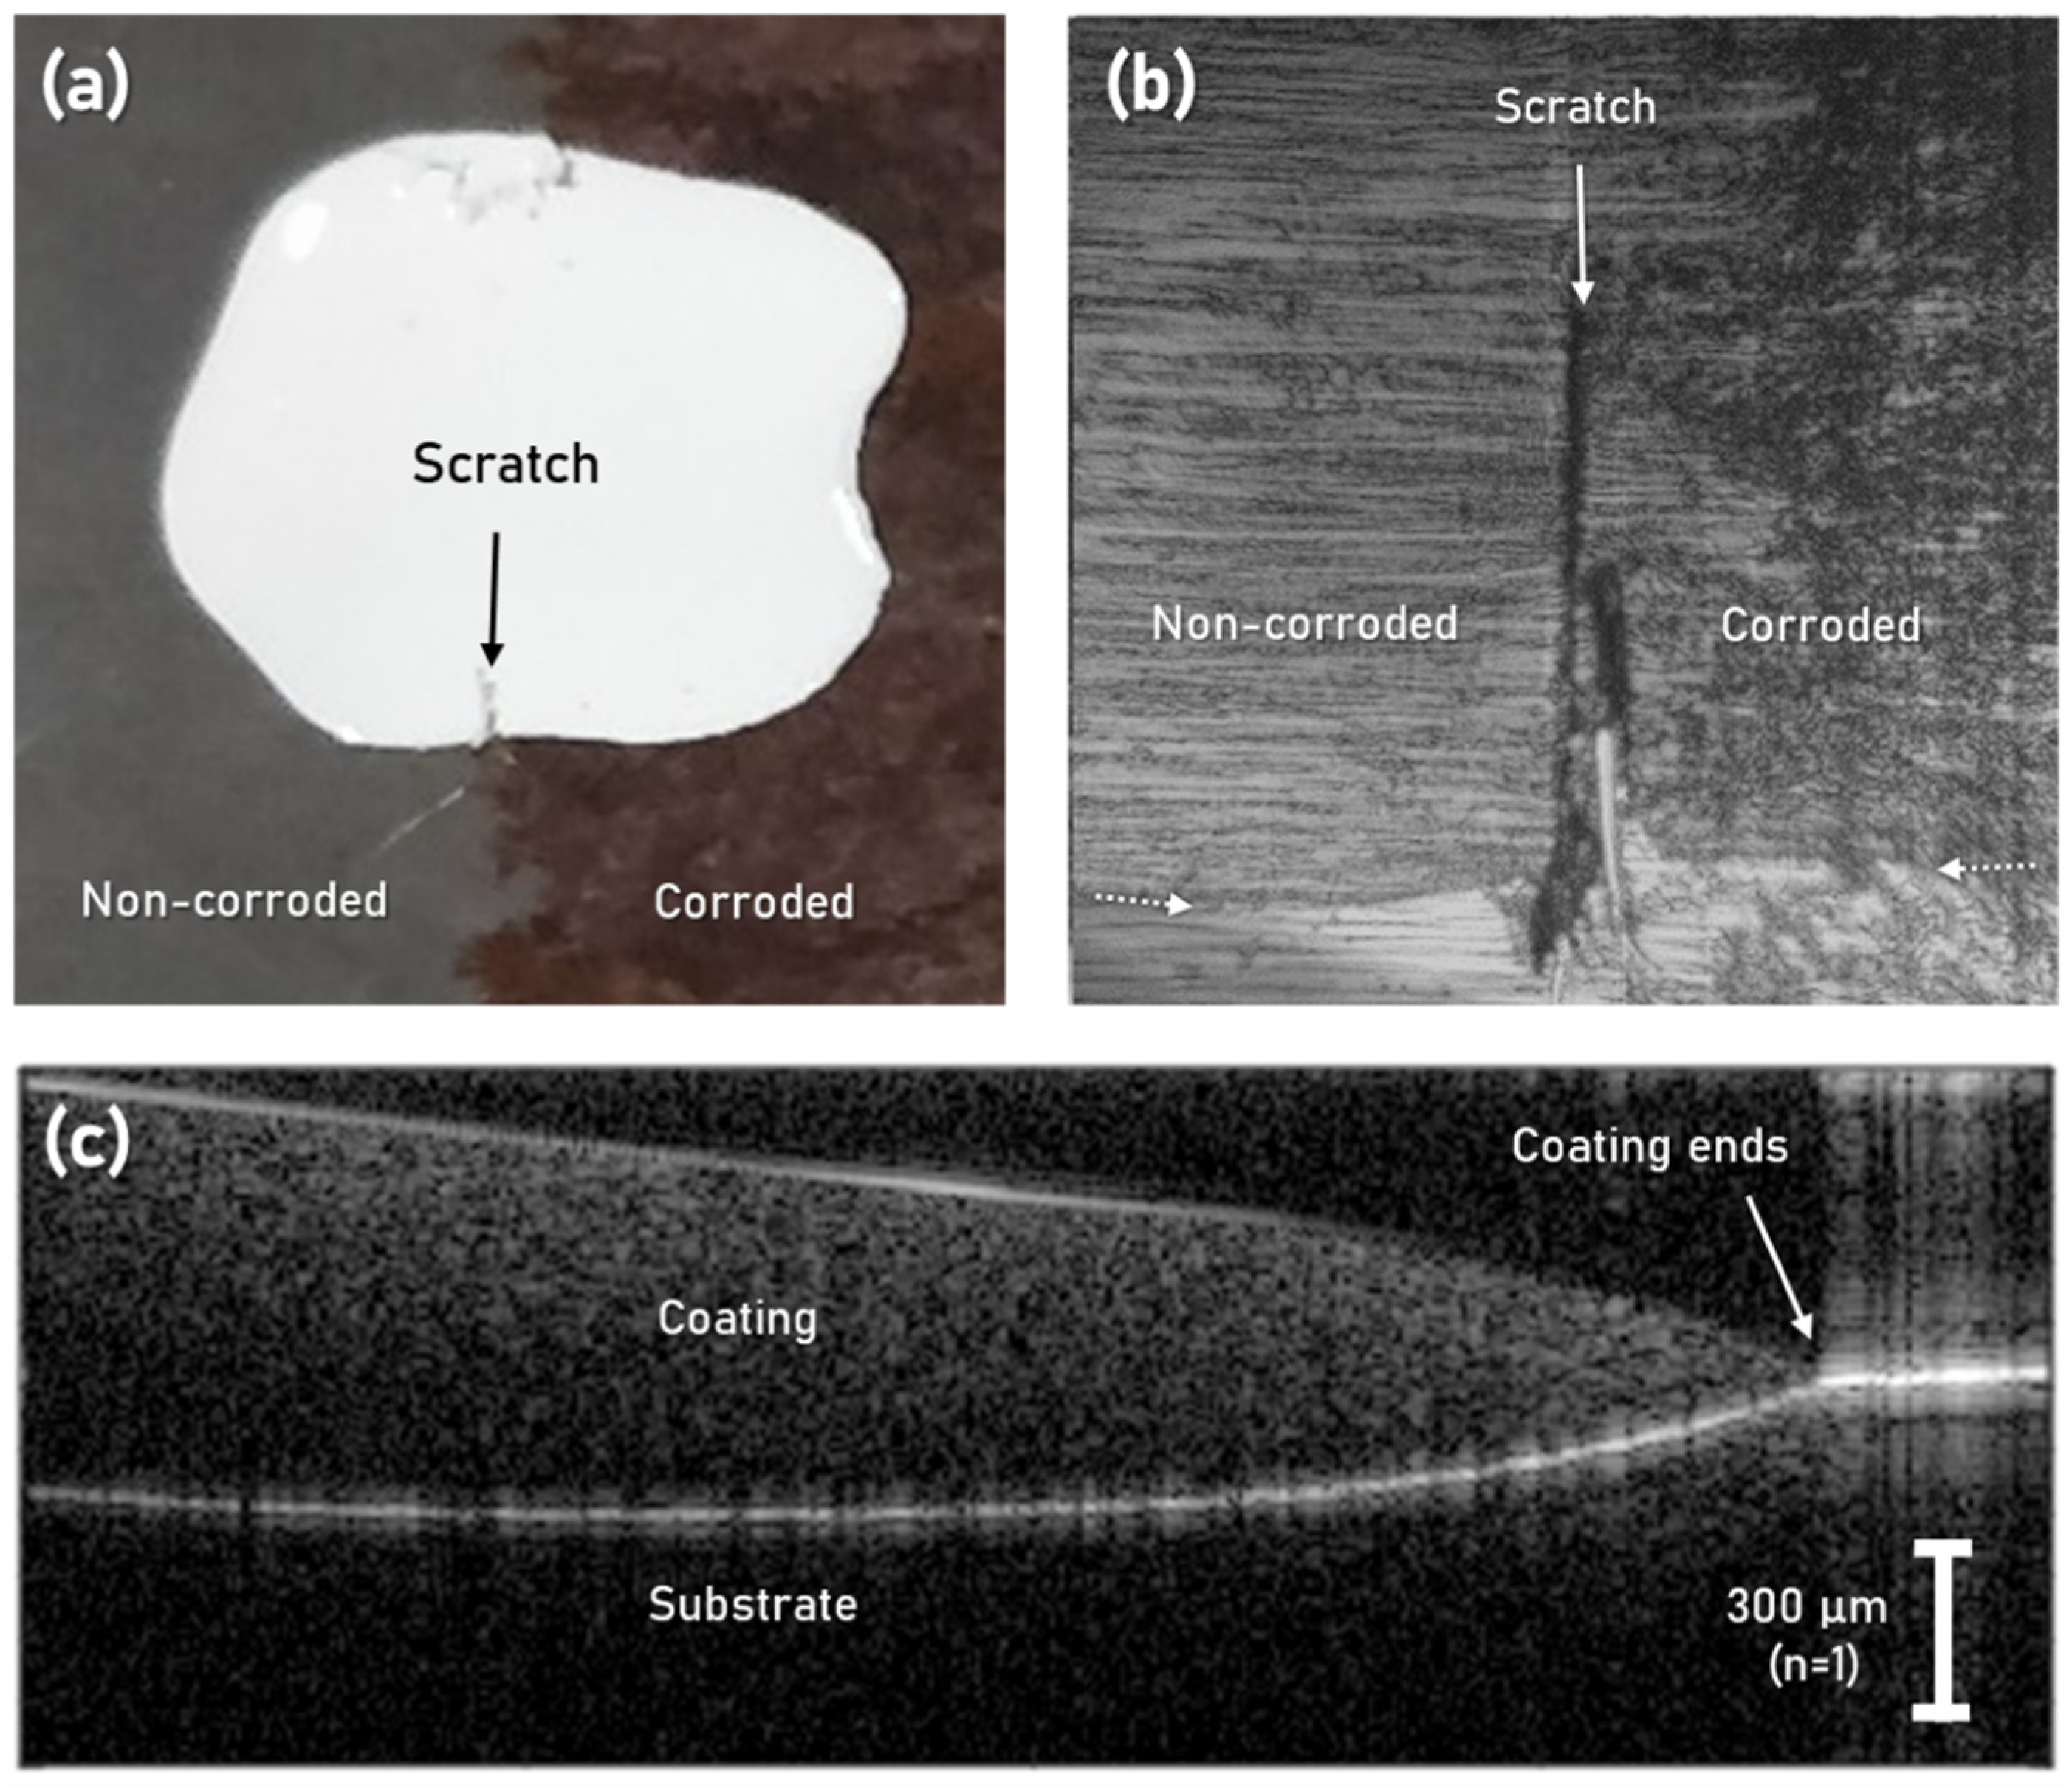
3.2.3. Corrosion Detection

As a final proof-of-concept demonstration, we present the detection of corrosion through a single layer of the HG coating. The measurement was performed by applying a drop of the HG coating on top of a partially-corroded aluminum plate, as shown in Figure 7a. The coating was scratched with a scalpel blade at the interface between the corroded and non-corroded regions of the sample to verify the position of the subsequent OCT scan. The result of the OCT scan is shown in Figure 7b. The top-down OCT image shows the region of the scratch, including both corroded and non-corroded regions. The interface between the coated and uncoated substrate is indicated by dotted arrows. Clearly, in this case, the corrosion can be visually identified on the right side of the figure, even for a 369 µm (n = 1.8) thick coating. In the current setup, the 3 × 3 mm (400 × 400 pixels) scan took 9 min 29 s using 3 ms integration time, corresponding to a line rate of around 281 Hz. With further improvements to the detection and data processing, kHz line rates are achievable, which will make the system relevant for industrial NDT.
In the work of Bi et al., the researchers used 3D profilometry to delineate subsurface corrosion creep derived from changes in the coating roughness and volume due to corrosion and blistering [5]. They confirmed these results using SAM, which also provided complementary structural information about loss of adhesion. SAM has also been used in conjunction with EIS to study the delamination processes at the coating steel interface and blister formation [33], but the need for immersing the samples in distilled water to perform SAM measurements is considered disadvantageous when compared to OCT. MIR OCT could therefore be employed as a non-contact alternative to SAM for studying corrosion creep and for early corrosion detection in marine structures.

4. Conclusions

In conclusion, OCT in the NIR and MIR spectral range was evaluated as a non-destructive technique for inspection of coatings and found to have promising applications in both wavelength regimes. NIR OCT was shown to enable detailed imaging of subsurface defects and structures in an epoxy resin, which can provide valuable insights into the degradation pathways of coatings for hostile environments, such as downhole conditions in the oil and gas industry. The ability to look into the volume non-destructively allowed for the identification of angled subsurface cracks that reached all the way to the substrate, which might otherwise have been missed or compromised, e.g., by immersion in liquid during SAM. MIR OCT provided suitable penetration in marine antifouling and corrosion-resistant coatings with highly scattering pigments and additives. To the best of our knowledge, this is the first study to capture the potential of MIR OCT for non-destructive imaging of functional coatings. As an example application, MIR OCT was employed to monitor the decrease in WFT and particle dispersion during the curing of a 210 µm layer of antifouling hull coating, which is not possible using traditional non-contact techniques, such as profilometry. While the imaging penetration is reduced compared to X-ray tomography or SAM, it requires no sample preparation or contact medium and is not limited to scanning smaller samples that will fit inside a sample compartment. MIR OCT was also used to detect corrosion below 369 µm of highly scattering white-pigmented alkyd enamel, which shows promise as an early corrosion detection technique in marine environments. Besides decoding the coating-environment surface interactions, MIR OCT offers a way to probe the metal-coating underfilm interactions owing to its increased penetration depth compared to NIR. The otherwise challenging real-time analysis of these phenomena at the metal-coating interface now looks promising, revealing unnoticed coating deteriorations such as underfilm corrosion, loss of adhesion, and initiation of internal coating defects. With the combination of high spatial resolution and scan rates approaching the kHz level in a practical non-contact modality, the technique is expected to find more industrial and research applications within, e.g., ceramic thermal barrier coatings or additive manufacturing.

Author Contributions

Conceptualization, C.R.P.; Methodology, C.R.P., N.R. and N.M.I.; Software, N.M.I.; Validation, C.R.P. and N.R.; Formal Analysis, C.R.P. and N.R.; Investigation, C.R.P. and N.R.; Resources, O.B., S.K., C.P., P.T.-L., P.J.R. and G.W.; Writing—Original Draft Preparation, C.R.P.; Writing—Review and Editing, C.R.P., N.R., N.M.I., C.M., O.B., S.K., C.E.W., C.P. and P.T.-L.; Visualization, C.R.P.; Supervision, S.K. and O.B.; Project Administration, C.R.P. and C.M.; Funding Acquisition, C.R.P., O.B., S.K. and C.M. All authors have read and agreed to the published version of the manuscript.

Funding

This research was funded by The Danish Maritime Fund project SHIP-COAT: “Subsurface High-resolution Inspection of Paints and Coatings using nOn-destructive lAser Tomography” grant number 2019-137. The OCT systems were developed as part of the Innovation Fund Denmark project Shape-OCT grant number 4107-00011A.

Institutional Review Board Statement

Not applicable.

Informed Consent Statement

Not applicable.

Data Availability Statement

The data presented in this study are available on request from the corresponding author. The data are not publicly available due to the large storage requirements of the files.

Conflicts of Interest

The authors declare no conflict of interest.

References

  1. Popoola, L.T.; Grema, A.S.; Latinwo, G.K.; Gutti, B.; Balogun, A.S. Corrosion problems during oil and gas production and its mitigation. Int. J. Ind. Chem. 2013, 4, 35. [Google Scholar] [CrossRef] [Green Version]
  2. Sørensen, P.A.; Kiil, S.; Dam-Johansen, K.; Weinell, C.E. Anticorrosive coatings: A review. J. Coat. Technol. Res. 2009, 6, 135–176. [Google Scholar] [CrossRef]
  3. Rajagopalan, N.; Weinell, C.E.; Dam-Johansen, K.; Kiil, S. Degradation mechanisms of amine-cured epoxy novolac and bisphenol F resins under conditions of high pressures and high temperatures. Prog. Org. Coat. 2021, 156, 106268. [Google Scholar] [CrossRef]
  4. Alig, I.; Tadjbach, S.; Krüger, P.; Oehler, H.; Lellinger, D. Characterization of coating systems by scanning acoustic microscopy: Debonding, blistering and surface topology. Prog. Org. Coat. 2009, 64, 112–119. [Google Scholar] [CrossRef]
  5. Bi, H.; Weinell, C.E.; de Pablo, R.A.; Varela, B.S.; Carro, S.G.; Ruiz, Á.R.; Dam-Johansen, K. Rust creep assessment—A comparison between a destructive method according to ISO 12944 and selected non-destructive methods. Prog. Org. Coat. 2021, 157, 106293. [Google Scholar] [CrossRef]
  6. Alves-Lima, D.; Song, J.; Li, X.; Portieri, A.; Shen, Y.; Zeitler, J.A.; Lin, H. Review of terahertz pulsed imaging for pharmaceutical film coating analysis. Sensors 2020, 20, 1441. [Google Scholar] [CrossRef] [Green Version]
  7. Krimi, S.; Klier, J.; Jonuscheit, J.; von Freymann, G.; Urbansky, R.; Beigang, R. Highly accurate thickness measurement of multi-layered automotive paints using terahertz technology. Appl. Phys. Lett. 2016, 109, 021105. [Google Scholar] [CrossRef]
  8. Zeitler, J.; Gladden, L. In-vitro tomography and non-destructive imaging at depth of pharmaceutical solid dosage forms. Eur. J. Pharm. Biopharm. 2009, 71, 2–22. [Google Scholar] [CrossRef] [PubMed]
  9. Bradley, R.S.; Liu, Y.; Burnett, T.L.; Zhou, X.; Lyon, S.B.; Withers, P.J.; Gholinia, A.; Hashimoto, T.; Graham, D.; Gibbon, S.R.; et al. Time-lapse lab-based X-ray nano-CT study of corrosion damage. J. Microsc. 2017, 267, 98–106. [Google Scholar] [CrossRef] [Green Version]
  10. Wang, Y.; Adrien, J.; Normand, B. Porosity Characterization of Cold Sprayed Stainless Steel Coating Using Three-Dimensional X-ray Microtomography. Coatings 2018, 8, 326. [Google Scholar] [CrossRef] [Green Version]
  11. Qu, Z.; Jiang, P.; Zhang, W. Development and Application of Infrared Thermography Non-Destructive Testing Techniques. Sensors 2020, 20, 3851. [Google Scholar] [CrossRef]
  12. Liu, Z.; Jiao, D.; Shi, W.; Xie, H. Linear laser fast scanning thermography NDT for artificial disbond defects in thermal barrier coatings. Opt. Express 2017, 25, 31789–31800. [Google Scholar] [CrossRef] [PubMed]
  13. Israelsen, N.M.; Maria, M.; Mogensen, M.; Bojesen, S.; Jensen, M.; Haedersdal, M.; Podoleanu, A.; Bang, O. The value of ultrahigh resolution OCT in dermatology—Delineating the dermo-epidermal junction, capillaries in the dermal papillae and vellus hairs. Biomed. Opt. Express 2018, 9, 2240–2265. [Google Scholar] [CrossRef] [Green Version]
  14. Nishizawa, N.; Kawagoe, H.; Yamanaka, M.; Matsushima, M.; Mori, K.; Kawabe, T. Wavelength Dependence of Ultrahigh-Resolution Optical Coherence Tomography Using Supercontinuum for Biomedical Imaging. IEEE J. Sel. Top. Quantum Electron. 2019, 25, 1–15. [Google Scholar] [CrossRef]
  15. Hartl, I.; Li, X.D.; Chudoba, C.; Ghanta, R.K.; Ko, T.H.; Fujimoto, J.G.; Ranka, J.K.; Windeler, R.S. Ultrahigh-resolution optical coherence tomography using continuum generation in an air–silica microstructure optical fiber. Opt. Lett. 2001, 26, 608–610. [Google Scholar] [CrossRef] [PubMed]
  16. Jahromi, K.E.; Nematollahi, M.; Pan, Q.; Abbas, M.A.; Cristescu, S.M.; Harren, F.J.M.; Khodabakhsh, A. Sensitive multi-species trace gas sensor based on a high repetition rate mid-infrared supercontinuum source. Opt. Express 2020, 28, 26091–26101. [Google Scholar] [CrossRef] [PubMed]
  17. Petersen, C.R.; Prtljaga, N.; Farries, M.; Ward, J.; Napier, B.; Lloyd, G.R.; Nallala, J.; Stone, N.; Bang, O. Mid-infrared multispectral tissue imaging using a chalcogenide fiber supercontinuum source. Opt. Lett. 2018, 43, 999–1002. [Google Scholar] [CrossRef]
  18. Israelsen, N.M.; Petersen, C.R.; Barh, A.; Jain, D.; Jensen, M.; Hannesschläger, G.; Tidemand-Lichtenberg, P.; Pedersen, C.; Podoleanu, A.; Bang, O. Real-time high-resolution mid-infrared optical coherence tomography. Light Sci. Appl. 2019, 8, 11. [Google Scholar] [CrossRef] [PubMed] [Green Version]
  19. Zorin, I.; Su, R.; Prylepa, A.; Kilgus, J.; Brandstetter, M.; Heise, B. Mid-infrared Fourier-domain optical coherence tomography with a pyroelectric linear array. Opt. Express 2018, 26, 33428–33439. [Google Scholar] [CrossRef]
  20. Lenz, M.; Mazzon, C.; Dillmann, C.; Gerhardt, N.; Welp, H.; Prange, M.; Hofmann, M. Spectral Domain Optical Coherence Tomography for Non-Destructive Testing of Protection Coatings on Metal Substrates. Appl. Sci. 2017, 7, 364. [Google Scholar] [CrossRef] [Green Version]
  21. Cheung, C.S.; Daniel, J.M.O.; Tokurakawa, M.; Clarkson, W.A.; Liang, H. High resolution Fourier domain optical coherence tomography in the 2 μm wavelength range using a broadband supercontinuum source. Opt. Express 2015, 23, 1992–2001. [Google Scholar] [CrossRef] [Green Version]
  22. Dong, Y.; Lawman, S.; Zheng, Y.; Williams, D.; Zhang, J.; Shen, Y.-C. Nondestructive analysis of automotive paints with spectral domain optical coherence tomography. Appl. Opt. 2016, 55, 3695–3700. [Google Scholar] [CrossRef] [Green Version]
  23. Wang, C.; Zhang, N.; Sun, Z.; Li, Z.; Li, Z.; Xu, X. Recovering hidden sub-layers of repainted automotive paint by 3D optical coherence tomography. Aust. J. Forensic Sci. 2019, 51, 331–339. [Google Scholar] [CrossRef]
  24. Zhang, N.; Wang, C.; Sun, Z.; Mei, H.; Huang, W.; Xu, L.; Xie, L.; Guo, J.; Yan, Y.; Li, Z.; et al. Characterization of automotive paint by optical coherence tomography. Forensic Sci. Int. 2016, 266, 239–244. [Google Scholar] [CrossRef] [PubMed]
  25. Zhang, J.; Williams, B.M.; Lawman, S.; Atkinson, D.; Zhang, Z.; Shen, Y.; Zheng, Y. Non-destructive analysis of flake properties in automotive paints with full-field optical coherence tomography and 3D segmentation. Opt. Express 2017, 25, 18614–18626. [Google Scholar] [CrossRef] [PubMed] [Green Version]
  26. Targowski, P.; Iwanicka, M. Optical Coherence Tomography: Its role in the non-invasive structural examination and conservation of cultural heritage objects—A review. Appl. Phys. A 2012, 106, 265–277. [Google Scholar] [CrossRef] [Green Version]
  27. Invernizzi, C.; Fiocco, G.; Iwanicka, M.; Targowski, P.; Piccirillo, A.; Vagnini, M.; Licchelli, M.; Malagodi, M.; Bersani, D. Surface and Interface Treatments on Wooden Artefacts: Potentialities and Limits of a Non-Invasive Multi-Technique Study. Coatings 2020, 11, 29. [Google Scholar] [CrossRef]
  28. Zhang, Z.; Williams, B.; Zheng, Y.; Lin, H.; Shen, Y. Differentiating generic versus branded pharmaceutical tablets using ultra-high-resolution optical coherence tomography. Coatings 2019, 9, 326. [Google Scholar] [CrossRef] [Green Version]
  29. Yebra, D.M.; Kiil, S.; Dam-Johansen, K. Antifouling technology—Past, present and future steps towards efficient and environmentally friendly antifouling coatings. Prog. Org. Coat. 2004, 50, 75–104. [Google Scholar] [CrossRef]
  30. Zubielewicz, M.; Gnot, W. Mechanisms of non-toxic anticorrosive pigments in organic waterborne coatings. Prog. Org. Coat. 2004, 49, 358–371. [Google Scholar] [CrossRef]
  31. Mishnaevsky, L.; Fæster, S.; Mikkelsen, L.P.; Kusano, Y.; Bech, J.I. Micromechanisms of leading edge erosion of wind turbine blades: X-ray tomography analysis and computational studies. Wind Energy 2020, 23, 547–562. [Google Scholar] [CrossRef]
  32. Wang, X.; Weinell, C.E.; Tobar, V.; Olsen, S.M.; Kiil, S. Leveling measurements of antifouling coatings using an optical profilometer: Effects of additives and solvent concentration and type. Prog. Org. Coat. 2019, 132, 159–168. [Google Scholar] [CrossRef]
  33. Guillaumin, V.; Landolt, D. Effect of dispersion agent on the degradation of a water borne paint on steel studied by scanning acoustic microscopy and impedance. Corros. Sci. 2002, 44, 179–189. [Google Scholar] [CrossRef]
Figure 1. (a) Photograph of the autoclave batch reactor used for HPHT testing (reproduced from [3]). (b) Top-down view inside the test chamber showing four panels mounted vertically inside. (c) Illustration of the three regions inside the test chamber. (d,e) Sample photographs from before and after testing in the HPHT chamber, respectively. Annotations indicate the area of the OCT scan and the interface between the hydrocarbon- and seawater phases (HS interface). (f) SEM image taken at HS interface revealing the presence of micron- and submicron scale iron-oxide particles (white/light gray).
Coatings 11 00877 g001
Figure 2. (a) Reflectance microscope (MS) image of the inspected region. (b) Corresponding surface topography OCT image of a 3 × 3 mm area scan. (cf) Cross-sectional B-scans (3 mm) of the exposed sample taken along the direction of the white arrowheads in (a,b). (gi) OCT images of an unexposed panel for reference. OCT images were processed in the open-source program ImageJ, using the “Gem” color scale indicated by the scale bar to the left of (b).
Coatings 11 00877 g002
Figure 3. Two-dimensional volume projections at different sample depths (ac) and a corresponding B-scan (d) whose position is indicated by the dashed lines. (a) Intensity projection of the surface topography. (b) Maximum intensity projection of the subsurface region, highlighting the cracks. (c) Intensity projection of the substrate layer. The scan area is 3 × 3 mm, and the depth scale is indicated in (d).
Coatings 11 00877 g003
Figure 4. Comparison between 1.3 µm (a,c) and 4.1 µm OCT (b,d) in commercial marine coatings with different pigmentation and additives. The apparent curvature of the substrate is an artifact of the galvo-scanning method. It should also be noted that the scale assumes n = 1 at both wavelengths.
Coatings 11 00877 g004
Figure 5. (a) MS cross-section image of an AF coating sample separated from the substrate by a scalpel blade showing the presence of cuprous-oxide particles. (b) Reflectance MS surface image of the AF and HG coatings, highlighting the difference in surface roughness. (c) MS cross-section image of a two-layer sample of HG on AF, where a large Cu2O particle has migrated to near the surface. (d) MIR OCT cross-section of a pinhole that formed in a two-layer HG coating (e,f) MIR OCT cross-section images of a two-layer HG on an HG-coated sample with a pinhole defect and a single-layer AF-coated sample that has been scribed with a scalpel blade, respectively. (f) MIR OCT cross-sectional image of a two-layer HG on AF-coated sample. The image is a superposition of 20 adjacent line scans to capture more of the larger cuprous-oxide particles and show their distribution.
Coatings 11 00877 g005
Figure 6. (ad) MIR OCT B-scans of the wet AF coating during 260 min curing. (e) Average line-scans over 10 pixels (indicated by the blue dashed line), which shows the gradual reduction in both thickness and substrate signal level. The line scans are aligned by the signal peak from the coating surface (~45 μm). (f) Measured thickness (n = 1) derived from the peak signal position of the surface and substrate as a function of time. (g,h) Surface topography of the sample at t = 0 min and t = 260 min, respectively.
Coatings 11 00877 g006
Figure 7. Proof-of-concept detection of corrosion underneath 369 µm of HG coating (n = 1.8). (a) Photograph of the partially-corroded sample, where the HG was applied at the interface between the corroded and non-corroded region. (b) OCT top-down volume projection, showing a clear distinction between the corroded and non-corroded regions below the coating. Dotted arrows indicate the boundary between the coating and the bare substrate. (c) OCT cross-section of the transition from bare substrate to coated region.
Coatings 11 00877 g007
Publisher’s Note: MDPI stays neutral with regard to jurisdictional claims in published maps and institutional affiliations.

