Article

A Note on the Influence of Smectite Coating on the Coefficient of Restitution of Natural Sand Particles Impacting Granitic Blocks

Department of Architecture and Civil Engineering, City University of Hong Kong, Hong Kong, China
*
Author to whom correspondence should be addressed.
Submission received: 2 June 2021 / Revised: 11 August 2021 / Accepted: 15 August 2021 / Published: 20 August 2021

Abstract

:
The study of the collision behavior of solid objects has received a significant amount of research in various fields such as industrial applications of powders and grains, impacts of proppants and between proppant and rocks during hydraulic fracturing, and the study of debris flows and avalanches and the interactions of landslide materials with protective barriers. This problem has predominantly been studied through the coefficient of restitution (COR), which is computed from the dropping and rebound paths of particles; its value corresponds to 1 for perfectly elastic impacts and 0 for perfectly plastic impacts (i.e., at the collision there is no rebound of the particle). Often, the colliding particles (or particle–block systems) are not perfectly clean, and there is debris (or dust) on their surfaces, forming a coating, which is a highly possible scenario in the debris flows of natural particles and fragments; however, the topic of the influence of natural coatings on the surfaces of particles on the collision behavior of particle–block systems has been largely overlooked. Thus, the present study attempts to provide preliminary results with respect to the influence of natural coating on the surfaces of sand grains in the COR values of grain–block systems using a stiff granitic block as an analogue wall. Montmorillonite powder, which belongs to the smectite clay group, was used and a sample preparation method was standardized to provide a specific amount of clay coating on the surfaces of the sand grains. The results from the study showed a significant influence of the smectite coating in the COR values of the grain–block systems, which was predominantly attributed to the dissipation of energy at the collision moment because of the compression of the soft coating of microparticles. Additionally, the method of analysis for calculating the COR values based on one and two high-speed cameras was explored, as the impacts of natural grains involve deviations from the vertical, which influences the rebound paths. Thus, a sensitivity analysis was performed investigating the differences in the COR values in two-dimensional and three-dimensional analysis of the impact tests.

1. Introduction

The study of the interactions of particles and between particles and blocks is of major interest in geotechnical and petroleum engineering applications, such as the examination of debris flows [1,2], the collision behavior of particles/fragments with protective barriers [3,4,5], or the examination of the contact behavior of proppants and between proppants and rocks in the hydraulic fracturing process [6,7]. Impact problems are also of major interest in industrial processes and pharmaceutical applications [8,9,10]. Previous experimental studies have predominantly examined these interactions by measuring and modeling the frictional behavior of the interacting grains (or grain–block systems) [11,12,13], the damage behavior of proppants [6,7,14], and by examining the influence of sand particle (and rock) type and their morphological features such as surface roughness [15,16] and grain shape [12,13,17]. The study of the interactions of grains and grain–block systems has also been examined analytically and by developing constitutive contact mechanics models [18,19,20]. However, in many applications, the interactions of grain–block systems involve dynamic phenomena, for example, in the case of impacts [21], which result in very complex mechanisms, and they are often examined through the coefficient of restitution (COR).
Analysis of the impact (or collision) behavior of grain–block systems through experimental works [22,23,24] and theoretical studies [25,26,27] has been the topic of a significant amount of research in various disciplines, such as the study of powders and grains in industrial and pharmaceutical applications, or the dynamic interactions of landslide materials with protective barriers. This problem is also of significant interest in petroleum engineering applications, as in the hydraulic fracturing process, it is essential to understand the mechanisms of proppant-proppant and proppant-rock interactions subjected to impacts. It is important that such mechanisms be understood and modeled, as the state-of-the-art literature suggests that there are extraordinarily complex mechanisms involved in the stimulation of hydraulic fracturing [28,29,30]. Despite these efforts, often, the collision of grain–block systems in natural processes involves grains that do not have perfectly “clean” surfaces, often being covered with debris or dust, which is expected to alter their contact behavior and energy dissipation mechanisms, as suggested by recent experimental studies [31,32,33].
Because of the chemical weathering of parent rocks, such as granites and tuffs, which is prevalent in tropical/subtropical climates, geological materials often develop a heavy coating of microparticles on their surfaces due to the transformation of micas and feldspars to clay group minerals [34]. Chemical weathering is commonly accompanied by physical fragmentation of the rocks, increasing the risks of landslides; thus, often, debris flows and other types of landslides involve geological materials that have natural coatings on their surfaces. The study of the formation of natural coatings on the contact behavior of geological materials has been the topic of a significant amount of research in terms of experiments investigating the tribological–frictional behavior of the grains and the role of natural coating [15,35,36,37]. However, less attention has been given to the study of the influence of natural coatings on the collision behavior of granular systems.
Kasyap and Senetakis [38] developed a new coating method for plastic microparticles on the surfaces of natural sand grains and subsequent studies examined the frictional behavior of sand grain-to-grain interactions in the presence of natural coatings with emphasis on friction, contact stiffness and the influence of loading history in the regime of slow loading rates. More recently, Kasyap et al. [32] developed an alternative coating technique of sand grains involving non-plastic silt-sized microparticles, and their study revealed significantly different frictional mechanisms based on the type of coating.
In the literature on impact mechanics, researchers have examined the problem of colliding particles on the surfaces of blocks predominantly through normal impacts, in which case perfect spheres collide on the surfaces of flat blocks, which results in rebound paths that follow the dropping paths without any deviations. In such cases, COR corresponds to the normal coefficient of restitution. Many of the published studies have examined the influence of material type, which in turn affects the energy dissipation, predominantly through plastic deformations of the impacted bodies, even though some studies have also examined factors such as humidity or impacts in the presence of thin fluid film [9,39,40] and surface roughness [41]. In natural systems, however, the grains are often not perfectly spherical, which results in deviations of the rebound paths from the dropping paths (i.e., oblique impacts), in this way altering the method of analysis to calculate COR [26,42,43], while the impacting bodies may have debris on their surfaces, which is expected to influence the dissipation of energy. However, this topic has been majorly overlooked in the state-of-the-art literature.
The present work attempted to examine the coefficient of restitution of impacting natural sand grains on a benchmark granitic block (very stiff and polished block) by coating the grains with clay microparticles. A sample preparation method to coat the sand grains with a highly plastic powder was standardized, based on a previously developed technique by Kasyap and Senetakis [38]. This led to the development of various amounts of coatings on the surfaces of the grains allowing in this way to examine the influence of different amounts of microparticles in the COR values of grain–block systems. Thus, this article contributes to the state-of-the-art literature on impact mechanics, providing for the first time experimental data linking the coefficient of restitution with the amount of coating on the surfaces of natural particles. These particles may be considered as simulants of proppants or debris flow materials, while the natural coating acts as a simulant of debris or coatings due to weathering of the grains. The emphasis in the present study is placed on the preliminary investigation of the impact problem of coated sand grains–granitic block to provide some basic understanding of the role of natural coating.

2. Materials and Coating Process

2.1. Materials

In this study, the collision behavior of grain–block systems was examined experimentally using natural sand grains and a granitic block. The granitic block was a commercially procured polished piece of rock (with dimensions of 150 mm × 150 mm in plan and 75 mm in thickness), and according to previous studies [41,42], it had a surface roughness of 412 ± 35 nm, a Young’s modulus of 86 GPa and a density of 3.00 t/m3. Leighton Buzzard sand (LBS) quartz grains of 2.36–5.00 mm fraction was used in the study and the grains were coated with montmorillonite powder at different concentrations. LBS is a natural material with particles yellowish to brown in color, which have sub-rounded to rounded shape, surface roughness of 223 ± 61 nm and Young’s modulus of 52 ± 12 GPa (after [15,44]). As the direct calculation of the influence of the morphology of the LBS grains is extremely complicated during the impact process (i.e., precise analysis of the local morphology in the vicinity of the grain–block contact at the moment of impact), grains with high sphericity (≥0.9) and roundness (≥0.8) were carefully selected for the experiments. In this case, sphericity and roundness were quantified on the basis of the Krumbein and Sloss [45] empirical chart, and the grains were carefully observed through an optical microscope for selection. The montmorillonite powder (smectite group of clay minerals) was commercially procured, and according to consistency limits tests, it had a liquid limit of 109%, a plastic limit of 52% and a plasticity index of 57% (after [46]).
Typical energy-dispersive X-ray spectroscopy (EDS) test results for the smectite and LBS particles are given in Figure 1, while the inset in Figure 1a shows a close view image taken from scanning electron microscope (SEM) of the montmorillonite. Similar to the analysis by Kasyap and Senetakis [38], pure LBS consists, predominantly, of Oxygen (O) and Silicon (Si) as the dominant elements, with traces of other constituents in small amounts such as potassium (K), while, as a clay-group mineral, montmorillonite has very similar amounts of Aluminium (Al) and Silicon (Si), thus the coating process of the LBS grains with the clay powder is expected to significantly increase the concentration of Al.

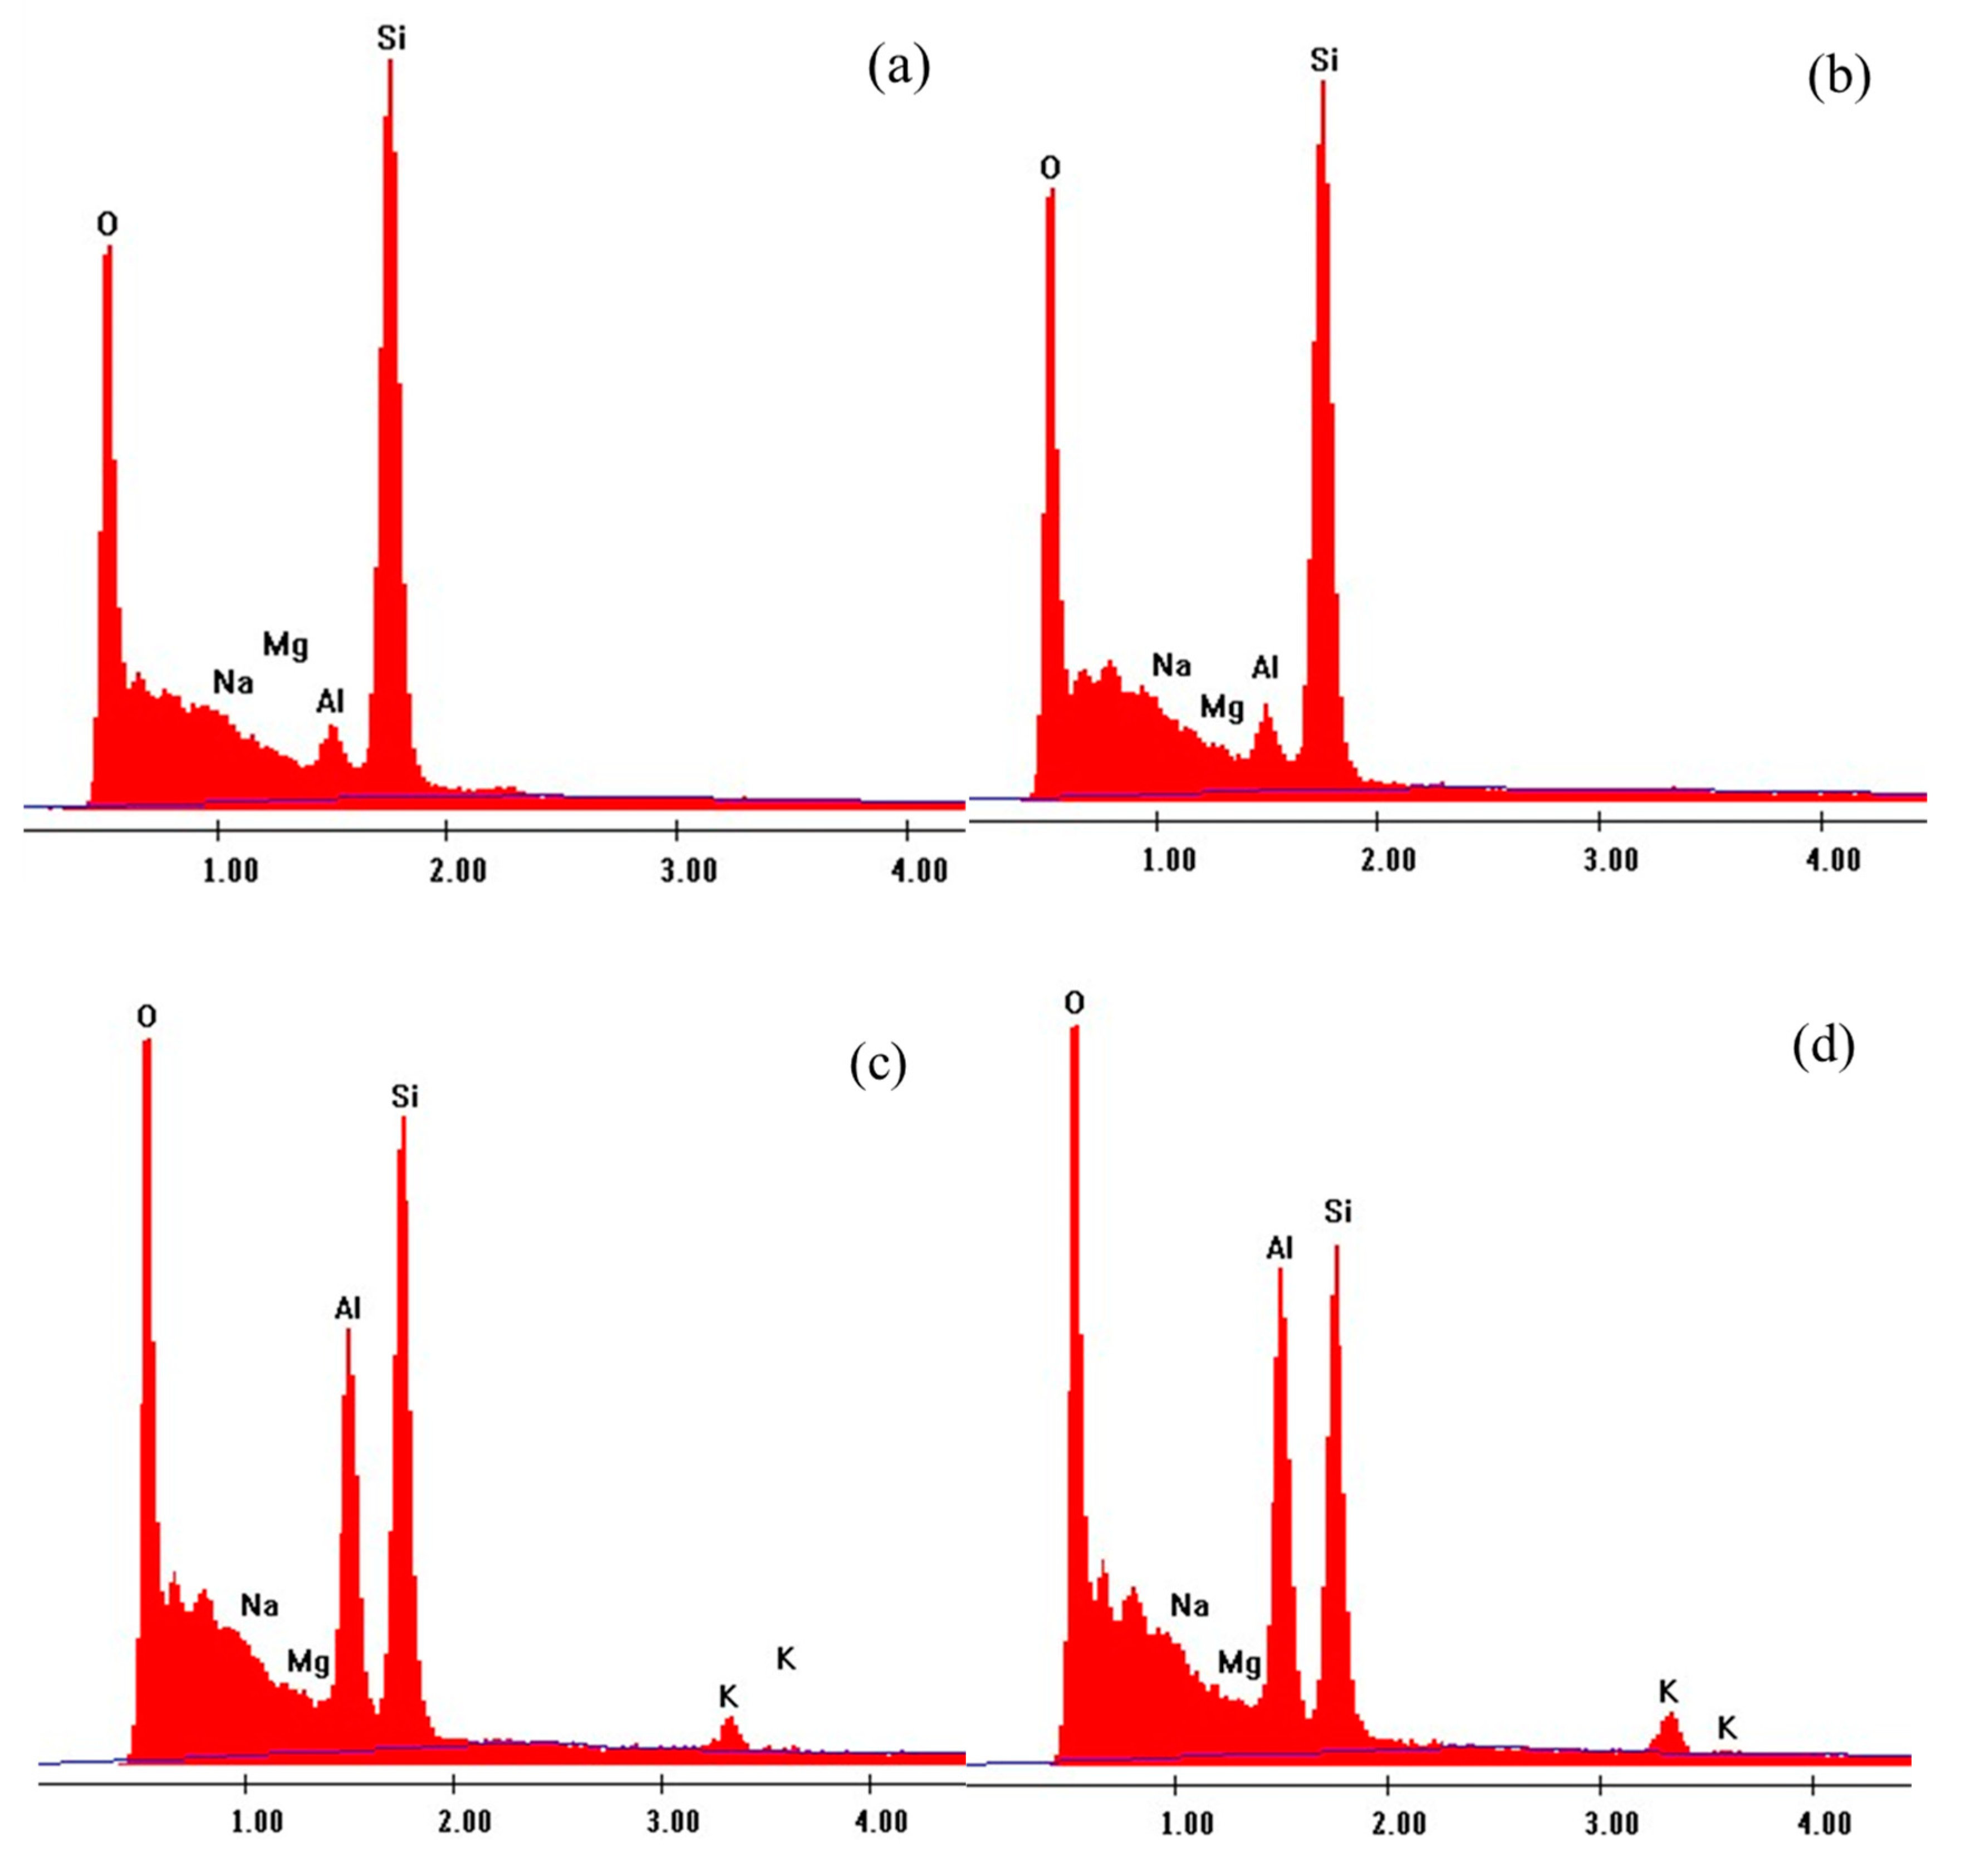
2.2. Coating Procedure and Coating Analysis

The coating method used in the study was originally developed by Kasyap and Senetakis [38] for kaolinite-coated LBS grains (kaolinite is a clay-group mineral of lower plasticity compared with the smectite group). Five different concentrations (50, 100, 150, 200 and 300 mg/mL) of montmorillonite using water as the solvent were used; these different concentrations are expected to result in different amounts of clay microparticles coating developed on the surfaces of the LBS grains. An orbital shaker was used to shake the solution at a constant RPM (=300 in the present study) and the LBS grains were dropped into the solution (at a given concentration) for a total time of 500 s, while the solution was subjected to constant shaking. After the process was completed, the coated grains were oven-dried, and EDS analysis was performed for each different class of coated LBS grains to assess the repeatability of the developed coating by means of Al percentage.
Representative optical and SEM images of the coated grains are given in Figure 2.
Figure 2a–c show images of a coated LBS grain at 150 mg/mL concentration (Figure 2a shows an image of the coated grain as a whole, while Figure 2b,c show SEM images of the same grain at different magnifications). Figure 2d shows an optical image of a coated grain at 300 mg/mL concentration. A comparison between Figure 2a,d shows that the preparation of the samples at a higher concentration resulted in a heavier final coating of microparticles on the surfaces of the LBS grains. Figure 2e,f show SEM images of a coated grain at 100 mg/mL and an uncoated grain, respectively. Contrary to the observed textures on kaolinite-coated LBS grains as reported by Kasyap and Senetakis [38], which were very uniform with even distribution of the kaolinite microparticles, the smectite-coated LBS grains generally had heterogeneous coatings, which may have been affected by the development of lumps between the smectite nanoparticles. Even though it would be ideal to have a more homogeneous coating (which was not technically feasible for the smectite-group mineral), it has been observed that many natural materials generally have high heterogeneities and textures that are influenced by the presence of uneven natural coatings (e.g., [36,47]).
Quantification of the elements of the coated grains was performed based on EDS analysis in order to determine the relationship between concentration during the mixing process and Al percentage, and representative results from this analysis are displayed in Figure 3. This can be particularly useful for the characterization of the grains, as the quantification of the coating thickness would be technically difficult, and potentially not very useful for particles that have uneven natural coatings.
For each type of coated grain (i.e., 50, 100, 150, 200 and 300 mg/mL concentrations of montmorillonite–water solution), around 10 grains were selected to carry out the EDS analysis, and the results from this analysis in the form of bar graphs are given in Figure 4, showing a significant increase in Al content for increasing concentration (note that the bar graphs indicate mean values and the standard deviation values are also displayed in the figure). In the impact tests of grain–block systems using coated grains, the following concentrations were used in the present study: 0% (uncoated LBS), 50, 100, 150 mg/mL; thus, four different classes of grains were examined in the collision experiments.

3. Experimental Setup and Testing Program

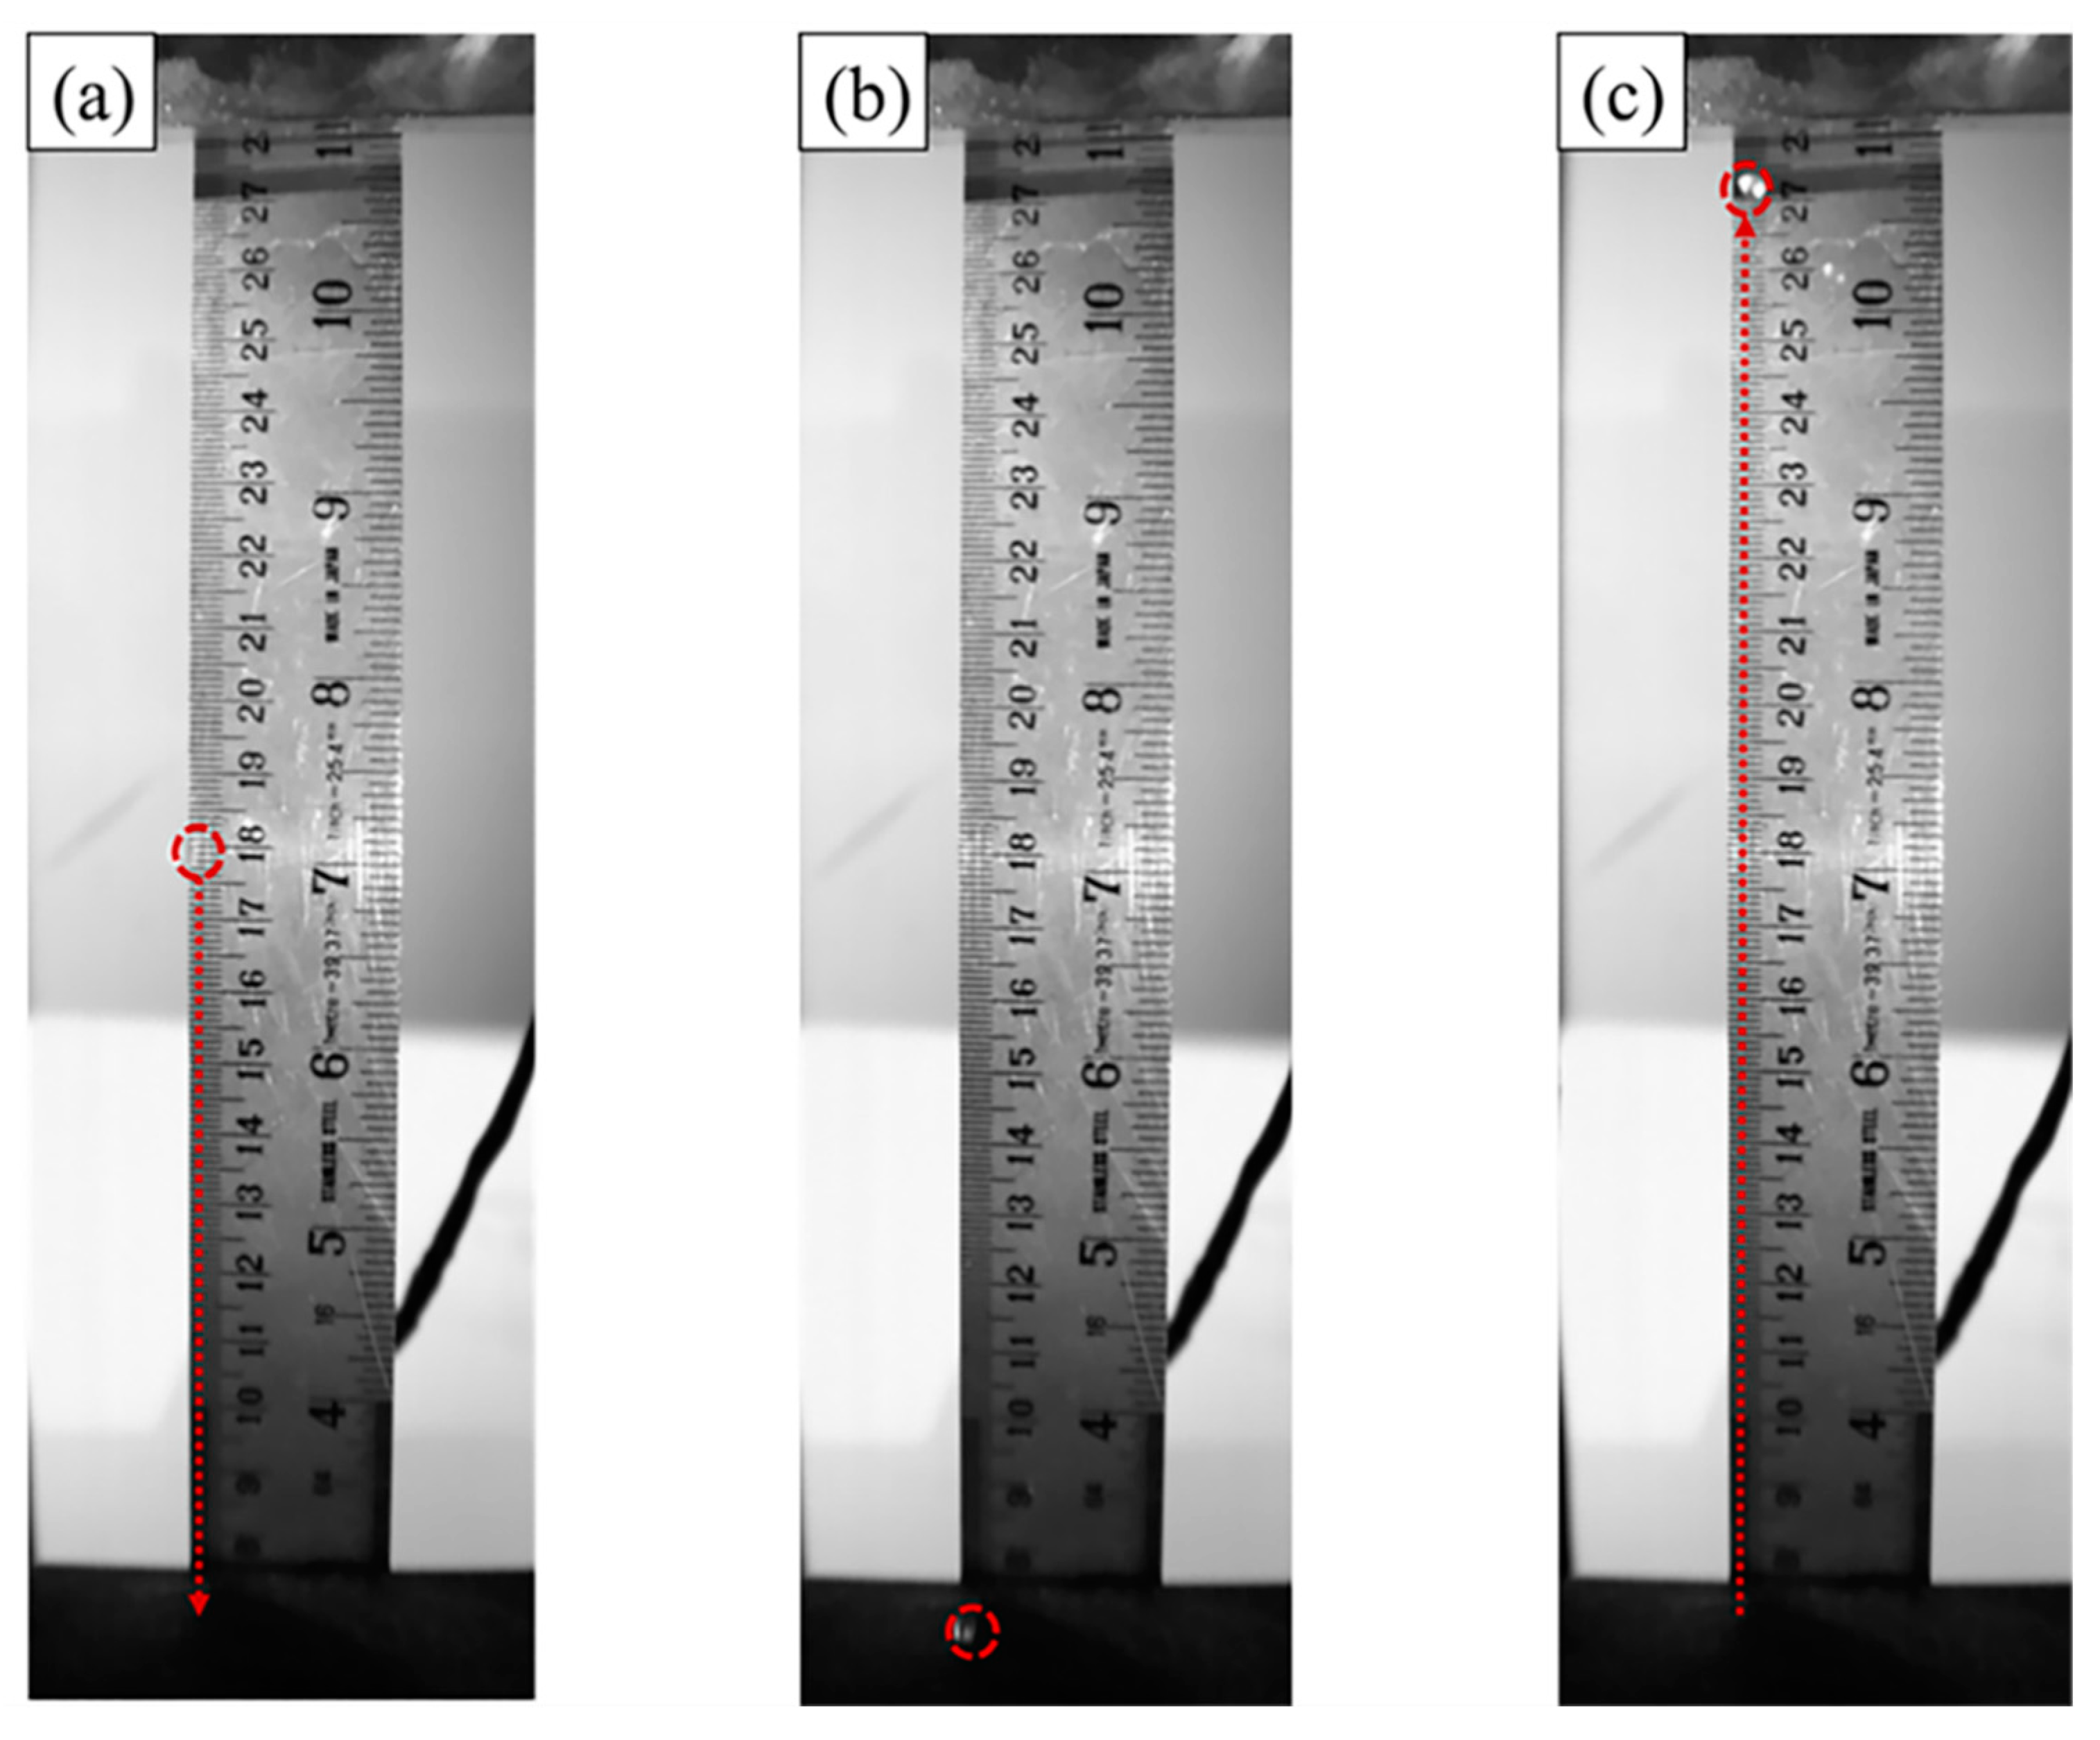
3.1. Experimental Setup

A custom-built apparatus developed at City University of Hong Kong was used to carry out the impact tests, which follow the grain–block configuration (after [41,42]). Figure 5 shows an image of the experimental setup and a close view of the particle holding system. The apparatus consists of a cantilever pole in which the particle holding system is fixed (at the desired height), two high-speed cameras, focused LED lights and the base plate (or block). The cantilever pole is used to adjust the initial drop height (maximum drop height: 500 mm), which controls the impact velocity during the collision of the particle on the stationary block. The electrically operated plunger–solenoid system has two plungers that can hold particles with a diameter, typically between 0.5 and 20 mm. The two plungers, which are controlled by an external switch, can move towards and away from each other, respectively, to hold and release the particle (maximum holding force: 13 N).
To the avoid initial spin of the particle during its release, electro-magnetic energy is generated to pull both the plungers backward into the solenoids synchronously to release the particle when it is turned on the external switch. Representative images taken using a high-speed camera during an impact test at its various stages (during the dropping of the grain, the moment of impact and during the rebound of the grain reaching its maximum height) are given in Figure 6. Similar to the studies by [41,42], all the impact tests were performed inside a Perspex chamber to minimize potential air drag forces, even though the impact of these influences on the computed COR values would be expected to be very small [23,48].
For perfectly spherical engineered grains such as chrome steel balls and glass beads, previous studies have shown the high repeatability of the test results in terms of coefficient of restitution (COR) and that the rebound heights are in general perfectly vertical. This is also illustrated in Figure 6, in which a spherical glass bead impacts on a granitic base block (plane block), and the rebound path coincides with that of the dropping path, as the images in Figure 6a,c show. In this case, impact tests of perfectly spherical grains colliding on plane blocks can be monitored/analyzed using one high-speed camera. However, because of their irregular shapes, the rebound paths for natural particles such as LBS often deviate slightly from the initial drop path, which means that the impact is oblique. For this reason, two high-speed cameras were placed orthogonally to each other in the horizontal plane to record the impact process in three dimensions, which is particularly important for natural sand grains [42]. Thus, the resultant change of particle position in both the horizontal and vertical directions was monitored to estimate the rebound height of the natural particle after its impact on the base block. The method of analysis for three-dimensional impacts (i.e., the rebound height does not coincide with the drop height) is further elaborated in Section 4.1.

3.2. Testing Program

As discussed in Section 2.2, the impact tests of grain–block systems were performed using four different types of grains (uncoated LBS and three classes of coated grains). All the experiments in the present study were performed at an initial drop height of 300 mm, which corresponds to an impact velocity of 2.42 m/s. Please note that this velocity was decided for compatibility with previous experimental studies, e.g., [41,42]. In particular, for natural sand grains, Sandeep et al. [42] did not observe significant changes of the COR for a range of different velocities (from 1.74 to 2.43 m/s) with a change of less than 10% in the COR values for impacts of LBS grains on granitic base block. However, it would be worth, in future studies, enhancing the analysis of the collision behavior of coated sand particles in a wider range of velocities. The temperature around the apparatus was maintained at around 24 ± 0.5 °C during the experiments. As a deviation in the rebound path is often observed for natural particles, around 130 tests were carried out for each combination to assure the repeatability of the test results and provide some meaningful statistical analysis. This is particularly important in the present study, as the coated grains generally had an uneven coating of microparticles on their surfaces, whereas for the uncoated LBS grains, despite the deviations from the initial drop height, the grains were fairly regular with relatively homogeneous textures, and typically a set of 30 tests (for a given impact velocity and block type) could be considered to be adequate for further statistical analysis (after Sandeep et al. [42]). Even though a smaller number of tests for each coating class could also be adequate (e.g., between 30 and 60 particles), the authors intuitively decided to conduct a larger number of tests in the present study to better understand the role of coatings on the impact behavior of the grain–block systems. Thus, in the present study, a total of 520 impact tests were carried out using 4 types of grains with different coating amounts colliding on the granitic block at a velocity of 2.42 m/s.

4. Results and Discussion

4.1. Coefficient of Restitution

For impacts in grain–block systems, the translational kinetic energy can be applied to describe the energy loss from the collision to calculate the coefficient of restitution. The coefficient of restitution (COR) in grain–block systems (the base block is stationary throughout the impact process while the grain is in translation) is calculated from Equation (1).
C O R = V o u t V i n
In Equation (1), Vin and Vout represent the impact and rebound velocities of the grain, respectively. For the direct impact, Vin and Vout are back-calculated from the respective heights, which are recorded by the high-speed cameras. Thus, the impact and rebound velocities and the corresponding COR can be calculated as shown in Equation (2).
C O R = 2 g h R 2 g h I = h R h I
For natural sand grains, such as the LBS used in this research, the rebound path would deviate from the vertical dropping trajectory due to morphological variabilities of the particles. Therefore, the velocity of the grains should be determined from the velocity components in the three directions (x, y, z), as Equation (3) shows.
v = v x 2 + v y 2 + v z 2
Subsequently, the coefficient of restitution, or the ratio of the differences in kinetic energy before and after impact, is calculated from Equation (4).
C O R = v x 2 + v y 2 + v z 2   ( o u t g o i n g ) v x 2 + v y 2 + v z 2   ( i n c o m i n g )
where “outgoing” refers to the velocities at rebound (after impact) and “incoming” refers to the velocities the moment of impact.
Therefore, for the natural particles, the rebound height can be considered to be the resultant distance (after [43]) calculated from the vertical and horizontal deviations of the particle away from the impact location. The rebound height obtained from one high-speed camera, as shown in Figure 7a (i.e., two-dimensional analysis), is calculated from Equation (5).
h r 2 D = ( L ) 2 + ( h ) 2
where hr2D is the rebound height (inclined due to oblique impact corresponding to the hypotenuse), and L and h correspond to the horizontal and vertical distances of the particle defined at the maximum point during the rebound (note that the definition of hR, L and h is given through the schematic illustrations in Figure 7).
The rebound height obtained (hr3D) from the two orthogonally positioned high-speed cameras, as shown in Figure 7b (i.e., three-dimensional analysis), is calculated from Equation (6).
h r 3 D = ( L 1 ) 2 + ( L 2 ) 2 + ( h ) 2
where L1 and L2 correspond to the horizontal movement of the particle after impact and similar to the descriptions in the two-dimensional analysis, h corresponds to the vertical distance during the rebound of the particle.

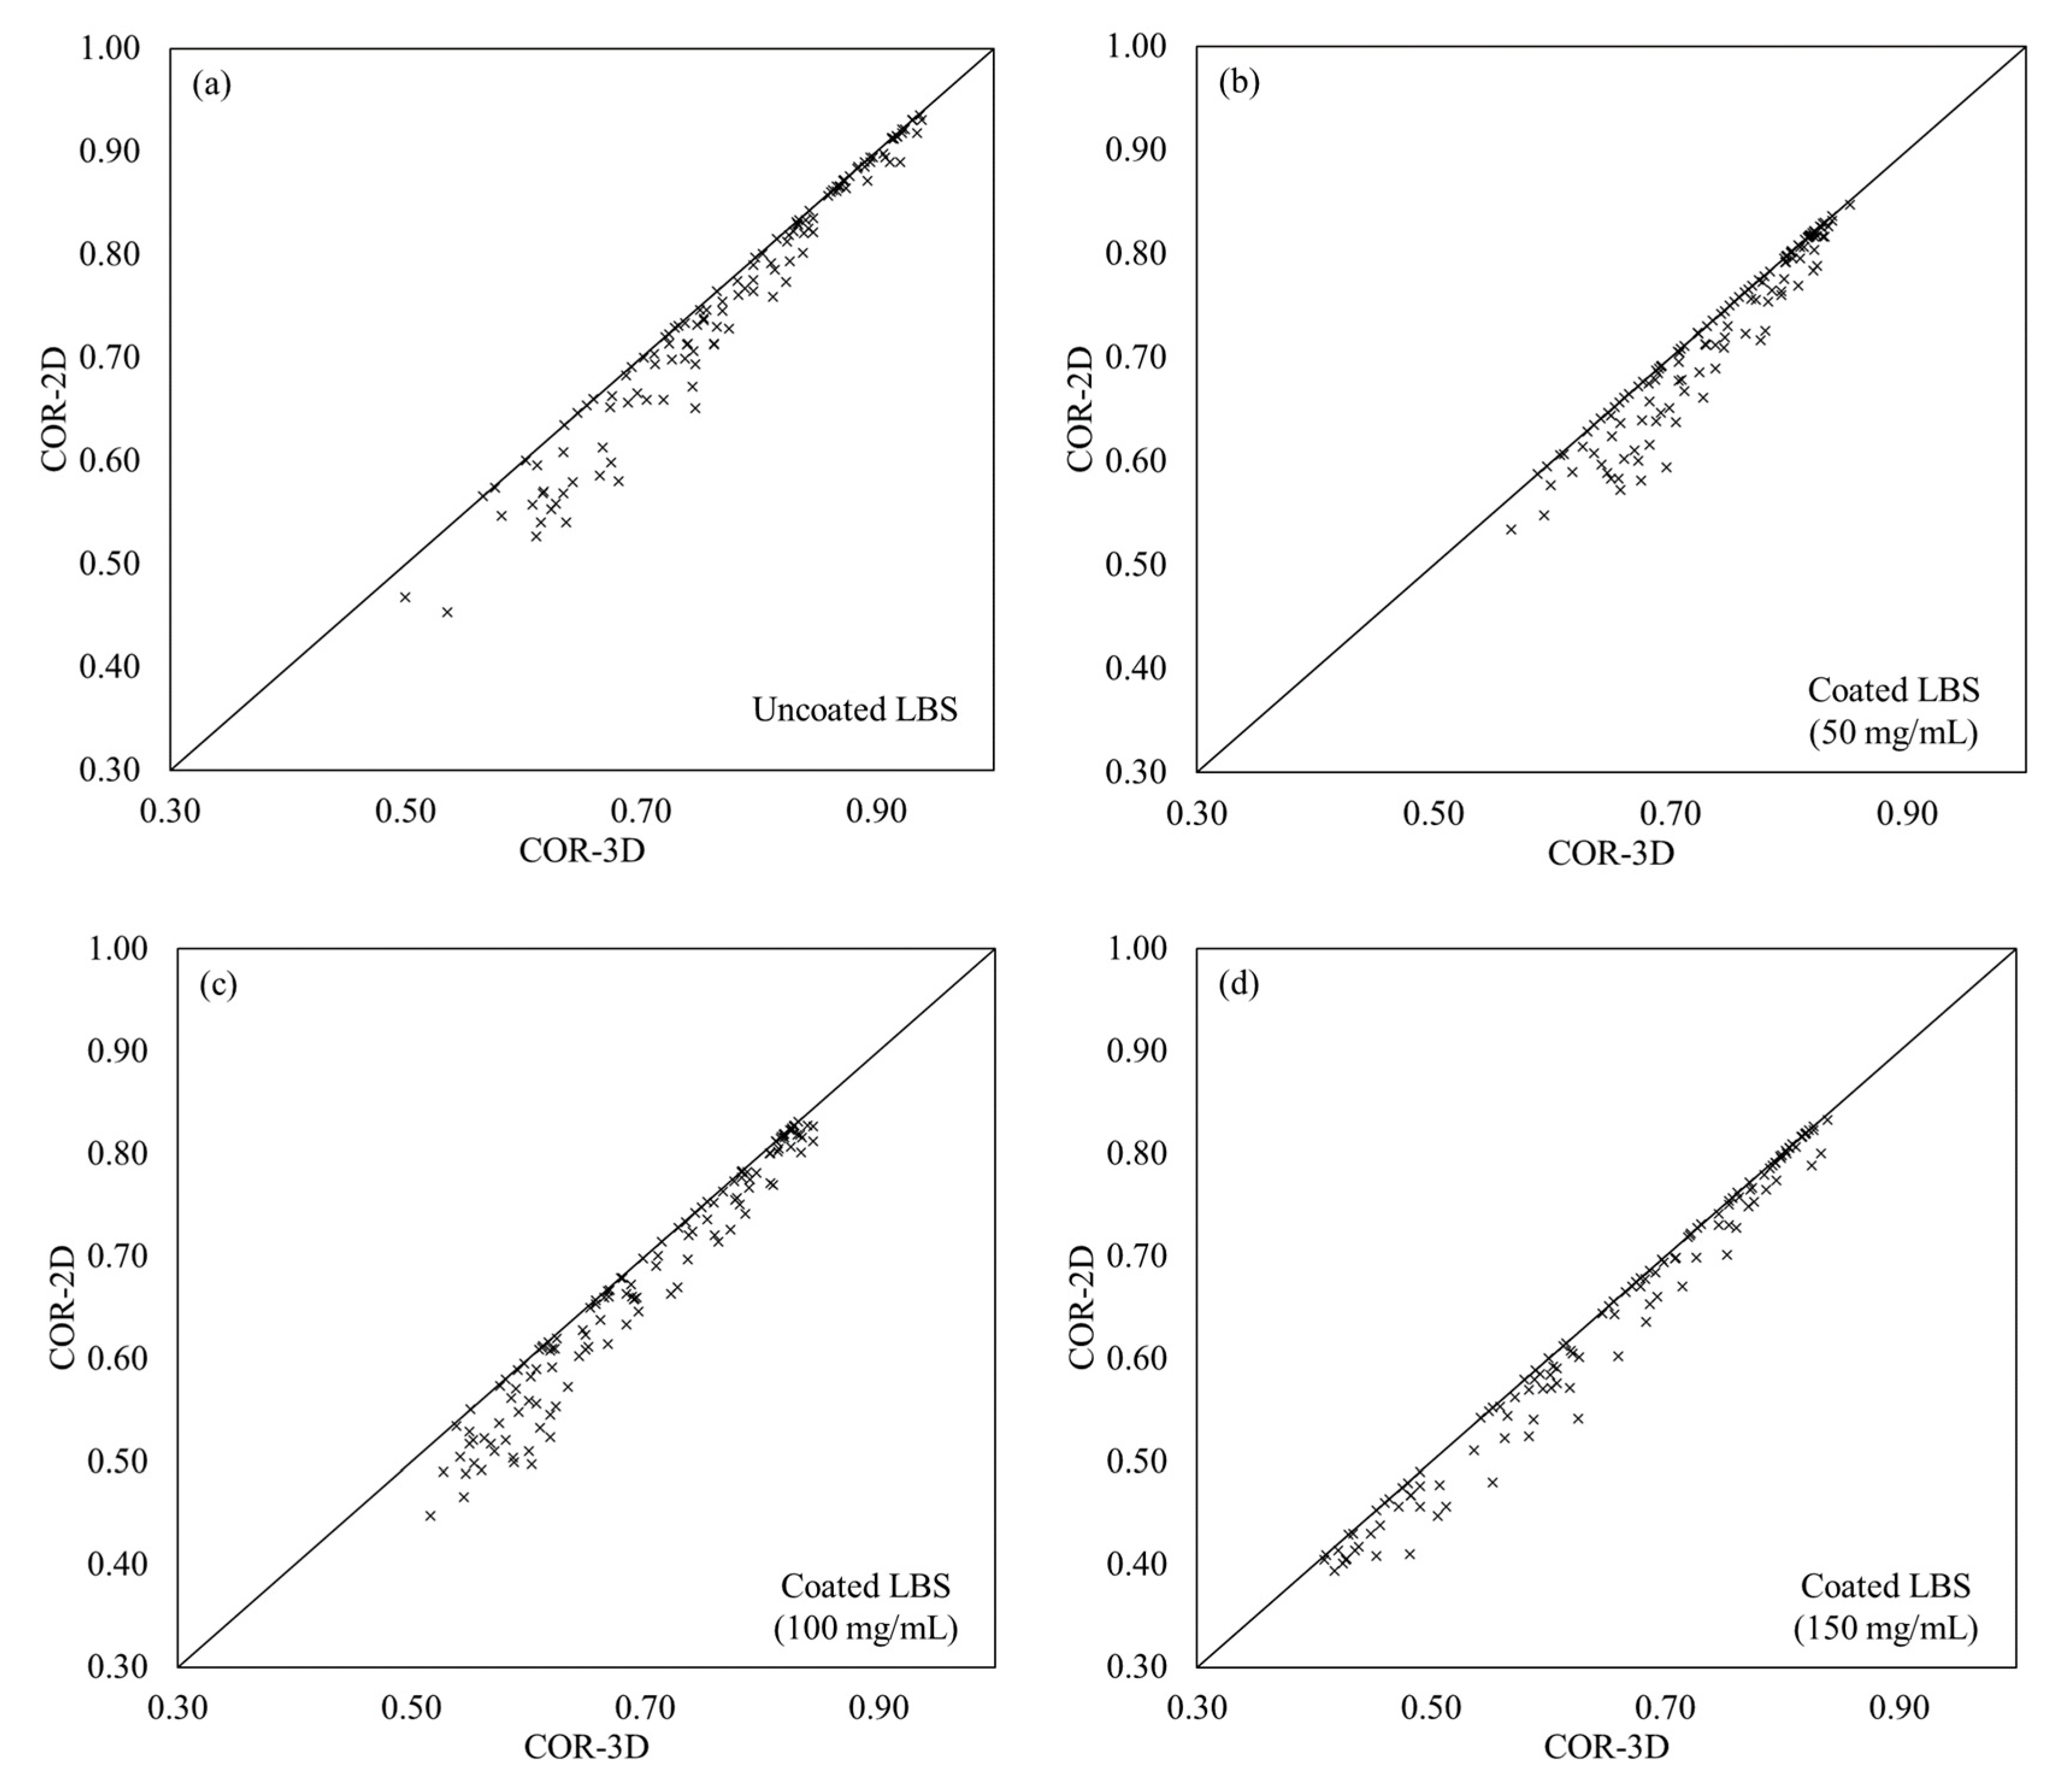
4.2. Range of COR Values and Comparison between 2D and 3D Analysis

The total set of data in terms of COR values for the four different grain–block combinations are given in Figure 8 comparing the results based on two-dimensional (2D), i.e., use of one camera, and three-dimensional (3D), i.e., analyses with the use of two cameras. These results suggest that for both uncoated and coated LBS particles impacting on granite, there is a significant scatter in the data; for uncoated LBS, the minimum and maximum COR values were equal to 0.50 and 0.94, and a similar span of minimum and maximum values was observed for the coated grains (0.57–0.85 for 50 mg/mL, 0.52–0.84 for 100 mg/mL, 0.41–0.84 for 150 mg/mL). The data in Figure 8 also suggest that the analysis using two high-speed cameras provides slightly higher values of COR compared with the use of one camera. This is because of the different estimation of the “deviating angle”, which expresses the deviation from the vertical axis (i.e., equals 0 degrees for perfectly vertical rebound and 90 degrees if the grain, after impact, moves horizontally without any rebound). In general, as previous studies would also suggest, the deviating angle for engineered grains with a perfectly spherical shape such as glass beads would be 0 degrees (referring to impacts on smooth and plane surfaces) [41,42].
The values of the deviating angles in three-dimensional (3D) and two-dimensional (2D) analyses are summarized in Table 1 for each type of grain (as mean value ± one standard deviation for each group). A clear conclusion on the influence of coating (based on the clay concentration during sample preparation) on the deviating angle could not be drawn based on these results; however, it can be seen that for uncoated LBS and the heavy coating (150 mg/mL), the deviating angles were generally slightly lower, although these differences might be within the scatter of the data. It is also noticed that these results corresponded to a given type of coating, a given type of natural sand particles (in terms of morphology and composition) and base block, and also a constant velocity. This type of analysis and assessment of the influence of coating type on the collision behavior of grain–block systems would be worth further investigation applying a wider range of velocities, types of coatings and perhaps types of natural sand grains and base blocks as, for example, the base block material itself can alter the mechanisms at collision, and thus could also be expected to have an influence on the deviating angles.

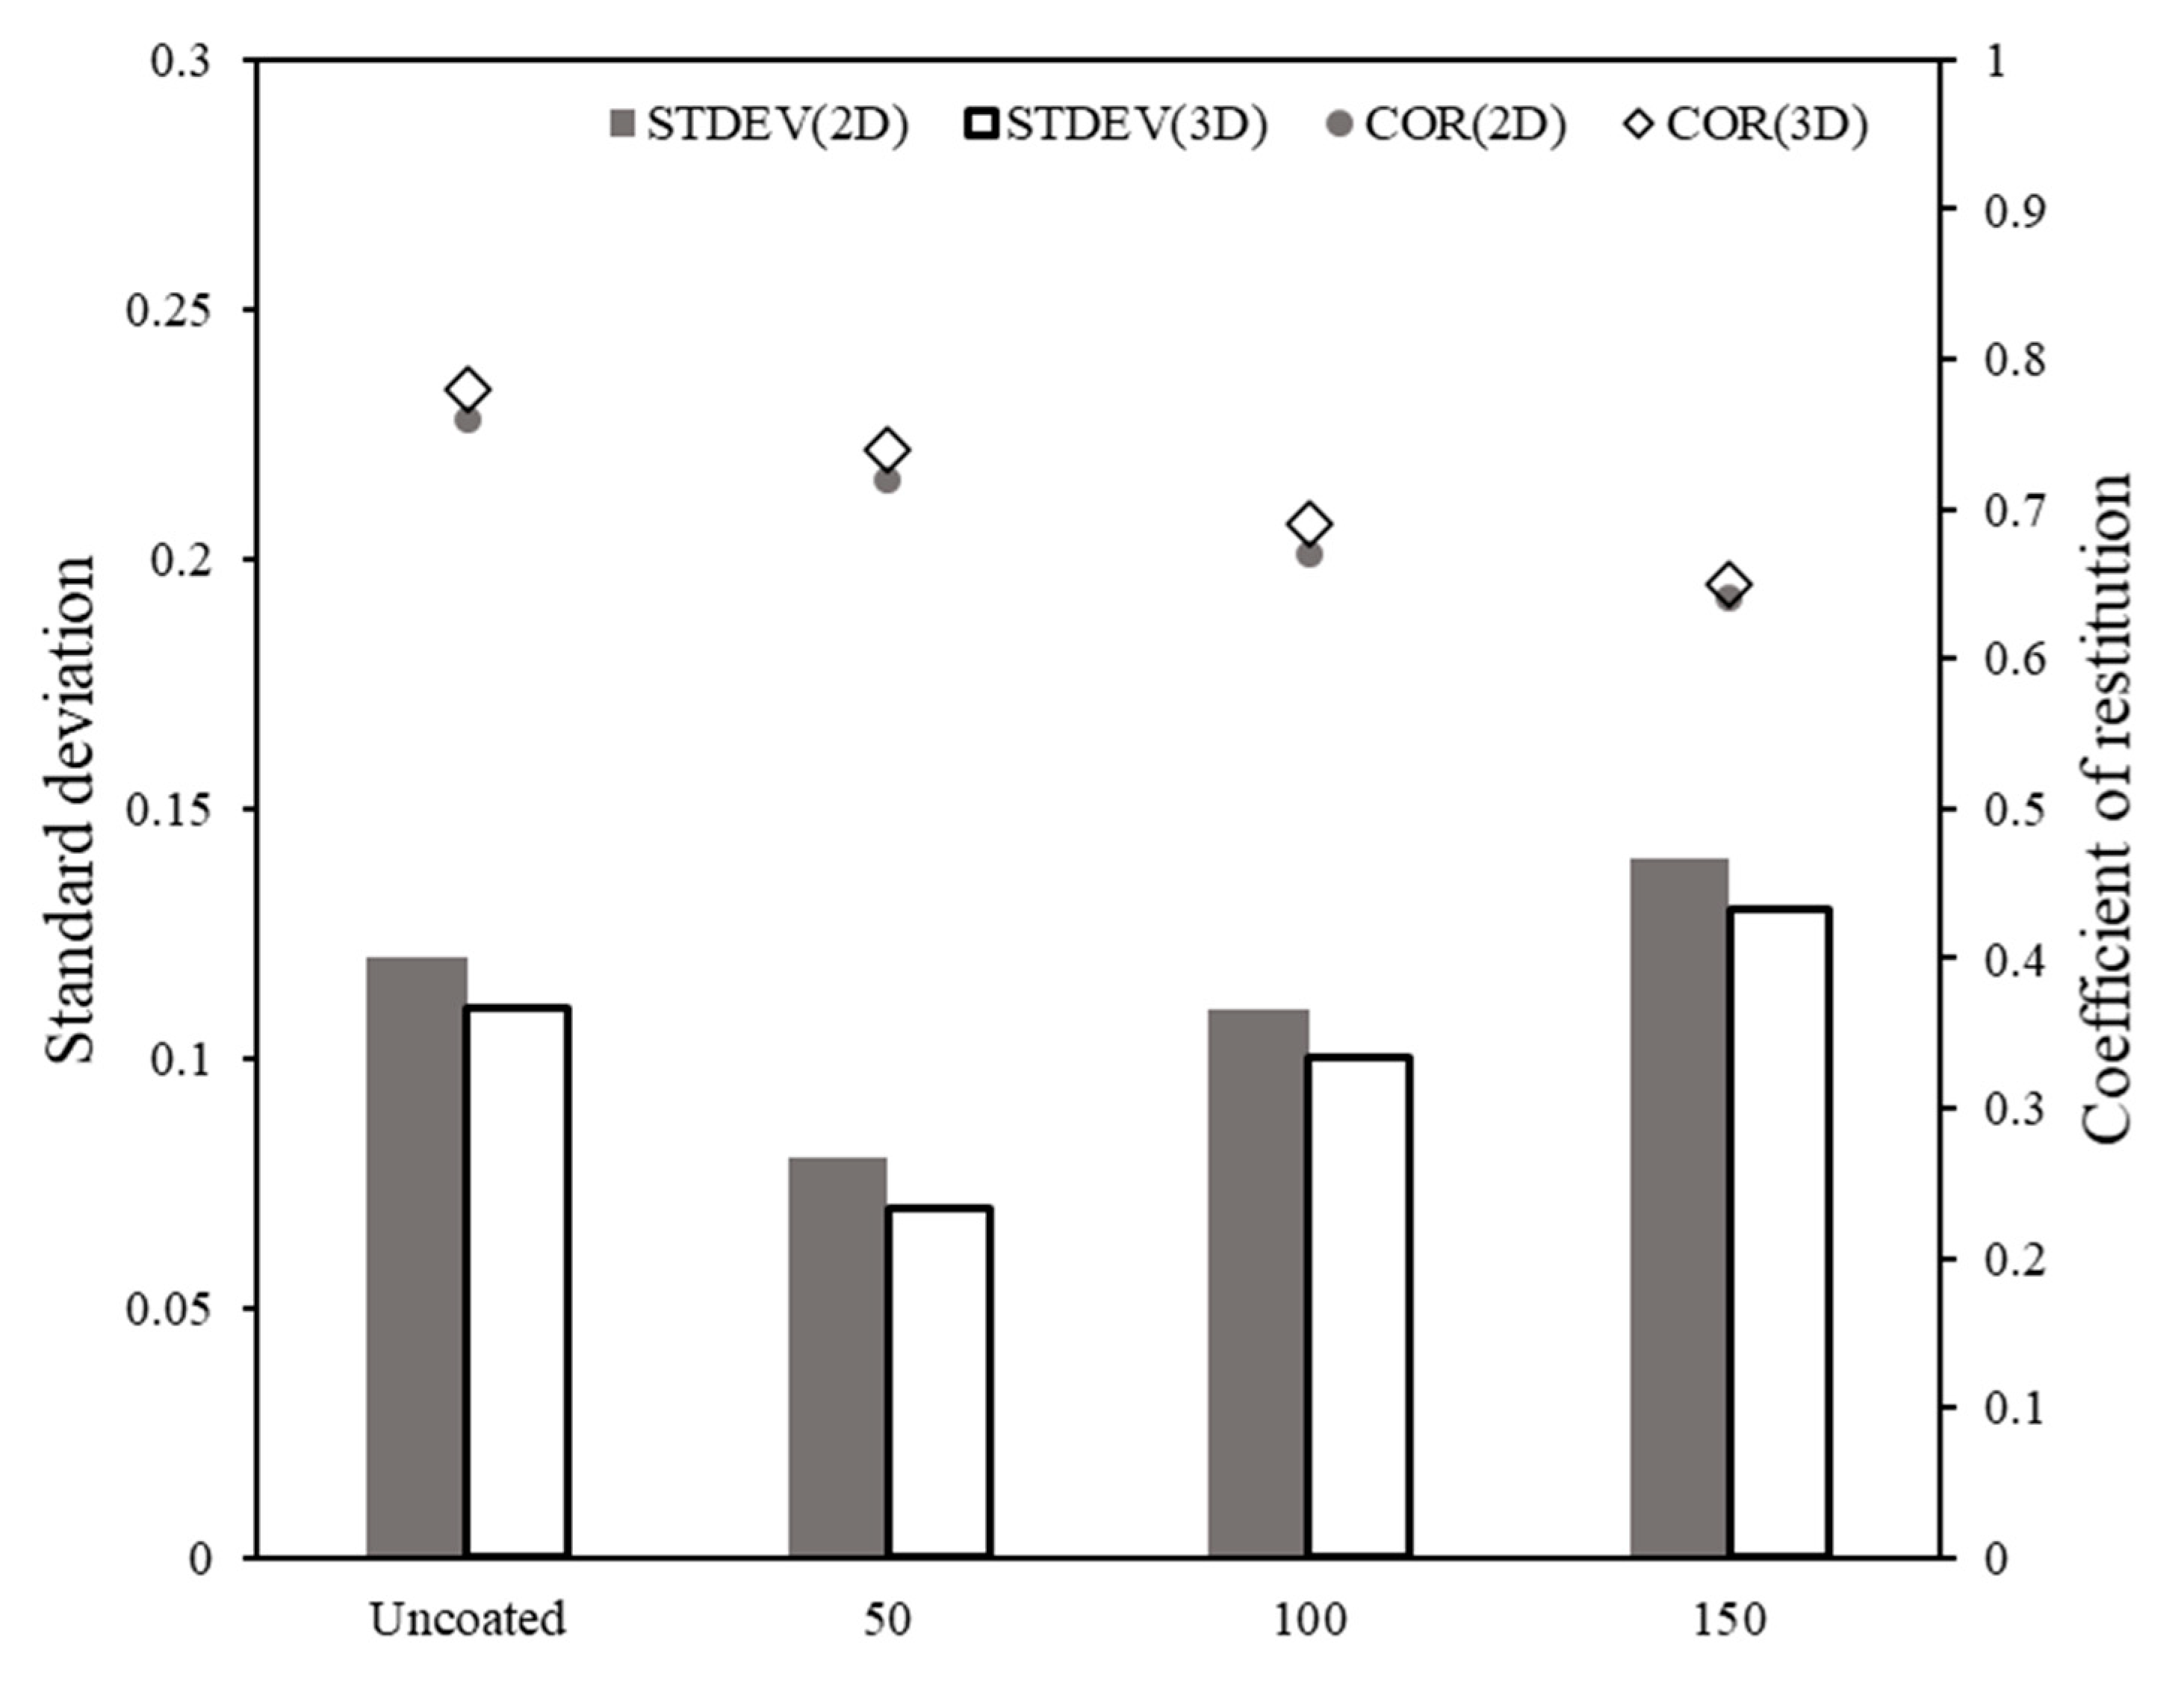
4.3. Influence of Coating on COR Values

The average and standard deviation values of COR for the four groups of grain–block systems are presented in Figure 9 and Table 1, and plots of the cumulative distribution function (CDF) against COR for the four groups are presented in Figure 10. For uncoated LBS, COR (as mean value ± one standard deviation) was found to be equal to 0.78 ± 0.11 for the total set of 130 impact tests based on 3D analysis of oblique impacts. These values are in agreement with the results by Sandeep et al. [42] on LBS-granitic block, in which case average values from 0.75 to 0.82 were reported for impact velocities from 1.74 m/s to 2.43 m/s. These COR values are significantly lower (in terms of average values) than the results reported in the literature on chrome steel ball (CSB) and glass beads (GB) impacting on granitic block. Specifically, Sandeep et al. [42] reported COR values in the range of 0.92–0.95 for CSB and 0.89–0.92 for GB based on collision tests in a range of impact velocities from 1.74 m/s to 2.43 m/s.
As the granitic block is very stiff, the lower COR values for the natural grains can be attributed to three major influencing factors (considering also the findings by Sandeep et al. [41]): (i) Part of the energy at impact is transformed into rotational energy because of the irregular shape of the LBS grains, whereas for perfectly spherical GB and CSB the rebound of the grains involves, predominantly, translational energy. (ii) The deviation of the rebound path compared to the dropping path, because of oblique collisions also influences the COR values. (iii) There is some contribution of the surface roughness in the dissipation of energy at the collision moment, perhaps through a combination of plastic deformations with additional brittle-type failure of asperities, as also the recent study by Sandeep et al. [16] would suggest. It is noted that the COR values of the LBS–granite system were found to be equal to 0.76 ± 0.12 for 2D analysis, which is generally very close to the values based on 3D analysis and that the LBS grains and the granitic block are brittle or brittle-to-ductile materials (in which materials some brittle damage of asperities may be more prevalent compared with ductile materials such as steel or aluminum).
The results in Figure 9 and Figure 10 and Table 1 would also suggest a continuous reduction in the COR values as the coating amount increases, with a slight drop of the order of 5% (in terms of mean value) from the uncoated to the lighter coating (50 mg/mL concentration), to a more prevalent drop of the order of 17% for the heavier coating (150 mg/mL concentration). The coefficient of variation, defined as the ratio of the standard deviation divided by the mean value, was found to be equal to 14%, 9.5%, 14.5% and 20% for uncoated grains and 50, 100 and 150 mg/mL concentrations, respectively, values that are in agreement with the results on natural grains impacting on granite reported by Sandeep et al. [42]. The significant drop in the COR as the clay coating increases is majorly attributed to the dissipation of energy because of the presence of the siliciclastic (soft) coating on the surfaces of the LBS grains, rather than the influence of coating on the deviating angles (note that the deviating angles between uncoated LBS and the heaviest coated grains were very similar). It is also possible (as is true for both uncoated and coated grains) that energy might also be dissipated through heat (thermal energy dissipation); however, as the present experiments involved direct impacts, energy dissipation due to friction (resulting in heat) would be expected to be very small. Indeed, the morphology of the particles (for both uncoated and coated grains) and the plastic response of the coating (for coated grains) would be considered to be two of the prevalent factors in the present experiments. Thus, the influence of the coating on the collision behavior of the grain–block systems can be largely considered to be a “mechanical influence”.
The energy loss during impact (denoted as ΔD) was computed on the basis of Equation (7).
Δ D ( % ) = 100 ( 1 C O R 2 )
Figure 11 shows the energy loss (based on the mean COR value of each combination) of the coated grains impacting on the granitic block in the form of bar graphs, as well as previously published data by Sandeep et al. [42] on different grain and block combinations. ΔD increased, approximately, from 39% for the uncoated grains to 45%, 52% and 58% for the 50, 100 and 150 mg/mL coated grains, respectively. Impacts of glass beads (GB) and chrome steel balls (CSB) on granitic block would result in very small amounts of energy loss of the order of 12% and 19%, respectively, while impacts of GB and CSB on stainless-steel blocks would result in energy loss of the order of 48% and 72%.
For engineered grains impacting stainless-steel block, significant energy loss (and correspondingly lower values of COR) was observed compared with impacts on granite. Based on Sandeep et al. [42], the stainless-steel block has relatively similar roughness to that of the granitic block (310 ± 54 nm for stainless steel, 412 ± 35 nm for granite); however, the stainless-steel block has a much greater Young’s modulus (200 GPa) than the granitic block (86 GPa). Especially for impacts of CSB (very smooth surfaces) on stainless steel, a significant amount of the kinetic energy is dissipated through plastic deformations, whereas for impacts on granite (which is a brittle to brittle-ductile material), part of the energy is expected to be dissipated through asperity breakage, thus partly preventing energy losses due to plastic deformation in the vicinity of the contact between grain and block during impact. In the case of the coated LBS grains, energy losses are partly similar to that of uncoated LBS (contributed by the non-perfectly spherical shape of the grains); however, plastic deformation of the soft coating of microparticles also contributes to the dissipation of energy. In future studies, the relative roles of coating and surface roughness of natural grains impacting on different types of base blocks could be one promising direction to be explored, providing in this way some additional insights into the prevalent mechanisms in grain–block impacts. Additionally, as the present study examined the sensitivity in the measured COR values based on 2D and 3D analysis but with simple concepts, future works could provide (in a parametric study involving a greater number of factors such as coating type, grain type, block type, impact velocity), a global sensitivity analysis, following the general principles as presented by [49,50].

5. Conclusions

A sample preparation method for coating natural sand grains (LBS) with microparticles of montmorillonite, which belongs to the smectite group of clay minerals, was standardized, and accordingly, impacts tests were performed investigating the coefficient of restitution (COR) of grain–block systems using four classes of grains: uncoated LBS, and coated LBS with different concentrations equal to 50, 100 and 150 mg/mL (concentration refers to the clay content in the water solution into which the sand particles were dropped for the coating to be achieved). By increasing the concentration, different amounts of coatings could be achieved, which was quantified based on the increase in Al elements. Granitic block was used as the base block and a benchmark impact velocity of 2.42 m/s was adopted in all the tests, which involved 130 experiments for each class of grains. The following major conclusions were drawn from the present study:
(1) Significant scatter in the data (in terms of COR values) was observed for the uncoated and coated natural sand grains, compared with respective results published in the literature on perfectly spherical grains (for example, chrome steel balls and glass beads), which was attributed to the relatively irregular shape of the grains influencing the deviating angles (i.e., the angle of the rebound path with respect to the vertical). For perfectly spherical grains, deviating angles were generally equal to zero, resulting in normal impacts, whereas in the present study, the natural grains had deviating angles between about 23 and 30 degrees (as average values for each class of grains), resulting in oblique impacts.
(2) Based on the analysis of the tests with two high-speed cameras (three-dimensional analysis), the mean COR values significantly reduced from the uncoated grains (COR = 0.78) to the coated grains and despite the scatter in the data, the trend was very consistent with heavier coating resulting in lower COR values of 0.74, 0.69 and 0.65 for 50, 100 and 150 mg/mL concentrations, respectively. The standard deviation values (as absolute values) ranged from 0.07 to 0.13; however, a clear influence of the coating amount in the standard deviation values (or the coefficient of variation) could not be concluded.
(3) In general, analysis with one high-speed camera (two-dimensional analysis) resulted in slightly lower values of COR for all the classes of grains, which was attributed to the differences in the resultant deviating angles between 2D and 3D analyses. However, the differences in the COR values between 2D and 3D analyses were only of the order of 1.5% to 3.0%.
(4) The reduced COR values with increasing coating amount were attributed predominantly to the dissipation of energy (as also observed through the energy loss quantification) because of plastic deformations of the soft coating of montmorillonite microparticles. The mechanisms involved might be very different from those of engineered perfectly spherical grains, and it is believed that future research should further explore the different contributing impact mechanisms of natural sand grains, for example, by examining, apart from the influence of coating amount, the role of coating type, the surface roughness of grains and base block, as well as the effect of block type as the present study focused only on granitic block.

Author Contributions

Conceptualization, L.L., J.R., S.S.K., K.S.; methodology, L.L., J.R., S.S.K., K.S.; validation, L.L.; formal analysis, L.L.; investigation, L.L., J.R., S.S.K., K.S.; resources, K.S.; data curation, L.L.; writing—original draft preparation, L.L.; writing—review and editing, L.L., J.R., S.S.K., K.S.; visualization, L.L., J.R., S.S.K., K.S.; supervision, S.S.K., K.S.; project administration, K.S.; funding acquisition, K.S. All authors have read and agreed to the published version of the manuscript.

Funding

The work was fully supported by a GRF grant from the Research Grants Council of the Hong Kong Special Administrative Region China, project no. “CityU 11210419”, and the DON fund project no. “9220117”.

Institutional Review Board Statement

Not applicable.

Informed Consent Statement

Not applicable.

Data Availability Statement

The data presented in this study are available upon reasonable request by the corresponding author.

Conflicts of Interest

The authors declare no conflict of interest.

References

  1. Iverson, R.M. The physics of debris flows. Rev. Geophys. 1997, 35, 245–296. [Google Scholar] [CrossRef] [Green Version]
  2. Clelland, R.; Hrenya, C.M. Simulations of a binary-sized mixture of inelastic grains in rapid shear flow. Phys. Rev. E 2002, 65, 031301. [Google Scholar] [CrossRef]
  3. Moriguchi, S.; Borja, R.I.; Yashima, A.; Sawada, K. Estimating the impact force generated by granular flow on a rigid obstruction. Acta Geotech. 2009, 4, 57–71. [Google Scholar] [CrossRef]
  4. Teufelsbauer, H.; Wang, Y.; Pudasaini, S.P.; Borja, R.I.; Wu, W. DEM simulation of impact force exerted by granular flow on rigid structures. Acta Geotech. 2011, 6, 119. [Google Scholar] [CrossRef]
  5. Cui, Y.; Choi, C.E.; Lui, L.H.D.; Ng, C.W.W. Effects of particle size of mono-disperse granular flows impacting a rigid barrier. Nat Hazards 2018, 91, 1179–1201. [Google Scholar] [CrossRef]
  6. Ahamed, M.A.A.; Perera, M.S.A.; Li, D.-Y.; Ranjith, P.G.; Matthai, S.K. Proppant damage mechanisms in coal seam reservoirs during the hydraulic fracturing process: A review. Fuel 2019, 253, 615–629. [Google Scholar] [CrossRef]
  7. Bandara, K.M.A.S.; Ranjith, P.G.; Rathnaweera, T.D.; Wanniarachchi, W.A.M.; Yang, S.Q. Crushing and embedment of proppant packs under cyclic loading: An insight to enhanced unconventional oil/gas recovery. Geosci. Front. 2019. [Google Scholar] [CrossRef]
  8. Kozicki, J.; Tejchman, J. Application of a cellular automaton to simulations of granular flow in silos. Granul. Matter 2005, 7, 45–54. [Google Scholar] [CrossRef]
  9. Li, X.; Dong, M.; Li, S.; Shang, Y. Experimental and theoretical studies of the relationship between dry and humid normal restitution coefficients. J. Aerosol. Sci. 2019, 129, 16–27. [Google Scholar] [CrossRef]
  10. Zhao, S.; Zhang, C.; Zhang, Y.; Zhang, D. Collision Mechanism and Deposition Characteristics of Particles on the Catenary Insulator Surface. Coatings 2020, 10, 697. [Google Scholar] [CrossRef]
  11. Sandeep, C.S.; Senetakis, K. Grain-Scale Mechanics of Quartz Sand under Normal and Tangential Loading. Tribol. Int. 2018, 117, 261–271. [Google Scholar] [CrossRef]
  12. He, H.; Senetakis, K. A micromechanical study of shale rock-proppant composite interface. J. Pet. Sci. Eng. 2020, 184, 106542. [Google Scholar] [CrossRef]
  13. He, H.; Luo, L.; Senetakis, K. Effect of normal load and shearing velocity on the interface friction of organic shale proppant simulant. Tribol. Int. 2020, 144, 106119. [Google Scholar] [CrossRef]
  14. Li, S.; Kasyap, S.S.; Senetakis, K. A study on the failure behavior of sand grain contacts with Hertz modeling, image processing, and statistical analysis. Sensors 2021, 21, 4611. [Google Scholar] [CrossRef]
  15. Sandeep, C.S.; Senetakis, K. Effect of Young’s Modulus and Surface Roughness on the Inter-Particle Friction of Granular Materials. Materials 2018, 11, 217. [Google Scholar] [CrossRef] [PubMed] [Green Version]
  16. Sandeep, C.S.; Li, S.; Senetakis, K. Scale and surface morphology effects on the micromechanical contact behavior of granular materials. Tribol. Int. 2021, 159, 106929. [Google Scholar] [CrossRef]
  17. Sandeep, C.S.; Senetakis, K. Influence of morphology on the micro-mechanical behavior of soil grain contacts. Geomech. Geophys. Geo-Energy Geo-Resour. 2019, 5, 103–119. [Google Scholar] [CrossRef]
  18. Johnson, K.L. Contact Mechanics; Cambridge University Press: Cambridge, UK, 1985. [Google Scholar]
  19. Persson, B.N.J. Relation between interfacial separation and load: A general theory of contact mechanics. Phys. Rev. Lett. 2007, 99, 125502. [Google Scholar] [CrossRef] [Green Version]
  20. Pohrt, R.; Popov, V.L. Normal contact stiffness of elastic solids with fractal rough surfaces. Phys. Rev. Lett. 2012, 108, 104301. [Google Scholar] [CrossRef]
  21. Stronge, W.J. Impact Mechanics, 2nd ed.; Cambridge University Press: Cambridge, UK, 2018. [Google Scholar] [CrossRef] [Green Version]
  22. Lorenz, A.; Tuozzolo, C.; Louge, M.Y. Measurements of impact properties of small, nearly spherical particles. Exp. Mech. 1997, 37, 292–298. [Google Scholar] [CrossRef]
  23. Marinack, M.C., Jr.; Musgrave, R.E.; Higgs, C.F., III. Experimental investigations on the coefficient of restitution of single particles. Tribol. Trans. 2013, 56, 572–580. [Google Scholar] [CrossRef]
  24. Tang, H.; Song, R.; Dong, Y.; Song, X. Measurement of Restitution and Friction Coefficients for Granular Particles and Discrete Element Simulation for the Tests of Glass Beads. Materials 2019, 12, 3170. [Google Scholar] [CrossRef] [PubMed] [Green Version]
  25. Aryaei, A.; Hashemnia, K.; Jafarpur, K. Experimental and numerical study of ball size effect on restitution coefficient in low velocity impacts. Int. J. Impact Eng. 2010, 37, 1037–1044. [Google Scholar] [CrossRef]
  26. Jiang, Z.; Du, J.; Rieck, C.; Bück, A.; Tsotsas, E. PTV experiments and DEM simulations of the coefficient of restitution for irregular particles impacting on horizontal substrates. Powder Technol. 2019, 360, 352–365. [Google Scholar] [CrossRef]
  27. Thornton, C. Coefficient of Restitution for Collinear Collisions of Elastic-Perfectly Plastic Spheres. J. Appl. Mech. 1997, 64, 383–386. [Google Scholar] [CrossRef]
  28. Li, Z.; Li, X.; Yu, J.; Cao, W.; Liu, Z.; Wang, M.; Liu, Z.; Wang, X. Influence of existing natural fractures and beddings on the formation of fracture network during hydraulic fracturing based on the extended finite element method. Geomech. Geophys. Geo-Energ. Geo-Resour 2020, 6. [Google Scholar] [CrossRef]
  29. Ma, T.; Chen, P.; Zhao, J. Overview on vertical and directional drilling technologies for the exploration and exploitation of deep petroleum resources. Geomech Geophys Geo Energy Geo Resour 2016, 2, 365–395. [Google Scholar] [CrossRef] [Green Version]
  30. Curcio, A. Symmetries and configurations of hydraulic fracturing electromagnetic monitoring: A 2D anisotropic approach. Geomech. Geophys. Geo-Energ. Geo-Resour 2021, 7. [Google Scholar] [CrossRef]
  31. Kasyap, S.S.; Senetakis, K. Interface load displacement behaviour of sand grains coated with clayey powder: Experimental and analytical studies. Soils Found. 2019, 59, 1695–1710. [Google Scholar] [CrossRef]
  32. Kasyap, S.S.; Li, S.; Senetakis, K. Influence of natural coating type on the frictional and abrasion behaviour of siliciclastic-coated sedimentary sand grains. Eng. Geol. 2021, 281, 105983. [Google Scholar] [CrossRef]
  33. Kasyap, S.S.; Senetakis, K.; Zhao, J. Cyclic normal load–displacement behaviour of clay-coated sand grain contacts. Geotechnique 2021, 71, 216–225. [Google Scholar] [CrossRef]
  34. Grotzinger, J.P.; Jordan, T.H. Understanding Earth, 7th ed.; W.H. Freeman and Company: New York, NY, USA, 2014. [Google Scholar]
  35. Sandeep, C.S.; Senetakis, K. Exploring the micromechanical sliding behavior of typical quartz grains and completely decomposed volcanic granules subjected to repeating shearing. Energies 2017, 10, 370. [Google Scholar] [CrossRef] [Green Version]
  36. Sandeep, C.S.; Senetakis, K. The tribological behavior of two potential-landslide saprolitic rocks. Pure Appl. Geophys. 2018, 175, 4483–4499. [Google Scholar] [CrossRef]
  37. Sandeep, C.S.; Todisco, M.C.; Nardelli, V.; Senetakis, K.; Coop, M.R.; Lourenco, S.D.N. A micromechanical experimental study of highly/completely decomposed tuff granules. Acta Geotech. 2018, 13, 1355–1367. [Google Scholar] [CrossRef] [Green Version]
  38. Kasyap, S.S.; Senetakis, K. A micromechanical experimental study of kaolinite-coated sand grains. Tribol. Int. 2018, 126, 206–217. [Google Scholar] [CrossRef]
  39. Crüger, B.; Salikov, V.; Heinrich, S.; Antonyuk, S.; Sutkar, V.S.; Deen, N.G.; Kuipers, J.A.M. Coefficient of restitution for particles impacting on wet surfaces: An improved experimental approach. Particuology 2016, 25, 1–9. [Google Scholar] [CrossRef]
  40. Buck, B.; Tang, Y.; Deen, N.G.; Kuipers, J.A.M.; Heinrich, S. Dynamics of wet particle-wall collisions: Influence of wetting condition. Chem. Eng. Res. Des. 2018, 135, 21–29. [Google Scholar] [CrossRef]
  41. Sandeep, C.S.; Luo, L.; Senetakis, K. Effect of grain size and surface roughness on the normal coefficient of restitution of single grains. Materials 2020, 13, 814. [Google Scholar] [CrossRef] [Green Version]
  42. Sandeep, C.S.; Senetakis, K.; Cheung, D.K.H.; Choi, C.E.; Wang, Y.; Coop, M.R.; Ng, C.W.W. Experimental study on the coefficient of restitution of grain against block interfaces for natural and engineered materials. Can. Geotech. J. 2021, 58, 35–48. [Google Scholar] [CrossRef]
  43. Banks, M.; Bridges, N.T.; Benzit, M. Measurements of the Coefficient of Restitution of Quartz Sand on Basalt: Implications for Abrasion Rates on Earth and Mars. Lunar Planet. Sci. 2005, 2116. Available online: https://ntrs.nasa.gov/api/citations/20050166958/downloads/20050166958.pdf (accessed on 15 August 2021).
  44. Sandeep, C.S.; Senetakis, K. An experimental investigation of the microslip displacement of geological materials. Comput. Geotech. 2019, 107, 55–67. [Google Scholar] [CrossRef]
  45. Krumbein, W.C.; Sloss, L.L. Stratigraphy and Sedimentation; (No.QE571 K7 1963); W.H. Freeman & Company: New York, NY, USA, 1963. [Google Scholar]
  46. Kasyap, S.S.; Senetakis, K. An experimental investigation on the tribological behaviour of nominally flat quartz grains with gouge material in dry, partial saturated and submersed conditions. Pure Appl. Geophys. 2020, 177, 3283–3300. [Google Scholar] [CrossRef]
  47. Ren, J.; Li, S.; He, H.; Senetakis, K. The tribological behavior of iron tailing sand grain contacts in dry, water and biopolymer immersed states. Granul. Matter 2021, 23, 12. [Google Scholar] [CrossRef]
  48. Patil, D.; Higgs, C.F. A coefficient of restitution model for sphere–plate elastoplastic impact with flexural vibrations. Nonlinear Dyn. 2017, 88, 1817–1832. [Google Scholar] [CrossRef]
  49. Hamdia, K.M.; Ghasemi, H.; Zhuang, X.; Alajlan, N.; Rabczuk, T. Sensitivity and uncertainty analysis for flexoelectric nanostructures. Comput. Methods Appl. Mech. Eng. 2018, 337, 95–109. [Google Scholar] [CrossRef]
  50. Vu-Bac, N.; Lahmer, T.; Zhuang, X.; Nguyen-Thoi, T.; Rabczuk, T. A software framework for probabilistic sensitivity analysis for computationally expensive models. Adv. Eng. Softw. 2016, 100, 19–31. [Google Scholar] [CrossRef]
Figure 1. Typical results of energy dispersive spectroscopy (EDS) analysis on (a) pure montmorillonite (smectite-clay group) and (b) LBS grain.
Coatings 11 00996 g001
Figure 2. Typical images of coated LBS grains at different scales: (a) microscopic image for 150 mg/mL; (b) SEM image for 150 mg/mL; (c) SEM image for 150 mg/mL; (d) microscopic image for 300 mg/mL; (e) SEM image for 100 mg/mL; (f) SEM image for uncoated LBS.
Coatings 11 00996 g002
Figure 3. Typical EDS graphs of coated LBS grains at different concentrations: (a) 50 mg/mL; (b) 100 mg/mL; (c) 200 mg/mL; (d) 300 mg/mL.
Coatings 11 00996 g003
Figure 4. Percentage of Al with different concentrations for 500 s of exposure.
Coatings 11 00996 g004
Figure 5. Image of the impact experimental setup inside a Perspex chamber showing its major components: (a) solenoids; (b) high-speed cameras; (c) focused LEDs; (d) base plate; (e) cantilever pole to adjust height; (f) trigger switch; (g) Perspex chamber.
Coatings 11 00996 g005
Figure 6. Various stages of 3 mm glass ball impacting on the granitic block: (a) initial path of drop; (b) the glass bead impacting with the block surface; (c) path of rebound and the highest position achieved.
Coatings 11 00996 g006
Figure 7. Schematic illustration of the estimation of the rebound height: (a) 2D illustration and (b) 3D illustration for oblique rebounds (red dotted lines along with arrows indicate dropping and rebounding paths).
Coatings 11 00996 g007
Figure 8. COR values calculated in 2D measurements against COR values calculated in 3D measurements for (a) uncoated LBS, and coated LBS at (b) 50 mg/mL, (c) 100 mg/mL, and (d) 150 mg/mL.
Coatings 11 00996 g008
Figure 9. Comparison of 3D and 2D measurements for different coated LBS grains colliding with granitic block at an impact velocity of 2.42 m/s.
Coatings 11 00996 g009
Figure 10. CDF of COR values for different coated LBS colliding with granite block at the impact velocity of 2.42 m/s.
Coatings 11 00996 g010
Figure 11. Histograms of percentage energy loss for various grain and block combinations (results on spherical grains of glass beads (GB) and chrome steel balls (CSB), after [42]).
Coatings 11 00996 g011
Table 1. Basic results from the impact tests of pure LBS and coated LBS against granitic block (mean grain size = 3 mm, impact velocity = 2.42 m/s).
BlockGrain TypeConcentration of Clay-Water Solution (mg/mL)COR-3DCOR-2DDeviating Angle-3D (°)Deviating Angle-2D (°)
GraniteLBS00.78 ± 0.110.76 ± 0.1223.9 ± 13.416.0 ± 11.5
LBS-50500.74 ± 0.070.72 ± 0.0826.9 ± 12.920.0 ± 13.4
LBS-1001000.69 ± 0.100.67 ± 0.1029.4 ± 13.520.0 ± 13.7
LBS-1501500.65 ± 0.130.64 ± 0.1423.0 ± 11.415.6 ± 11.0
Publisher’s Note: MDPI stays neutral with regard to jurisdictional claims in published maps and institutional affiliations.

