
Comprehensive Data Collection Device for Plasma Equipment Intelligence Studies
by
 , ,
, ,
Yong-Hyun Kim
1,2, 
Ji-Ho Cho
2,
Jong-Sik Kim
1,2,*,
Jong-Bae Park
1,2,
Dae-Chul Kim
1,2 and
Young-Woo Kim
1,2 1
Fundamental Technology Research Division, Institute of Plasma Technology, Korea Institute of Fusion Energy, Gunsan-si 54004, Korea
2
Plasma E.I. Convergence Research Center, Korea Institute of Fusion Energy, Gunsan-si 54004, Korea
*
Author to whom correspondence should be addressed.
Coatings 2021, 11(9), 1025; https://0-doi-org.brum.beds.ac.uk/10.3390/coatings11091025
Submission received: 29 July 2021
/
Revised: 17 August 2021
/
Accepted: 24 August 2021
/
Published: 26 August 2021
(This article belongs to the Special Issue Surface Modification by Plasma-Based Processes)
Abstract
:In this study, various diagnostic tools were constructed and plasma factors measured to evaluate the intelligence of plasma process equipment. We used an ICP (Inductively Coupled Plasma) reactor with a radio frequency (RF) power of 13.56 MHz, a power of 400 to 800 W, and a pressure of 10 to 30 mTorr. Plasma parameters such as electron density (ne), electron temperature (Te), plasma potential (Vp), and floating potential (Vf) were measured using several instruments (VI probe and mass/energy analyzer, etc.) and subsequently analyzed. Regression analysis was performed to correlate the measured data with the plasma parameters. As a result, the plasma density (ne) and temperature (Te) were observed to be in good agreement with the non-invasive measurement results. In particular, the VI probes were highly correlated with almost all the measured plasma parameters. Therefore, the results of this study provide a basis for the estimation of plasma parameters using non-invasive measurement techniques.
1. Introduction
Plasma processing plays a crucial role in several manufacturing industries, such as the fabrication of semiconductors. Recently, plasma processing technology has been employed as a useful tool for surface modification of different materials by the interaction of energetic particles (ions, electrons, neutrals) and photons with their surfaces exposed to plasmas [1,2]. In general, the physical and chemical characteristics of the plasma can be determined by various operating parameters, including the pressure, power, electromagnetic field structure of the process chamber, and chemical composition [3]. Thus, plasma process control can only occur by obtaining a comprehensive understanding of the plasmas’ physical and chemical properties. However, most plasma processes currently used in industry are done so without a complete understanding of the physical and chemical properties of the plasma. Therefore, a comprehensive understanding of plasma characteristics is needed to improve process reproducibility and equipment operation safety [4,5]. Increased understanding can help develop next-generation plasma process equipment and apply it to advanced process and equipment control.
Further, a more comprehensive understanding of these plasma processes can be used to develop next-generation plasma process equipment and apply advanced processes. For these advanced processes and equipment controls, appropriate diagnostic/monitoring tools should be used to identify the plasma characteristics and monitor plasma’s physical and chemical changes [6].
Generally, the methods for plasma monitoring can be divided into invasive and non-invasive methods. The cutoff probe, single Langmuir probe, and double floating probe are classified as invasive methods. Meanwhile, externally measuring the conditions of the plasma reactor, such as optical diagnostics, including optical emission spectroscopy (OES), quadrupole mass spectroscopy (QMS), and VI probe methods, are classified as non-invasive methods. Invasive methods can directly measure plasma parameters such as electron density, temperature, ion density, and other properties in the chamber development stage. However, it is significantly challenging to apply them during the mass production stage. In contrast, non-invasive methods are limited in their ability to measure plasma properties directly. However, they are acceptable in manufacturing because non-invasive methods do not perturb plasma. These plasma diagnostic methods face two main challenges in the industrial field. One is the large number of variables measured by plasma diagnostic or monitoring devices; the vast amount of data makes it challenging for equipment engineers to determine which variables to observe. Another difficulty is the decrease in the sensitivity of measurement signals, which is caused by the narrowing of the physical-chemical reaction target area due to the recent refinement of plasma processes represented by etching and deposition [7].
Thus, this study presents the possibility of comprehensively solving these problems based on an integrated data acquisition and analysis system (IDAS). For example, we propose a method for inferring plasma parameters that can be obtained by combining an invasive measurement method with a non-invasive measurement method.
The remainder of this manuscript is organized as follows. Section 2 presents an integrated diagnostic/sensing system that can measure plasma parameters using both invasive and non-invasive plasma diagnostic methods. Section 3 presents a general explanation of IDAS; in Section 4, the data correlation between plasma parameters and VI probe data (that enables multivariate analysis) is presented. In the final section, we provide the conclusions.
2. Experimental Details
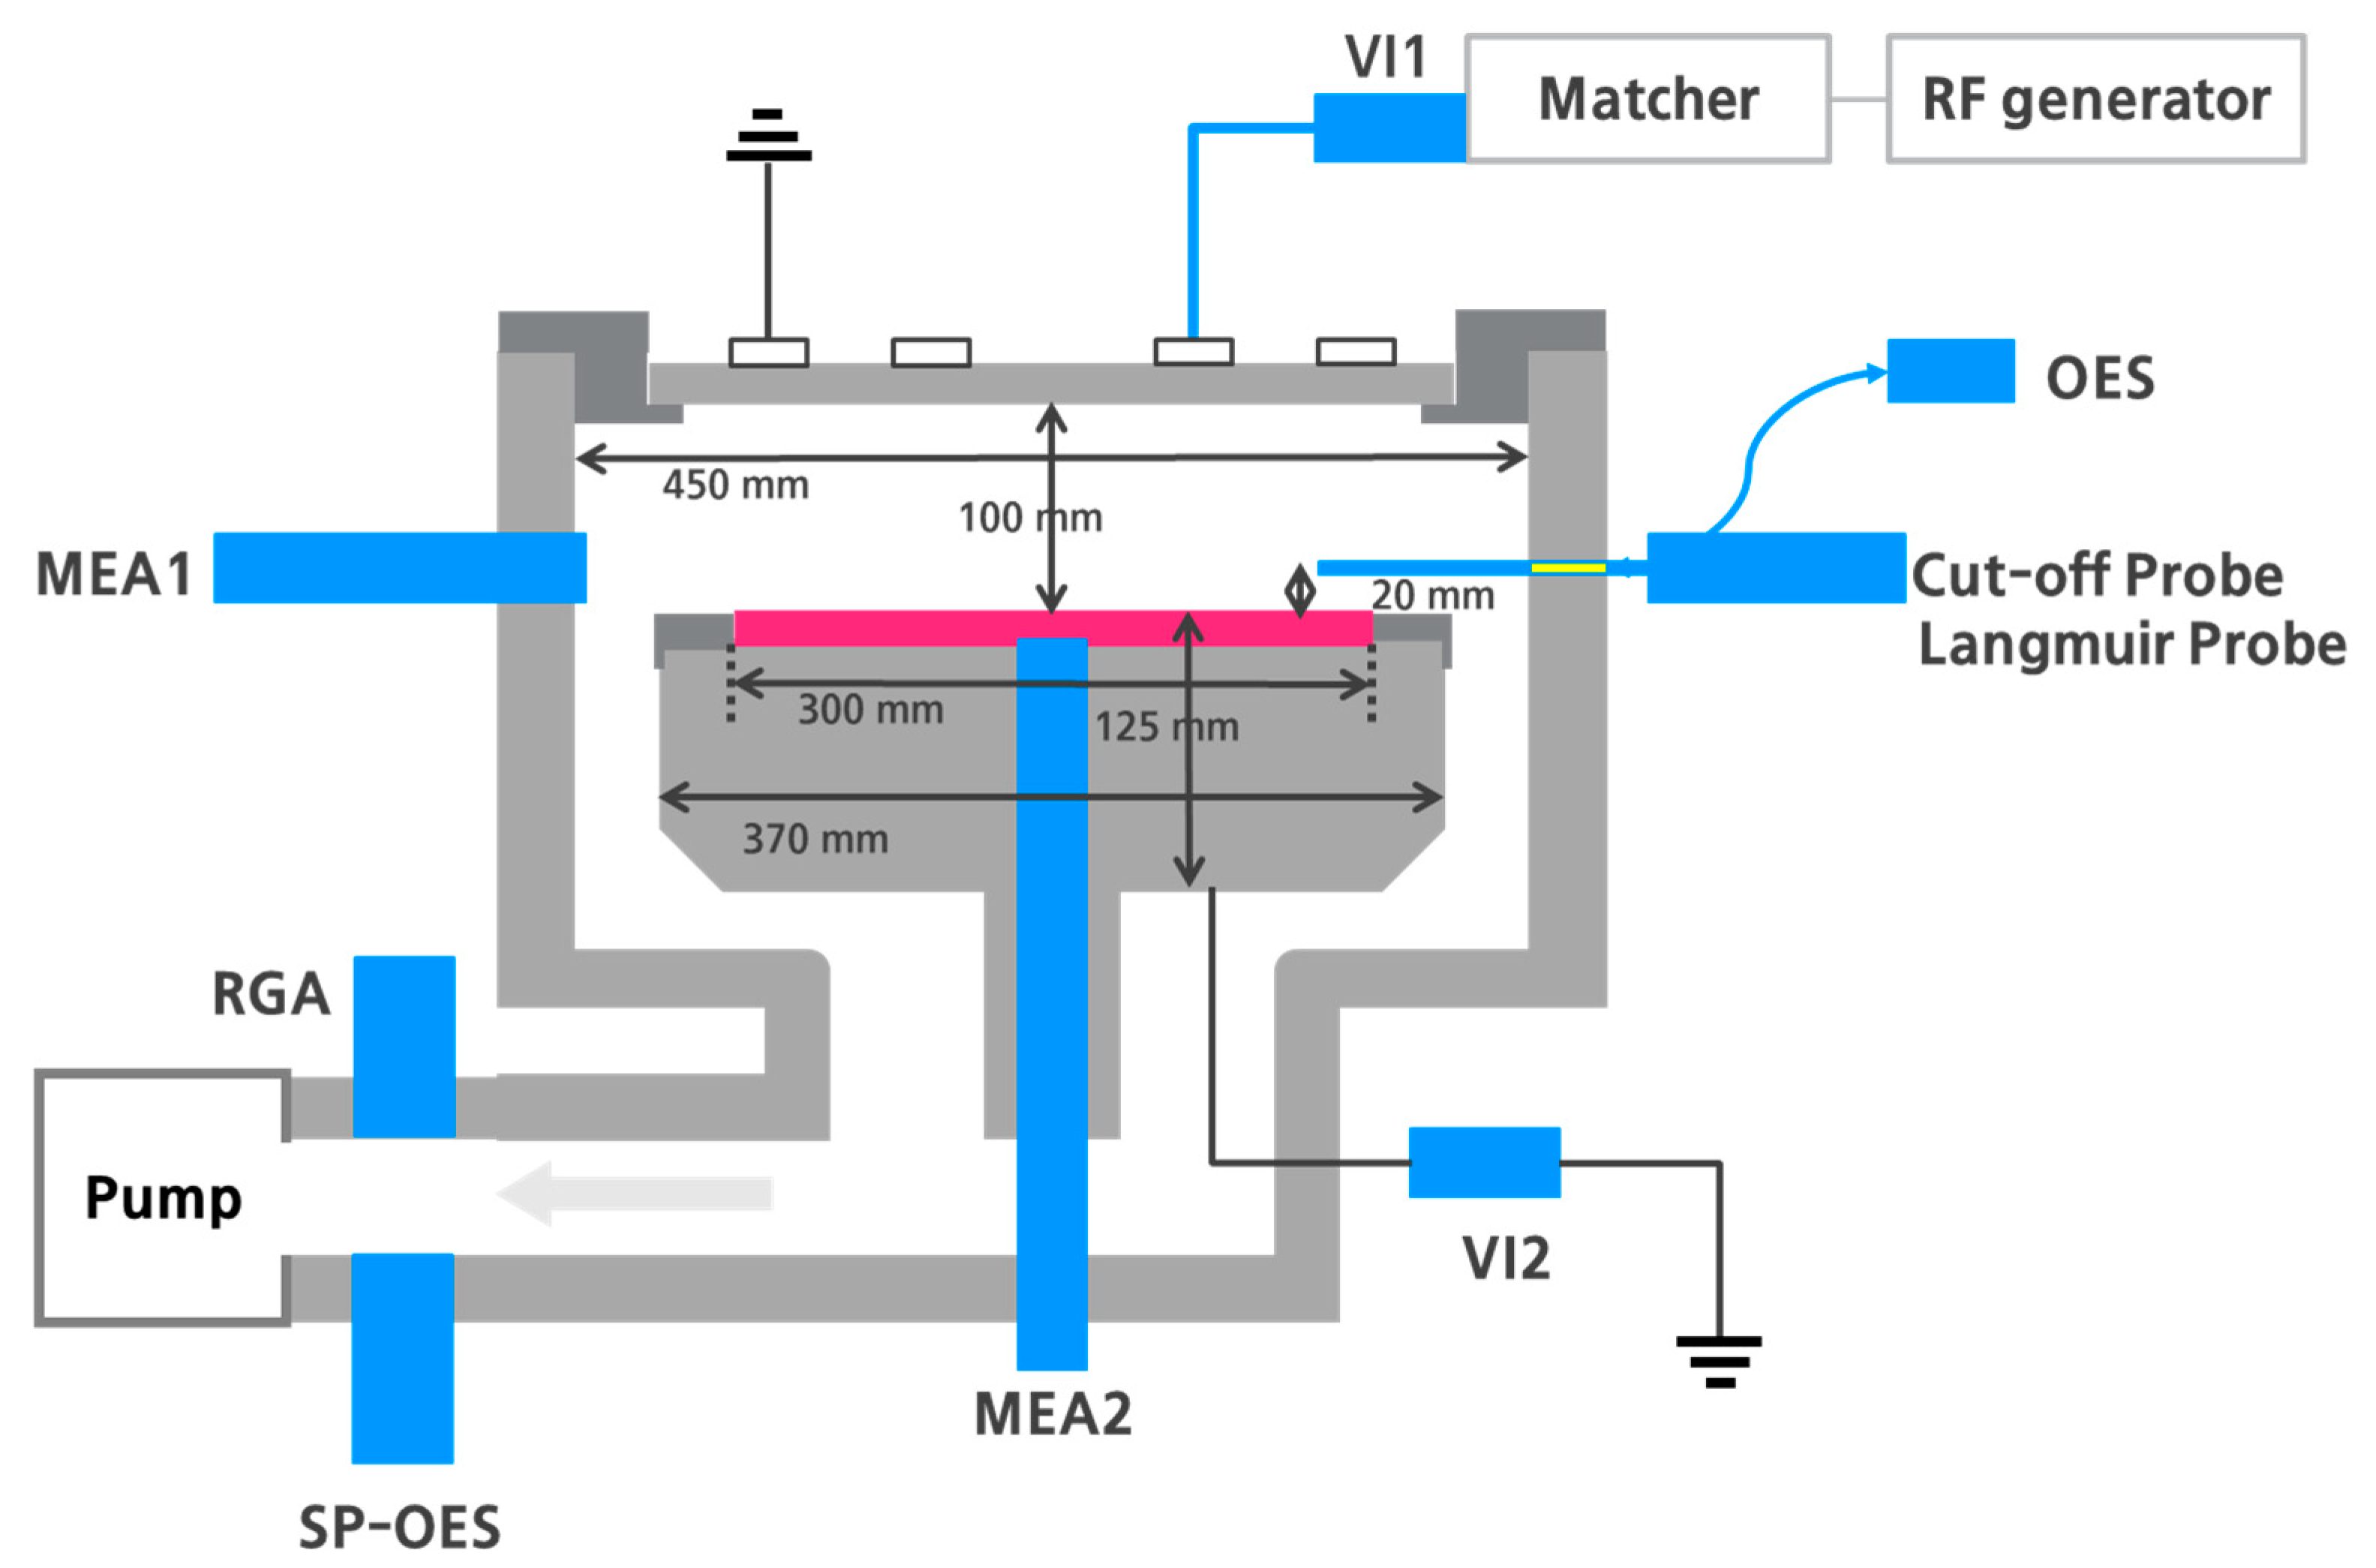
An inductively coupled plasma (ICP) system for the plasma nitriding process (PN-ICP, homemade) was used to diagnose plasma properties during the plasma nitriding process. The process reactor for nitriding silicon oxide film was 450 mm in diameter, and an impedance-adjustable antenna was used. The antenna was mounted on top of the exterior of the reactor using ceramic insulation. The distance between the ceramic insulator and the substrate was 100 mm, and the substrate diameter was 300 mm. A silicon alumina cover was installed on the substrate to prevent direct contact between the plasma and the substrate, even if the silicon wafer was not placed on the substrate. In addition, a 500 µm diameter pinhole was installed in the center of the substrate so that particles passing through the pinhole could be measured using a mass/energy analyzer. The radio frequency (RF) power supply used for plasma generation was Cito Plus (13.56 MHz, 1 kW) from Comet (Wünnewil-Flamatt, Switzerland), and the impedance matching network used was AGS (13.56 MHz, 1 kW) from Comet. The process gas was N2 (N2, 99.999%), and the flow rate and pressure were controlled using a mass flow controller (MFC, Mass-Flo®, 1000 sccm, MKS, Andover, MA, USA). The base pressure of the reactor was 10−6 Torr, and this was maintained using a turbomolecular pump (STP-1303C, Edwards, Burgess Hill, United Kingdom) and a dry pump (GX100N, Edwards).
To diagnose the plasma, the following diagnostic devices were installed in the reactor (Figure 1). A cutoff probe (CP, homemade) [8,9] and Langmuir probe (LP, homemade) were used to measure the plasma electron density and other plasma properties. Optical emission spectroscopy (OES, HR4000, Ocean optics, Dunedin, FL, USA) was used to measure the plasma spectroscopy properties. To measure the RF power harmonic properties at the antenna, the VI probe OCTIV POLY (Impedans, Dublin, Ireland) was installed. The VI probe OCTIV SUITE (Impedans) was installed on the substrate. For gas species analysis, a residual gas analyzer (RGA, Prisma Pro QMG 250, Pfeiffer Vacuum, Ablar, Germany) and self-plasma OES (SPOES, AEGIS-7W, Nanotech, Yongin-si, Korea) were installed in the pump exhaust. Two mass/energy analyzers were installed at the bottom of the substrate and on the reactor wall to measure the mass and energy of the ionic species (MEA1: PSM, MEA2: EQP, Hiden, Warrington, UK). RF power matching position and system log measuring devices were installed using data acquisition (DAQ) to monitor the RF power (forward and reflected power), matching position (load and tune capacitor position), pressure, and gas flow during the process. The PXIe-8840, PXIe-1071, and PXIe-6355 analog input modules (National Instruments, Austin, TX, USA) were used for the PXI devices, and a PCI-6115 DAQ (National Instruments, Austin, TX, USA) board was used for desktop computers. The NI LabView software (2020, National Instruments, Austin, TX, USA) was used to create programs for the measurement, collection, and analysis. To efficiently manage a total of six measurement devices, the network was configured as a LAN network.
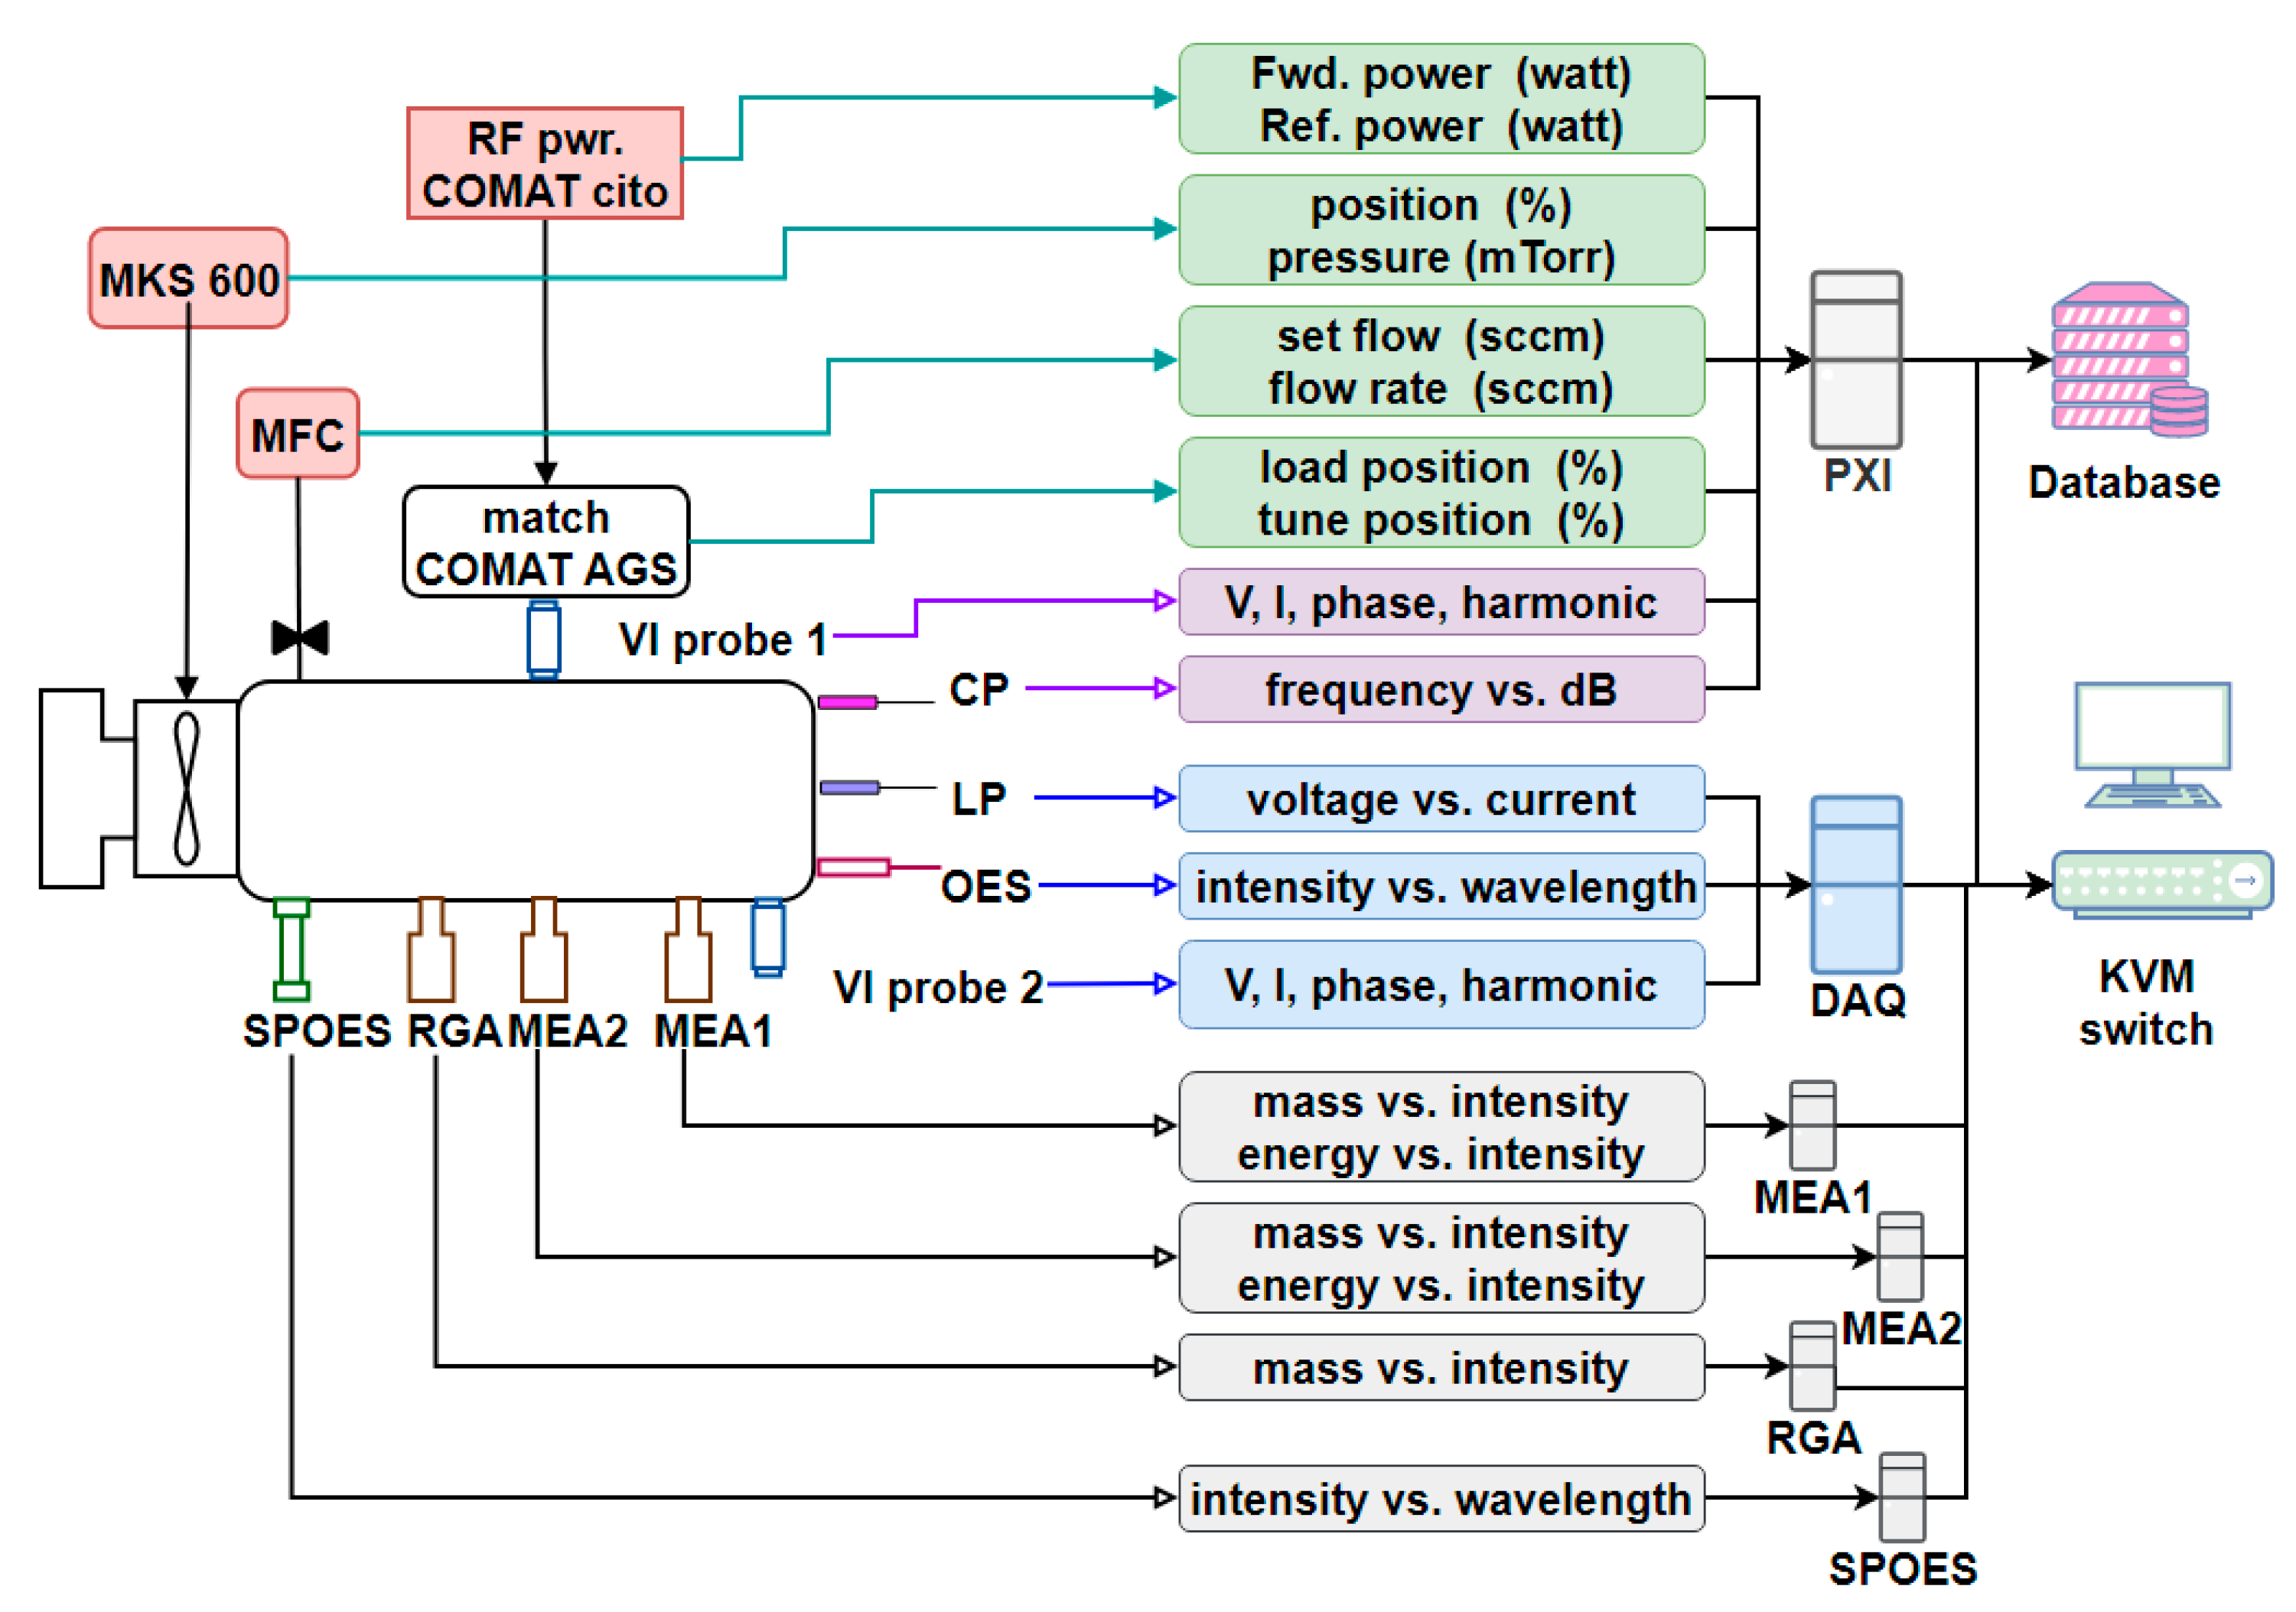
The IDAS consists of six devices: PXI, DAQ, MEA1 (PSM), MEA2 (EQP), RGA, and SPOES (Figure 2). The collected data includes eight sensor data types and information on the PN-ICP system operation (SystemLog). The measurement device PXI simultaneously recorded the system logs and two types of sensor data, CP and VI probe (VI1, antenna part); we developed a program for controlling PXI using LabView software. All data measured by PXI have a measurement cycle of 100 ms. The SystemLog is a collection of 24 data items, including RF power (forward and reflected power), matching capacitor position (tune, load), throttle valve position, operating pressure, and MFC flow (SV, PV value, nine channels). All data collected in the SystemLog were configured to measure analog signals from each equipment piece to the PXIe-6355 module. These measured data were recorded in a SystemLog file as time-series data. CP measurements were performed using a network analyzer with frequencies ranging from 300 MHz to 8 GHz, and the frequency vs. S21 signal graph was recorded as individual files for each measurement. The developed CP program was displayed on the screen by simultaneously analyzing the plasma electron density and performing the measurement. The VI probe (VI1) measures the RF power signal applied to the antenna. The VI probe sensor is controlled by USB serial communication to measure the first to 15th harmonic components. The components measured in harmonics are the four values of voltage, current, phase, and harmonic phase, which are recorded as time-series data.
The measurement device DAQ simultaneously measures three types of sensor data, OES, LP, and VI probes (VI2, substrate). We developed a measurement program using LabView software. The OES and VI probe measurement cycles were 100 ms, and LP was approximately 1.5 s. The OES was connected to the OES sensor by USB serial communication to measure the wavelength and intensity. The wavelength range of the OES was 200–1000 nm, and the wavelength vs. intensity signal graph was recorded as a separate file for each measurement. LP measurements were used as a data acquisition circuit for measuring the LP data; voltage vs. current signal graphs measured by the probe were recorded as individual files for each measurement. The developed LP program was displayed on the screen by analyzing the plasma electron density (ne), electron temperature (Te), plasma potential (Vp), floating potential (Vf), electron saturation current (Iesat), and ion saturation current (Iisat) at the same time as the measurement. The VI probe (VI2) measures the RF power signals flowing in the ground directly from the substrate. The measurement method of VI2 is similar to that of VI1 used in PXI, but VI2 is measured to the 16th harmonic signal. EQP, PSM, RGA, and SPOES used independent individual devices and dedicated software provided by the sensor developers. Each of the four sensors measures raw data using dedicated software and record it in a .csv file.
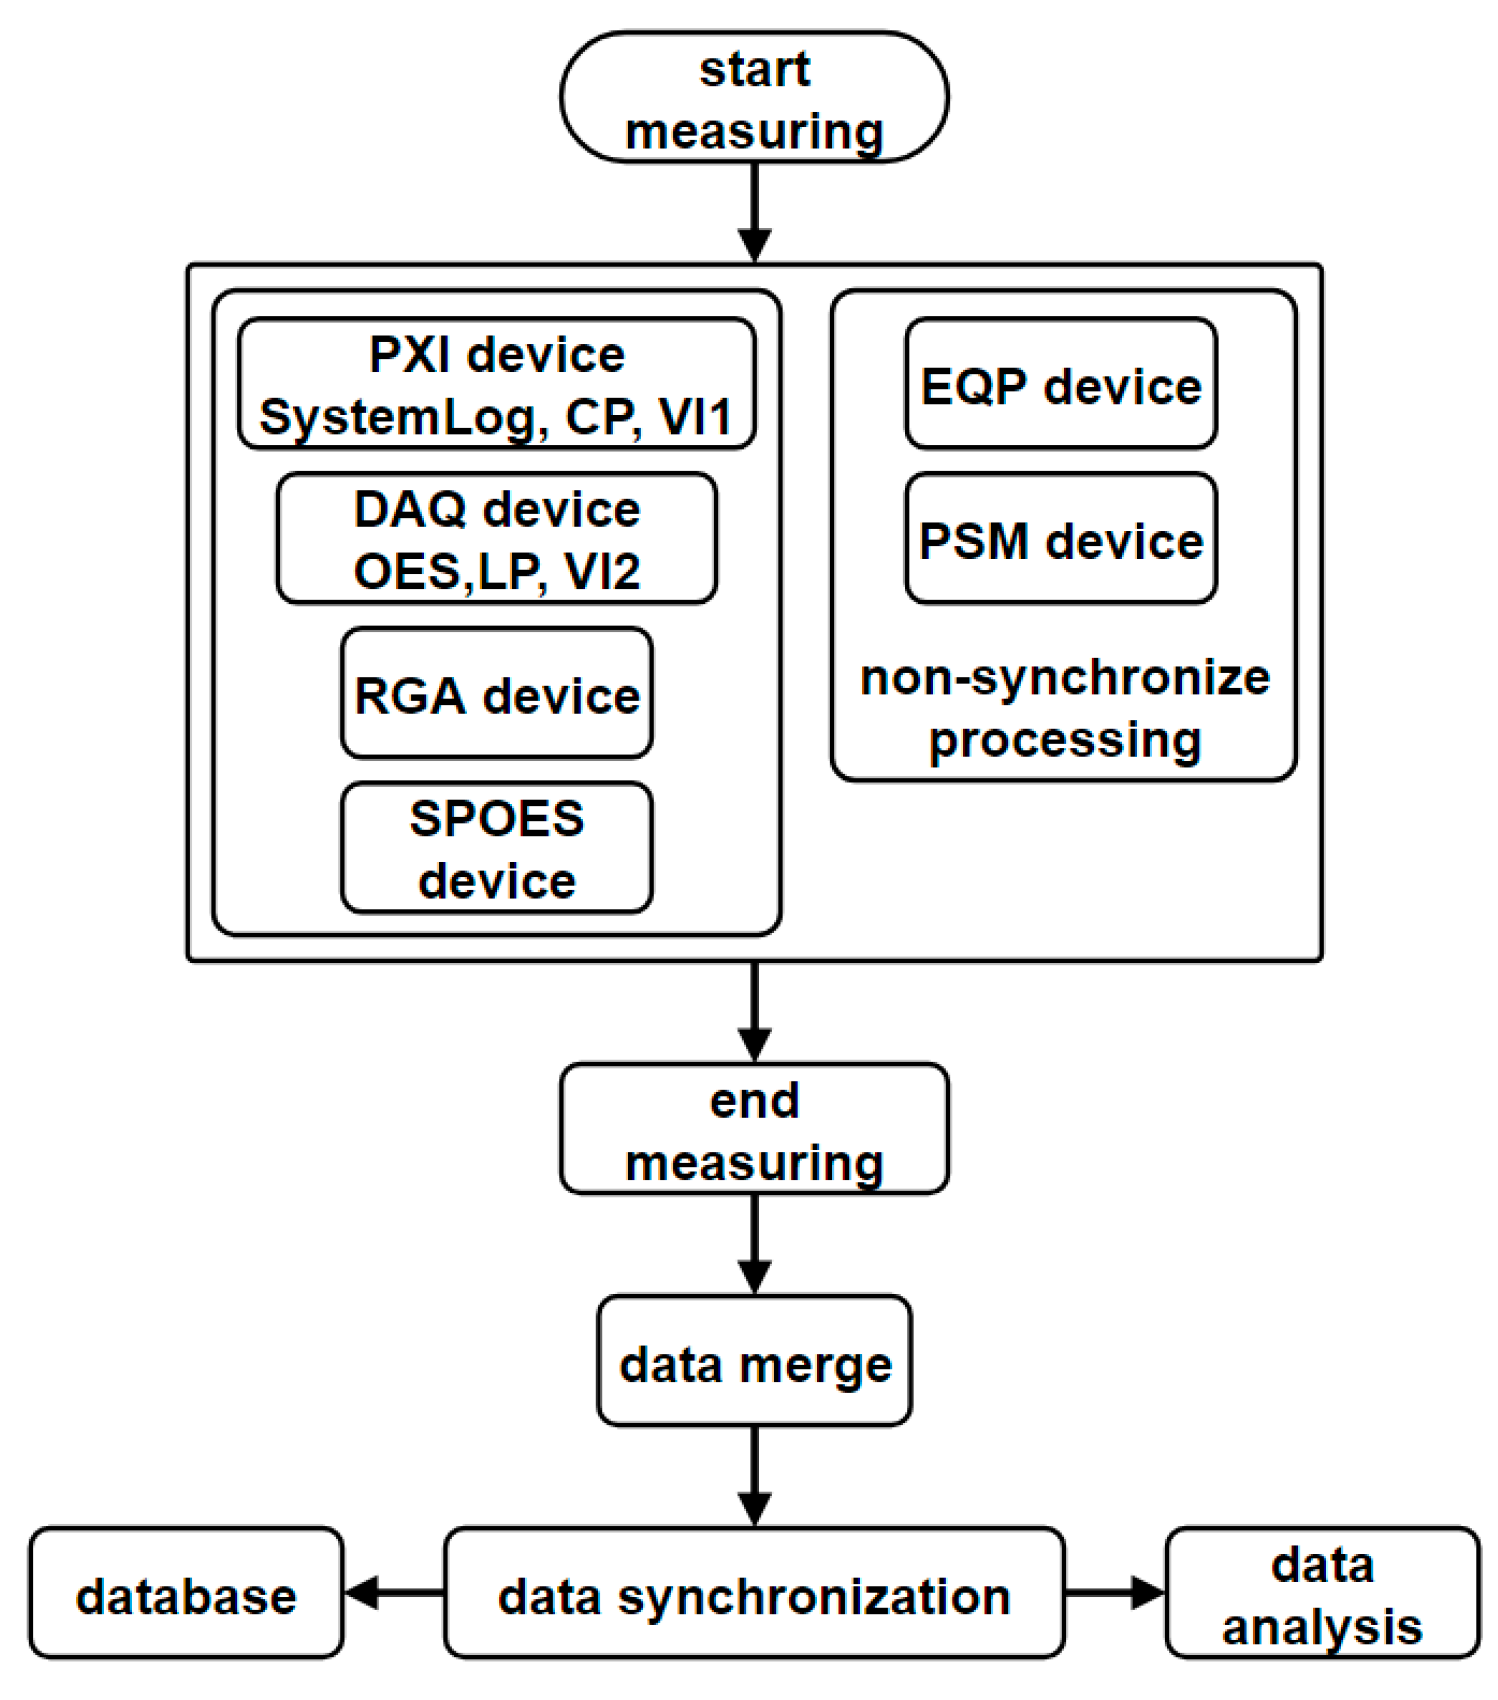
Figure 3 shows the four devices, PXI, DAQ, RGA, and SPOES, simultaneously measure data, whereas the EQP and PSM data were measured separately. The EQP and PSM data were not simultaneously measured with the other devices because the DC voltage applied to the probe while measuring the LP affected the EQP and PSM measurements.
All devices execute a time synchronization once per day with the database server clock. However, some measurement device clocks were slightly distorted. To solve this problem, after the measurements were completed, the data were collected in one place, and the measurement time was synchronized. The reference for data time synchronization is the time at which the plasma is turned on. The time the plasma was turned on was checked in the RF power, OES, CP, and VI probe data, and the incorrect measurement time was corrected. The data synchronized with the measurement time were used to produce a data analysis result report using an analysis program. RGA, EQP, and PSM were analyzed using dedicated software. Basic analysis programs were developed using LabView to analyze LP, CP, VI probe, OES, SPOES, and SystemLog data. Data were processed in batches for the analysis result report. In addition, a database server was configured for data distribution and management.
3. Measurement Results
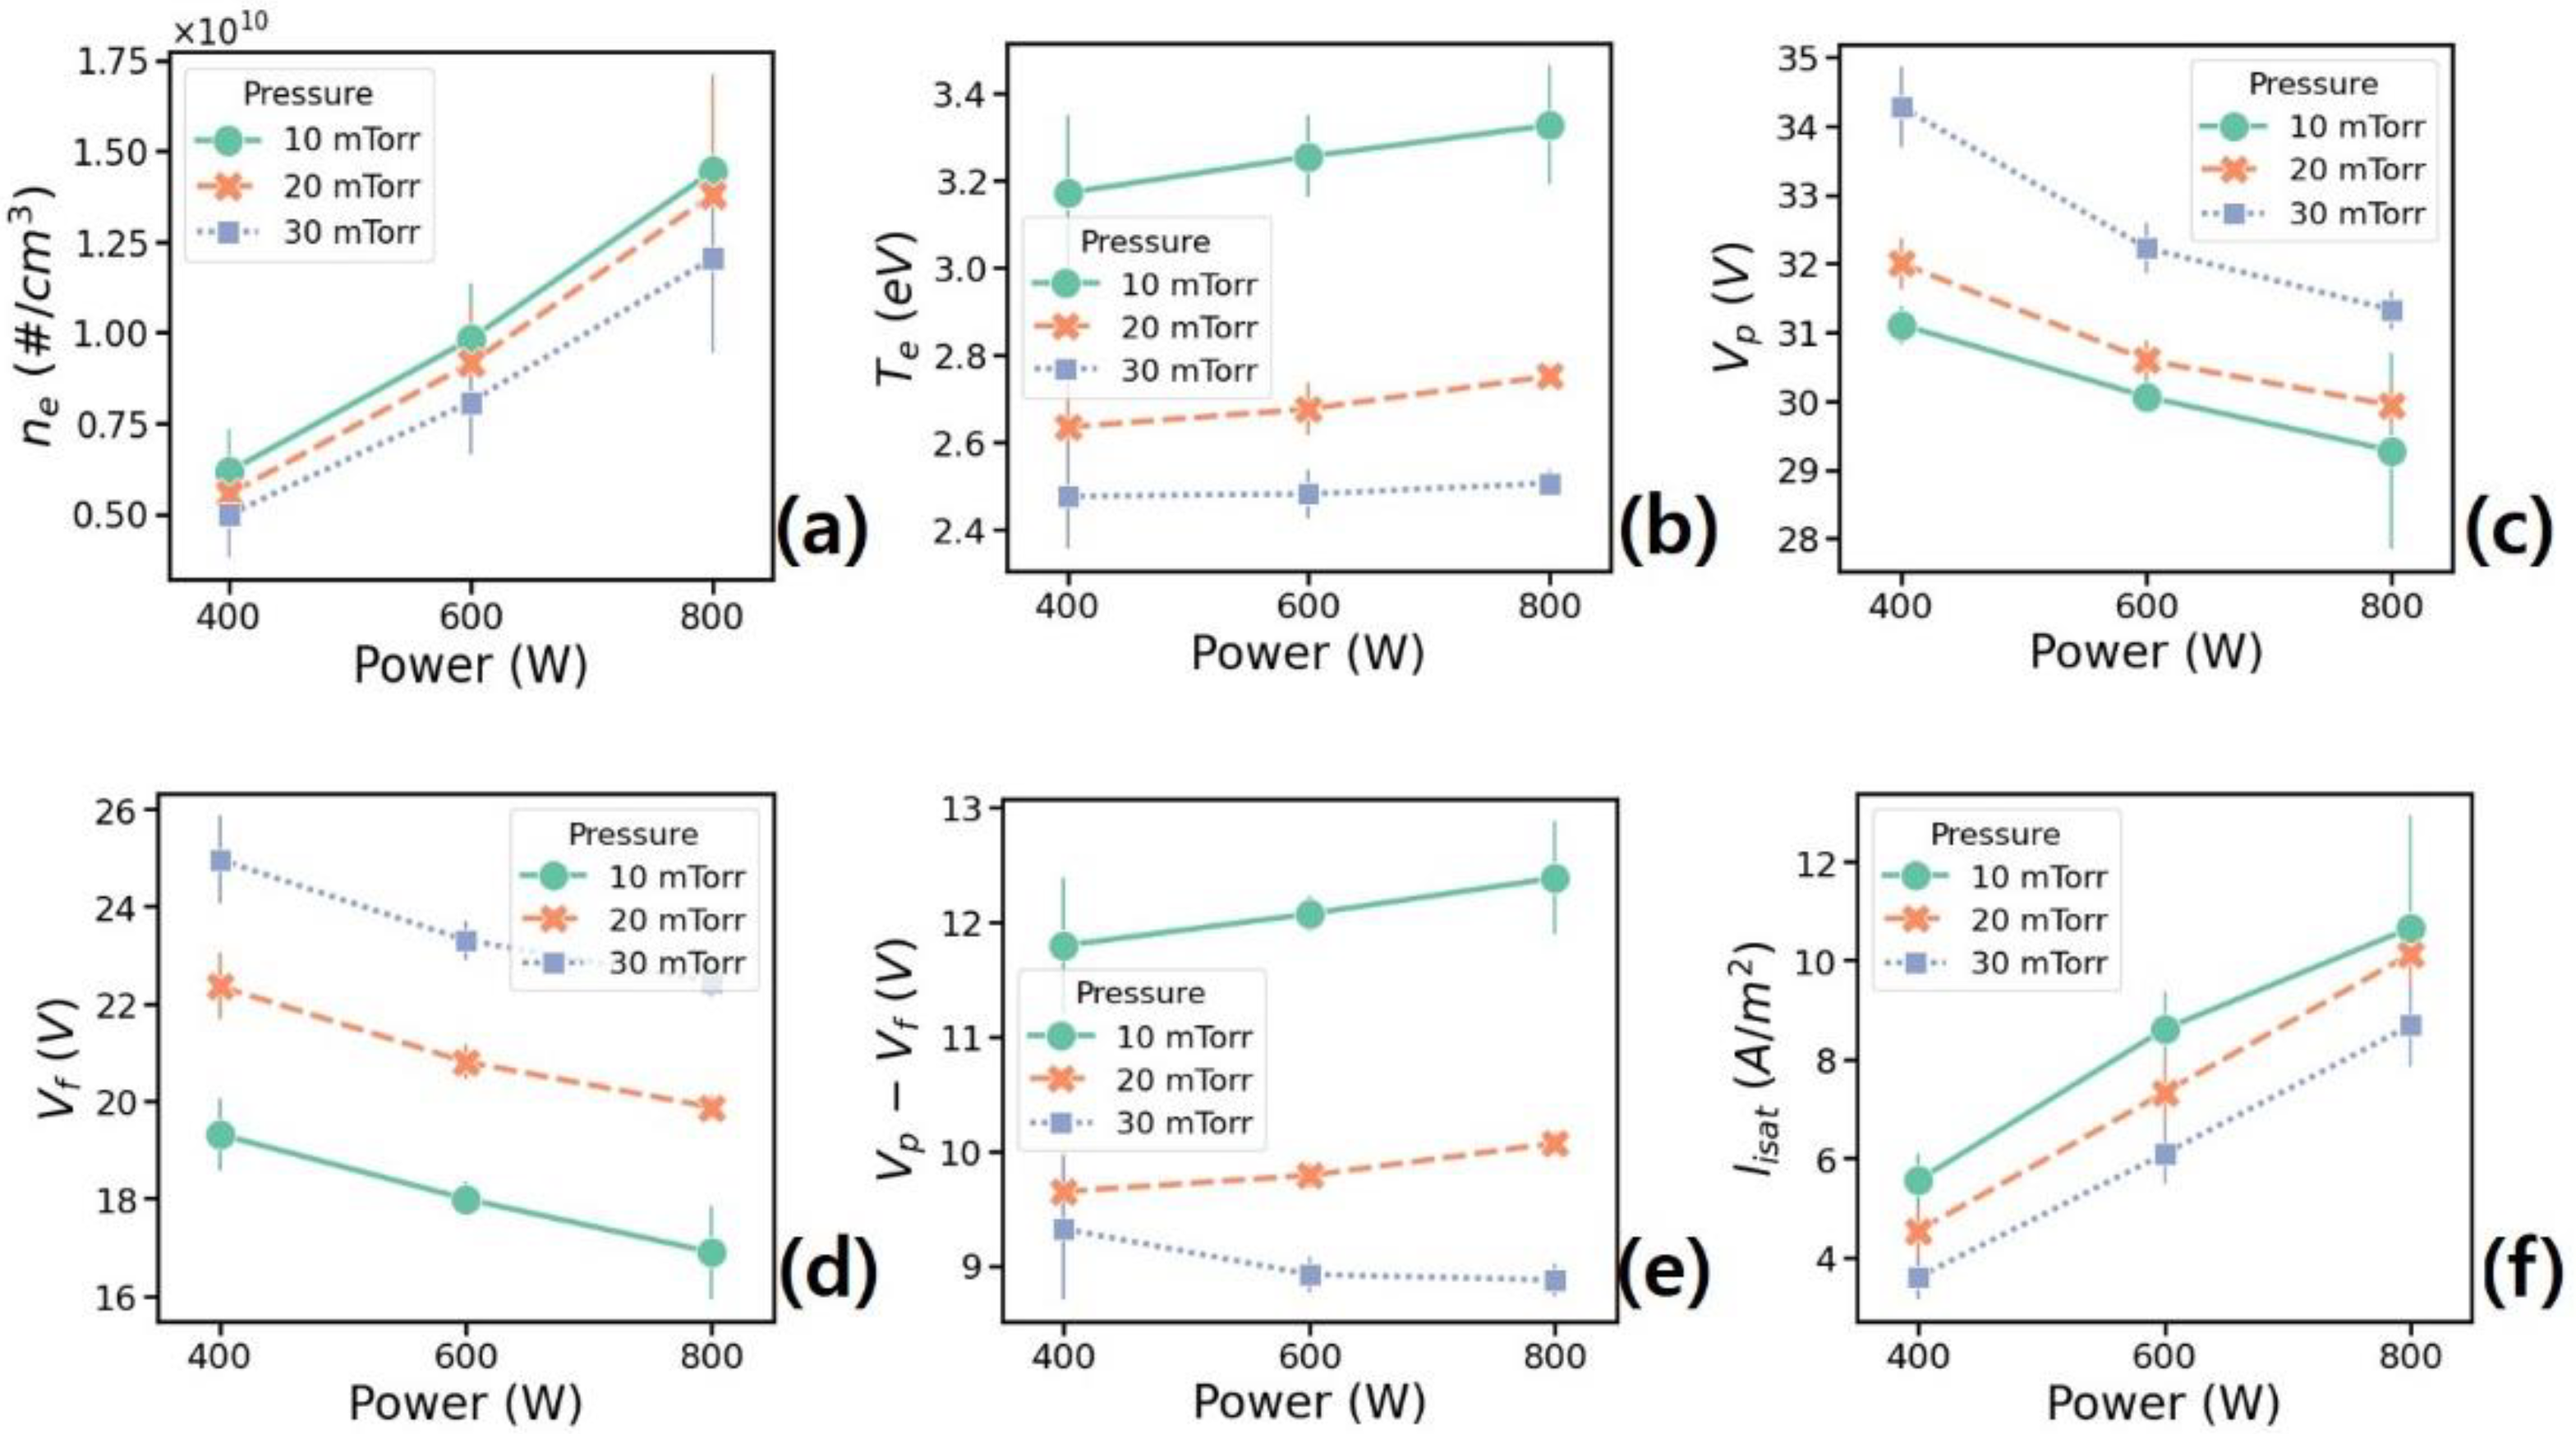
Plasma parameters were measured at the RF powers of 400, 600, and 800 W, and the pressures of 10, 20, and 30 mTorr. ne was measured using CP, whereas Vp, Vf, Te, and Iisat were measured using LP. The data analysis used 54 experimental datasets, and Figure 4 depicts the average value and standard deviation of each plasma parameter.
The ne and Te values increased with increasing RF power. However, ne and Te decreased with increasing pressure from 10 to 30 mTorr.
The Va value is defined as the acceleration voltage, and it is the difference between the plasma potential and floating potential (Vp − Vf). For non-bias substrates, the energy of the particles incident on the substrates was determined by Va. In this experiment, the measured Va decreased with increasing pressure.
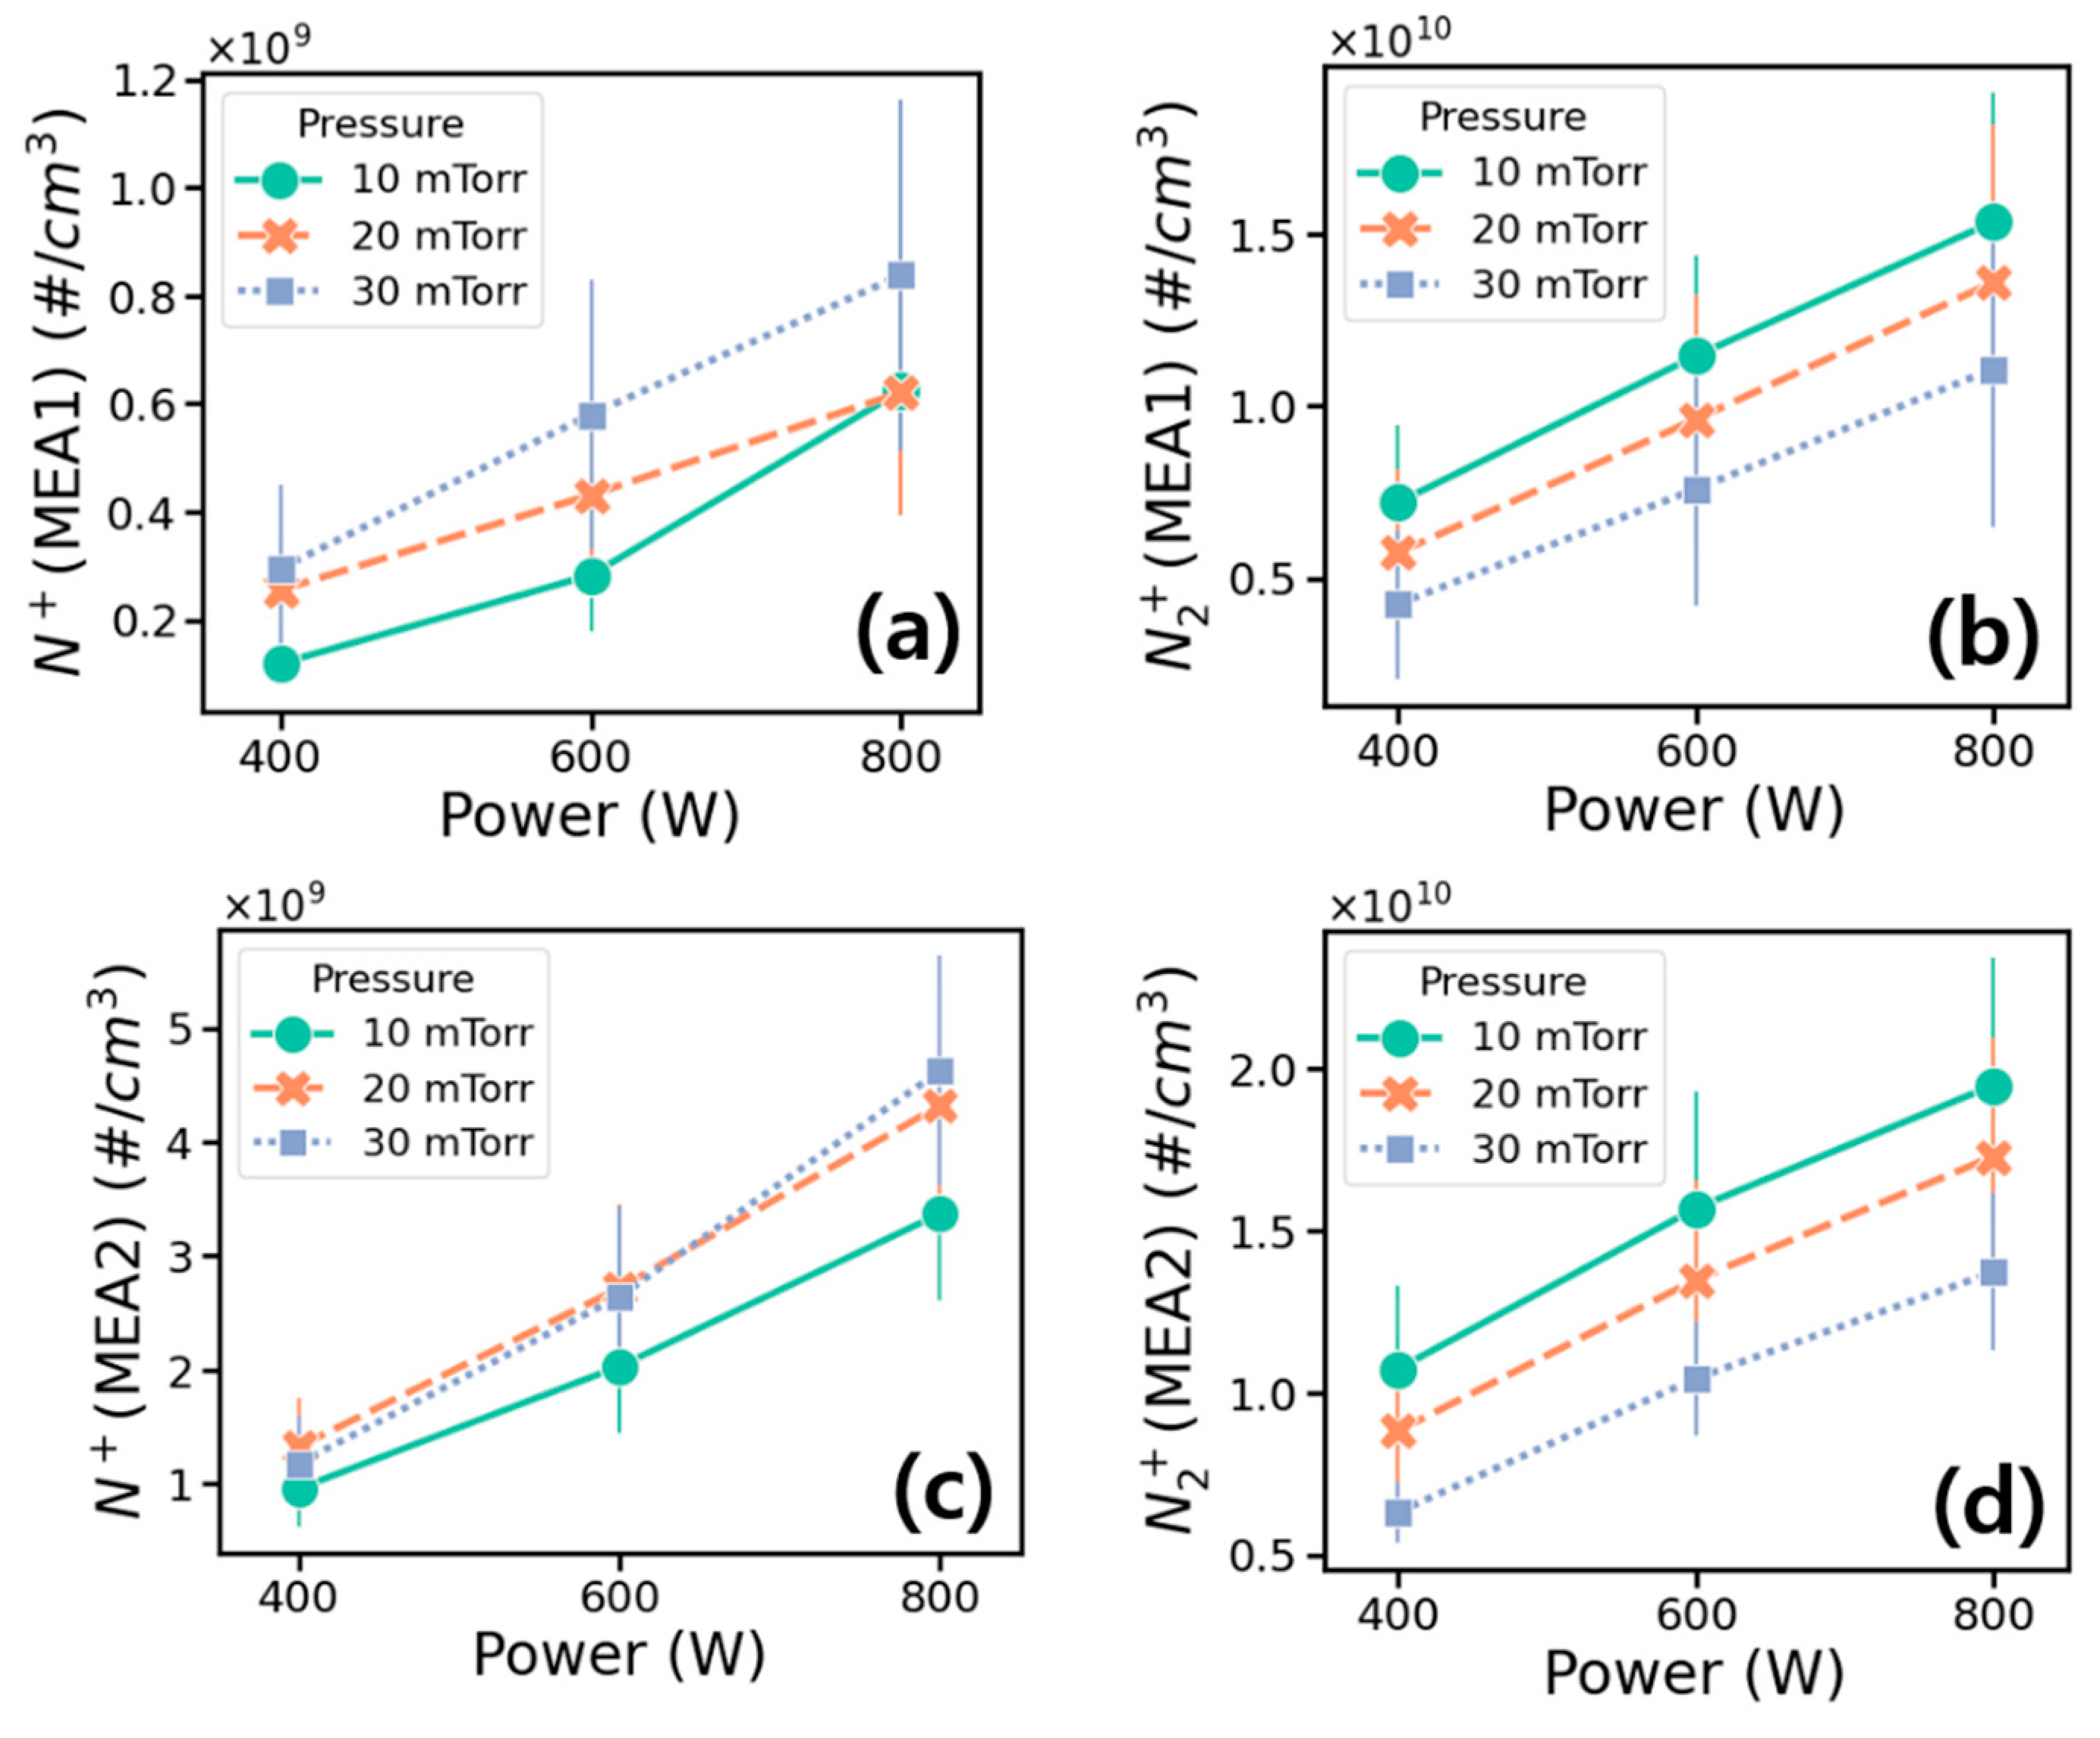
Figure 5 depicts the density values of the ionic species measured with MEA1 and MEA2; this represents the density values of the N2+ and N+ ionic species measured through pinholes of the MEA1 (wall) and MEA2 (substrate). The ion energy distributions (IEDs) of four ionic species (N2+, N+, H2O+, and O2+) were measured, according to the experimental conditions, to obtain relative ratio values. Further, the density values of each ionic species were calculated using the ion saturation current and electron temperature values measured by the LP. The measured relative ratios of H2O+ and O2+ ions were less than 0.02% and 0.1%, respectively, which were not included in the analysis results. The N2+ density changes were similar to those of the electron density changes. The N2+ density increased with increasing power and tended to decrease with increasing pressure. However, the N+ density tended to increase with increasing pressure.
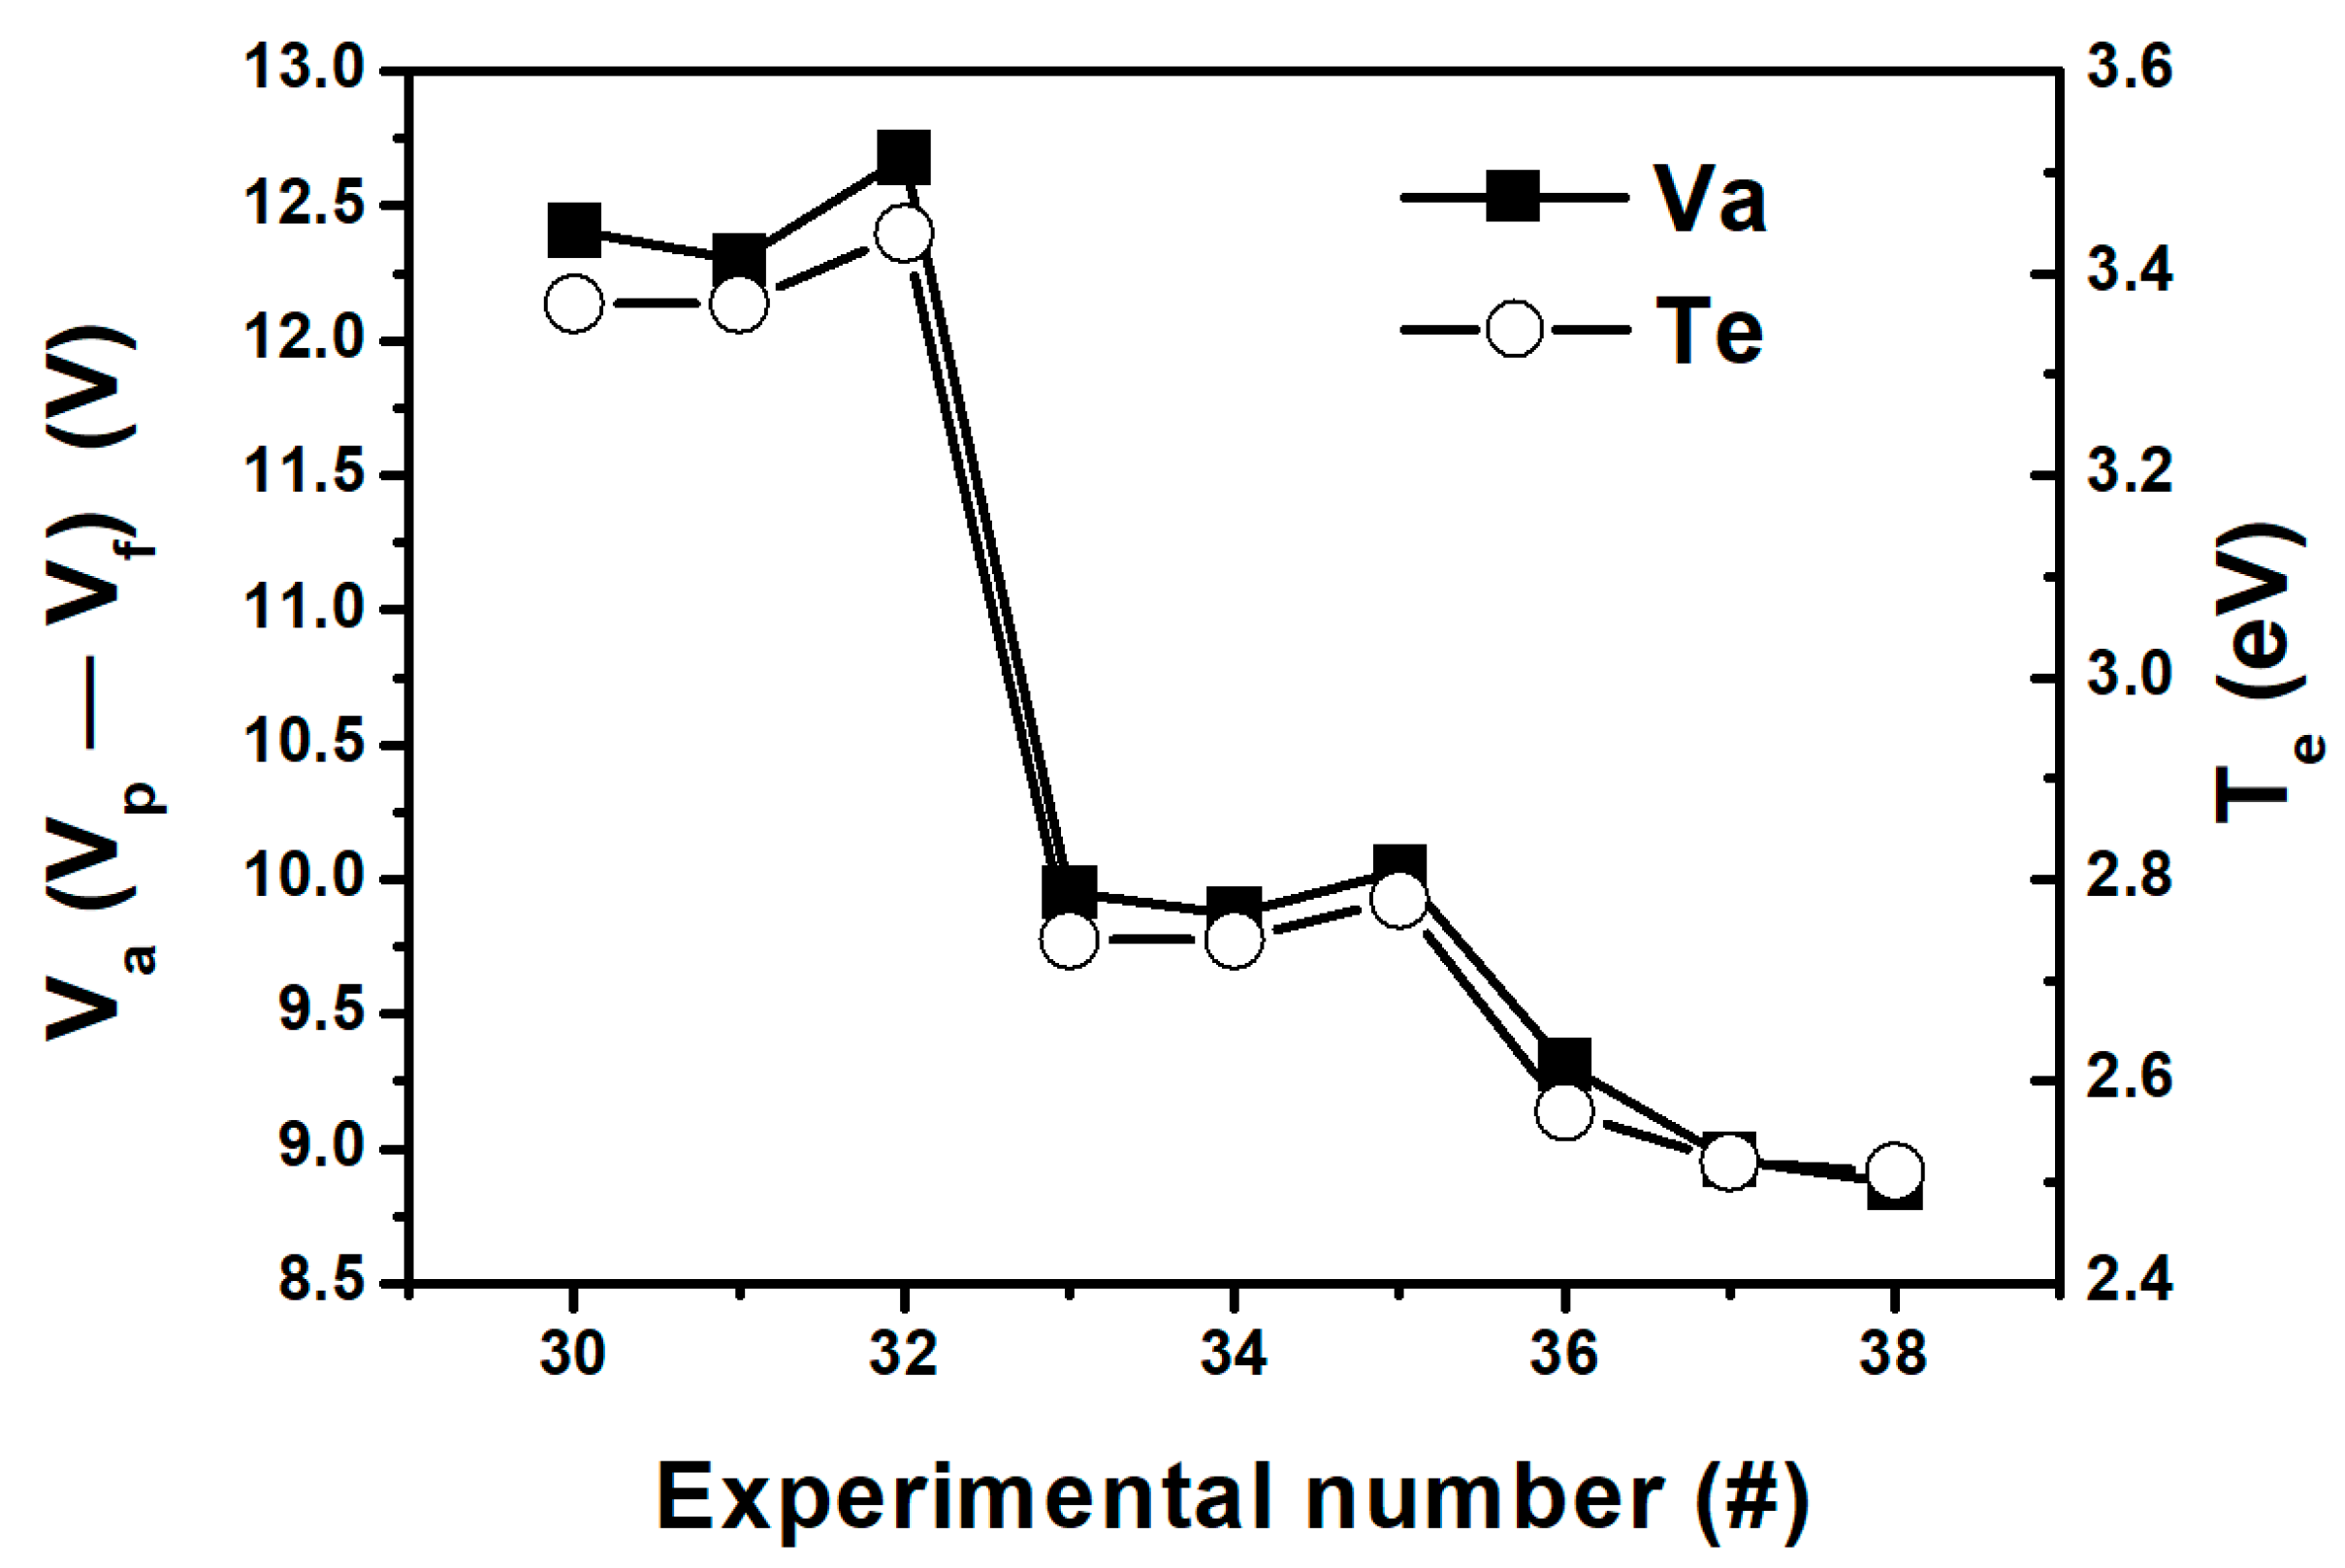
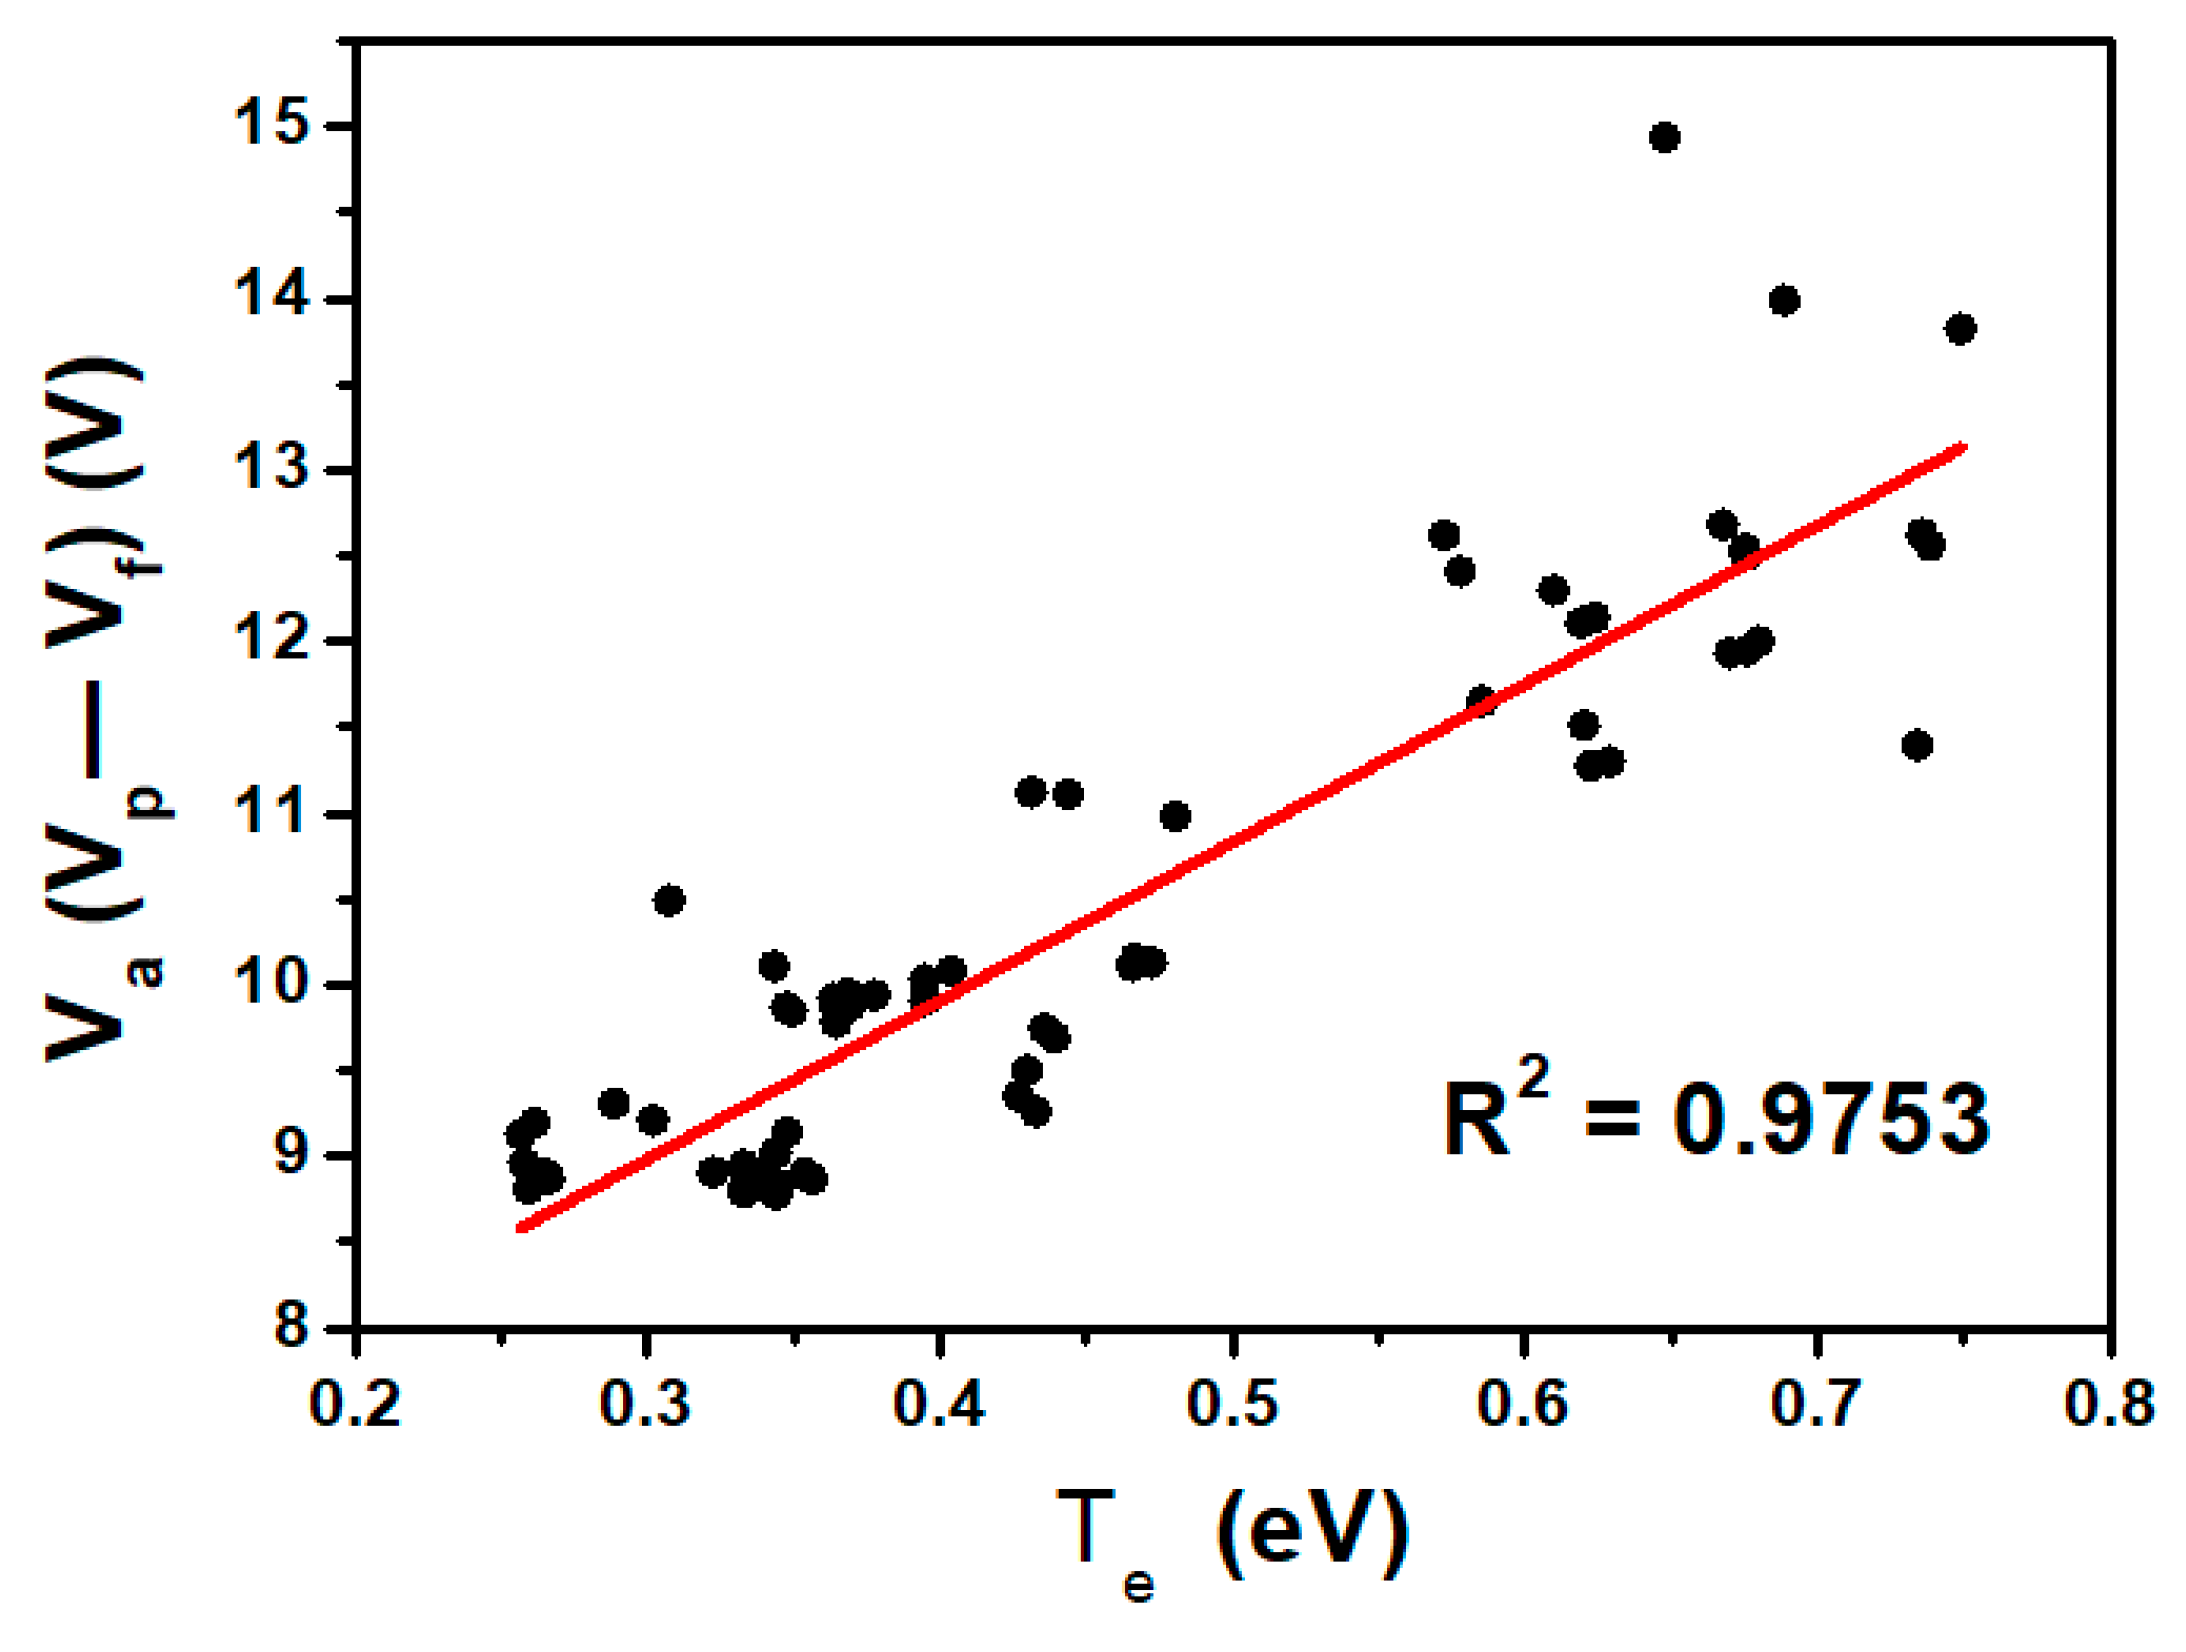
We further investigated the relationship between Te and Va. Te and Va were compared in nine sets of data for experimental numbers 30-38. Figure 6 depicts the changing shapes of Te and Va matching each other, which implies that the correlation between Te and Va is extremely close. For Va and Te, regression analysis was performed on the entire measurement data for more accurate correlation analysis. The regression results show that the coefficient of Te and Va was 0.9753, as depicted in Figure 7. This result implies the possibility of inferring Te through Va.
In this experiment, there were several variables such as ne, Vp, Vf, and ionic species density. To determine whether a correlation exists between these plasma parameters, the correlation between all the measured plasma factors was evaluated using regression analysis. The results are described in the next section.
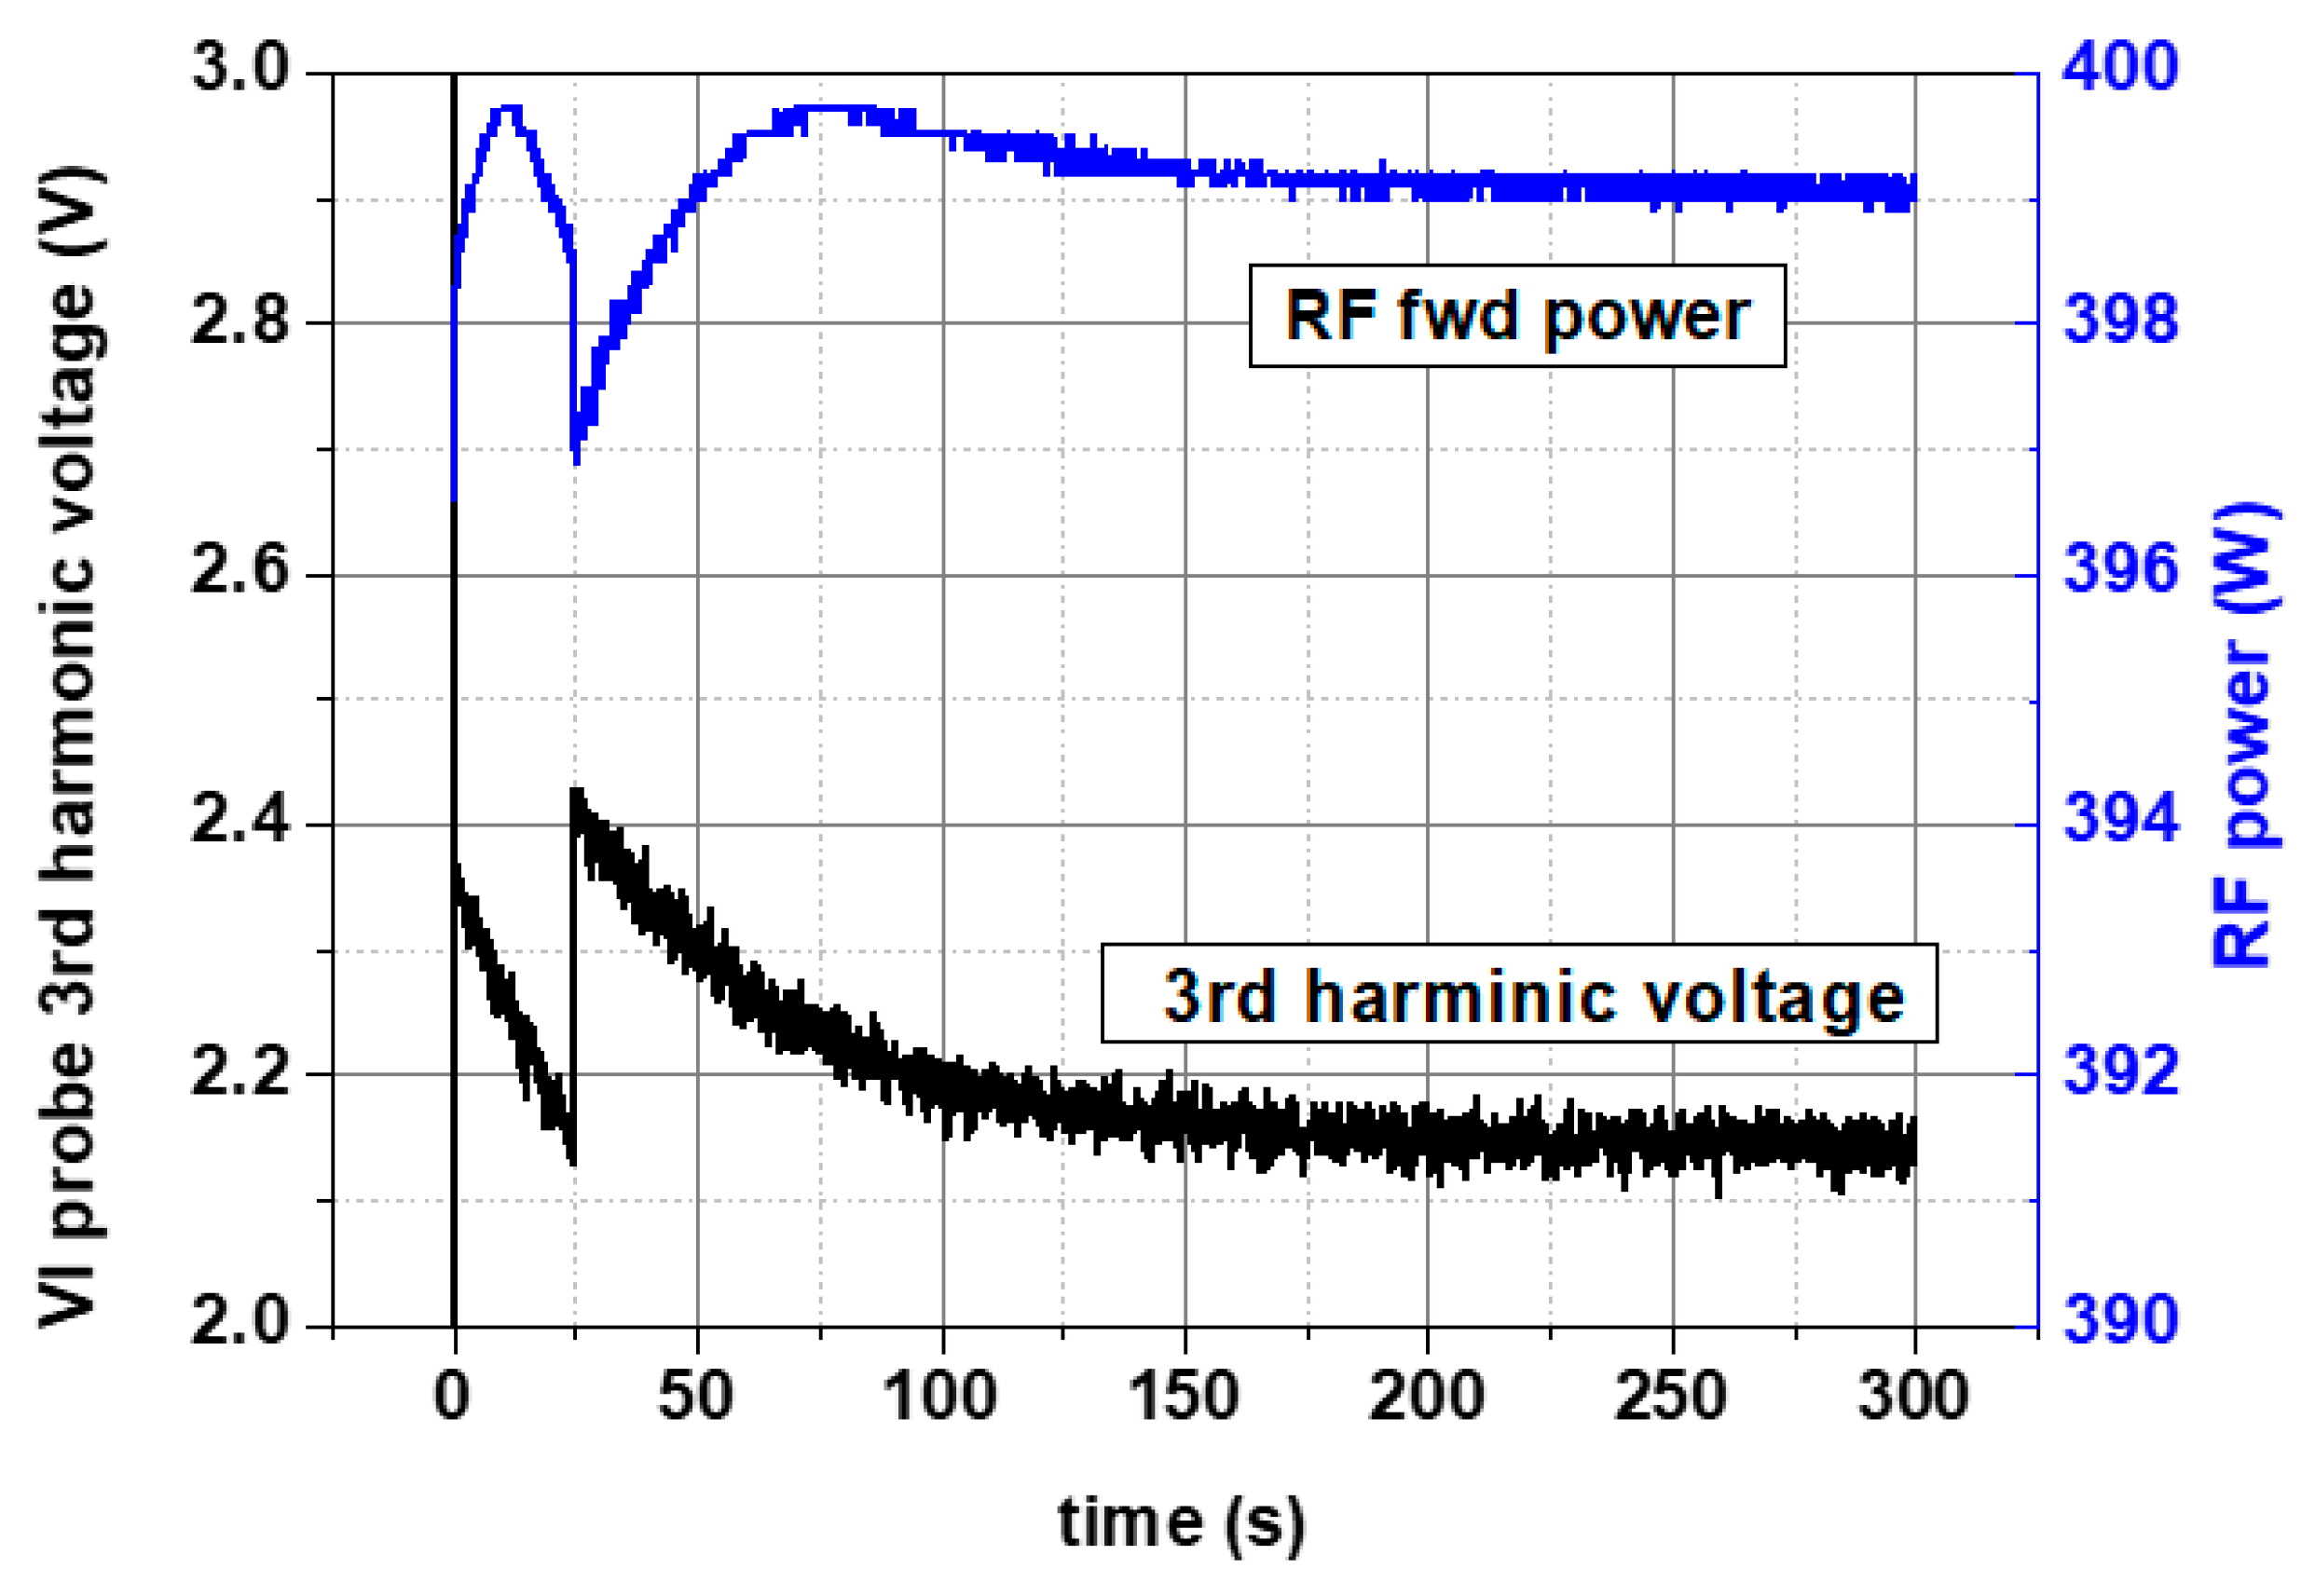
RF forward power data and measurement data of the VI probe installed on the antennas were investigated to verify the RF power characteristics. RF forward power exhibited instability (approximately 1% of applied power) until approximately 100 s after the process began and subsequently, it stabilized. Simultaneously, the VI probe measurement data indicated that the voltage component of the third harmonic was similar to the RF forward power variation (Figure 8). RF power significantly affects the plasma characteristics and process results. The association of VI probe-specific harmonics with these RF power changes indicated that VI probe-specific harmonics might be associated with plasma parameters or process results. Therefore, the association between nine of the VI harmonic components (first to third harmonic and voltage, current, and phase for each harmonic) and plasma parameters were investigated through regression. These results are described in the following section.
4. Correlation between Measurement Data
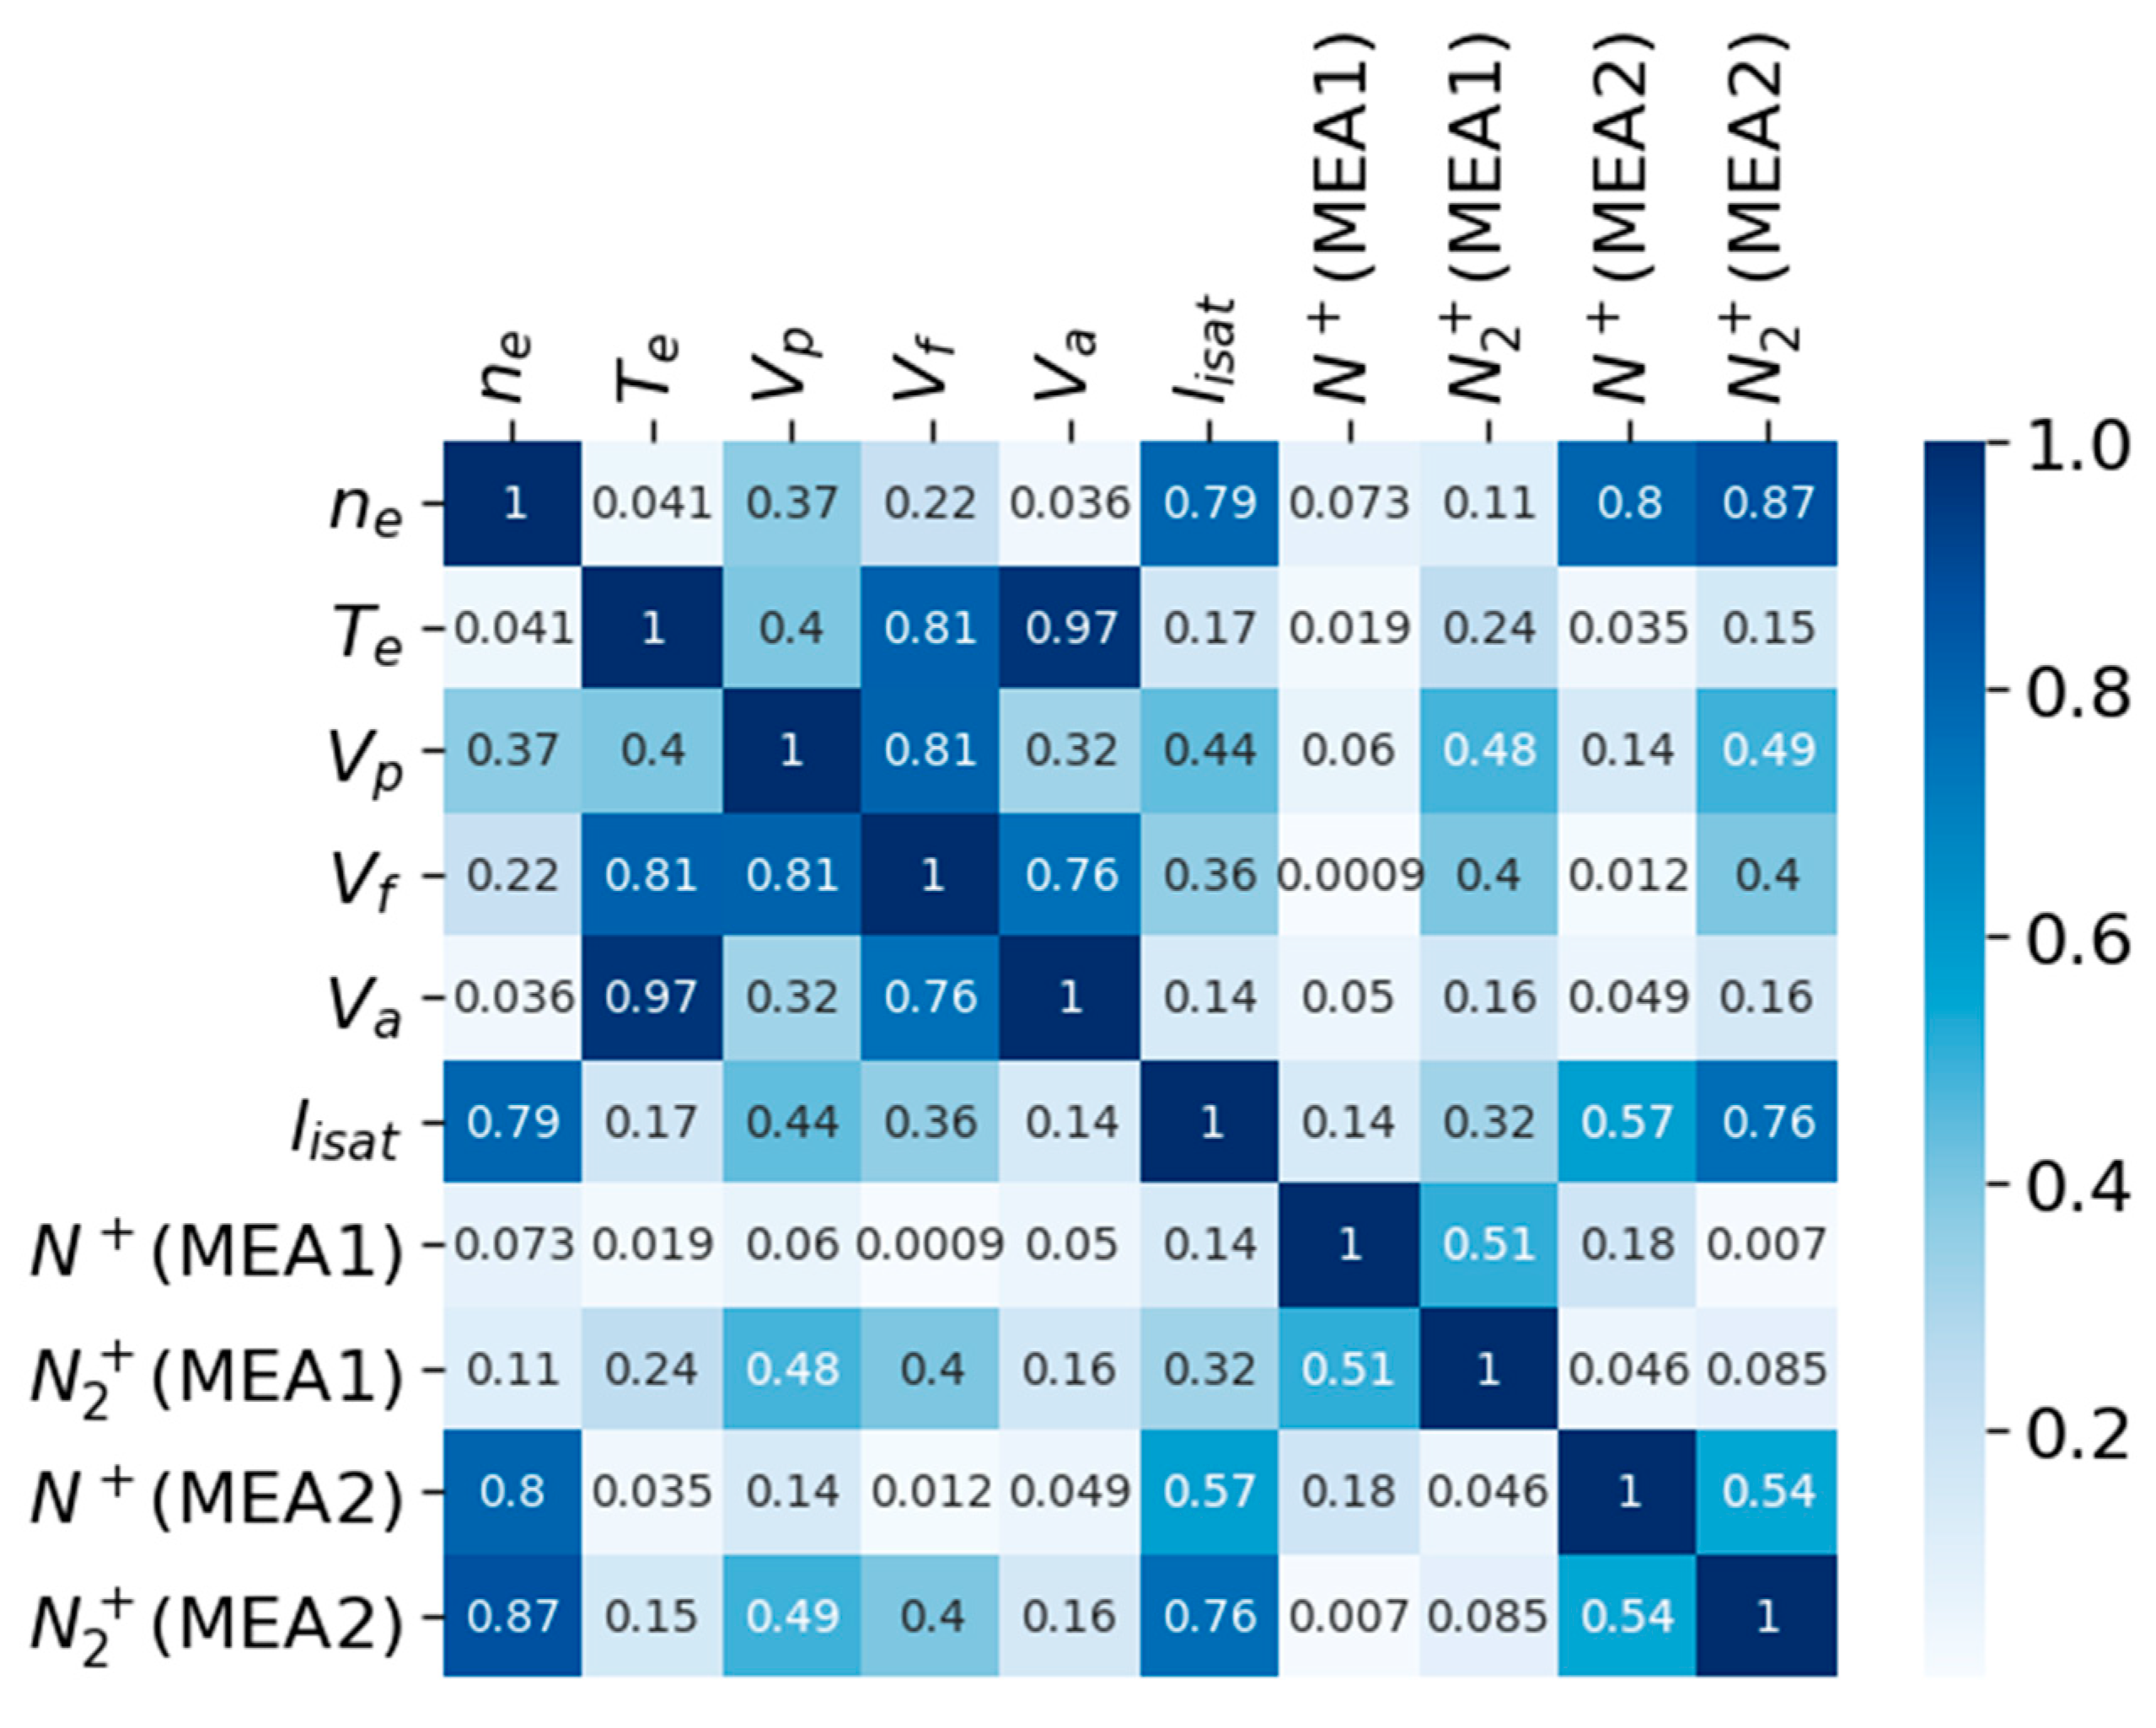
Regression analysis by the coefficient of determination (R2) method was used to correlate the plasma parameter data [10]. There are a total of eight plasma parameters (ne, Te, Vp, Vf, Va, Iisat, N+, and N2+); N+ and N2+ used data measured by MEA2. The data used for the regression analysis were 54 sets of experimental data. Figure 9 depicts the results of the correlation regression between the plasma parameters. The results with an R2 value of 0.8 or higher out of a total of 45 analysis results are summarized in Table 1.
The high correlation between Va and Te has already been explained. Since Va is defined as Vp − Vf, Te can also be expected to correlate with Vp and Vf. However, the R2 for Te vs. Vf was 0.81, but Te vs. Vp was 0.4, and the result was low.
In general, the ion density variation depended on the ne, and as a result, the Iisat measured on the LP also changed. Thus, ne and Iisat are expected to be closely related, with a regression analysis showing an R2 of 0.79. The ne value was also highly correlated with the N+ and N2+ densities measured in MEA2, and the R2 was ≥ 0.8. The results of the correlation between the plasma parameters indicate that Va is closely related to Te, and ne is highly correlated to the ionic species N+ and N2+.
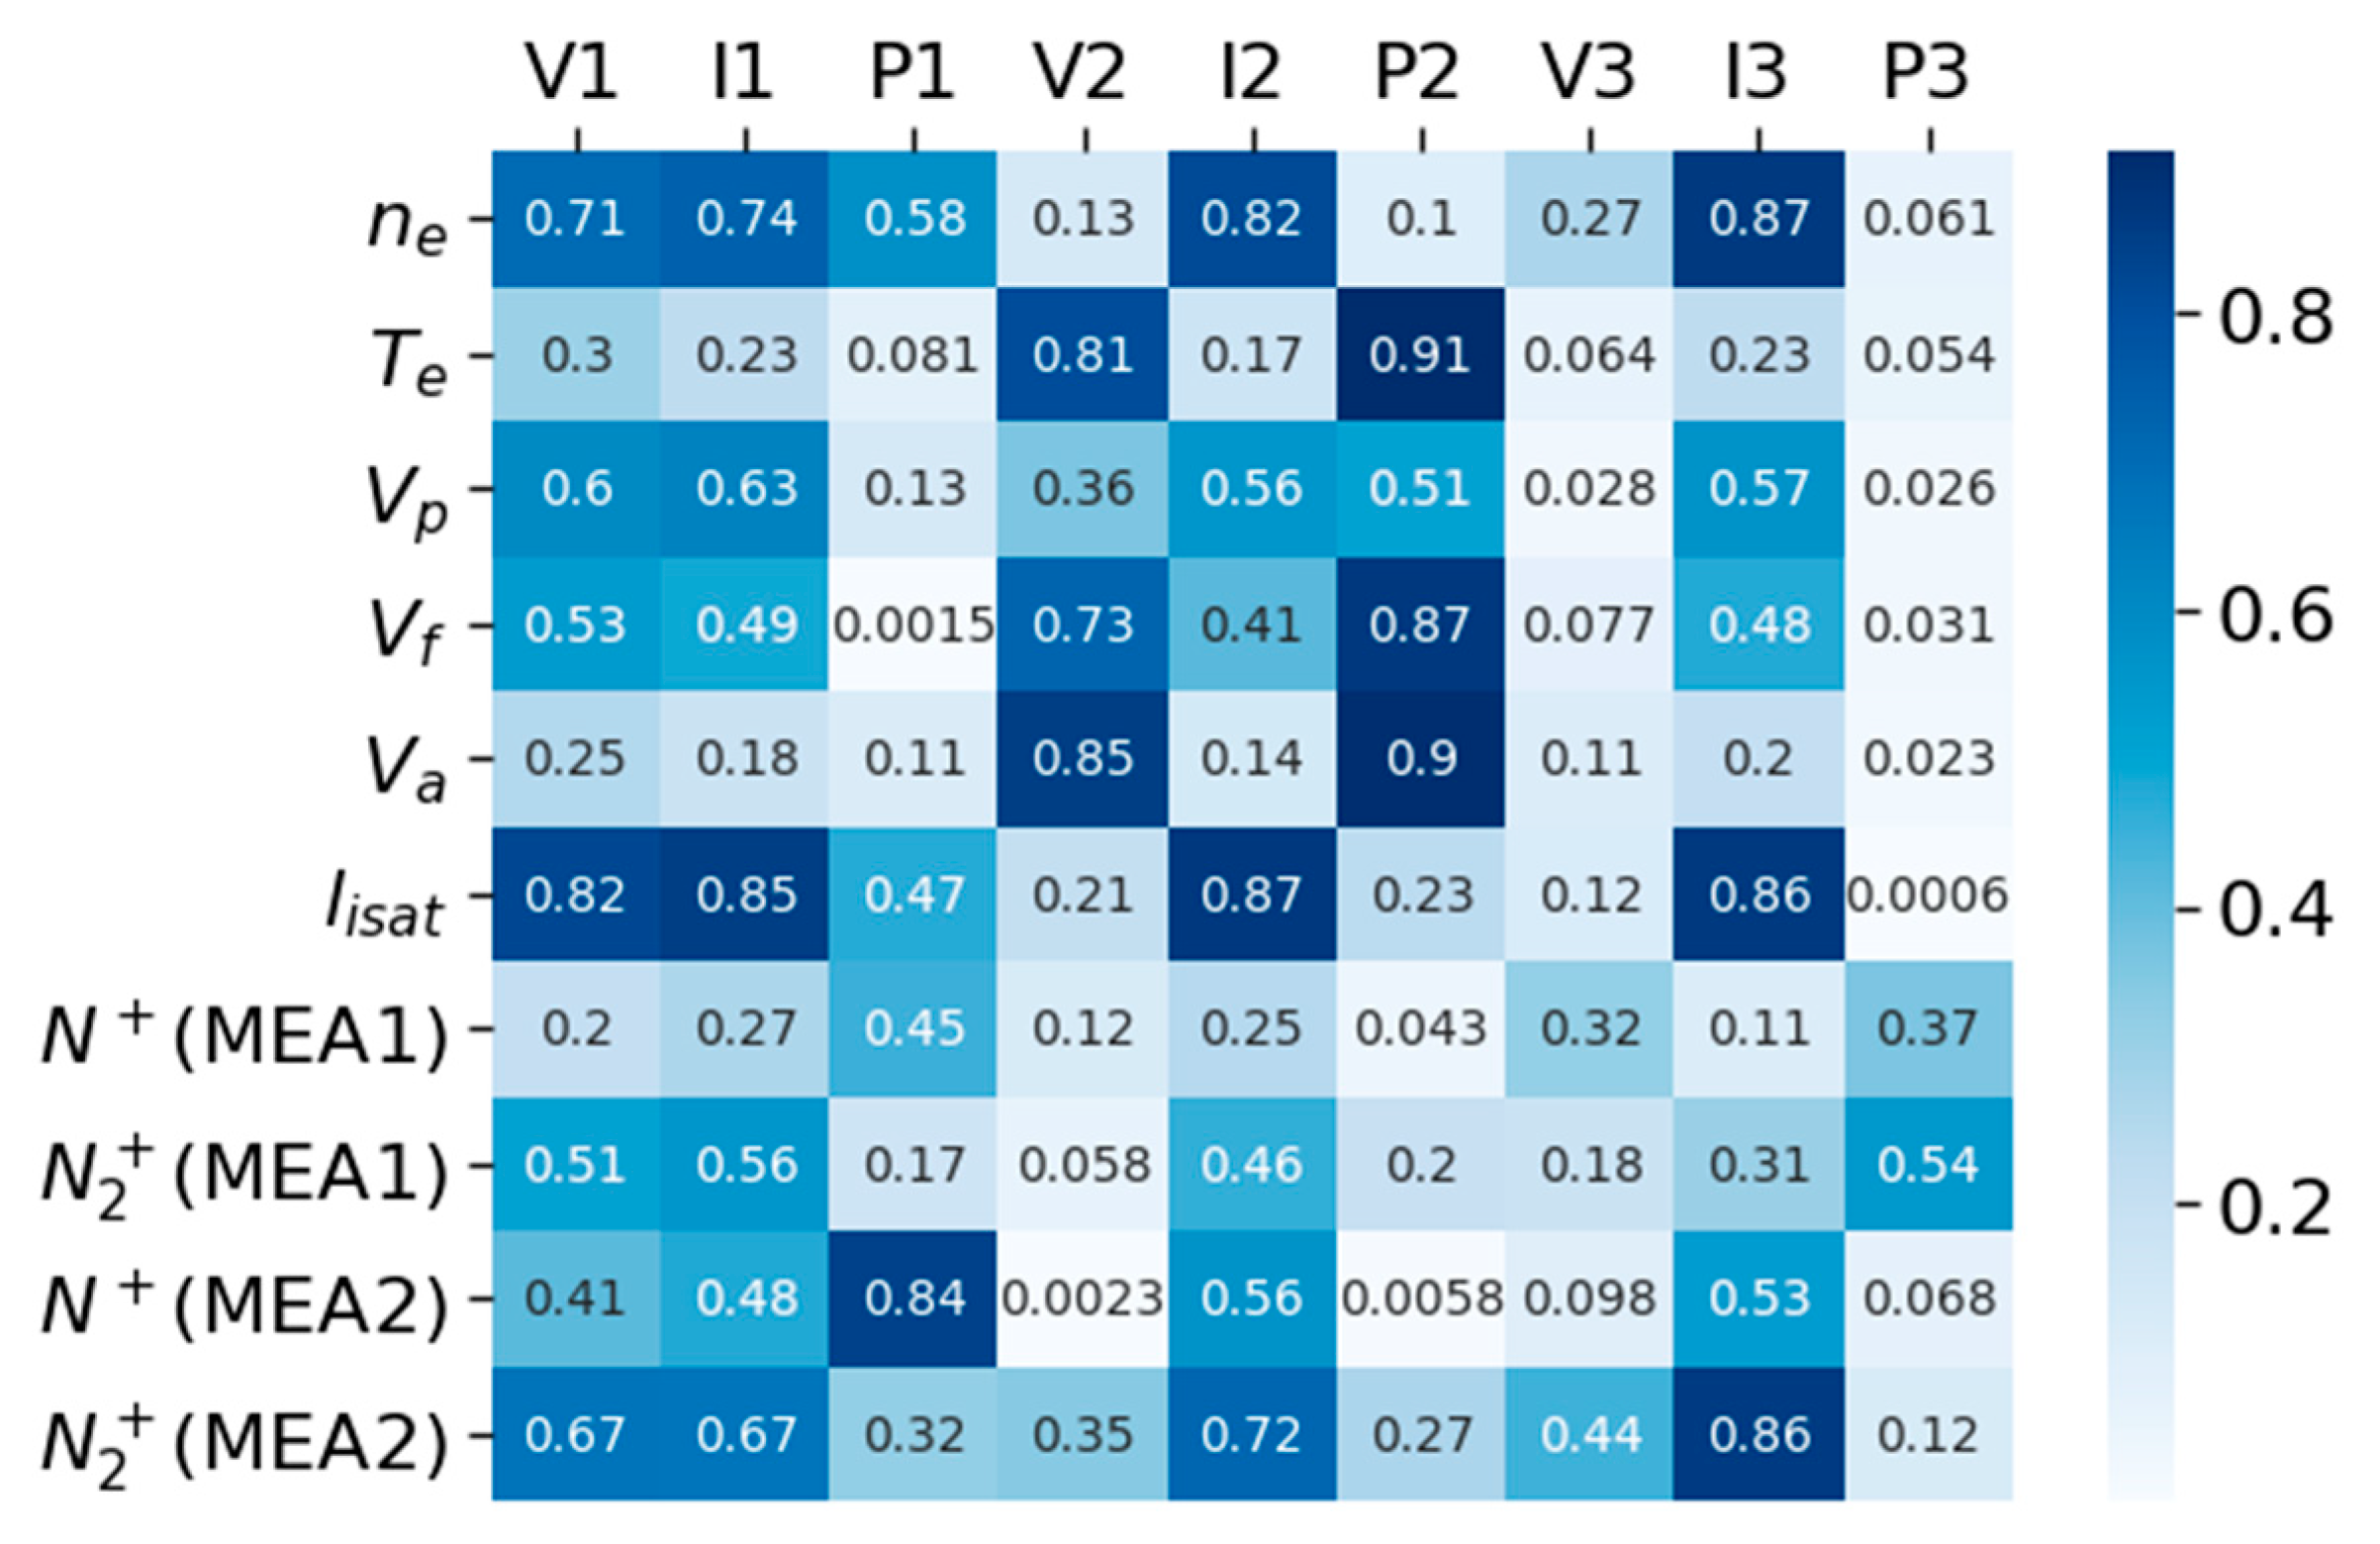
The correlation between the plasma parameters and VI probe (VI1, antenna) was also analyzed by regression. The plasma parameters used in the analysis were ne, Te, Vp, Vf, Va, Iisat, N+, and N2+. N+ and N2+ were measured in MEA1 and MEA2, respectively. The VI1 analysis data are V1–V3, I1–I3, and P1–P3, which indicate each harmonic’s voltage, current, and phase, with harmonics ranging from the first to the third. Therefore, 90 correlations were analyzed. The regression results are depicted in Figure 10. Table 2 presents the factors with an R2 of 0.8 or higher. In the analysis of the plasma parameters, Te was highly correlated to Va. Te and Va are also commonly linked to P2 in their relationship with VI. The R2 for Te with P2 was 0.908, and that for Va with P2 was 0.90. This result implies that there is a possibility of estimating Te using the VI probe P2 data. The I3 component was highly correlated to ne, Iisat, and MEA2 N2+, and the coefficients were above 0.85. These ne, Iisat, and N2+ values were related to plasma density, indicating that I3 was highly related to the plasma density.
The N+ and N2+ factors measured in MEA1 and MEA2 were also related to the plasma density. However, the ionic species of MEA1 had a low coefficient of determination with I3. The coefficient of N2+ MEA2 was 0.86 I3. However, N2+ MEA1 was only 0.31.
In this study, ne, Te, and Va were measured using a CP and LP. CP and LP are typical invasive measurements; these cannot be used in plasma processing. MEA2 is also a measuring device that is difficult to use in plasma processing. In contrast, the VI probe is a non-invasive measurement method and is one of the few tools that can be used without affecting the plasma process. Based on the high correlation between the VI probe factor and the plasma parameters observed in this study, it can be expected that the plasma process parameters can be diagnosed in real-time using a non-invasive method.
5. Conclusions
Various diagnostic tools were constructed, and plasma parameters were measured and analyzed for the intelligence evaluation of plasma process equipment. The correlation between the measured data was investigated using regression analysis. According to the correlation analysis between the plasma parameters, Va was highly correlated to Te, and ne was highly correlated to the ionic species density. The correlation analysis between the plasma parameters and VI probes indicated that the P2 and I3 components of the VI probe were significantly closely related to the plasma parameters, including the ionic species density. Our results indicate the possibility of inferring the plasma parameters and ionic species density from the VI probes. Therefore, if the correlation between the data obtained from non-invasive measurement devices and plasma parameters can be further studied, it can be expected that a technology capable of plasma diagnosis in real-time will be developed in plasma process equipment.
Author Contributions
Conceptualization, Y.-H.K., D.-C.K. and Y.-W.K.; experimental work, Y.-H.K., J.-H.C., D.-C.K., J.-B.P. and Y.-W.K.; writing—original draft preparation, Y.-H.K., J.-H.C., J.-B.P., J.-S.K.; writing—review and editing, Y.-H.K., J.-S.K. All authors have read and agreed to the published version of the manuscript.
Funding
This work was supported by the National Research Council of Science & Technology (NST) grant provided by the Korean government (MSIT) (No. CRC-20-01-NFRI) and R&D Program of “Plasma BigData ICT Convergence Technology Research Project (code No. 1711124799)” through the Korea Institute of Fusion Energy (KFE) funded by the Government funds, Republic of Korea.
Institutional Review Board Statement
Not applicable.
Informed Consent Statement
Not applicable.
Data Availability Statement
Data sharing is not applicable to this article.
Conflicts of Interest
The authors declare no conflict of interest.
References
- Profijt, H.B.; Potts, S.E.; van de Sanden, M.C.M.; Kessels, W.M.M. Plasma-Assisted Atomic Layer Deposition: Basic, Opportunities, and Challenges. J. Vac. Sci. Technol. A 2011, 29, 050801. [Google Scholar] [CrossRef] [Green Version]
- Kanarik, K.J.; Lill, T.; Hudson, E.A.; Sriraman, S.; Tan, S.; Marks, J.M.; Vahedi, V.; Gottscho, R.A. Overview of Atomic Layer Etching in the Semiconductor Industry. J. Vac. Sci. Technol. A 2015, 33, 020802. [Google Scholar] [CrossRef] [Green Version]
- Lieberman, M.A.; Lichtenberg, A.J. Principles of Plasma Discharges and Materials Processing; Wiley-Interscience: Hoboken, NJ, USA, 2005; pp. 387–534. [Google Scholar]
- Umeda, S.; Nogi, K.; Shiraishi, D.; Kagoshima, A. Advanced Process Control Using Virtual Metrology to Cope With Etcher Condition Change. IEEE Trans. Semicond. Manuf. 2019, 32, 423–427. [Google Scholar] [CrossRef]
- Tin, T.C.; Tan, S.C.; Yong, H.; Kim, J.O.H.; Teo, E.K.Y.; Lee, C.K.; Than, P.; Tan, A.P.S.; Phang, S.C. A Realizable Overlay Virtual Metrology System in Semiconductor Manufacturing: Proposal Challenges and Future Perspective. IEEE Access 2021, 9, 65418–65439. [Google Scholar] [CrossRef]
- Samukawa, S.; Hori, M.; Rauf, S.; Tachibana, K.; Bruggeman, P.; Kroesen, G.; Whitehead, J.C.; Murphy, A.B.; Gutsol, A.F.; Starikovskaia, S.; et al. The 2012 Plasma Roadmap. J. Phys. D Appl. Phys. 2012, 45, 253001. [Google Scholar] [CrossRef]
- Kanarik, K.J. Inside the mysterious world of plasma: A process engineer’s perspective. J. Vac. Sci. Technol. A 2020, 38, 031004. [Google Scholar] [CrossRef] [Green Version]
- Kim, J.-H.; Seong, D.-J.; Lim, J.-Y.; Chung, K.-H. Plasma frequency measurements for absolute plasma density by means of wave cutoff method. Appl. Phys. Lett. 2003, 83, 4725. [Google Scholar] [CrossRef]
- Kim, J.-H.; Choi, S.-C.; Shin, Y.-H.; Chung, K.-H. Wave cutoff method to measure absolute electron density in cold plasma. Rev. Sci. Instrum. 2004, 75, 2706. [Google Scholar] [CrossRef]
- Abdi, H. Multiple correlation coefficient. In Encyclopedia of Measurement and Statistics; Salkind, N.J., Ed.; SAGE Publications Inc.: Thousand Oaks, CA, USA, 2007; pp. 648–651. [Google Scholar]
Figure 1.
Schematic of the experimental device: VI probe (VI1, VI2), Mass/energy analyzer (MEA1, MEA2), residual gas analyzer (RGA), optical emission spectroscopy (OES), self-plasma OES (SPOES), cutoff probe (CP), and Langmuir probe (LP).
Figure 1.
Schematic of the experimental device: VI probe (VI1, VI2), Mass/energy analyzer (MEA1, MEA2), residual gas analyzer (RGA), optical emission spectroscopy (OES), self-plasma OES (SPOES), cutoff probe (CP), and Langmuir probe (LP).

Figure 2.
Integrated data acquisition and analysis (IDAS) configuration.

Figure 3.
Measurement flow chart.

Figure 4.
Plasma parameter results: (a) electron density (ne, #: number of electrons), (b) electron temperature (Te), (c) plasma potential (Vp), (d) floating potential (Vf), (e) acceleration voltage (Va = (Vp − Vf)), (f) ion saturation current (Iisat). Gas flow: 66 sccm (10 mTorr), 119 sccm (20 mTorr), and 174 sccm (30 mTorr).

Figure 5.
N+, N2+ density results. (a,b) are the results of MEA1 (wall); (c,d) are the results of MEA2 (substrate), #: number of ions, experimental condition of N2 Gas flow rate: 66 sccm (10 mTorr), 119 sccm (20 mTorr) and 174 sccm (30 mTorr).
Figure 5.
N+, N2+ density results. (a,b) are the results of MEA1 (wall); (c,d) are the results of MEA2 (substrate), #: number of ions, experimental condition of N2 Gas flow rate: 66 sccm (10 mTorr), 119 sccm (20 mTorr) and 174 sccm (30 mTorr).

Figure 6.
Va and Te results. Experimental number 30–38.

Figure 7.
Va and Te correlation analysis results with regression.

Figure 8.
RF forward power and 3rd harmonic voltage of VI probe (VI1, antenna), RF power 400 W and 10 mTorr pressure.
Figure 8.
RF forward power and 3rd harmonic voltage of VI probe (VI1, antenna), RF power 400 W and 10 mTorr pressure.

Figure 9.
Regression results between the plasma parameters.

Figure 10.
Regression results between the plasma parameters and harmonics of VI probe (VI1).


Table 1.
Regression results between the plasma parameters for an R2 > 0.8.
| Ranking | Parameters | R2 Score |
|---|---|---|
| 1 | Te vs. Va | 0.9692 |
| 2 | ne vs. MEA2 N2+ | 0.8745 |
| 3 | Te vs. Vf | 0.8112 |
| 4 | Vf vs. Vp | 0.8065 |
| 5 | ne vs. MEA2 N+ | 0.8003 |
Table 2.
Regression results between the plasma parameter and VI probe (VI1) factors for R2 > 0.8.
| Ranking | Parameters | R2 Score |
|---|---|---|
| 1 | Te vs. P2 | 0.908648 |
| 2 | Va vs. P2 | 0.900971 |
| 3 | Iisat vs. I2 | 0.869040 |
| 4 | Vf vs. P2 | 0.866413 |
| 5 | ne vs. I3 | 0.865170 |
| 6 | Iisat vs. I3 | 0.863139 |
| 7 | MEA2 N2+ vs. I3 | 0.859977 |
| 8 | Iisat vs. I1 | 0.854285 |
| 9 | Va vs. V2 | 0.852761 |
| 10 | MEA2 N+ vs. P1 | 0.842142 |
| 11 | Iisat vs. V1 | 0.823521 |
| 12 | ne vs. I2 | 0.815001 |
| 13 | Te vs. V2 | 0.808139 |
Publisher’s Note: MDPI stays neutral with regard to jurisdictional claims in published maps and institutional affiliations. |
© 2021 by the authors. Licensee MDPI, Basel, Switzerland. This article is an open access article distributed under the terms and conditions of the Creative Commons Attribution (CC BY) license (https://creativecommons.org/licenses/by/4.0/).
Share and Cite
MDPI and ACS Style
Kim, Y.-H.; Cho, J.-H.; Kim, J.-S.; Park, J.-B.; Kim, D.-C.; Kim, Y.-W. Comprehensive Data Collection Device for Plasma Equipment Intelligence Studies. Coatings 2021, 11, 1025. https://0-doi-org.brum.beds.ac.uk/10.3390/coatings11091025
AMA Style
Kim Y-H, Cho J-H, Kim J-S, Park J-B, Kim D-C, Kim Y-W. Comprehensive Data Collection Device for Plasma Equipment Intelligence Studies. Coatings. 2021; 11(9):1025. https://0-doi-org.brum.beds.ac.uk/10.3390/coatings11091025
Chicago/Turabian StyleKim, Yong-Hyun, Ji-Ho Cho, Jong-Sik Kim, Jong-Bae Park, Dae-Chul Kim, and Young-Woo Kim. 2021. "Comprehensive Data Collection Device for Plasma Equipment Intelligence Studies" Coatings 11, no. 9: 1025. https://0-doi-org.brum.beds.ac.uk/10.3390/coatings11091025
Note that from the first issue of 2016, this journal uses article numbers instead of page numbers. See further details here.