
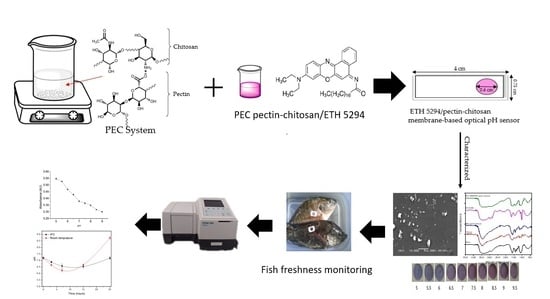
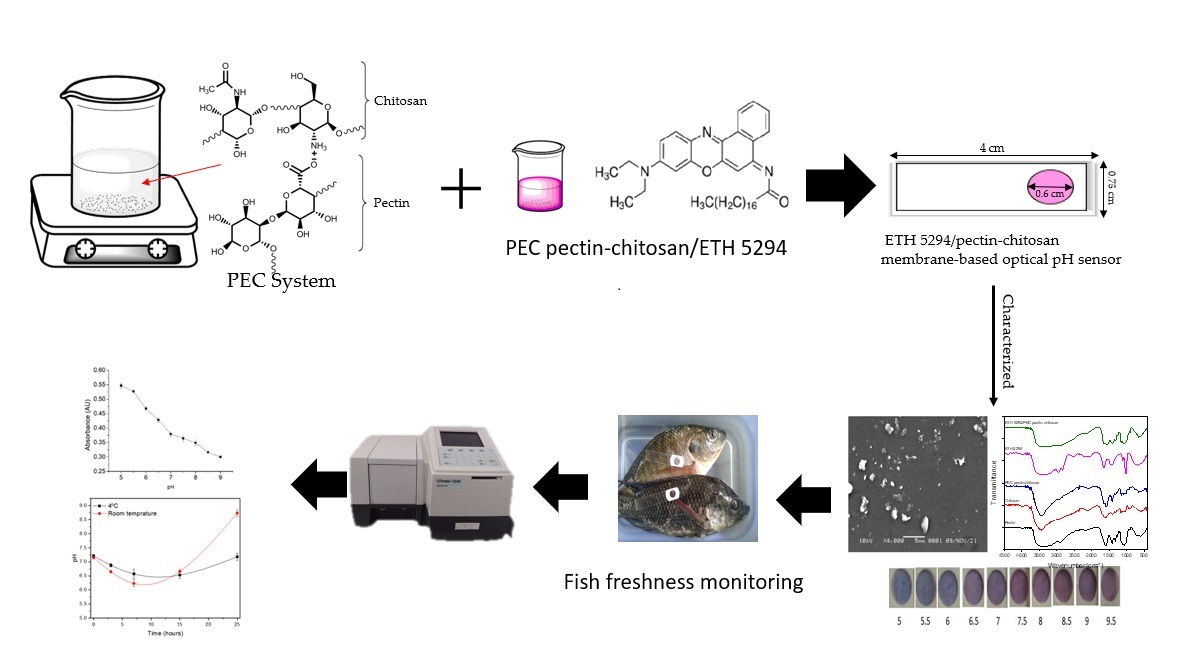
Fabrication of an Immobilized Polyelectrolite Complex (PEC) Membrane from Pectin-Chitosan and Chromoionophore ETH 5294 for pH-Based Fish Freshness Monitoring

 ,
,  ,
,  , and
, and 
Abstract
:
1. Introduction
2. Materials and Methods
2.1. Materials
2.2. Fabrication of Optical pH Sensor
2.3. Characterization of the Fabricated Optical pH Sensor
2.4. Optimization and Sensor Performance
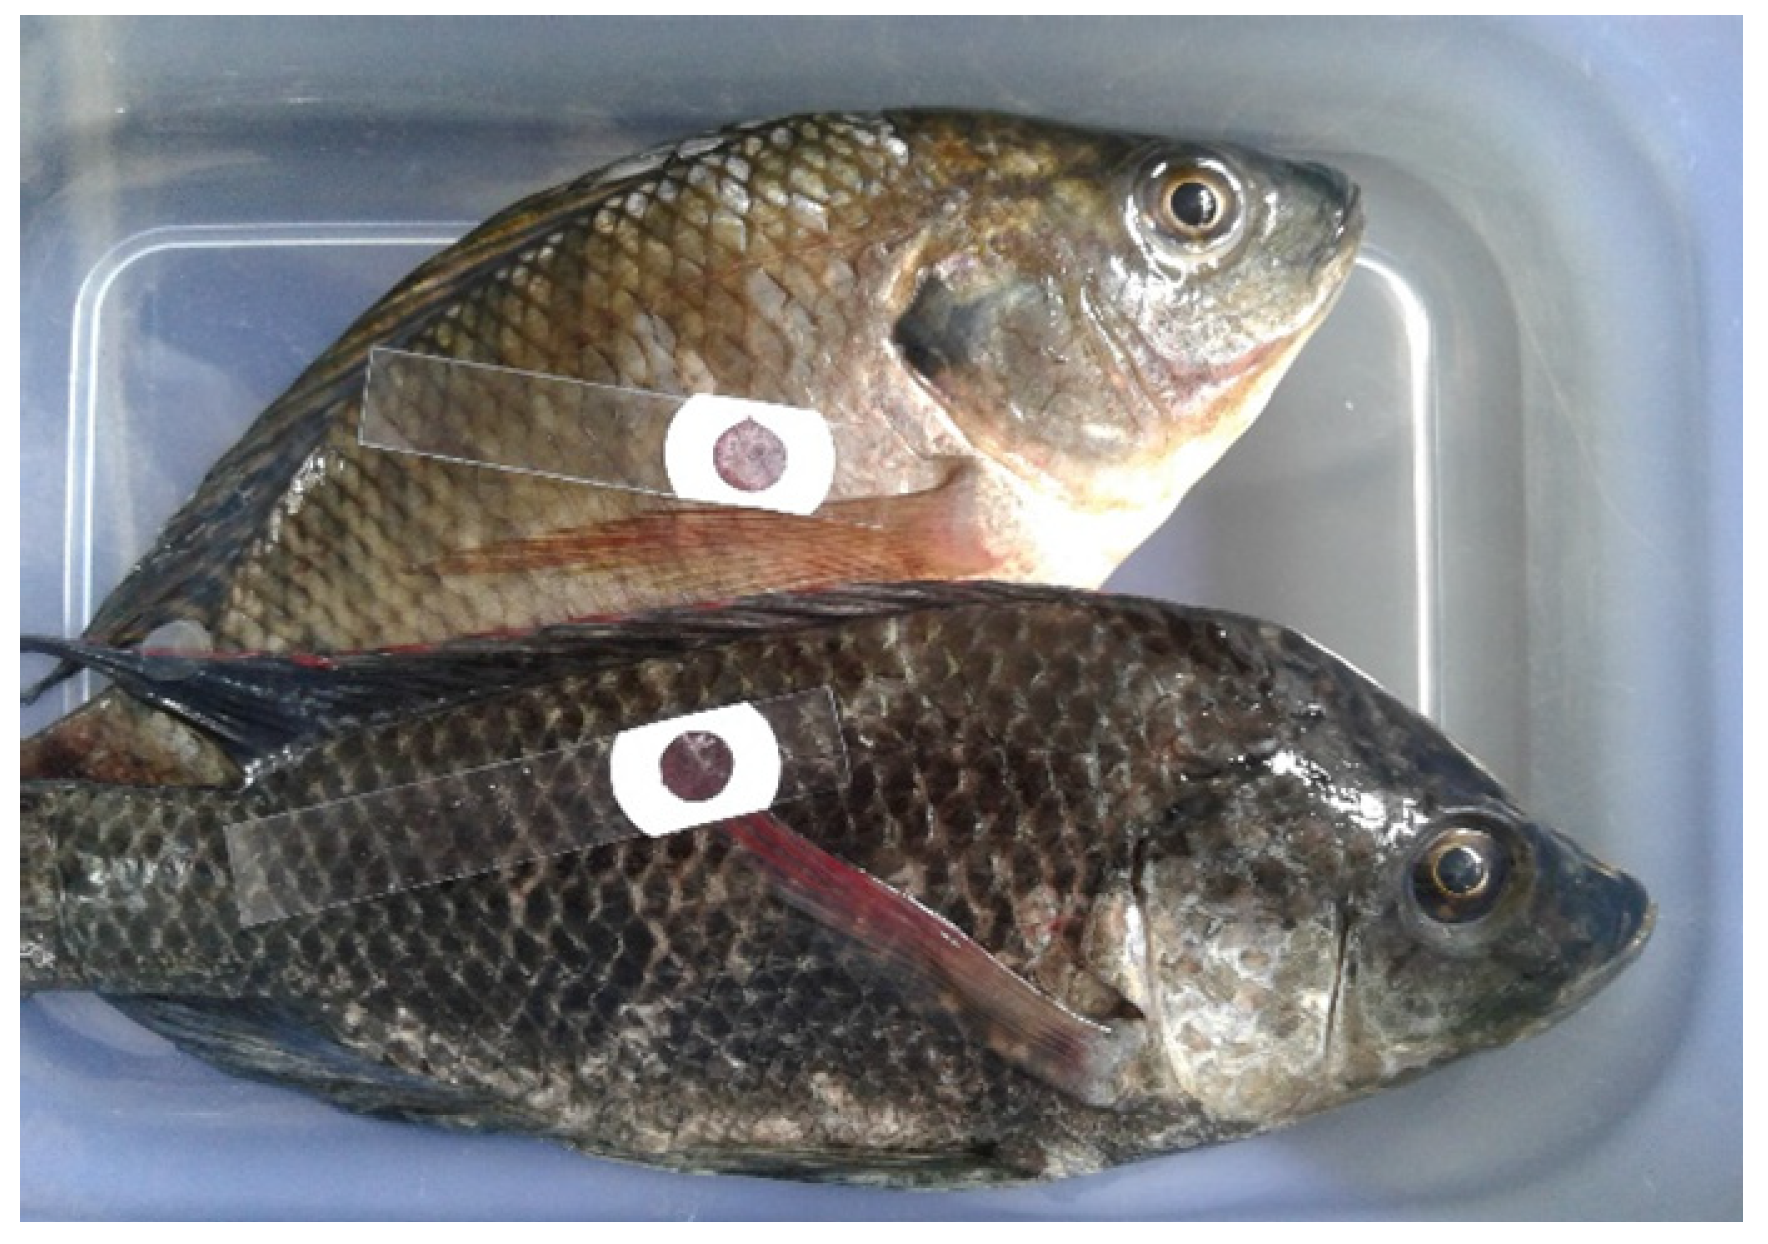
2.5. Application on Tilapia Fish
3. Results and Discussion
3.1. Optimum Ratio of Pectin and Chitosan
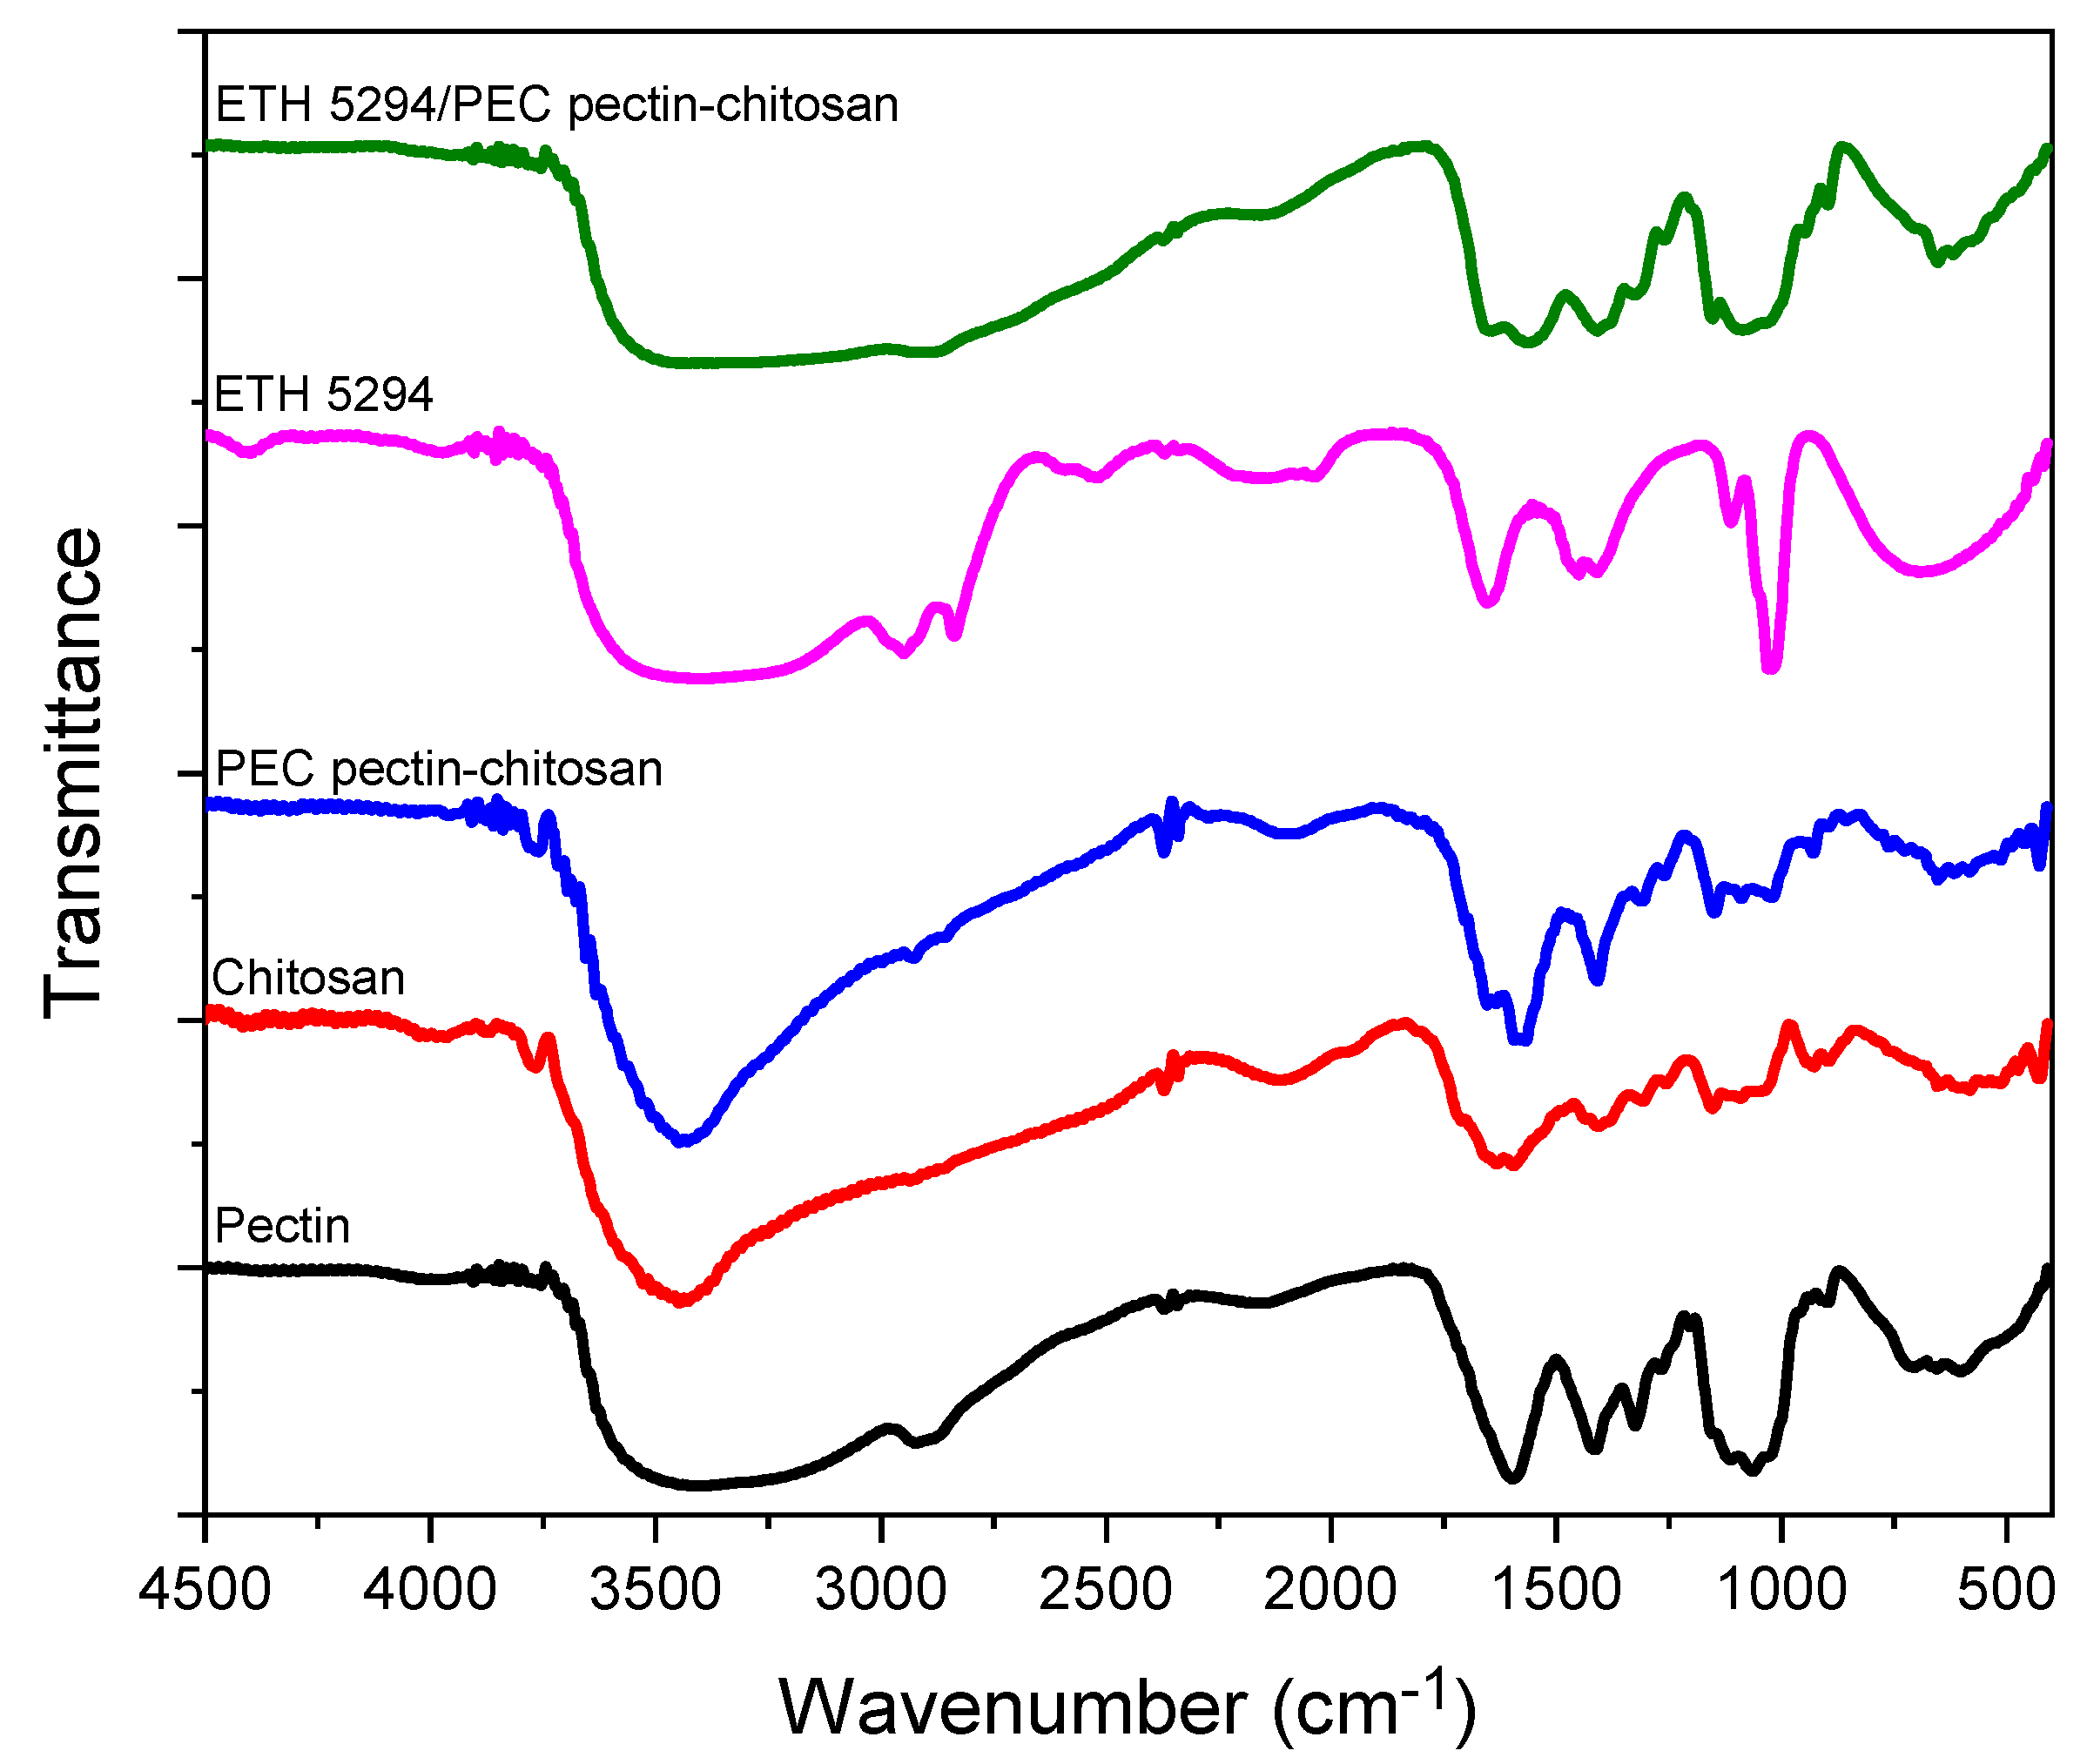
3.2. FT-IR
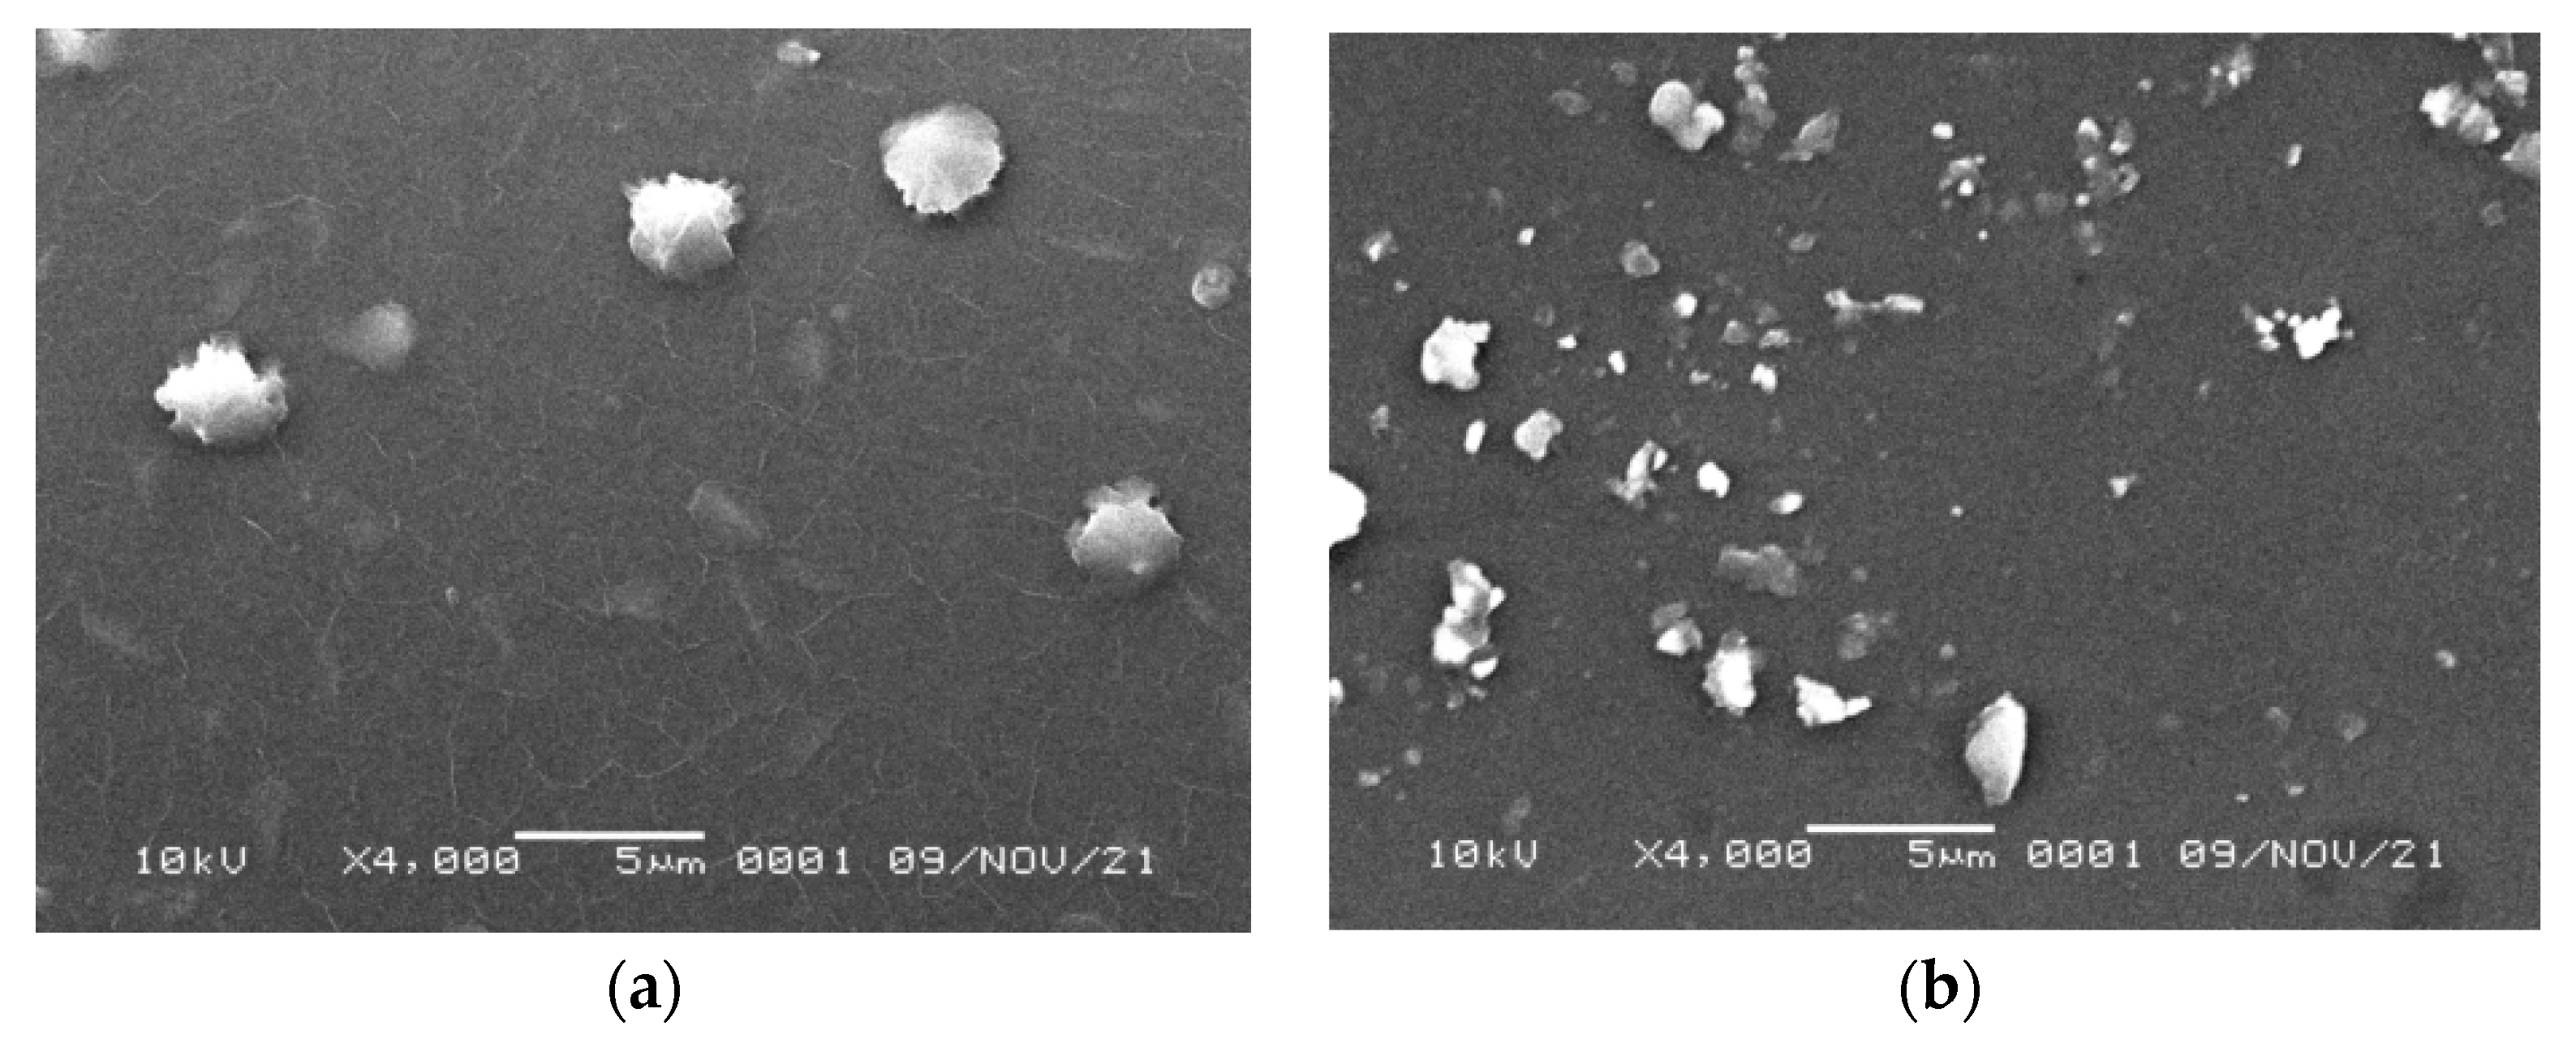
3.3. SEM
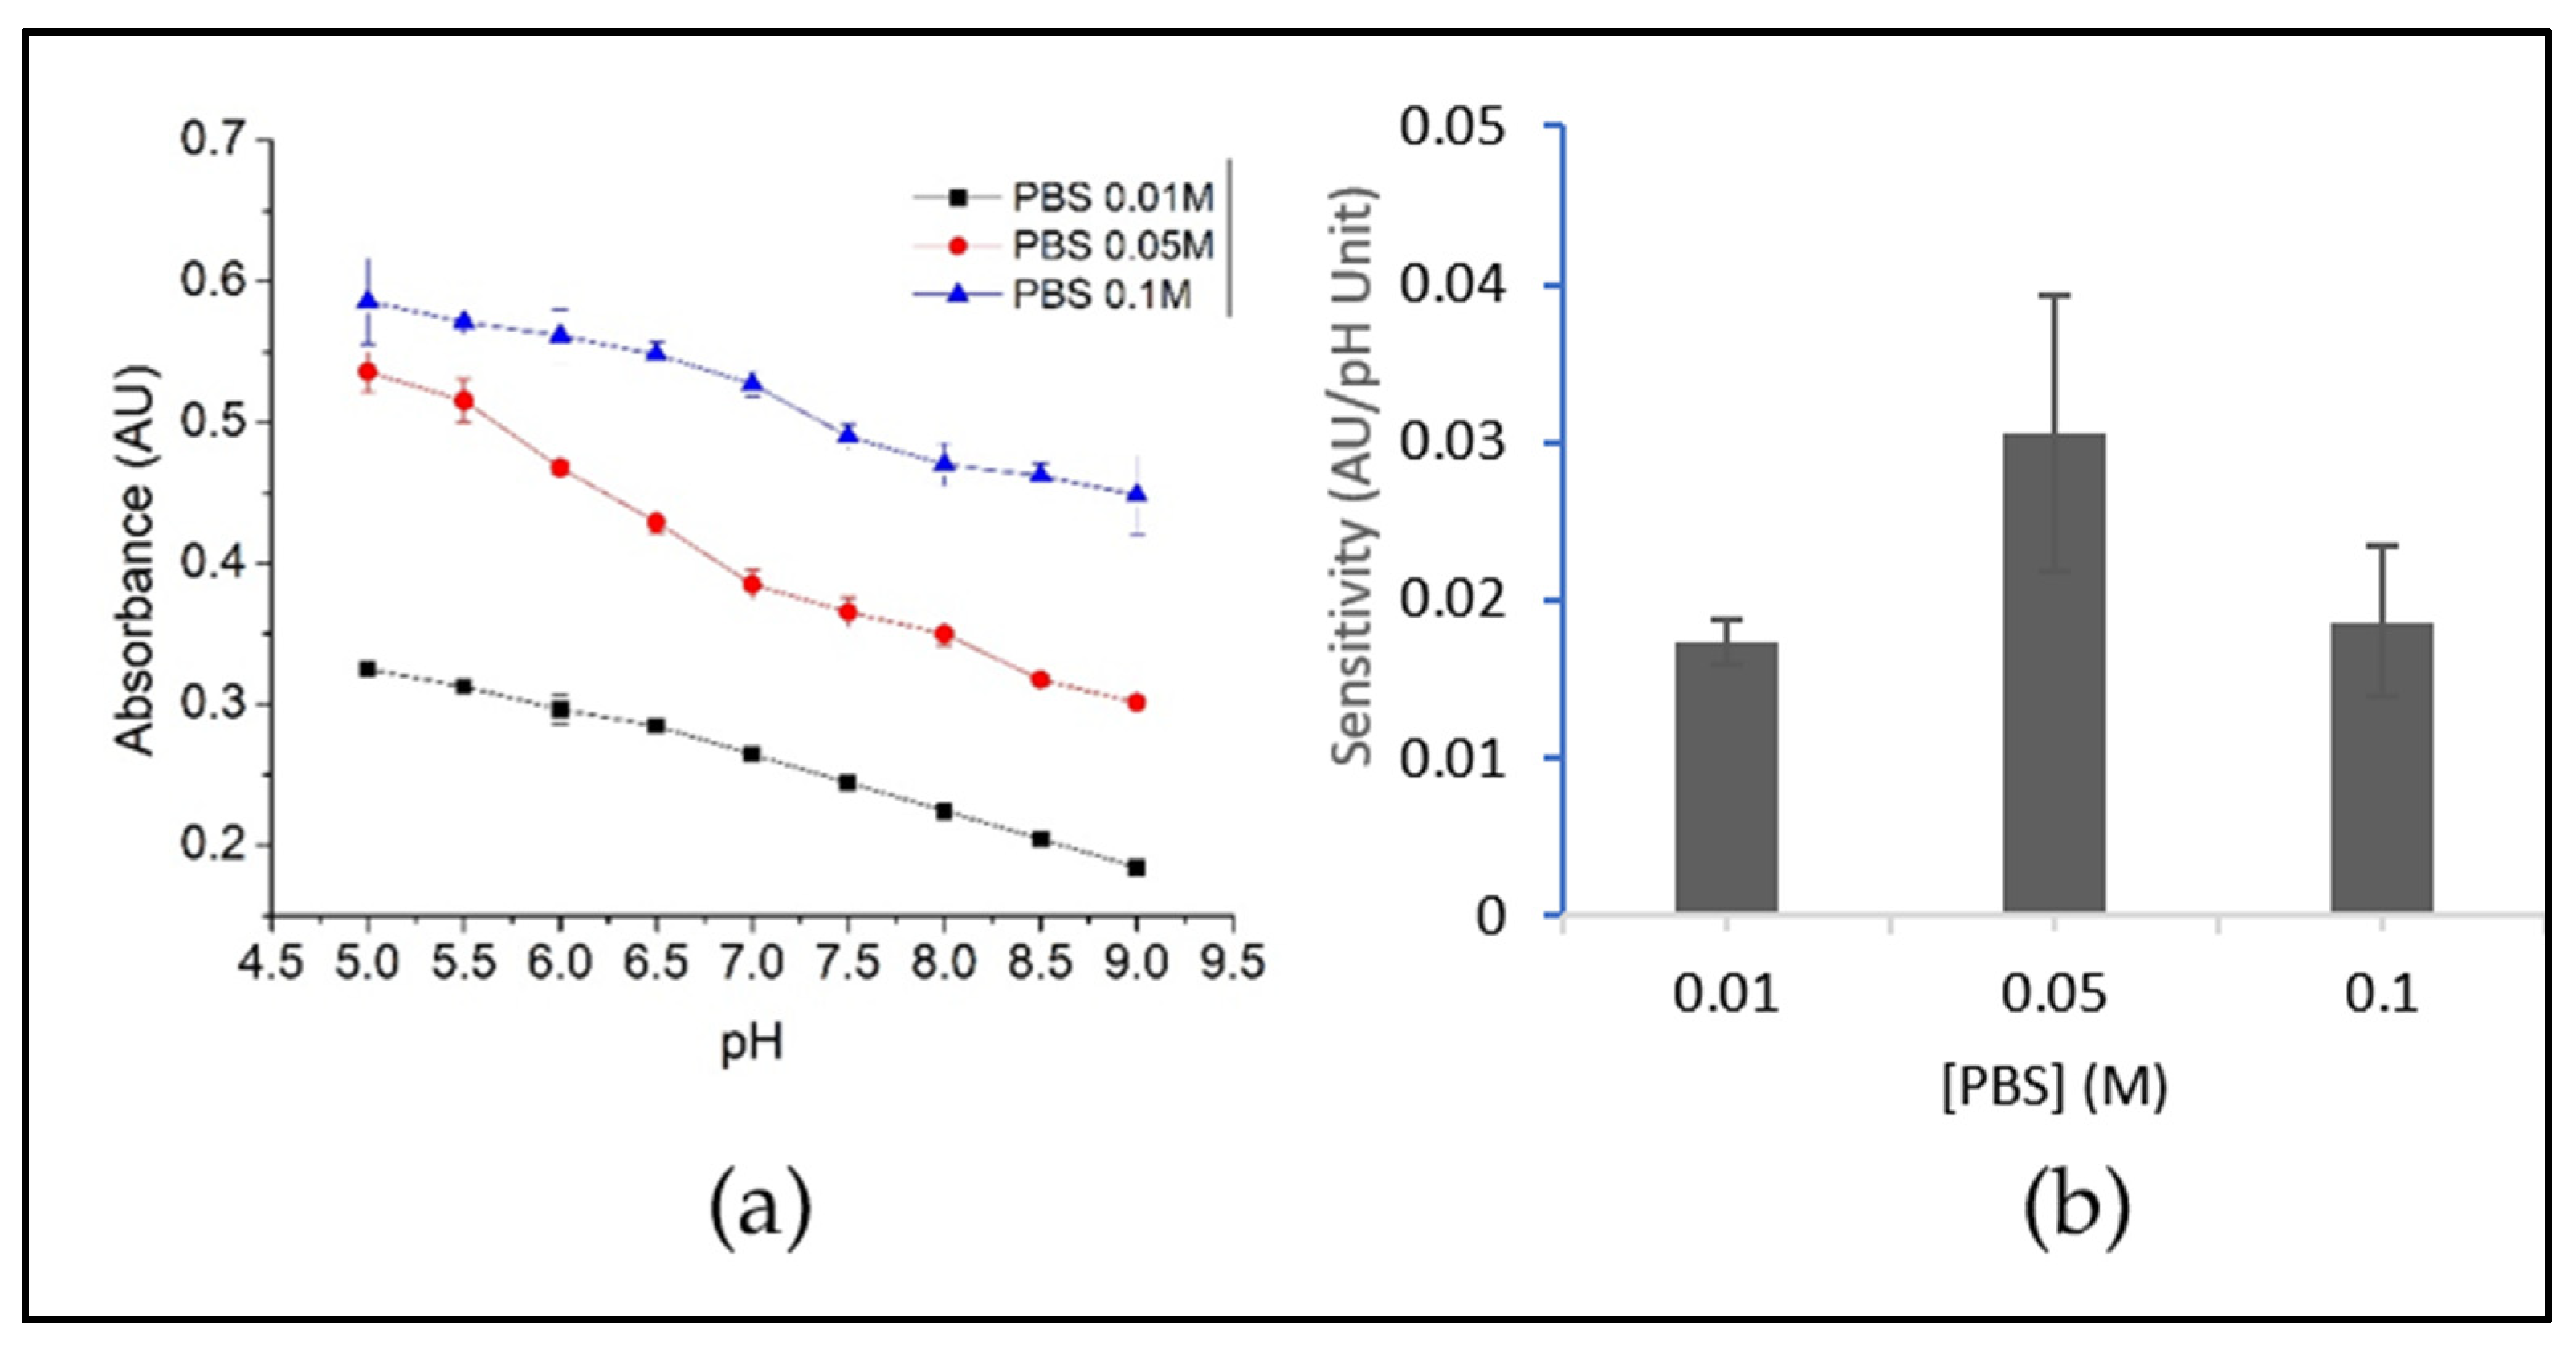
3.4. Effect of PBS Concentration on the Optical pH Response
3.5. Study of the Optical pH Sensor Performance
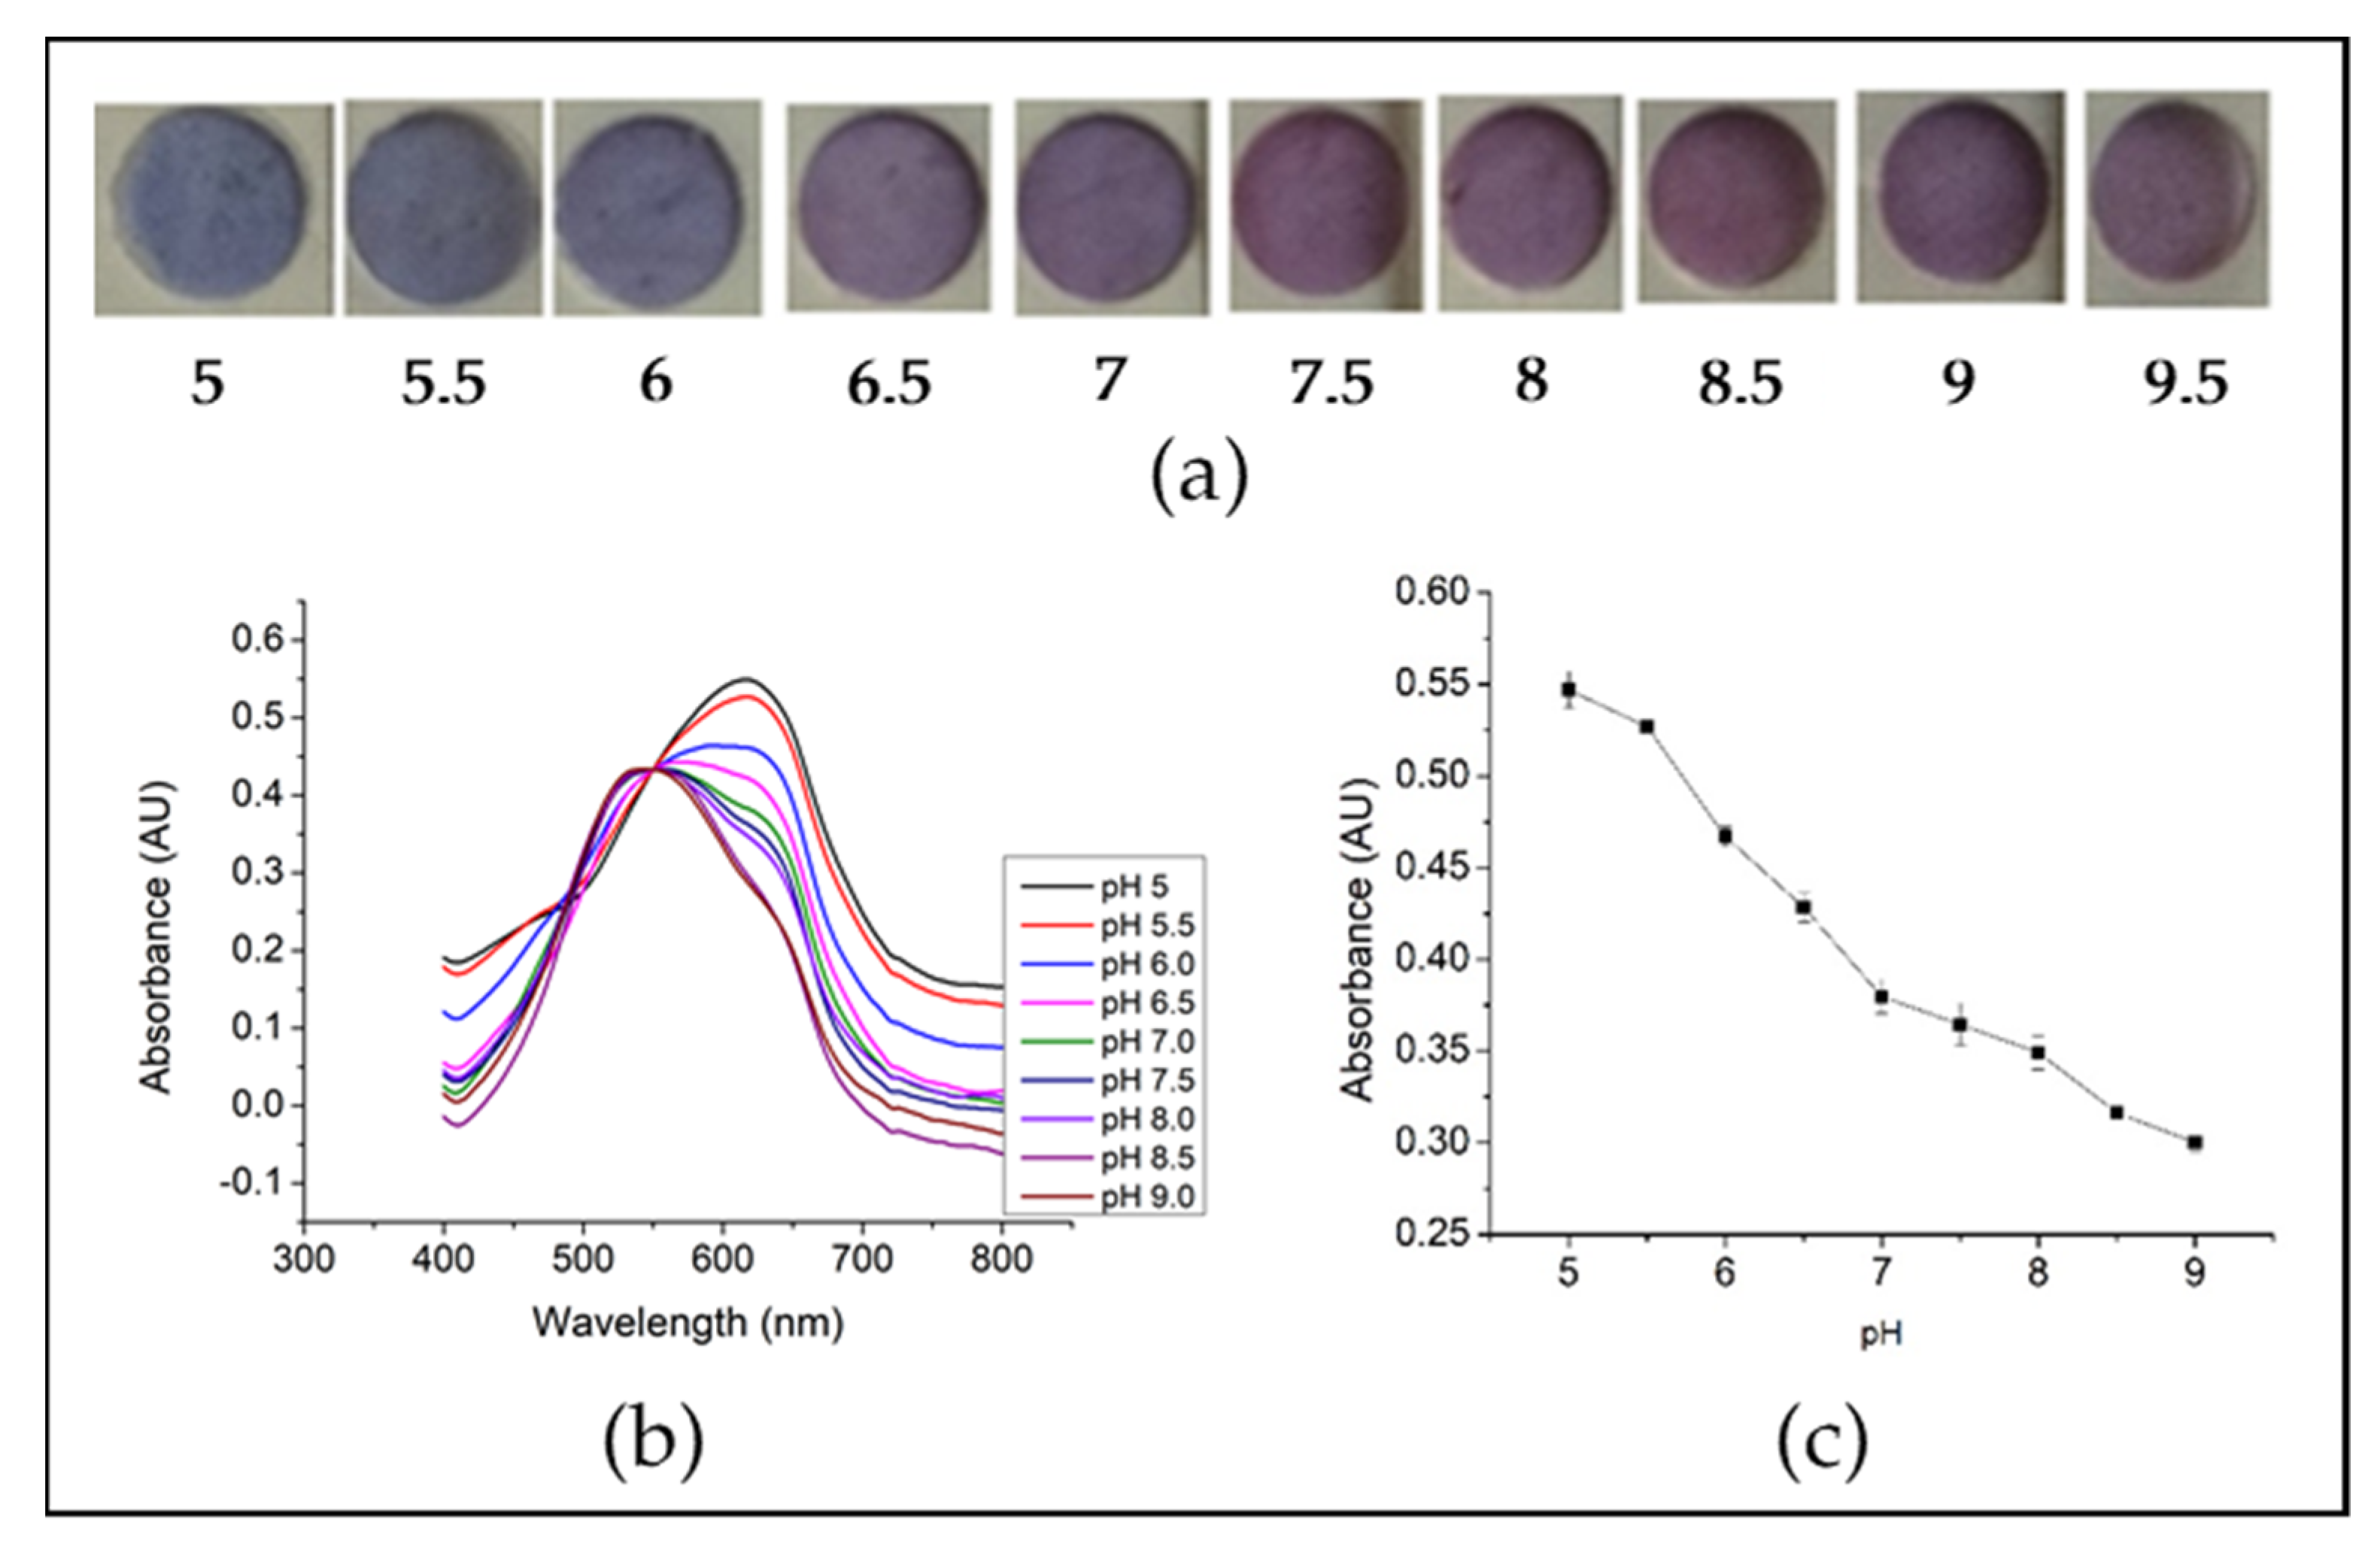
3.5.1. Optical pH Response
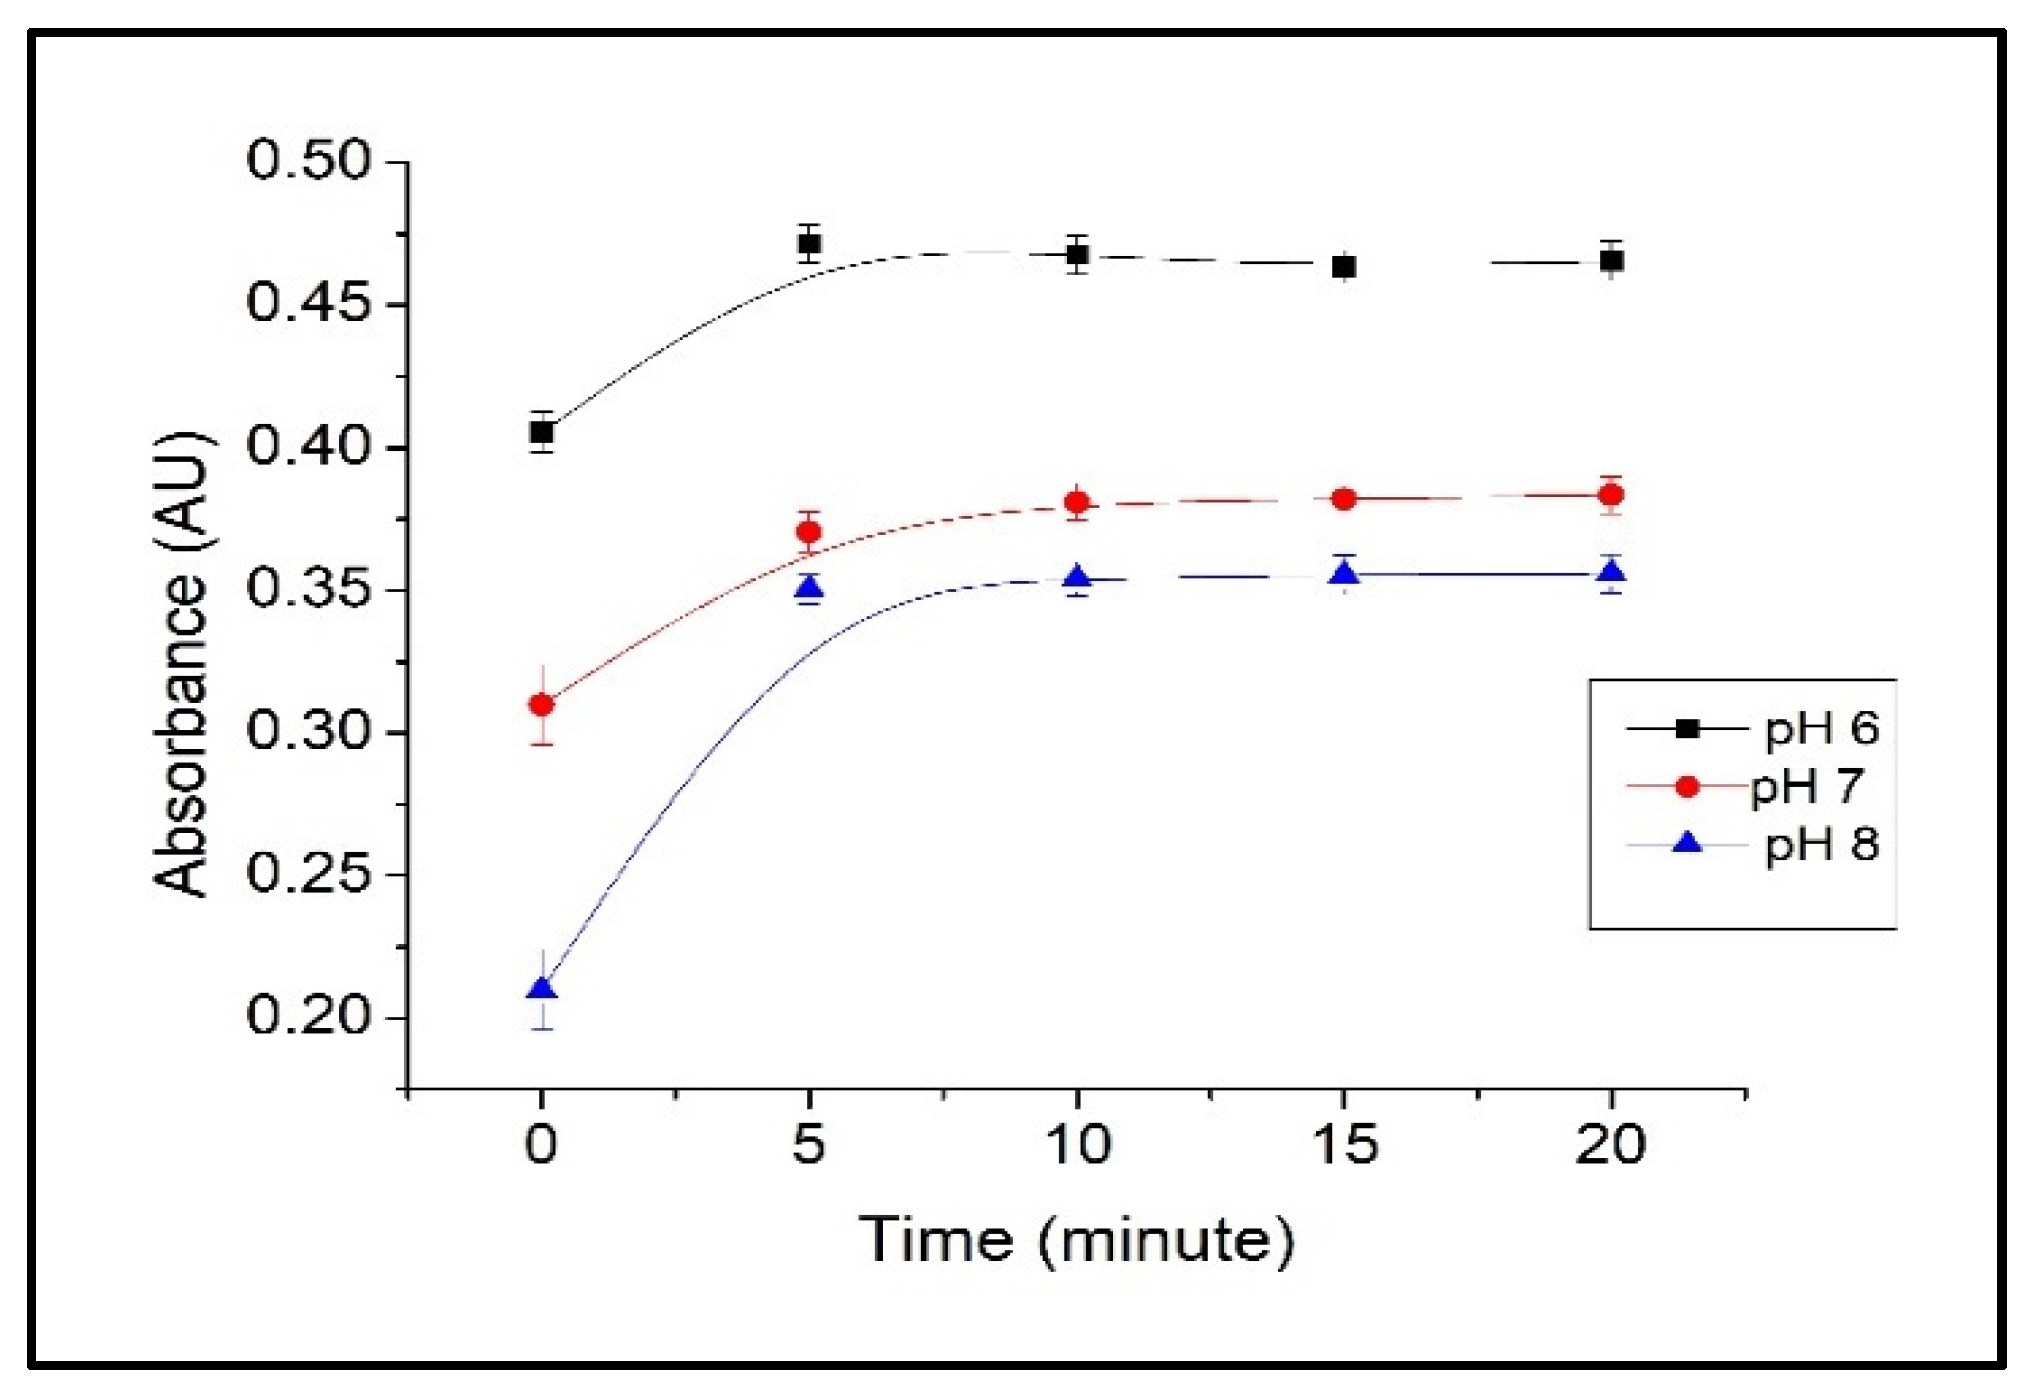
3.5.2. Response Time
3.5.3. Reproducibility
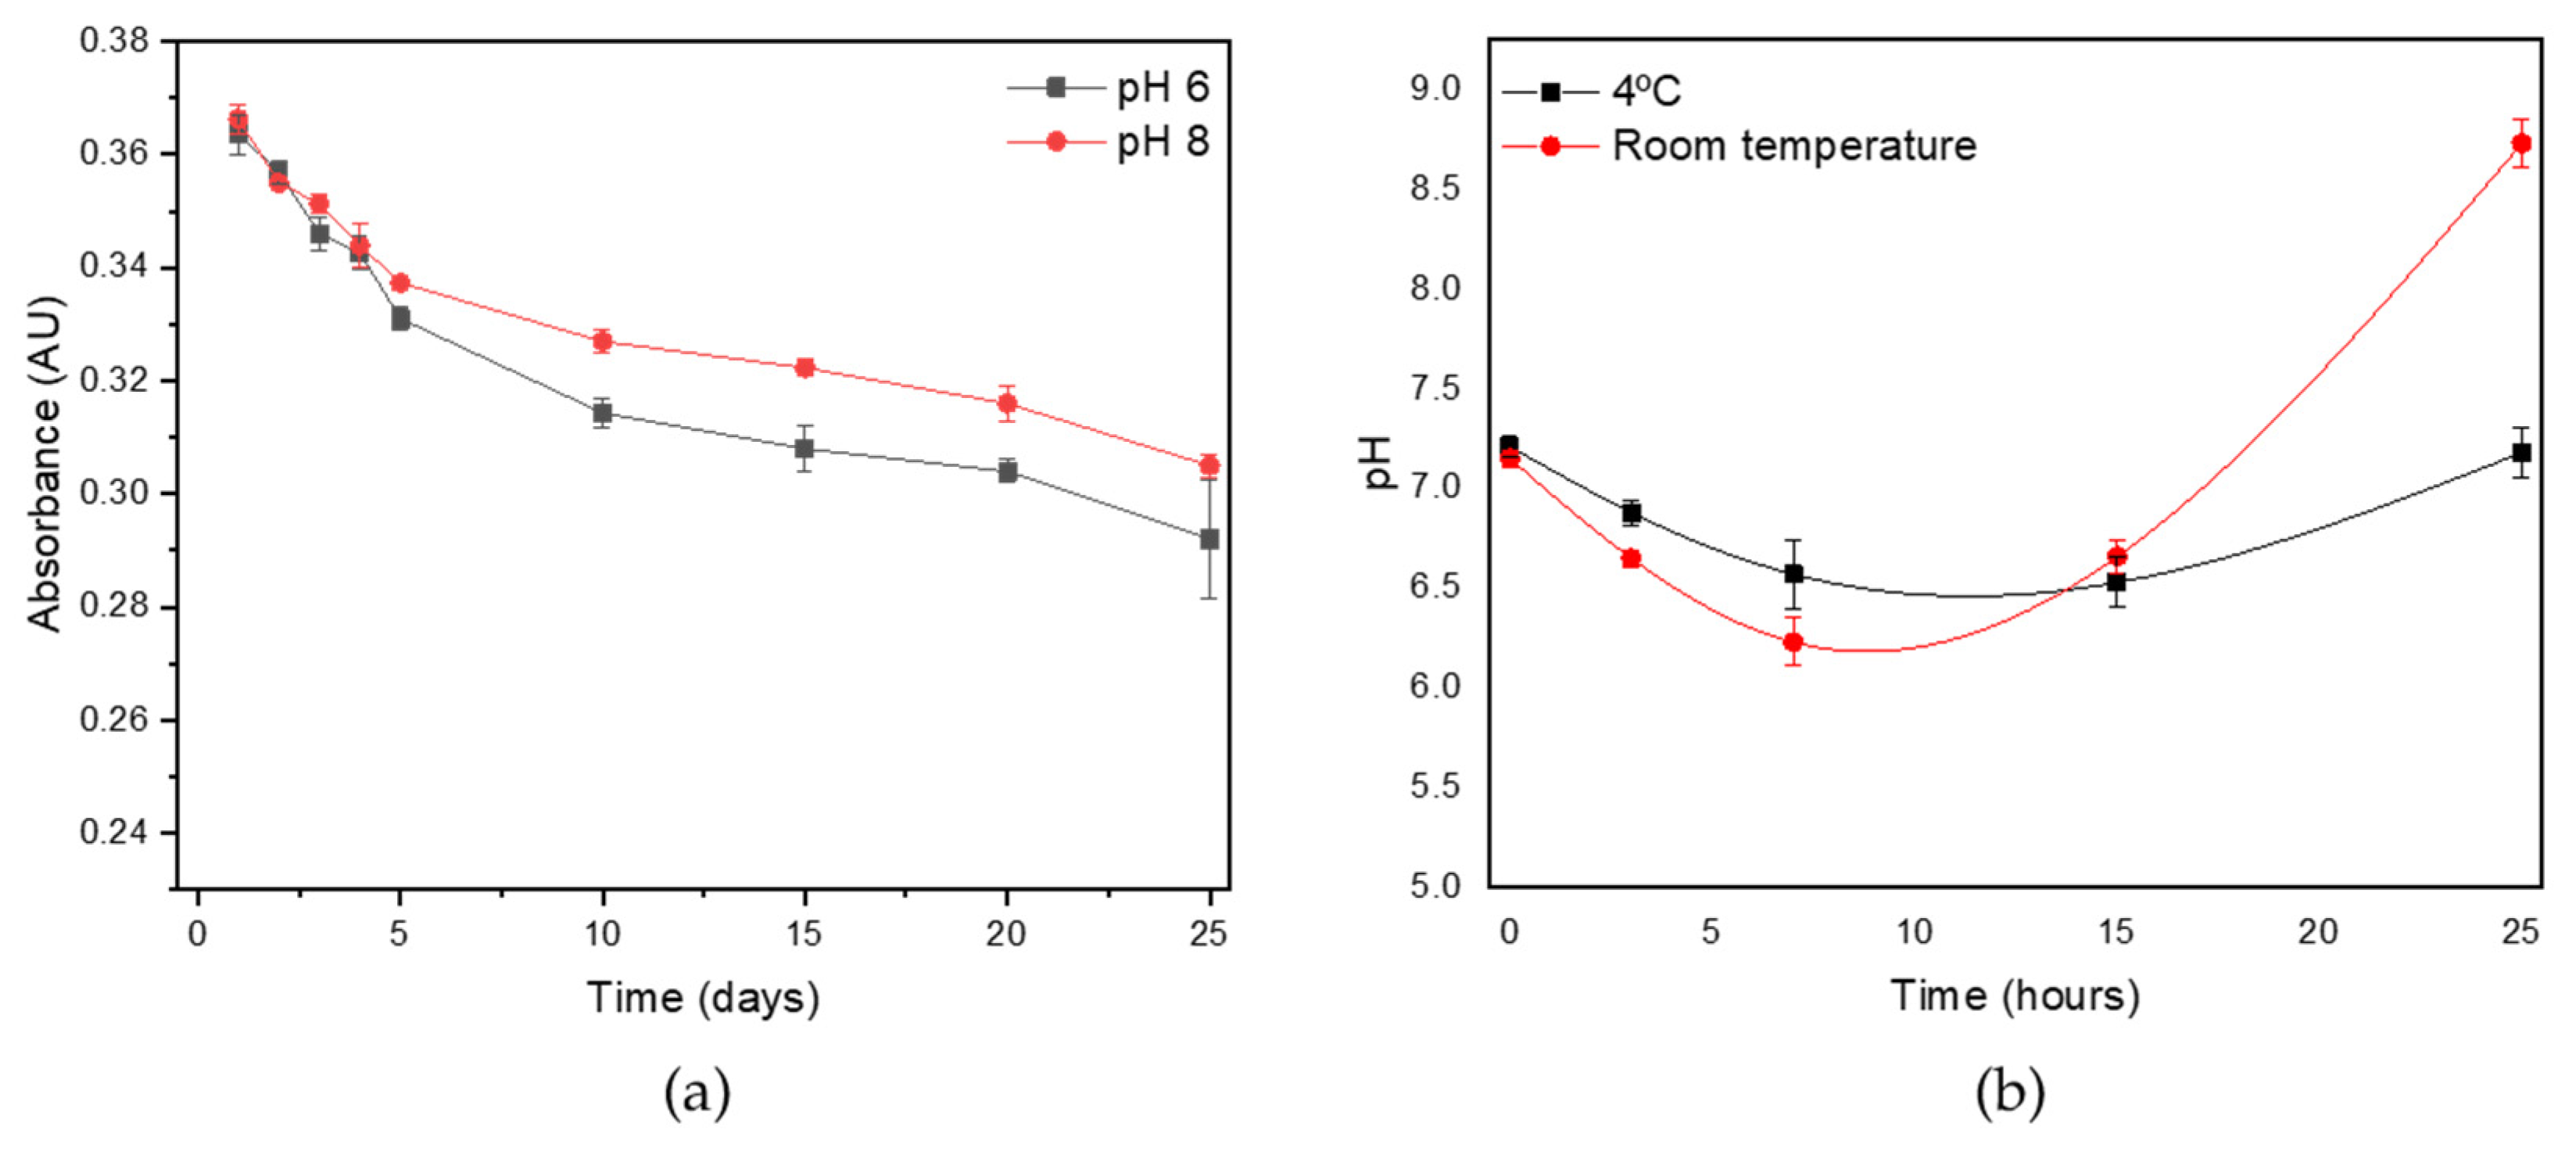
3.5.4. Lifetime Profile
3.5.5. Fish Freshness Monitoring on Tilapia Fish
4. Conclusions
Author Contributions
Funding
Institutional Review Board Statement
Informed Consent Statement
Data Availability Statement
Acknowledgments
Conflicts of Interest
References
- Tripathi, S.; Mehrotra, G.K.; Dutta, P.K. Preparation and physicochemical evaluation of chitosan/poly(vinyl alcohol)/pectin ternary film for food-packaging applications. Carbohydr. Polym. 2010, 79, 711–716. [Google Scholar] [CrossRef]
- Özoğul, F.; Özoğul, Y. Comparision of methods used for determination of total volatile basic nitrogen (TVB-N) in rainbow trout (Oncorhynchus mykiss). Turk. J. Zool. 2000, 24, 113–120. [Google Scholar]
- Prabhakar, P.K.; Srivastav, P.P.; Pathak, S.S. Kinetics of total volatile basic nitrogen and trimethylamine formation in stored rohu (Labeo rohita) fish. J. Aquat. Food Prod. Technol. 2019, 28, 452–464. [Google Scholar] [CrossRef]
- Wells, N.; Yusufu, D.; Mills, A. Colourimetric plastic film indicator for the detection of the volatile basic nitrogen compounds associated with fish spoilage. Talanta 2019, 194, 830–836. [Google Scholar] [CrossRef] [PubMed] [Green Version]
- Kumar, A.A.; Kumar, S.K.N. Comprehensive Review on pH and Nutrients Detection Sensitive Materials and Methods for Agriculture Applications. Sens. Lett. 2019, 17, 663–670. [Google Scholar] [CrossRef]
- Sukhanov, A.; Ovsyannikova, A.; Gavrilenko, N.; Saranchina, N. Polymethacrylate Matrix with Immobilized Acid–Base Indicators as pH Sensor. Procedia Eng. 2016, 168, 477–480. [Google Scholar] [CrossRef]
- Capel-Cuevas, S.; Cuéllar, M.P.; de Orbe-Payá, I.; Pegalajar, M.C.; Capitán-Vallvey, L.F. Full-range optical pH sensor array based on neural networks. Microchem. J. 2011, 97, 225–233. [Google Scholar] [CrossRef]
- Hasanah, U.; Setyowati, M.; Efendi, R.; Muslem, M.; Md Sani, N.D.; Safitri, E.; Yook Heng, L.; Idroes, R. Preparation and Characterization of a Pectin Membrane-Based Optical pH Sensor for Fish Freshness Monitoring. Biosensors 2019, 9, 60. [Google Scholar] [CrossRef] [PubMed] [Green Version]
- Suah, F.B.M.; Ahmad, M.; Taib, M.N. Optimisation of the range of an optical fibre pH sensor using feed-forward artificial neural network. Sens. Actuators B Chem. 2003, 90, 175–181. [Google Scholar] [CrossRef]
- Pourjavaher, S.; Almasi, H.; Meshkini, S.; Pirsa, S.; Parandi, E. Development of a colorimetric pH indicator based on bacterial cellulose nanofibers and red cabbage (Brassica oleraceae) extract. Carbohydr. Polym. 2017, 156, 193–201. [Google Scholar] [CrossRef]
- Rajan, V.K.; Hasna, C.K.; Muraleedharan, K. The natural food colorant Peonidin from cranberries as a potential radical scavenger—A DFT based mechanistic analysis. Food Chem. 2018, 262, 184–190. [Google Scholar] [CrossRef] [PubMed]
- Rodrigues, C.; Souza, V.G.L.; Coelhoso, I.; Fernando, A.L. Bio-Based Sensors for Smart Food Packaging—Current Applications and Future Trends. Sensors 2021, 21, 2148. [Google Scholar] [CrossRef] [PubMed]
- Galiano, F.; Briceño, K.; Marino, T.; Molino, A.; Christensen, K.V.; Figoli, A. Advances in biopolymer-based membrane preparation and applications. J. Memb. Sci. 2018, 564, 562–586. [Google Scholar] [CrossRef]
- Nazaruddin, N.; Afifah, N.; Bahi, M.; Susilawati, S.; Sani, N.D.M.; Esmaeili, C.; Iqhrammullah, M.; Murniana, M.; Hasanah, U.; Safitri, E. A simple optical pH sensor based on pectin and Ruellia tuberosa L.-derived anthocyanin for fish freshness monitoring. F1000Research 2021, 10, 422. [Google Scholar] [CrossRef]
- Hao, L.; Ding, J.; Yuan, N.; Xu, J.; Zhou, X.; Dai, S.; Chen, B. Visual and flexible temperature sensor based on a pectin-xanthan gum blend film. Org. Electron. 2018, 59, 243–246. [Google Scholar] [CrossRef]
- Coimbra, P.; Ferreira, P.; De Sousa, H.C.; Batista, P.; Rodrigues, M.A.; Correia, I.J.; Gil, M.H. Preparation and chemical and biological characterization of a pectin/chitosan polyelectrolyte complex scaffold for possible bone tissue engineering applications. Int. J. Biol. Macromol. 2011, 48, 112–118. [Google Scholar] [CrossRef]
- da Costa, M.P.M.; de Mello Ferreira, I.L.; de Macedo Cruz, M.T. New polyelectrolyte complex from pectin/chitosan and montmorillonite clay. Carbohydr. Polym. 2016, 146, 123–130. [Google Scholar] [CrossRef] [PubMed]
- Safitri, E.; Humaira, H.; Murniana, M.; Nazaruddin, N.; Iqhrammullah, M.; Md Sani, N.D.; Esmaeili, C.; Susilawati, S.; Mahathir, M.; Latansa Nazaruddin, S. Optical pH Sensor Based on Immobilization Anthocyanin from Dioscorea alata L. onto Polyelectrolyte Complex Pectin–Chitosan Membrane for a Determination Method of Salivary pH. Polymers 2021, 13, 1276. [Google Scholar] [CrossRef]
- Maciel, V.B.V.; Yoshida, C.M.P.; Franco, T.T. Chitosan/pectin polyelectrolyte complex as a pH indicator. Carbohydr. Polym. 2015, 132, 537–545. [Google Scholar] [CrossRef] [Green Version]
- Muxika, A.; Etxabide, A.; Uranga, J.; Guerrero, P.; de la Caba, K. Chitosan as a bioactive polymer: Processing, properties and applications. Int. J. Biol. Macromol. 2017, 105, 1358–1368. [Google Scholar] [CrossRef]
- Rahmi; Julinawati; Nina, M.; Fathana, H.; Iqhrammullah, M. Preparation and characterization of new magnetic chitosan-glycine-PEGDE (Fe3O4/Ch-G-P) beads for aqueous Cd(II) removal. J. Water Process Eng. 2022, 45, 102493. [Google Scholar] [CrossRef]
- Fathana, H.; Iqhramullah, M.; Rahmi, R.; Adlim, A.; Lubis, S. Tofu wastewater-derived amino acids identification using LC-MS/MS and their uses in the modification of chitosan/TiO2 film composite. Chem. Data Collect. 2021, 35, 100754. [Google Scholar] [CrossRef]
- Liu, Y.; Sun, Q.; Yang, X.; Liang, J.; Wang, B.; Koo, A.; Li, R.; Li, J.; Sun, X. High-performance and recyclable Al-air coin cells based on eco-friendly chitosan hydrogel membranes. ACS Appl. Mater. Interfaces 2018, 10, 19730–19738. [Google Scholar] [CrossRef] [PubMed]
- Ali, F.I.M.; Mahmoud, S.T.; Awwad, F.; Greish, Y.E.; Abu-Hani, A.F.S. Low power consumption and fast response H2S gas sensor based on a chitosan-CuO hybrid nanocomposite thin film. Carbohydr. Polym. 2020, 236, 116064. [Google Scholar] [CrossRef] [PubMed]
- Yong, H.; Wang, X.; Bai, R.; Miao, Z.; Zhang, X.; Liu, J. Development of antioxidant and intelligent pH-sensing packaging films by incorporating purple-fleshed sweet potato extract into chitosan matrix. Food Hydrocoll. 2019, 90, 216–224. [Google Scholar] [CrossRef]
- Shahar, H.; Tan, L.L.; Ta, G.C.; Heng, L.Y. Optical enzymatic biosensor membrane for rapid in situ detection of organohalide in water samples. Microchem. J. 2019, 146, 41–48. [Google Scholar] [CrossRef]
- Esmaeili, C.; Heng, L.Y.; Ling, T.L. Nile Blue chromoionophore-doped kappa-carrageenan for a novel reflectometric urea biosensor. Sens. Actuators B Chem. 2015, 221, 969–977. [Google Scholar] [CrossRef]
- Stelmach, E.; Kaczmarczyk, B.; Maksymiuk, K.; Michalska, A. Tailoring polythiophene cation-selective optodes for wide pH range sensing. Talanta 2020, 211, 120663. [Google Scholar] [CrossRef]
- Rashidova, S.S.; Milusheva, R.Y.; Semenova, L.N.; Mukhamedjanova, M.Y.; Voropaeva, N.L.; Vasilyeva, S.; Faizieva, R.; Ruban, I.N. Characteristics of interactions in the pectin–chitosan system. Chromatographia 2004, 59, 779–782. [Google Scholar] [CrossRef]
- Nordby, M.H.; Kjøniksen, A.-L.; Nyström, B.; Roots, J. Thermoreversible gelation of aqueous mixtures of pectin and chitosan. Rheology. Biomacromolecules 2003, 4, 337–343. [Google Scholar] [CrossRef]
- Ghaffari, A.; Navaee, K.; Oskoui, M.; Bayati, K.; Rafiee-Tehrani, M. Preparation and characterization of free mixed-film of pectin/chitosan/Eudragit® RS intended for sigmoidal drug delivery. Eur. J. Pharm. Biopharm. 2007, 67, 175–186. [Google Scholar] [CrossRef]
- Chen, P.-H.; Kuo, T.-Y.; Kuo, J.-Y.; Tseng, Y.-P.; Wang, D.-M.; Lai, J.-Y.; Hsieh, H.-J. Novel chitosan–pectin composite membranes with enhanced strength, hydrophilicity and controllable disintegration. Carbohydr. Polym. 2010, 82, 1236–1242. [Google Scholar] [CrossRef]
- Sadeghi, M.; Mohammadinasab, E.; Shafiei, F. Synthesis and Investigation of a Novel pH- and Salt-Responsive Superabsorbent Hydrogel Based on Pectin. Curr. World Environ. 2012, 7, 69–77. [Google Scholar] [CrossRef]
- Lv, X.; Zhang, W.; Liu, Y.; Zhao, Y.; Zhang, J.; Hou, M. Hygroscopicity modulation of hydrogels based on carboxymethyl chitosan/Alginate polyelectrolyte complexes and its application as pH-sensitive delivery system. Carbohydr. Polym. 2018, 198, 86–93. [Google Scholar] [CrossRef]
- Rahmi, R.; Lubis, S.; Az-Zahra, N.; Puspita, K.; Iqhrammullah, M. Synergetic photocatalytic and adsorptive removals of metanil yellow using TiO2/grass-derived cellulose/chitosan (TiO2/GC/CH) film composite. Int. J. Eng. 2021, 34, 1827–1836. [Google Scholar]
- Alqasaimeh, M.S.; Heng, L.Y.; Ahmad, M. A urea biosensor from stacked sol-gel films with immobilized nile blue chromoionophore and urease enzyme. Sensors 2007, 7, 2251–2262. [Google Scholar] [CrossRef] [Green Version]
- Staudinger, C.; Strobl, M.; Breininger, J.; Klimant, I.; Borisov, S.M. Fast and stable optical pH sensor materials for oceanographic applications. Sens. Actuators B Chem. 2019, 282, 204–217. [Google Scholar] [CrossRef]
- Harvey, D. Modern Analytical Chemistry; McGraw-Hill: New York, NY, USA, 2000; Volume 1. [Google Scholar]
- Choi, I.; Lee, J.Y.; Lacroix, M.; Han, J. Intelligent pH indicator film composed of agar/potato starch and anthocyanin extracts from purple sweet potato. Food Chem. 2017, 218, 122–128. [Google Scholar] [CrossRef] [PubMed]
- Liu, D.; Liang, L.; Xia, W.; Regenstein, J.M.; Zhou, P. Biochemical and physical changes of grass carp (Ctenopharyngodon idella) fillets stored at −3 and 0 °C. Food Chem. 2013, 140, 105–114. [Google Scholar] [CrossRef] [PubMed]
- Hashim, S.B.H.; Tahir, H.E.; Liu, L.; Zhang, J.; Zhai, X.; Mahdi, A.A.; Awad, F.N.; Hassan, M.M.; Xiaobo, Z.; Jiyong, S. Intelligent colorimetric pH sensoring packaging films based on sugarcane wax/agar integrated with butterfly pea flower extract for optical tracking of shrimp freshness. Food Chem. 2022, 373, 131514. [Google Scholar] [CrossRef] [PubMed]
- Domínguez-Aragón, A.; Olmedo-Martínez, J.A.; Zaragoza-Contreras, E.A. Colorimetric sensor based on a poly (ortho-phenylenediamine-co-aniline) copolymer for the monitoring of tilapia (Orechromis niloticus) freshness. Sens. Actuators B Chem. 2018, 259, 170–176. [Google Scholar] [CrossRef]
- Ezati, P.; Priyadarshi, R.; Bang, Y.-J.; Rhim, J.-W. CMC and CNF-based intelligent pH-responsive color indicator films integrated with shikonin to monitor fish freshness. Food Control 2021, 126, 108046. [Google Scholar] [CrossRef]
- Ding, L.; Li, X.; Hu, L.; Zhang, Y.; Jiang, Y.; Mao, Z.; Xu, H.; Wang, B.; Feng, X.; Sui, X. A naked-eye detection polyvinyl alcohol/cellulose-based pH sensor for intelligent packaging. Carbohydr. Polym. 2020, 233, 115859. [Google Scholar] [CrossRef] [PubMed]
- Schaude, C.; Meindl, C.; Fröhlich, E.; Attard, J.; Mohr, G.J. Developing a sensor layer for the optical detection of amines during food spoilage. Talanta 2017, 170, 481–487. [Google Scholar] [CrossRef]
- Sun, W.; Li, H.; Wang, H.; Xiao, S.; Wang, J.; Feng, L. Sensitivity enhancement of pH indicator and its application in the evaluation of fish freshness. Talanta 2015, 143, 127–131. [Google Scholar] [CrossRef]


| Sensor | Absorbance (AU) | |
|---|---|---|
| pH 6 | pH 8 | |
| 1 | 0.325 | 0.320 |
| 2 | 0.330 | 0.325 |
| 3 | 0.333 | 0.327 |
| 4 | 0.335 | 0.329 |
| 5 | 0.336 | 0.331 |
| 6 | 0.337 | 0.332 |
| 7 | 0.339 | 0.336 |
| 8 | 0.341 | 0.340 |
| 9 | 0.343 | 0.342 |
| 10 | 0.350 | 0.344 |
| Mean ± SD | 0.337 ± 0.007 | 0.333 ± 0.008 |
| RSD (%) | 2.073 | 2.347 |
| Matrices | Active Substance | Linear (pH) | Reference |
|---|---|---|---|
| Polyelectrolite complex (PEC) pectin–chitosan | Chromoionophore ETH 5294 | 5–9 | Present work |
| Pectin | ETH Nile Blue 5294 | 5–9 | [8] |
| Pectin | Ruellia Tubelora L | 6–8 | [14] |
| Sugarcane wax | Butterfly pea flower | 2–6 and 7–12 | [41] |
| Poly(ortho-phenylenediamine-co-aniline) | Anilin | 1–13 | [42] |
| Carboxymethyl cellulose (CMC) and cellulose nanofibers (CNF) | Shikonin extracted from Lithospermum erythrorhizon roots | 2-12 | [43] |
| Polyvinyl alcohol (PVA) | Acidochromic dye | 7–12 | [44] |
| Silicone | Disodium 1-amino-9,10-dioxo-4-[3-(2-sulfonatooxyethylsulfonyl)-anilino] anthracene-2-sulfonate (Remazol Brilliant Blue R, RBBR) and 2-fluoro-4-[4-(2-hydroxyethanesulfonyl)-phenylazo]-6-methoxyphenol (GJM-492) | 8 | [45] |
| Sol–gel (ormosil) | Bromophenol blue | 1–8.5 | [46] |
Publisher’s Note: MDPI stays neutral with regard to jurisdictional claims in published maps and institutional affiliations. |
© 2022 by the authors. Licensee MDPI, Basel, Switzerland. This article is an open access article distributed under the terms and conditions of the Creative Commons Attribution (CC BY) license (https://creativecommons.org/licenses/by/4.0/).
Share and Cite
Safitri, E.; Omaira, Z.; Nazaruddin, N.; Mustafa, I.; Saleha, S.; Idroes, R.; Ginting, B.; Iqhrammullah, M.; Alva, S.; Paristiowati, M. Fabrication of an Immobilized Polyelectrolite Complex (PEC) Membrane from Pectin-Chitosan and Chromoionophore ETH 5294 for pH-Based Fish Freshness Monitoring. Coatings 2022, 12, 88. https://0-doi-org.brum.beds.ac.uk/10.3390/coatings12010088
Safitri E, Omaira Z, Nazaruddin N, Mustafa I, Saleha S, Idroes R, Ginting B, Iqhrammullah M, Alva S, Paristiowati M. Fabrication of an Immobilized Polyelectrolite Complex (PEC) Membrane from Pectin-Chitosan and Chromoionophore ETH 5294 for pH-Based Fish Freshness Monitoring. Coatings. 2022; 12(1):88. https://0-doi-org.brum.beds.ac.uk/10.3390/coatings12010088
Chicago/Turabian StyleSafitri, Eka, Zatul Omaira, Nazaruddin Nazaruddin, Irfan Mustafa, Sitti Saleha, Rinaldi Idroes, Binawati Ginting, Muhammad Iqhrammullah, Sagir Alva, and Maria Paristiowati. 2022. "Fabrication of an Immobilized Polyelectrolite Complex (PEC) Membrane from Pectin-Chitosan and Chromoionophore ETH 5294 for pH-Based Fish Freshness Monitoring" Coatings 12, no. 1: 88. https://0-doi-org.brum.beds.ac.uk/10.3390/coatings12010088