Article

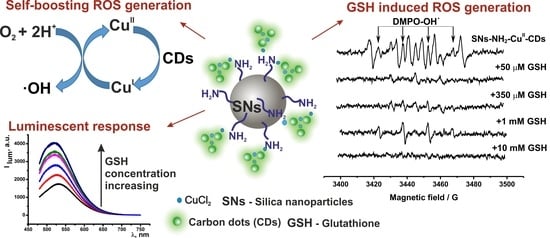
Silica-Supported Assemblage of CuII Ions with Carbon Dots for Self-Boosting and Glutathione-Induced ROS Generation

1
Arbuzov Institute of Organic and Physical Chemistry, FRC Kazan Scientific Center of RAS, Arbuzov Str., 8, 420088 Kazan, Russia
2
Alexander Butlerov Institute of Chemistry, Kazan (Volga Region) Federal University, 18 Kremlyovskaya Str., 420008 Kazan, Russia
3
Institute of Radio Electronics, Photonics and Digital Technologies, Kazan National Research Technical University Named after A.N. Tupolev-KAI, 10, K. Marx Str., 420111 Kazan, Russia
4
Interdisciplinary Center for Analytical Microscopy, Kazan (Volga Region) Federal University, 9 Paris Commune Str., 420008 Kazan, Russia
*
Author to whom correspondence should be addressed.
Submission received: 13 December 2021 / Revised: 9 January 2022 / Accepted: 11 January 2022 / Published: 15 January 2022

Abstract

:
The present work introduces coordinative binding of CuII ions with both amino-functionalized silica nanoparticles (SNs) and green-emitting carbon dots (CDs) as the pregrequisite for the CuII-assisted self-assembly of the CDs at the surface of the SNs. The produced composite SNs exhibit stable in time stimuli-responsive green fluorescence derived from the CuII-assisted assemblage of CDs. The fluorescence response of the composite SNs is sensitive to the complex formation with glutathione (GSH), enabling them to detect it with the lower limit of detection of 0.15 μM. The spin-trap-facilitated electron spin resonance technique indicated that the composite SNs are capable of self-boosting generation of ROS due to CuII→CuI reduction by carbon in low oxidation states as a part of the CDs. The intensity of the ESR signals is enhanced under the heating to 38 °C. The intensity is suppressed at the GSH concentration of 0.35 mM but is enhanced at 1.0 mM of glutathione, while it is suppressed once more at the highest intracellular concentration level of GSH (10 mM). These tendencies reveal the concentrations optimal for the scavenger or reductive potential of GSH. Flow cytometry and fluorescence and confocal microscopy methods revealed efficient cell internalization of SNs-NH2-CuII-CDs comparable with that of “free” CDs.

Graphical Abstract

1. Introduction

Silica nanoparticles (SNs) are convenient nanobeads for both molecular and nanosized dopants, which can be either included in the silica matrix or deposited onto the silica surface through the cooperative effect of multiple noncovalent interactions [1,2,3,4]. It is worth noting that a surface modification of SNs is of greater impact on their cellular uptake and sensing than the inclusive modification of SNs. Thus, the present work represents noncovalent surface decoration of SNs by green-emissive carbon dots (CDs) facilitated by coordination bonds as a route for developing a composite nanomaterial combining functional properties derived from both metal ions and CDs.
Emissive carbon dots (CDs) have gained much attention as the basis for sensing [5,6]. Thus, the present work represents an assemblage of green-emissive carbon dots (CDs) facilitated by coordination bond as a mode of noncovalent surface decoration of SNs aimed at developing a composite nanomaterial for sensing, imaging and reactive oxygen species (ROS) generation. The claimed aim requires specific metal ions and functional groups at the surface of SNs, which are able to (1) form efficient coordination bonds to provide the assemblage of CDs at the surface of SNs, (2) be labile to give a quick response on biorelevant substrates and (3) be redox-active to generate ROS in cell cytoplasm.
The use of CuII ions to form coordinative bonds facilitating adsorption of the CDs derives from their well-known outstanding coordination ability represented by the Irving–Williams series. The high efficiency of the coordination binding of copper ions with amino groups can be applied as a tool to modify the functional properties of a material, as it has been successfully applied in the modification of room-temperature multiferroicity of polyaniline-based material [7]. The amino-modified SNs bearing multiple amino groups at their surface have been already documented as the nanobeads for CuII ions [8,9,10,11]. The present work introduces CuII-supported coordinative bonds at a silica/water interface of the amino-modified SNs as the driving force of embedding of green-emitting carbon dots (CDs) onto the SNs. Unlike the previously reported doping of the CDs into SNs or mesoporous SNs [12,13], the combination of CuII ions with fluorescent CDs on amino-modified SNs is the prerequisite for the development of the stimuli-responsive assemblage of CDs on the surface of SNs. Thus, the applicability of the developed composite SNs in sensing is introduced herein.
The ability of CuII-containing nanomaterials to generate ROS through Fenton-like reactions in the presence of some reductants exemplified by cytosolic glutathione [14,15,16,17,18,19,20] is of great biomedical importance, since the ROS generation, in turn, is the well-known basis for chemodynamic therapy (CDT) as an alternative route for cancer cell treating [21,22,23,24]. However, the reductive capacity of cytosolic GSH is the well-known reason for its radical scavenger function within cells [25]. It is also worth noting that the reductive effect of GSH on CuII-containing nanomaterials interferes with its ability to coordinate CuII ions, which results in specific concentration requirements for the significant CuII→CuI reduction [14]. Thus, the present work is aimed at highlighting the complex formation of the composite nanomaterial with glutathione (GSH) through its sensing ability, in turn, derived from CuII-CDs combination at the surface of the amino-modified SNs.
It has been already documented that the red-emitting CDs being combined with CuII and FeII ions provide the irradiation-induced [15] and hydrogen peroxide induced [26] CDT effects. However, the origin of the CDT generated by CuII-CDs in the presence of cytosolic GSH is not well understood. The factors responsible for the ROS generation by the developed composite SNs combining CuII and CDs on their surface are highlighted with the use of electron spin spectroscopy (ESR) technique facilitated by 5,5-dimethyl-pyrroline N-oxide (DMPO) as the spin trap. In particular, the impact of different concentration levels of GSH on ROS generation is also revealed by means of the ESR technique.
The present work also introduces the stability of the CuII-facilitated assembly of the CDs at the surface of the amino-modified SNs and their applicability in cellular marking. Therefore, flow cytometry, cell viability and fluorescence and confocal microscopy measurements are also be introduced for revealing the potential of the developed composite SNs in cellular imaging.

2. Materials and Methods

Commercial chemicals tetraethyl orthosilicate (TEOS, 98%), ammonium hydroxide (28%–30%), n-hexanol (98%), cyclohexane (99%), hexane (99%), acetone (99%), 3-aminopropyltriethoxysilane (APTES, 99%), and β-alanine were purchased from Acros Organics (Thermo Fisher Scientific, Waltham, MA, USA). Triton X-100 (98%), copper (II) chloride (97%), citric acid (99%), urea (99%) 5,5-dimethyl-pyrroline N-oxide (DMPO), 4′,6-diamidino-2-phenylindole dihydrochloride (DAPI), propidium iodide, fluorescamine and L-glutathione reduced (GSH, 98%) were purchased from Sigma-Aldrich (St. Louis, MO, USA). L-Cysteine (for biochemistry) was purchased from Merck (Darmstadt, Germany).
Ethanol was purified by distillation under atmospheric pressure, whereas TEOS was distilled under reduced pressure. All other chemicals were used as received without further purification.
The synthesis of carbon quantum dots was carried out by thermolysis of urea citrate [27]. Citric acid and urea in a ratio of 1:5 were refluxed for two hours at a temperature of 155 °C (with temperature fluctuations of 3 °C). Through synthesis, the color of the melt changed from transparent to dark brown. After the completion of the reaction, the product was dissolved in excess water, filtered using a filter membrane (0.22 μm) and dried at room temperature.
Amino-modified silica nanoparticles (SNs-NH2) and silica nanoparticles (SNs) were synthesized in accordance with the previously published procedures [28,29].
The adsorption of CuII onto SNs and SNs-NH2 was performed as follows: aqueous colloids of SNs or SNs-NH2 (2.8 gL−1) were mixed with CuCl2 (5 mM) using a Multi Reax shaker set-up (Heidolph, Schwabach, Germany) for 1 day. Next, the mixture was left to stay for 2 days, after which the SNs were separated by centrifugation (15 m, 15,000 rpm, 4 °C) and washed 3 times to remove unbound Cu(II) ions. The initial white silica nanoparticles became blue.
For adsorption of CDs (10 gL−1) onto SNs-NH2-CuII or SNs-NH2 and SNs-CuII (0.5 gL−1), all components were mixed using a shaker set-up for 1 day. Afterward, the treated SNs were separated by centrifugation (15 min, 15,000 rpm, 4 °C) and triply washed. Concentration ratio of SNs to CDs equal to 1:20 and 24 h shaking were selected as optimal conditions for obtaining a high-luminescent and stable nanoparticle system. Obtained colloids were dark brown.
The Transmission electron microscopy (TEM) images were obtained by means of Hitachi HT7700 (Japan, Tokyo, Japan) at an accelerating voltage of 100 kV.
Cu and Si were identified in the solutions using simultaneous inductively coupled plasma optical emission spectrometry (ICP-OES) model iCAP 6300 DUO by Varian Thermo Scientific Company (Waltham, MA, USA) equipped with a Charge Injection Devices (CID) detector. This spectrometer enables the simultaneous measurement of peak heights within the 166 to 867 nm range. The optical resolution is less than 0.007 to 200 nm. The working frequency is 27.12 MHz. Together, the radial and axial view configurations enable optimal peak height measurements with suppressed spectral noises. Concentrations of Cu and Si ions were determined, respectively, by the 327.396 and 251.611 nm spectral lines.
Powdered samples were characterized by Ultraviolet-visible/diffuse reflectance (UV-Vis/DR) technique using a Jasco V-650 spectrophotometer (Jasco International Co. Ltd., Tokyo, Japan) equipped with an integrating sphere accessory for diffuse reflectance spectra acquisition. BaSO4 powder was used as the reference for baseline correction.
UV-Vis spectra were recorded on SpecordR50 Plus (Analytikjena, Jena, Germany). SNs dispersions were ultrasonicated within 10 min before use.
Dynamic light scattering (DLS) measurements were performed by means of the Malvern Mastersize 2000 particle analyzer. A He-Ne laser operating at 633 nm wavelength and emitting vertically polarized light was used as a light source. The measured autocorrelation functions were analyzed by Malvern DTS software (version 7.10) and the second-order cumulant expansion methods. The effective hydrodynamic radius (RH) was calculated by the Einstein–Stokes relation from the first cumulant: D = kBT/6πηRH, where D is the diffusion coefficient, kB is the Boltzmann constant, T is the absolute temperature and η is the viscosity. The diffusion coefficient was measured at least three times for each sample. The average error in these experiments is approximately 4%. The samples for DLS study were prepared from deionized water, sonicated for 10 min and equilibrated at 25.0 ± 0.1 °C before DLS and zeta-potential measurements.
The steady-state emission spectra were recorded on a fluorescence spectrophotometer Hitachi F-7100 (Japan, Tokyo, Japan) with stigmatic concave diffraction grating. All samples were ultrasonicated for 10 min before measurements. λex = 420 nm, slit = 5 nm, voltage = 700 mV; C (CDs) = 0.005 gL−1; C (SNs-NH2-CuII-CDs) = 0.05 gL−1.
The fluorescence procedure with the use of fluorescamine (Figure S1) was used for quantitative analysis of amino groups on the surface of silica nanoparticles [30].
Limit of detection was evaluated by the following equation: LOD = 3σ/S, where S is slope and σ is standard deviation ( σ = i = 1 n x x ¯ 2 n ) .
The ESR measurements were carried out on the ELEXSYS E500 ESR spectrometer of the X-range (Bruker, Billerica, MA, USA). ESR spectra were simulated using the WinSim program (developed by NIEHS, version 0.96). The irradiation of the samples was carried out by light-emitting diode (405 nm) at a distance of 10 cm from the light source. The samples were aqueous (used deionized water) solutions of 0.1 M DMPO in the presence of analyzed objects. Temperature in the ESR spectrometer cavity was set using the ER 4131VT Variable Temperature System (Bruker, Billerica, MA, USA).
Cytotoxic effects of samples on human cancer and normal cells were estimated by means of the multifunctional Cytell Cell Imaging system (GE Health Care Life Science, Uppsala, Sweden) using the Cell Viability Bio App (version 3.6.7.19) which precisely counts the number of cells and evaluates their viability from fluorescence intensity data [31]. The M-HeLa clone 11 human, epithelioid cervical carcinoma, strain of HeLa, clone of M-HeLa; WI-38 VA-13 cell culture, subline 2RA (human embryonic lung), from the Type Culture Collection of the Institute of Cytology (Russian Academy of Sciences, Moscow, Russia); and Chang Liver cell line (Human liver cells) from N. F. Gamaleya Research Center of Epidemiology and Microbiology were used in the experiments. The cells were cultured in a standard Eagle’s nutrient medium manufactured at the Chumakov Institute of Poliomyelitis and Virus Encephalitis (PanEco company, Tokyo, Japan) and supplemented with 10% fetal calf serum and 1% nonessential amino acids. The cells were plated into a 96-well plate (Eppendorf, Hamburg, Germany) at a concentration of 1 × 10⁵ cells mL−1, 150 μL of medium per well, and cultured in a CO2 incubator at 37 °C. Twenty-four hours after seeding the cells into wells, the compound under study was added at a preset dilution, 150 μL to each well. The dilutions of the compounds were prepared immediately in nutrient media; 5% dimethyl sulfoxide (DMSO), which does not induce the inhibition of cells at this concentration, was added for better solubility. The experiments were repeated three times. Intact cells cultured in parallel with experimental cells were used as a control.
The uptake of SNs-NH2-CuII-CDs by M-HeLa cells was analyzed using flow cytometry (Guava easy Cyte 8HT, Austin, TX, USA). Flow cytometry was used to generate statistics on the uptake of the test complex by cancer cells. Untreated cells were used as negative control. M-HeLa cells at 1 × 10⁵ cells/well were plated into 6-well plates to a final volume of 2 mL. After a 24 h incubation, solution of SNs-NH2-CuII-CDs (0.5 gL−1) was added to the M-HeLa cells and incubated for 24 h in a CO2 incubator.
Fluorescence microscopy images were obtained by using a Nikon Eclipse Ci-S fluorescence microscope. (Nikon, Tokyo, Japan) at 1000× magnification. M-HeLa cells at 1 × 10⁵ cells/well in a final volume of 2 mL were seeded into 6-well coverslip plates at the bottom of each well. After 24 h of incubation, solutions of the studied SNs-NH2-CuII-CDs (0.5 gL−1) were added to the wells and cultured for 24 h in a CO2 incubator. Then, M-HeLa cells were fixed and stained with DAPI (blue, cell nucleus staining).
Confocal laser microscopy images of the control M-HeLa cell lines and cells, incubated with SNs-NH2-CuII-CDs were obtained by CLMS on an inverted Carl Zeiss LSM 780 confocal laser-scanning microscope (Carl Zeiss, Jena, Germany). M-HeLa cells in an amount of 1 × 10⁵ cells/well in a final volume of 2 mL were seeded in 6-well plates with coverslips at the bottom of each well. After 24 h of incubation, SNs-NH2-CuII-CDs at the concentration of 0.5 gL−1 were added to the wells and incubated for 24 h in a CO2 incubator. Then, the samples were simultaneously stained with DAPI (blue fluorescent) in the amount of 1% of the volume of sample medium for 15 min. The nanoparticles’ luminescence was detected in the green channel. Untreated cells were used as negative control.

3. Results and Discussion

3.1. Synthesis and Characterization of the Hybrid SNs

The amino decoration of SNs was fulfilled within the one-pot synthetic approach; the produced SNs became the nanobeads for CuII ions, which were embedded through coordinative bonds with amino groups at the silica surface, as is schematically shown in Figure 1. The TEM image of the initial SNs-NH2 (Figure 1a) is represented along with the particle size histogram (Figure 1b) built by a log-normal distribution using the Sturges method [32]. The average size value obtained for the number of SNs-NH2 (N = 290) is at the level of 54 ± 5 nm (for a confidence level of 0.68). Values of the extracted average size and size dispersity are included in Table 1. The quantity of amino groups per SN determined by the fluorescamine-based luminescent technique [30] is about 6000. The naked (free of amino groups) SNs (50 nm, Figure S2) were also synthesized as the nanobeads for the embedding of CuII ions with an aim to reveal an impact of the surface-exposed amino groups on the binding of CuII ions. The phase separation facilitated by the centrifugation was used for washing off the unbound Cu(II) ions from SNs-NH2-CuII. The ICP-OES technique was used to determine Si:Cu molar ratios, since such values enable comparing the content of CuII ions, which is quite different for the SNs and SNs-NH2 (Table 1). The embedded CuII ions are manifested by the different spectral patterns in UV-Vis spectra of the dried samples of SNs-CuII and SNs-NH2-CuII (Figure 1c). This, in turn, confirms the difference in both the quantity of the embedded CuII ions and their coordination environment.
The DLS and electrokinetic potential (ζ) measurements reveal both positive surface charging and aggregation of SNs-NH2 (Table 1), since the protonation of the interfacial amino groups recharges the negative charge of the silica surface, but the recharging is insufficient (ζ < 30 mV) to increase the colloidal stability of the nanoparticles. Indeed, both average size and PDI values of SNs-NH2 are greater than those of SNs. The surface-exposed Si–O groups provide the binding sites for CuII ions, although their binding capacity is much lower than that of the surface-exposed amino groups of SNs-NH2. Thus, the binding of SNs with CuII ions results in the partial surface charge neutralization (compare the ζ-values of SNs and SNs-CuII in Table 1), but the binding of SNs-NH2 with CuII ions results in recharging of their surface charge (the ζ-values of SNs-NH2 and SNs-NH2-CuII in Table 1). Thus, the efficient binding of CuII ions via neutral amino groups of SNs-NH2 restricts their protonation which, in turn, is the reason for the recharging of the corresponding ζ-values from positive to negative.
The embedding of the CDs on either SNs-NH2-CuII or SNs-CuII was performed through their mixing with the CDs followed by the centrifugation-induced phase separation, as is schematically demonstrated in Figure 1d. The adsorption of the CDs from the aqueous to the nanoparticulate phase becomes evident from the specific green (λem = 550 nm) fluorescence of the redispersed phase (Figure 2a). However, the emission intensity is significantly greater for SNs-NH2-CuII than SNs-CuII after the treating by CDs, while the initial SNs-NH2 remains nonluminescent after the treating by CDs (Figure 2a). It is worth noting that the phase separation was performed at the instrumental conditions suitable for the phase separation of SNs-NH2-CuII, not for the separation of the CDs themselves (for more details see Section 2). The treating of SNs-NH2-CuII by the CDs results in the appearance of the green emission characteristic of the CDs (Figure 2a). This strongly suggests the adsorption of the CDs onto SNs-NH2-CuII, while no adsorption of the CDs is observed after the similar treating of SNs-NH2, while the treating of SNs-CuII is followed by the small but detectable adsorption of the CDs, which is evident from the emission spectra in Figure 2a. Thus, the CuII ions bound onto the surface of SNs-NH2-CuII and SNs-CuII serve as the anchors for coordinative binding of the CDs. However, the anchoring by the copper ions is greater for SNs-NH2-CuII than SNs-CuII, which is in good agreement with the difference in the binding capacities of Si–O and amino groups. The step-by-step deposition of copper ions followed by the deposition of the CDs exemplifies the well-known layer-by-layer approach controlled by both kinetic and thermodynamic factors, which is well documented for the layer-by-layer deposition of the oppositely charged polyelectrolytes [33]. It is worth noting that the step-by-step deposition of SNs-NH2 by CuII ions and the CDs in a framework of the layer-by-layer synthetic protocol schematically shown in Figure 1d is of key significance in the synthesis of SNs-NH2-CuII-CDs. This, in turn, argues for an impact of kinetic rather than thermodynamic control on the synthesis of SNs-NH2-CuII-CDs. It is worth assuming that the facilitated by copper ions assemblage of the CDs at the surface of SNs-NH2-CuII provides retarding of leaching of the CDs from SNs-NH2-CuII-CDs. The concentration and time conditions were optimized in order to provide the balance of high luminescence and stability of SNs-NH2-CuII-CDs colloids (Figure S3). The TEM images of the dried SNs-NH2-CuII-CDs colloids confirm the deposition of the CDs onto the silica spheres (Figure S4).
Thus, CuII-facilitated coordination bonds are the main driving forces of the adsorption of the CDs on SNs-NH2-CuII. It is worth noting that both SNs-NH2-CuII and CDs are negatively surface charged; thus, the embedding of the CDs onto the surface of SNs-NH2-CuII takes place through the ion exchange process which, in turn, is driven by the coordinative bonds. However, a lability of coordination bonds in CuII complexes is a prerequisite for the distribution of CuII ions between different binding sites provided by the surface-exposed amino groups and the citrate-stabilized CDs. The maximum wavelength red-shifting of the emission of CDs (Figure 2a) confirms their binding with CuII ions, although the coordination of the CuII ions with the “free” CDs also cannot be excluded. The aforesaid is a reason for partial washing out of the CuII ions from SNs-NH2-CuII after their treating by the CDs, which is manifested by the changing of Si:Cu ratios from 1:0.026 to 1:0.005.
The coordinative binding of CuII ions with CDs is the well-known reason for the significant quenching of their fluorescence [15], although the quenching effect depends on the CuII concentration (Figure S5). Thus, the low CuII content in SNs-NH2-CuII-CDs (Table 1) explains the low quenching effect of CuII ions as the reason for the high fluorescence (Figure 2a). The developed synthetic protocol includes the phase separation steps providing washing up of the unbound CDs, but the lability of the coordinative binding is the reason for the equilibration between the bound and unbound CDs as it is schematically demonstrated in Figure 1d. The fluorescence of the SNs-NH2-CuII-CDs aqueous colloids tends to increase within one day after the synthesis with further invariance within one month at least (Figure S3), which indicates that one day is the time period required for the equilibration of SNs-NH2-CuII-CDs with the unbound CDs. The emission band remains invariant within one week at least, while the longer storage for one month results in the back blue-shifting of the band, thus pointing to the disassembly of the CDs from the surface of SNs-NH2-CuII (Figure S3).
The electronic absorption of the CDs in aqueous solutions is manifested by two bands at 335 and 405 nm derived from the sp2-carbon-based aromatic systems with different extent of conjugation (Figure 2b), while the shoulder at ~260 nm is derived from the impurities in the as-prepared CDs. The main bands of CDs are red-shifted in the spectrum of SNs-NH2-CuII-CDs compared to that of CDs (Figure 2b), while the shoulder at ~260 nm disappears due to washing out of the impurities within the synthesis of SNs-NH2-CuII-CDs. Similar bands are revealed in the spectrum of SNs-NH2-CuII-CDs (Figure 2b), although they are somewhat red-shifted. The shifting does not derive from the binding with copper ions, since no significant spectral changes are revealed after their addition to the aqueous CDs colloids (Figure 2b). The latter is rather anticipated since the binding of the CDs with copper ions occurs via the anions and molecules constituting the hydrophilic layer of the CDs, while the red-shifted bands in the spectrum of SNs-NH2-CuII-CDs amplify the assemblage of the CDs onto SNs-NH2-CuII as a possible reason for the above-mentioned stability of SNs-NH2-CuII-CDs. The analysis of the Fourier-transform infrared spectroscopy (FTIR) spectra of CDs and SNs-NH2-CuII-CDs indicates the participation of the amide groups of CDs in the binding with SNs-NH2-CuII. This is evident from the shifting of the band at 1650 cm−1 associated with the amide group of CDs to ∼1720 cm−1 in the spectrum of SNs-NH2-CuII-CDs due to the binding of the amide groups with CuII ions (Figure S6).

3.2. Sensing of GSH by the Fluorescent Response of SNs-NH2-CuII-CDs

It is worth anticipating that the above-mentioned quenching effect of CuII ions on the fluorescence of the CDs (Figure S5) should be a reason for the fluorescence response on the stripping of CuII ions through their chelation with GSH. Figure 3 demonstrates that the fluorescence of CDs reveals the detectable ability of response to GSH at the specific concentration of CuII ions (30 μM at least), while SNs-NH2-CuII-CDs colloids are able to give the fluorescent response to GSH at the lower concentration level of CuII ions. It is also worth noting literature data highlighting the diversity of the complexes under mixing of CuII ions with GSH, including both CuII and CuI ions with GSH and Glutathione disulfide (GSSG) [9]. The fluorescence response of SNs-NH2-CuII-CDs is detectable even at the concentration of GSH below 1.0 μM, which corresponds to GSH:Cu molar ratio less than 1:1. Thus, the luminescent response of SNs-NH2-CuII-CDs is triggered by GSH-induced complex formation, as the prerequisite for further redox transformations followed by the appearance of CuI ions, which are facilitated by the greater molar excess of GSH in regard to CuII ions [14]. The I/I0 values tend to linearly increase up to ~12 μM of GSH (Figure 3). The sensitivity can be quantitatively evaluated by the LOD values (for details of the calculation see Section 2), which are 0.15 and 1.65 μM for SNs-NH2-CuII-CDs and CuII-CDs, respectively. The difference indicates that the same amounts of GSH trigger more pronounced disassembly in SNs-NH2-CuII-CDs than in CuII-CDs, arising from the difference in nanoarchitectures of the aforesaid colloids. The LOD value at 0.15 μM is slightly inferior, but at the same order as the LOD values (0.11 [34] and 86 nM [35]) achieved in the sensing of GSH through the emission response of the amino-modified CDs bound with CuII ions.

3.3. ROS Generation

The chemodynamic effect of CuII-containing nanomaterials is based on the production of hydroxyl radicals through the equilibrium (1). Thus, the reduction of CuII by glutathione is the prerequisite step for ROS generation.
CuI + H2O2 + H+ = CuII + OH∙ + H2O
The ESR technique facilitated by the use of DMPO as the spin traps is a powerful tool in the detection of ROS [36,37,38,39], including those generated by copper ions [40]. As has been mentioned above, at least 3-fold molar excess of GSH in regard to CuII ions is required for the production of CuI-(GSH)2 through the equilibriums (2 and 3), which, in turn, generates OH∙ radicals in the oxygenated aqueous solutions [14].
2CuII-GSSG + 2GSH = 2CuI-GSSG + GSSG + 2H+
CuI-GSSG + 2GSH = CuI-(GSH)2 + GSSG
Figure 4a illustrates the rather low intensity of the ESR signals generated by SNs-NH2-CuII in aqueous solutions of DMPO. The arrows demonstrate the insignificant level of the signals derived from the DMPO-OH∙ adducts [41], while the other ones most probably arise from the trace amounts of copper-initiated oxidized forms of DMPO, although the designation of their nature lies out of the scope of the present work due to their low intensity. The addition of GSH (50 μM) to SNs-NH2-CuII in 5:1 GSH:Cu concentration ratio suppresses all weak signals generated by SNs-NH2-CuII in the solution of DMPO (Figure 4a), while the signals peculiar for DMPO-OH∙ adduct grow under the addition of GSH (350 μM) resulting in the GSH:Cu ratio 35:1, although the intensity of the signals comes to the detectable level after the gentle heating of the sample from 22 to 38 °C (Figure S7 and Figure 4). This fact confirms the impact of the reductive potential of GSH on the ROS generation in the CuII-based nanomaterials.
The ESR technique reveals the generation of the detectable aggregate signals in the aqueous colloids of SNs-NH2-CuII-CDs themselves; the intensity of the bands also tends to increase with the temperature growth from 22 to 38 °C (Figure S7 and Figure 4b). The aggregate nature of the signals results from the interference of DMPO-OH∙ and DMPO-X∙ (X∙ denotes the methyl and alkoxy radicals [42]), as is clear from the simulation and summarizing of DMPO-OH∙ and DMPO-X∙ signals shown in Figure 4c. The aqueous colloids of the CDs generate a similar spectral pattern in the presence of CuII ions at 38 °C (Figure 4b,c). The aforesaid indicates that the combination of the green-emitting CDs with CuII ions is the prerequisite for the self-boosting generation of OH∙ and X∙ radicals. The potential of the green-emitting CDs to reduce CuII is derived from the complex nature of the CDs constructed from carbon atoms at different oxidation states from 0 to +4. The low oxidation states of carbon are the prerequisite for their reductive potential, since the ability of carbon and carbon oxide to reduce CuO to Cu2O is well known [43]. The already documented examples of the sensing of bromate in aqueous solutions due to the reductive potential of CDs also argue for the aforesaid tendency [12]. Thus, the reductive potential of the CDs is the reason for the production of CuI complexes, which in turn generate OH∙ and X∙ radicals.
The addition of GSH up to the level of 350 μM to SNs-NH2-CuII-CDs quenches the already generated DMPO-OH∙ and DMPO-X∙ signals at 22 °C since the radicals are taken up by GSH due to its efficient scavenger function deriving from the easy transformation into GSSG [14]. However, the heating of the sample to 38 °C generates the signal of DMPO-OH∙ adducts (Figure 4b) without any contribution of DMPO-X∙ adduct signals. The increased amounts of GSH (1.0 mM) intensify the signals of DMPO-OH∙ spin-adducts, while the intensity of the signals gradually decreases with further increase in the concentration to 3 and 7 mM and disappears at 10.0 mM GSH, even at 38 °C (Figure 4b). This indicates that the production of Cu(I) ions due to the reductive function of GSH is predominant at the concentration level of 350 μM–1 mM. However, the scavenger effect of GSH increases with further concentration growth, being predominant when the concentration level of GSH reaches 10 mM. Taking into account that the intracellular level of GSH varies within 1–10 mM, being greater in cancer cells than in normal cells [44,45], the cytotoxic effect of SNs-NH2-CuII-CDs should be greatly affected by the nature of cells. Moreover, the temperature variation in the physiological range (37–40 °C) should be noted as the factor affecting the ROS generation by SNs-NH2-CuII-CDs colloids under their cell internalization.

3.4. Cell Internalization of SNs-NH2-CuII-CDs and Its Effect on Cell Viability

The amino-decorated SNs commonly demonstrate good cell internalization [46,47], although the surface decoration of nanoparticles plays an essential role in their interactions with cells [48]. The cell internalization of CDs [49,50,51,52] is very efficient; thus, SNs-NH2-CuII-CDs with the surface-exposed CDs can demonstrate perfect cellular uptake behavior. The cell viability after the incubation with SNs-NH2-CuII-CDs and SNs-NH2-CuII was measured for M-HeLa and Chang Liver cell lines prior to flow cytometry measurements, and the results are shown in Table 2. The results presented in Table 2 indicate that the cell viability values are no less than 60% even at 1 gL−1. This clearly demonstrates the very low cytotoxic effect of SNs-NH2-CuII-CDs on the cell viability of M-HeLa and Chang Liver standard cell lines, with the IC50 value above 1 gL−1 (Table 2). It is worth noting that such a high IC50 value is comparable with the cytotoxicity of the naked silica nanoparticles [53].
Both flow cytometry data and fluorescence microscopy imaging reveal efficient cellular uptake behavior of SNs-NH2-CuII-CDs (Figure 5a and Figure S8). The staining of an intracellular space by the “free” CDs is commonly limited by poor entry to the cell nuclei [49,50,51]. The confocal microscopy images of the cells incubated by SNs-NH2-CuII-CDs colloids indicate the cytoplasmatic localization of the colloids, with some entering into the cell nuclei (Figure 5b), while the confocal images of M-HeLa cells after the incubation by the CDs indicate a rather poor staining of the cell nuclei (Figure S9). The revealed specificity of SNs-NH2-CuII-CDs in the cell internalization does not result in a detectable effect on the cell viability (Table 2). This may be due to the high intracellular level of GSH, although further widening of cell lines with different intracellular levels of GSH is required to argue for or against this assumption.
The cell viability of M-HeLa cells is insignificantly affected by both SNs-NH2-CuII-CDs and SNs-NH2-CuII (Table 2). This can be explained by the predominance of the scavenger effect compared to the reductive effect of GSH, which in turn is dependent on its intracellular level, although wider cell line variation is required for revealing an impact of the cell lines on the cytotoxicity of SNs-NH2-CuII-CDs. Nevertheless, the represented results for the first time introduce the proof of concept of the use of CuII-based coordinative bonds as the driving force of both the assemblage of CDs at the surface of SNs-NH2 and self-boosting ROS generation. It is also demonstrated that the CuII-facilitated surface decoration of SNs-NH2 by the green-emitting CDs provides the basis for stimuli-responsive fluorescence, which along with the spin-trap-facilitated ESR technique enables highlighting the impact of GSH concentration on the predominance of different functions of GSH, such as complex formation, scavenger of radicals and reducing agent.

4. Conclusions

In summary, the present report highlights the coordinative bonds as the driving forces of the self-assembly of green-emitting CDs facilitated by CuII ions at the surface of amino-modified silica nanoparticles (SNs-NH2), resulting in the SNs-NH2-CuII-CDs aqueous colloids. The green fluorescence of the CDs incorporated into SNs-NH2-CuII-CDs is somewhat quenched and red-shifted compared to that of the unbound CDs, which results from their coordinative binding with CuII ions. The fluorescence of SNs-NH2-CuII-CDs is contributed by the assembled and the unbound CDs equilibrated with each other. The removal of CuII ions from SNs-NH2-CuII-CDs due to their chelating with GSH destroys the CuII-facilitated assemblage of CDs, leading to the growing extent of the unbound CDs. This, in turn, is manifested by the blue-shifting and enhancement of the fluorescence band, which enables sensing GSH with the LOD value at 0.15 µM. The spin-trap-facilitated ESR technique was applied to reveal the chemodynamic activity of SNs-NH2-CuII and SNs-NH2-CuII-CDs aqueous colloids themselves and in the presence of different amounts of GSH. The results for the first time demonstrate the self-boosting generation of hydroxyl (OH∙), alkyl and alkoxy (X∙) radicals by SNs-NH2-CuII-CDs. The revealed tendencies highlight the reductive potential of the CDs as the reason for the generation of OH∙ and X∙ in the aqueous colloids of SNs-NH2-CuII-CDs, which is enhanced with the temperature rise within 22–40 °C. The ESR measurements at different concentrations of GSH reveal the different effects of GSH, namely quenching of the radical species at 5:1 GSH:Cu molar ratio and generation of OH∙ radicals at the ratio above 100:1, while the generation of OH∙ and X∙ ceases when the ratio reaches 1000:1. This highlights the concentration conditions optimal for scavenger and reductive potentials of GSH. The flow cytometry and fluorescence and confocal microscopy methods revealed the specificity in the cell internalization and intracellular localization of SNs-NH2-CuII-CDs in comparison with those of the carbon dots themselves. The low cytotoxic effects of both SNs-NH2-CuII-CDs and SNs-NH2-CuII on the cell viability of M-HeLa and Chang Liver cell lines can be explained by the intracellular level of GSH being sufficient for the predominance of its scavenger effect.

Supplementary Materials

The following supporting information can be downloaded at: https://0-www-mdpi-com.brum.beds.ac.uk/article/10.3390/coatings12010097/s1, Figure S1. (a) The emission spectra of fluorophore, obtained from interaction of fluorescamine (0.55 mM) with various concentrations of alanine (1—1.6 × 10⁻⁷, 2—1 × 10⁻⁶, 3—2.5 × 10⁻⁶, 4—4 × 10⁻⁶, 5−5.5 × 10⁻²), SNs-NH2 (6) (0.05 gL−1), at 0.025 M borate buffer pH = 9, λex = 390 nm; (b) the calibration graphic; Figure S2. TEM-image of SNs; Figure S3. The emission spectra of water dispersion of SNs-NH2-CuII-CDs (0.5 gL−1): (a) prepared by mixing of water dispersions of SNs-NH2-CuII and CDs at different concentration ratios (SNs:CDs) designated on the graphic, after 1 day of storage; (b) SNs-NH2-CuII-CDs prepared at SNs:CDs=1:20 after various period of time of this system storage (also designated on the graphic). λex = 420 nm, slit = 5 nm, voltage = 500 mV; Figure S4. TEM-image of SNs-NH2-CuII-CDs, where SNs are manifested by the larger silica spheres, while the CDs as black dots on their surface; Figure S5. The dependence of the emission intensity of CDs (0.005 gL−1) on the concentration of CuCl2 in water; λex = 420 nm, slit = 5 nm, voltage = 700 mV. The emission intensity was normalized to initial luminescent intensity of CDs before addition of water solution of CuCl2; Figure S6. The Infrared spectrum of CDs (black) and SNs-NH2-CuII-CDs (blue); Figure S7. The ESR spectra of SNs-NH2-CuII-CDs (0.5 gL−1; 10 μM of CuII) in the presence of GSH at 50, 350 and 1000μM with DMPO spin trap (0.1 M) at 22 °C; Figure S8. Fluorescent microscopy images of M-HeLa cells incubated with SNs-NH2-CuII-CDs at 0.5 gL−1 (Nikon eclipse Ci, ×1000 oil); Figure S9. Confocal laser microscopy images of the control M-HeLa cell lines (A–C) and cells, incubated with CDs (D–F) at 0.5 gL−1 stained with DAPI.

Author Contributions

Conceptualization, A.M.; Investigation, O.B., A.D. (Alexey Dovjenko), K.K., R.B., I.N., A.L. (Artem Laskin), A.V., A.L. (Anna Lyubina), S.A., T.G., A.D. (Amina Daminova) and V.E.; Resources, R.Z. and S.F.; Supervision, A.M.; Visualization, O.B., A.D. (Alexey Dovjenko), R.B. and A.V.; Writing—original draft, A.D. (Alexey Dovjenko) and K.K.; Writing—review and editing, O.B. and A.M. All authors have read and agreed to the published version of the manuscript.

Funding

Authors gratefully acknowledge RFBR and CNR, Grant No. 20-53-7802A for financial support.

Institutional Review Board Statement

Not applicable.

Informed Consent Statement

Not applicable.

Data Availability Statement

Data sharing is not applicable to this article.

Acknowledgments

Authors gratefully acknowledge Assigned Spectral-Analytical Center of FRC Kazan Scientific Center of RAS for providing necessary facilities to carry out physical-chemical measurements.

Conflicts of Interest

The authors declare no conflict of interest.

References

  1. Lucena, R.; Simonet, B.M.; Cárdenas, S.; Valcárcel, M. Potential of nanoparticles in sample preparation. J. Chromatogr. A 2011, 1218, 620–637. [Google Scholar] [CrossRef] [PubMed]
  2. Calabrese, C.; Parola, V.L.; Testa, M.L.; Liotta, L.F. Antifouling and antimicrobial activity of Ag, Cu and Fe nanoparticles supported on silica and titania. Inorg. Chim. Acta 2022, 529, 120636. [Google Scholar] [CrossRef]
  3. Shibu, E.S.; Hamada, M.; Murase, N.; Biju, V. Nanomaterials formulations for photothermal and photodynamic therapy of cancer. J. Photochem. Photobiol. C Photochem. Rev. 2013, 15, 53–72. [Google Scholar] [CrossRef]
  4. Zhong, W. Nanomaterials in fluorescence-based biosensing. Anal. Bioanal. Chem. 2009, 394, 47–59. [Google Scholar] [CrossRef] [Green Version]
  5. Cao, L.; Wang, X.; Meziani, M.J.; Lu, F.; Wang, H.; Luo, P.G.; Lin, Y.; Harruff, B.A.; Veca, L.M.; Murray, D.; et al. carbon dots for multiphoton bioimaging. J. Am. Chem. Soc. 2007, 129, 11318–11319. [Google Scholar] [CrossRef] [Green Version]
  6. Baker, S.N.; Baker, G.A. Luminescent carbon nanodots: Emergent nanolights. Angew. Chem. Int. Ed. 2010, 49, 6726–6744. [Google Scholar] [CrossRef]
  7. Liu, J.; Rehman, S.; Fu, Z.; Liu, Y.; Lu, Y.; Bi, H.; Morais, P.C. Room-temperature multiferroicity in magnetic field-poled polyaniline and its enhancement via Cu2+-complexation. Synth. Met. 2019, 253, 131–140. [Google Scholar] [CrossRef]
  8. Wieszczycka, K.; Staszak, K.; Wozniak-Budych, M.J.; Litowczenko, J.; Maciejewska, B.M.; Jurga, S. Surface functionalization—The way for advanced applications of smartmaterials. Coord. Chem. Rev. 2021, 436, 2138462. [Google Scholar] [CrossRef]
  9. Choudhury, N.; Saha, B.; De, P. Recent progress in polymer-based optical chemosensors for Cu2+ and Hg2+ Ions: A comprehensive review. Eur. Polym. J. 2021, 145, 110233. [Google Scholar] [CrossRef]
  10. Ghaferi, M.; Esfahani, M.K.M.; Raza, A.; Harthi, S.A.; Shahmabadi, H.E.; Alavi, S.E. Mesoporous silica nanoparticles: Synthesis methods and their therapeutic use-recent advances. J. Drug Target. 2021, 29, 131–154. [Google Scholar] [CrossRef]
  11. Sarker, M.Z.; Rahman, M.M.; Minami, H.; Suzuki, T.; Hossain, M.K.; Ahmad, H. Mesoporous amine functionalized SiO2 supported Cu nanocatalyst and a kinetic-mechanistic degradation study of azo dyes. Colloids Surf. A Physicochem. Eng. Asp. 2021, 617, 126403. [Google Scholar] [CrossRef]
  12. Xiang, G.; Fan, H.; Zhang, H.; He, L.; Jiang, X.; Zhao, W. Carbon dot doped silica nanoparticles as fluorescent probe for determination of bromate in drinking water samples. Can. J. Chem. 2018, 96, 24–29. [Google Scholar] [CrossRef] [Green Version]
  13. Zhao, S.; Sun, S.; Jiang, K.; Wang, Y.; Liu, Y.; Wu, S.; Li, Z.; Shu, Q.; Lin, H. In Situ Synthesis of Fluorescent Mesoporous Silica–Carbon Dot Nanohybrids Featuring Folate Receptor-Overexpressing Cancer Cell Targeting and Drug Delivery. Nano-Micro Lett. 2019, 11, 32. [Google Scholar] [CrossRef] [Green Version]
  14. Aliaga, M.E.; López Alarcón, C.; Bridi, R.; Speisky Cosoy, H. Redox-implications associated with the formation of complexes between copper ions and reduced or oxidized glutathione. J. Inorg. Biochem. 2016, 154, 78–88. [Google Scholar] [CrossRef]
  15. Sun, S.; Chen, Q.; Tang, Z.; Liu, C.; Li, Z.; Wu, A.; Lin, H. Tumor microenvironment stimuli-responsive fluorescence imaging and synergistic cancer therapy by carbon-dot–Cu2+ nanoassemblies. Angew. Chem. Int. Ed. 2020, 59, 2–10. [Google Scholar] [CrossRef]
  16. Połeć-Pawlak, K.; Ruzik, R.; Lipiec, E. Investigation of Cd(II), Pb(II) and Cu(I) complexation by glutathione and its component amino acids by ESI-MS and size exclusion chromatography coupled to ICP-MS and ESI-MS. Talanta 2007, 72, 1564–1572. [Google Scholar] [CrossRef]
  17. Xu, M.; Yang, G.; Bi, H.; Xu, J.; Feng, L.; Yang, D.; Sun, Q.; Gai, S.; He, F.; Dai, Y.; et al. Combination of CuS and g-C3N4 QDs on upconversion nanoparticles for targeted photothermal and photodynamic cancer therapy. Chem. Eng. J. 2019, 360, 866–878. [Google Scholar] [CrossRef]
  18. Ma, B.; Wang, S.; Liu, F.; Zhang, S.; Duan, J.; Li, Z.; Kong, Y.; Sang, Y.; Liu, H.; Bu, W.; et al. Self-Assembled Copper–Amino Acid Nanoparticles for in Situ Glutathione “AND” H2O2 Sequentially Triggered Chemodynamic Therapy. J. Am. Chem. Soc. 2019, 141, 849–857. [Google Scholar] [CrossRef]
  19. Cao, S.; Li, X.; Gao, Y.; Li, F.; Li, K.; Cao, X.; Dai, Y.; Mao, L.; Wang, S.; Tai, X. A simultaneously GSH-depleted bimetallic Cu(ii) complex for enhanced chemodynamic cancer therapy. Dalton Trans. 2020, 49, 11851–11858. [Google Scholar] [CrossRef]
  20. Wu, H.; Chen, F.; Gu, D.; You, C.; Sun, B. A pH-activated autocatalytic nanoreactor for self-boosting Fenton-like chemodynamic therapy. Nanoscale 2020, 12, 17319–17331. [Google Scholar] [CrossRef]
  21. Nikam, A.N.; Pandey, A.; Fernandes, G.; Kulkarni, S.; Mutalik, S.P.; Padya, B.S.; George, S.D.; Mutalik, S. Copper sulphide based heterogeneous nanoplatforms for multimodal therapy and imaging of cancer: Recent advances and toxicological perspectives. Coord. Chem. Rev. 2020, 419, 213356. [Google Scholar] [CrossRef]
  22. Wang, X.; Zhong, X.; Liu, Z.; Cheng, L. Recent progress of chemodynamic therapy-induced combination cancer therapy. Nano Today 2020, 35, 100946. [Google Scholar] [CrossRef]
  23. Yang, B.; Chen, Y.; Shi, J. Reactive Oxygen Species (ROS)-Based Nanomedicine. Chem. Rev. 2019, 119, 4881–4985. [Google Scholar] [CrossRef]
  24. Zhong, Y.; Li, X.; Chen, J.; Wang, X.; Wei, L.; Fang, L.; Kumar, A.; Zhuang, S.; Liu, J. Recent advances in MOF-based nanoplatforms generating reactive species for chemodynamic therapy. Dalton Trans. 2020, 49, 11045–11058. [Google Scholar] [CrossRef]
  25. Hu, J.; Liu, S. Modulating intracellular oxidative stress via engineered nanotherapeutics. J. Control. Release 2020, 319, 333–343. [Google Scholar] [CrossRef]
  26. Wang, W.; Zhang, Q.; Zhang, M.; Liu, Y.; Shen, J.; Zhou, N.; Lua, X.; Zhao, C. Multifunctional red carbon dots: A theranostic platform for magnetic resonance imaging and fluorescence imaging-guided chemodynamic therapy. Analyst 2020, 145, 3592–3597. [Google Scholar] [CrossRef]
  27. Zholobak, N.M.; Popov, A.L.; Shcherbakov, A.B.; Popova, N.R.; Guzyk, M.M.; Antonovich, V.P.; Yegorova, A.V.; Scrypynets, Y.V.; Leonenko, I.I.; Baranchikov, A.Y.; et al. Facile fabrication of luminescent organic dots by thermolysis of citric acid in urea melt, and their use for cell staining and polyelectrolyte microcapsule labelling. Beilstein J. Nanotechnol. 2016, 7, 1905–1917. [Google Scholar] [CrossRef] [PubMed] [Green Version]
  28. Liu, S.; Zhang, H.-L.; Liu, T.-C.; Liu, B.; Cao, Y.-C.; Huang, Z.-L.; Zhao, Y.-D.; Luo, Q.-M. Optimization of methods for intoduction of amine groups onto the silica nanoparticle surface. J. Biomed. Mater. Res. 2007, 80A, 752–757. [Google Scholar] [CrossRef] [PubMed]
  29. Mustafina, A.R.; Fedorenko, S.V.; Konovalova, O.D.; Menshikova, A.Y.; Shevchenko, N.N.; Soloveva, S.E.; Konovalov, A.I.; Antipin, I.S. Novel Highly Charged Silica-Coated Tb(III) Nanoparticles with Fluorescent Properties Sensitive to Ion Exchange and Energy Transfer Processes in Aqueous Dispersions. Langmuir 2009, 25, 3146–3151. [Google Scholar] [CrossRef] [PubMed]
  30. Chen, Y.; Zhang, Y. Fluorescent quantification of amino groups on silica nanoparticle surfaces. Anal. Bioanal. Chem. 2011, 399, 2503–2509. [Google Scholar] [CrossRef] [PubMed]
  31. Sharipova, R.R.; Belenok, M.G.; Garifullin, B.F.; Sapunova, A.S.; Voloshina, A.D.; Andreeva, O.V.; Strobykina, I.Y.; Skvortsova, P.V.; Zuev, Y.F.; Kataev, V.E. Synthesis and anti-cancer activities of glycosides and glycoconjugates of diterpenoid isosteviol. Med. Chem. Comm. 2019, 10, 1488–1498. [Google Scholar] [CrossRef]
  32. Aragon, F.H.; Coaquira, J.A.H.; Villegas-Lelovsky, L.; Silva, S.W.; Cesar, D.F.; Nagamine, L.C.C.M.; Cohen, R.; Menéndez-Proupin, E.; Morais, P.C. Evolution of the doping regimes in the Al-doped SnO2 nanoparticles prepared by a polymer precursor method. J. Phys. Cond. Matter 2015, 27, 095301. [Google Scholar] [CrossRef]
  33. Sukhishvili, S.A.; Kharlampieva, E.; Izumrudov, V. Where polyelectrolyte multilayers and polyelectrolyte complexes meet. Macromolecules 2006, 39, 8873–8881. [Google Scholar] [CrossRef]
  34. Yang, R.; Guo, X.; Jia, L.; Zhang, Y. A fluorescent “on-off-on” assay for selective recognition of Cu(II) and glutathione based on modified carbon nanodots, and its application to cellular imaging. Microchim. Acta 2017, 184, 1143–1150. [Google Scholar] [CrossRef]
  35. Guo, Y.; Yang, L.; Li, W.; Wang, X.; Shang, Y.; Li, B. Carbon dots doped with nitrogen and sulfur and loaded with copper(II) as a “turn-on” fluorescent probe for cystein, glutathione and homocysteine. Microchim. Acta 2016, 183, 1409–1416. [Google Scholar] [CrossRef]
  36. Elistratova, J.; Mukhametshina, A.; Kholin, K.; Nizameev, I.; Mikhailov, M.; Sokolov, M.; Khairullin, R.; Miftakhova, R.; Shammas, G.; Kadirov, M.; et al. Interfacial uploading of luminescent hexamolybdenum cluster unitsonto amino-decorated silica nanoparticles as new design ofnanomaterial for cellular imaging and photodynamic therapy. J. Colloid Interface Sci. 2019, 538, 387–396. [Google Scholar] [CrossRef]
  37. Fedorenko, S.; Elistratova, J.; Stepanov, A.; Khazieva, A.; Mikhailov, M.; Sokolov, M.; Kholin, K.; Nizameev, I.; Mendes, R.; Rümmeli, M.; et al. ROS-generation and cellular uptake behavior of amino-silica nanoparticles arisen from their uploading by both iron-oxides and hexamolybdenum clusters. Mater. Sci. Eng. C 2020, 117, 1113052. [Google Scholar] [CrossRef]
  38. Abbas, K.; Babić, N.; Peyrot, F. Use of spin traps to detect superoxide production in living cells by electron paramagnetic resonance (EPR) spectroscopy. Methods 2016, 109, 31–43. [Google Scholar] [CrossRef]
  39. Carini, M.; Aldini, G.; Orioli, M.; Facino, R. Electron paramagnetic resonance (EPR) spectroscopy: A versatile and powerful tool in pharmaceutical and biomedical analysis. Curr. Pharm. Anal. 2006, 2, 141–159. [Google Scholar] [CrossRef]
  40. Angelé-Martínez, C.; Nguyen, K.V.T.; Ameer, F.S.; Anker, J.N.; Brumaghim, J.L. Reactive oxygen species generation by copper(II) oxide nanoparticles determined by DNA damage assays and EPR spectroscopy. Nanotoxicology 2017, 11, 278–288. [Google Scholar] [CrossRef] [Green Version]
  41. Hedrick, W.R.; Webb, M.D.; Zimbrick, J.D. Spin trapping of reactive uracilyl radicals produced by ionizing radiation in aqueous solutions. Inter. J. Radiat. Biol. Relat. Stud. Phys. Chem. Med. 1982, 41, 435–442. [Google Scholar] [CrossRef]
  42. Kirino, Y.; Ohkuma, T.; Kwan, T. Spin trapping with 5,5-dimethylpyrroline-N-oxide in aqueous solution. Chem. Pharm. Bull. 1981, 29, 29–34. [Google Scholar] [CrossRef] [Green Version]
  43. Liu, L.; Zhang, T.J.; Cui, K.; Dong, Y.D. Reduction of copper oxide with graphite by mechanical alloying. J. Mater. Res. 1999, 14, 4062–4069. [Google Scholar] [CrossRef]
  44. Jiang, C.; Zhang, C.; Song, J.; Ji, X.; Wang, W. Cytidine-gold nanoclusters as peroxidase mimetic for colorimetric detection of glutathione (GSH), glutathione disulfide (GSSG) and glutathione reductase (GR). Spectrochim. Acta Part A Mol. Biomol. Spectrosc. 2021, 250, 119316. [Google Scholar] [CrossRef]
  45. Xiong, Y.; Xiao, C.; Li, Z.; Yang, X. Engineering nanomedicine for glutathione depletion-augmented cancer therapy. Chem. Soc. Rev. 2021, 50, 6013. [Google Scholar] [CrossRef]
  46. Shahabi, S.; Treccani, L.; Dringen, R.; Rezwan, K. Modulation of Silica Nanoparticle Uptake into Human Osteoblast Cells by Variation of the Ratio of Amino and Sulfonate Surface Groups: Effects of Serum. ACS Appl. Mater. Interfaces 2015, 7, 13821–13833. [Google Scholar] [CrossRef] [Green Version]
  47. Fedorenko, S.V.; Mustafina, A.R.; Mukhametshina, A.R.; Jilkin, M.E.; Mukhametzyanov, T.A.; Solovieva, A.O.; Pozmogova, T.N.; Shestopalova, L.V.; Shestopalov, M.A.; Kholin, K.V.; et al. Cellular imaging by green luminescence of Tb(III)-doped aminomodified silica nanoparticles. Mater. Sci. Eng. C 2017, 76, 551–558. [Google Scholar] [CrossRef]
  48. Verma, A.; Stellacci, F. Effect of Surface Properties on Nanoparticle–Cell Interactions. Small 2010, 6, 12–21. [Google Scholar] [CrossRef]
  49. Li, Q.; Ohulchanskyy, T.Y.; Liu, R.; Koynov, K.; Wu, D.; Best, A.; Kumar, R.; Bonoiu, A.; Prasad, P.N. Photoluminescent carbon dots as biocompatible nanoprobes for targeting cancer cells in vitro. J. Phys. Chem. C 2010, 114, 12062–12068. [Google Scholar] [CrossRef]
  50. Zhu, S.; Zhang, J.; Qiao, C.; Tang, S.; Li, Y.; Yuan, W.; Li, B.; Tian, L.; Liu, F.; Hu, R.; et al. Strongly green-photoluminescent graphene quantum dots for bioimaging applications. Chem. Commun. 2011, 47, 6858–6860. [Google Scholar] [CrossRef]
  51. Su, W.; Wu, H.; Xu, H.; Zhang, Y.; Li, Y.; Li, X.; Fan, L. Carbon dots: A booming material for biomedical applications. Mater. Chem. Front. 2020, 4, 821–836. [Google Scholar] [CrossRef]
  52. Harush-Frenkel, O.; Debotton, N.; Benita, S.; Altschuler, Y. Targeting of nanoparticles to the clathrin-mediated endocytic pathway. Biochem. Biophys. Res. Commun. 2007, 353, 26–32. [Google Scholar] [CrossRef] [PubMed]
  53. Zhu, J.; Liao, L.; Zhu, L.; Zhang, P.; Guo, K.; Kong, J.; Ji, C.; Liu, B. Size-dependent cellular uptake efficiency, mechanism, and cytotoxicity of silica nanoparticles toward HeLa cells. Talanta 2013, 107, 408–415. [Google Scholar] [CrossRef] [PubMed]
Figure 1. (a) TEM image of SNs-NH2; (b) the particle size histograms and the corresponding curve fitting of sample SNs-NH2 (d0—average diameter, σ—log-normal distribution parameter); (c) UV-Vis/DR spectra of dried samples of SNs-CuII (1) and SNs-NH2-CuII (2); (d) schematic representation of the stepwise synthesis of hybrid nanoparticles SNs-NH2-CuII-CDs (silanol groups are presented only at the first step not to complicate the figure).
Coatings 12 00097 g001
Figure 2. (a) Emission spectra of unbound CDs (1, 0.005 gL−1) and CDs on the surface of SNs-NH2-CuII (2, 0.05 gL−1), SNs-NH2 (3, 0.05 gL−1) and SNs-CuII (4, 0.05 gL−1) in water; (b) UV-Vis spectra of water dispersion of CDs (1, 0.02 gL−1), SNs-NH2-CuII-CDs (2, 0.2 gL−1), CuII-CDs (3, 1.2 mM of CuCl2) and SNs-NH2-CuII (4, 0.2 gL−1).
Coatings 12 00097 g002
Figure 3. The I/I0 values (I0 and I are the fluorescence intensities at 530 nm of SNs-NH2-CuII-CDs itself and at different concentrations of GSH) versus GSH concentration in water for SNs-NH2-CuII-CDs (1, 0.05 gL−1, 1 μM of CuII) and CuII-CDs (2, 3) at 30 μM (2) and 300 μM (3) of CuCl2 and CCD = 0.005 gL−1.
Coatings 12 00097 g003
Figure 4. ESR signals of aqueous dispersions of SNs-NH2-CuII (a) and SNs-NH2-CuII-CDs (b) (0.5 gL−1; 10 μM of CuII) in the presence of GSH at 50 μM, 350 μM, 1 mM, 3 mM, 7 mM and 10 mM with DMPO spin trap (0.1 M); DMPO-OH∙ signal positions are shown by arrows. In addition, experimental (exp) and simulated (sim) ESR signal of CuII-CDs (10 μM of CuII and 0.5 gL−1 of CDs) and SNs-NH2-CuII-CDs colloids (c); ESR signal is the interference of DMPO-X∙ spin-adducts (sim1), an oxidized DMPO radical (sim2) and DMPO-OH∙ spin-adducts (sim3). The experimental spectra were recorded at 38 °C.
Coatings 12 00097 g004
Figure 5. (a) Cellular uptake study: 1—Control; 2—SNs-NH2-CuII-CDs (0.5 gL−1). (b) Confocal laser microscopy images of the control M-Hela cell lines (AC) and cells incubated with SNs-NH2-CuII-CDs (DF) at 0.5 gL−1 stained with DAPI.
Coatings 12 00097 g005
Table 1. Values of averaged diameter (dTEM) evaluated by TEM method and averaged hydrodynamic diameter (dDLS), polydispersity index (PDI), ζ-potential values and mean peaks (nanoparticle distribution by volume, instead of dDLS at PDI > 0.4) evaluated by DLS technique for different systems, as well as the content of Cu in nanoparticle dispersion (0.1 gL−1) and Si to Cu molar ratio obtained by ICP-OES technique.
SystemdTEM, nmdDLS, nmPDIζ, mVMean Peaks, nmSi:CuContent of Cu, mol·L−1
SNs-NH255 ± 5*0.43722220 and 1496--
SNs-NH2-CuII-*0.428−33231 and 12891:0.0261.7 × 10−5
SNs-NH2-CuII-CDs-266 ± 90.334−31-1:0.0051.8 × 10−6
SNs50 ± 5128 ± 10.352−36---
SNs-CuII-113 ± 20.248−23-1:0.0075 × 10⁻⁶
SNs-CuII-CDs-207 ± 20.184−24-1:0 ****
CDs (C = 0.005 gL−1)-*0.558−24467; 4962--
CDs + 30 μM CuCl2-*0.628−193; 602; 3615-3 × 10⁻⁵
CDs + 300 μM CuCl2-*0.627−15175; 886; 5203-3 × 10⁻⁴
* ζ-values and dDLS cannot be accurately evaluated at PDI > 0.4. ** Cu content is too low for evaluation.
Table 2. The cell viability and IC50 values of M-HeLa and Chang Liver cells in the presence of different concentrations of SNs-NH2-CuII-CDs and SNs-NH2-CuII.
CompoundConcentration, gL−1M-HeLaChang Liver
Cell Viability,%IC50Cell Viability,%IC50
SNs-NH2-CuII-CDs171.3>1 gL−162.2>1 gL−1
0.579.364.4
0.2582.574.5
0.12510079.4
0.062510083.8
0.031310087.9
SNs-NH2-CuII169.3>1 gL−163.8>1 gL−1
0.575.1367.4
0.2576.378.9
0.12579.179.1
0.062510082.3
0.031310089.8
Publisher’s Note: MDPI stays neutral with regard to jurisdictional claims in published maps and institutional affiliations.

