
Effect of the Injection Structure on Gas Velocity Distribution in a 3D Vertical Oven
by
Qiucheng Zhou
1,
Zhanyu Yang
1,
Changsong Zheng
1,
Liping Wei
1,2,3,*,
Dong Li
1,3,* and
Xiaoyong Fan
4 1
School of Chemical Engineering, Northwest University, Xi’an 710069, China
2
Xi’an Key Laboratory of Special Energy Materials, Northwest University, Xi’an 710069, China
3
The Research Center of Chemical Engineering Applying Technology for Resource of Shaanxi, Xi’an 710069, China
4
Shaanxi Key Laboratory of Low Metamorphic Coal Clean Utilization, School of Chemistry and Chemical Engineering, Yulin University, Yulin 719000, China
*
Authors to whom correspondence should be addressed.
Coatings 2023, 13(10), 1707; https://0-doi-org.brum.beds.ac.uk/10.3390/coatings13101707
Submission received: 3 August 2023
/
Revised: 8 September 2023
/
Accepted: 12 September 2023
/
Published: 28 September 2023
(This article belongs to the Special Issue Liquid–Fluid Interfaces and Dynamics)
Abstract
:Gas injection structures were designed for a vertical oven to improve the gas–solid flow countercurrent structure. This work measured the wall temperature distribution of the vertical oven to reflect gas velocity distribution, and simulated the basic gas–solid flow field. The effects of the number of gas orifice layers and the injection angle on the gas velocity distribution were examined. The results showed that number of gas injection layers had a significant effect on the gas velocity distribution in the lower zone. Compared with the distributions with one or three injection layers, two injection layers produce more uniform gas flow. A small particle size of 6–15 mm increased the bed resistance and solid fraction standard deviation. A nozzle angle of 45° was conducive to increase the gas velocity in the upper zone and forming a more uniform gas distribution.
1. Introduction
Blue coke, a type of granular coal char produced during pyrolysis in the temperature range of 500–750 °C, has gained wide recognition for its unique high reactivity and electrical resistivity [1]. It has been extensively used in various industrial applications, such as smelting reduction, calcium carbide reduction, fixed-bed gasification, and blast furnace injection, as well as in industrial and civil fuel [2]. In China, the production capacity of blue coke is estimated to be about 129 million t/a, with an output of 60 million t/a. The coal tar byproduct at medium–low temperature is around 8.5 million t/a, while the gas production in 2021 was approximately 80 billion cubic meters, as reported by Zhou et al. [3]. The global production capacity of blue coke is also growing, with other countries building a production capacity of approximately 1.131 million t/a. The unique high reactivity and electrical resistivity of blue coke make it a valuable material for various industrial applications, and both China and other countries are investing in production capacities to meet the increasing demand.
The production and economic value of blue coke is influenced by several factors including the raw coal quality, production process, pyrolysis oven, and operational methods. Low-rank coal is an ideal raw material for producing blue coke [4]. Unfortunately, the limited yield and increasing procurement price of lump coal reduce the capacity and economic benefits of blue-coke production. The reduction of the coal feed particle size and production of high-quality blue coke are significant engineering difficulties that concern the business community.
Among the reactors used for large-scale industrial blue-coke production, the internal-heating vertical oven plays a predominant role. This oven has a remarkable capacity of 300,000 t/a for blue-coke production in a single vertical oven. The advantages of using a vertical oven include controllable production and operation, stable product quality, and operation method. In this process, flue gas is used as the internal heat carrier. A vertical oven typically feeds block coal with diameters of 20–150 mm.
In recent years, China has witnessed the development and construction of various coal pyrolysis ovens for blue-coke production, as documented in a recent review by Feng & Xu [1]. Over the past 30 years, vertical oven pyrolysis technologies have undergone several generations of improvements, aimed at increasing the single furnace capacity and facilitating the use of small coal. For example, the Sanjiang (SJ) technologies developed by Shenmu Sanjiang Coal Chemical Co., Ltd., (Shenmu, China), have been updated from SJ-I to SJ-V, reducing the lower limit of the coal particle size to below 30 mm, thereby increasing the blue-coke production capacity up to 150,000 t/a in a single oven [5,6].
Shaanxi Metallurgical Design and Research Institute Co., Ltd. (Xi’an, China) has developed the SH2007 and SH4080 technology based on a coke oven by designing multiple coke discharge chambers and applying water spraying for coke quenching during blue-coke production, with a maximum oven volume of 200,000 t/a [7]. The pyrolysis technology developed by Anshan Research Institute of Thermo-Energy Research Co., Ltd. (Anshan, China) has been used by Guanhui Energy Co., Ltd. (Xi’an, China) to achieve a blue-coke production capacity of 600,000 t/a.
In 2018, Shaanxi Coal and Chemical Industry Group Co., Ltd. (Xi’an, China)and Beijing Guodian Futong (GF) Technology Development Co., Ltd. (Beijing, China) collaborated to develop and construct a regenerative hydrogen-rich gas-heat-carrier moving-bed coal mixed pyrolysis technology demonstration device in Yulin, which could process the 6–30-mm-long flame coal of Yulin. Current industrial ovens for coal pyrolysis can process block coal with sizes of 30–80 mm, with a single furnace blue-coke production capacity of 200,000 t/a and an internal thermal vertical oven for processing small-grain coal with sizes of 6–30 mm, with a single furnace blue-coke production capacity of 330,000 t/a. Researchers from industry and academia are working together to develop blue-coke production technology using all-size coal below 30 mm or mixed coal with much smaller sizes. However, the pyrolysis of coal with diameters below 6 mm presents a significant challenge. The vertical-oven technology of mixed coal has limitations of a low oil yield, an unstable product quality due to the reactor’s inability to achieve a uniform coal pyrolysis reaction, and a higher proportion of unreacted and overreactive coke.
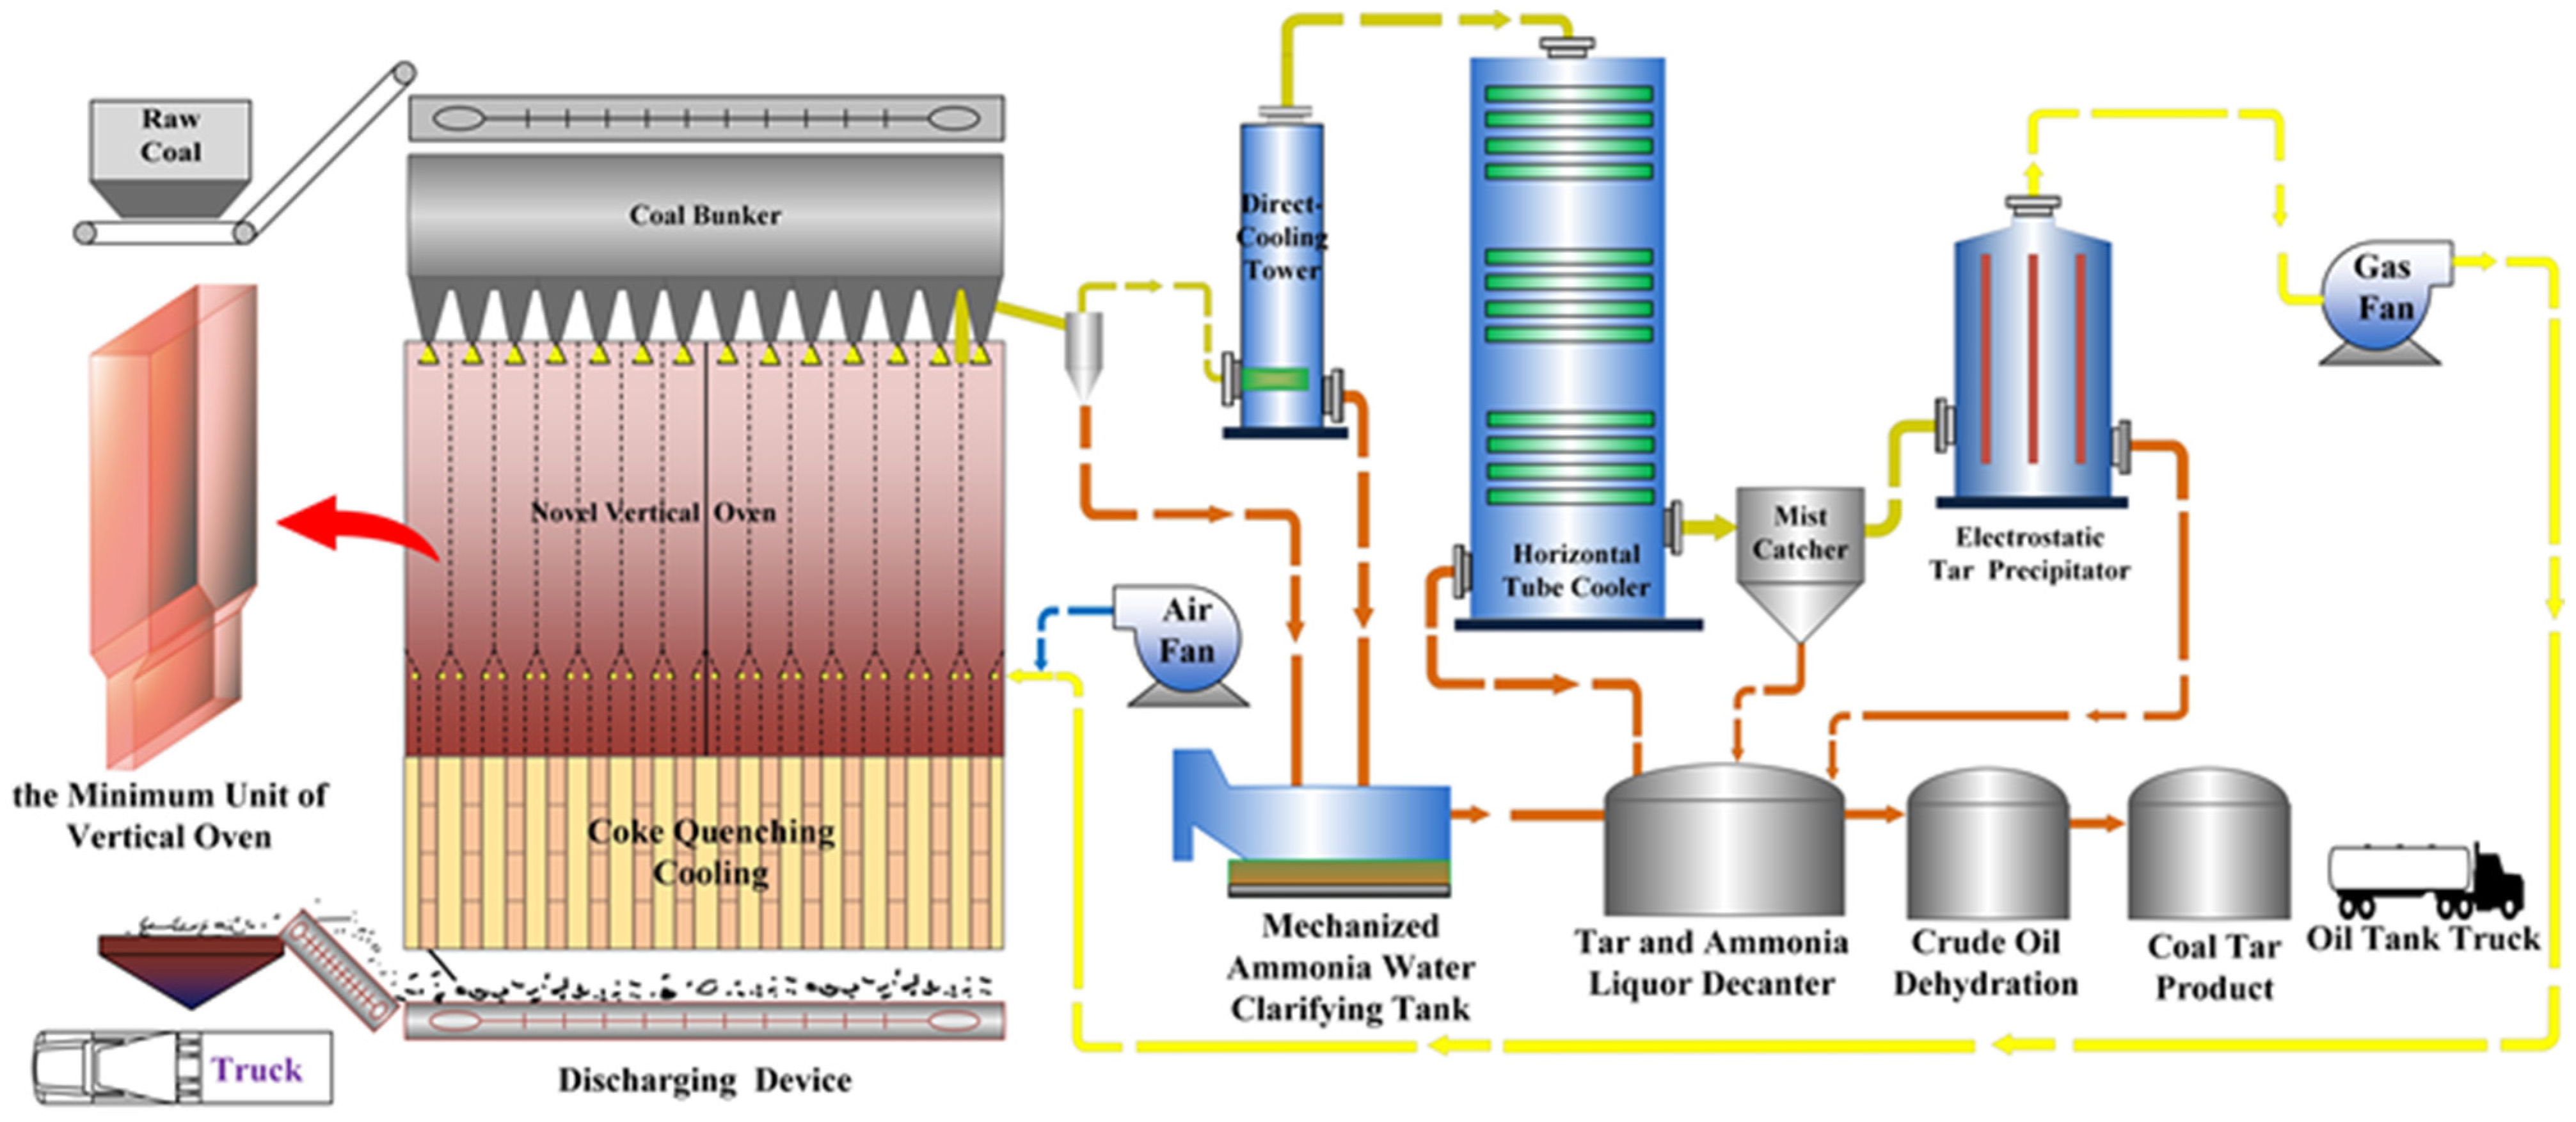
Shaanxi Shuangyi Coal Chemical Technology Industry Co., Ltd. (Shenmu, China) has recently developed a new demonstration oven for mixed coal ( < 30 mm) pyrolysis, with the processes shown in Figure 1 and the key technological parameters listed in Table 1. This new oven, with a low investment cost and rapid effect, has wide application prospects and great promotion value.
Despite the new vertical oven’s ability to carry out industrial tests of mixed coal pyrolysis, frequent adjustment of the gas/air ratio is required to control the gas distribution and temperature, leading to a complex operation, uneven combustion, and high gas consumption. The primary cause of these difficulties is the application of mixed coal, which results in poor coal permeability. The basic physical problem of poor permeability has two aspects: (1) it increases the bed resistance and (2) it reduces the gas velocity distribution uniformity. Many scholars have recognized the problem and conducted theoretical investigations to determine the basic flow structure and revealed the effect of the vertical-oven structure.
Some technologies for regulating the combustion chamber and pyrolysis chamber and installing internal parts have been developed to improve the oven permeability and inhomogeneous gas distribution. Song and Zhang [8] narrowed the top area of the pyrolysis chamber and the flame path, and they added a gas-collection hood. Using this method, a vertical internally heated oven for processing lump coal with a size of 30–80 mm was built, and the processed coal particle size could be reduced to 10–30 mm. Gao et al. [9] found an increase in the inlet diameter will produce a more uniform temperature distribution. Zhang et al. [10] and Xu et al. [11] developed an internal enhanced moving-bed pyrolysis reactor for producing tar and gas in high yields and quality to process fine coal with sizes of 0–10 mm. Zhou et al. [12] developed a moving-bed pyrolysis process with baffled internals and multi-stage gas-gathering hoods to allow the oven to process 0.4–6.0 mm pulverized coal due to the baffle internals that could enhance the heat and pyrolysis reactions. These internal technologies are expected to be implemented in industry, potentially improving the overall efficiency and effectiveness of vertical-oven pyrolysis processes. The improved sizes of the combustion and pyrolysis chambers have been used in real industrial oven upgrading.
In the literature, CFD provides powerful too for assisting industrial design and equipment development. Chen et al. [13] simulated a gas-particle solar receiver and investigated the effect of bottom opening on heat efficiency. Mathiesen et al. [14] presented a computational fluid dynamics CFD multiphase gas solid model for a CFB Riser. Roussel [15] summarized the computed technology for modeling concrete flow. Baldelli et al. [16] think the density functional theory (DFT) simulation method can be applied in developing non-wettable coatings. Yousefian and Pimputkar [17] used CFD techniques to determine fluid transport phenomena to design the metal organic chemical vapor deposition reactor. Guo et al. [18] applied the CFD-DPM method to optimize a powder mixer. The application of CFD technology to investigate the basic gas–solid flow characteristics with the vertical oven is promising to find out an effective way to solve industry problems.
Vertical oven technology faces a significant challenge in the form of poor permeability in the gas–solid contra-flow, leading to issues in terms of heat transfer, volatile matter transfer, and pyrolysis reaction control. In order to better understand the underlying factors influencing this distribution, it is important to conduct further investigations into the basic influence characteristics. To this end, we have designed multi-injection structures and numerically investigated their impact on the gas distribution in a vertical oven. By simulating the complex gas–solid flow, we were able to obtain flow patterns and gas distribution information under various operation conditions, such as the coal diameter, gas velocity, and gas feeding angle. The insights gained from this work can serve as a valuable theoretical basis for industrial applications.
2. Numerical Model
2.1. Pyshical Model
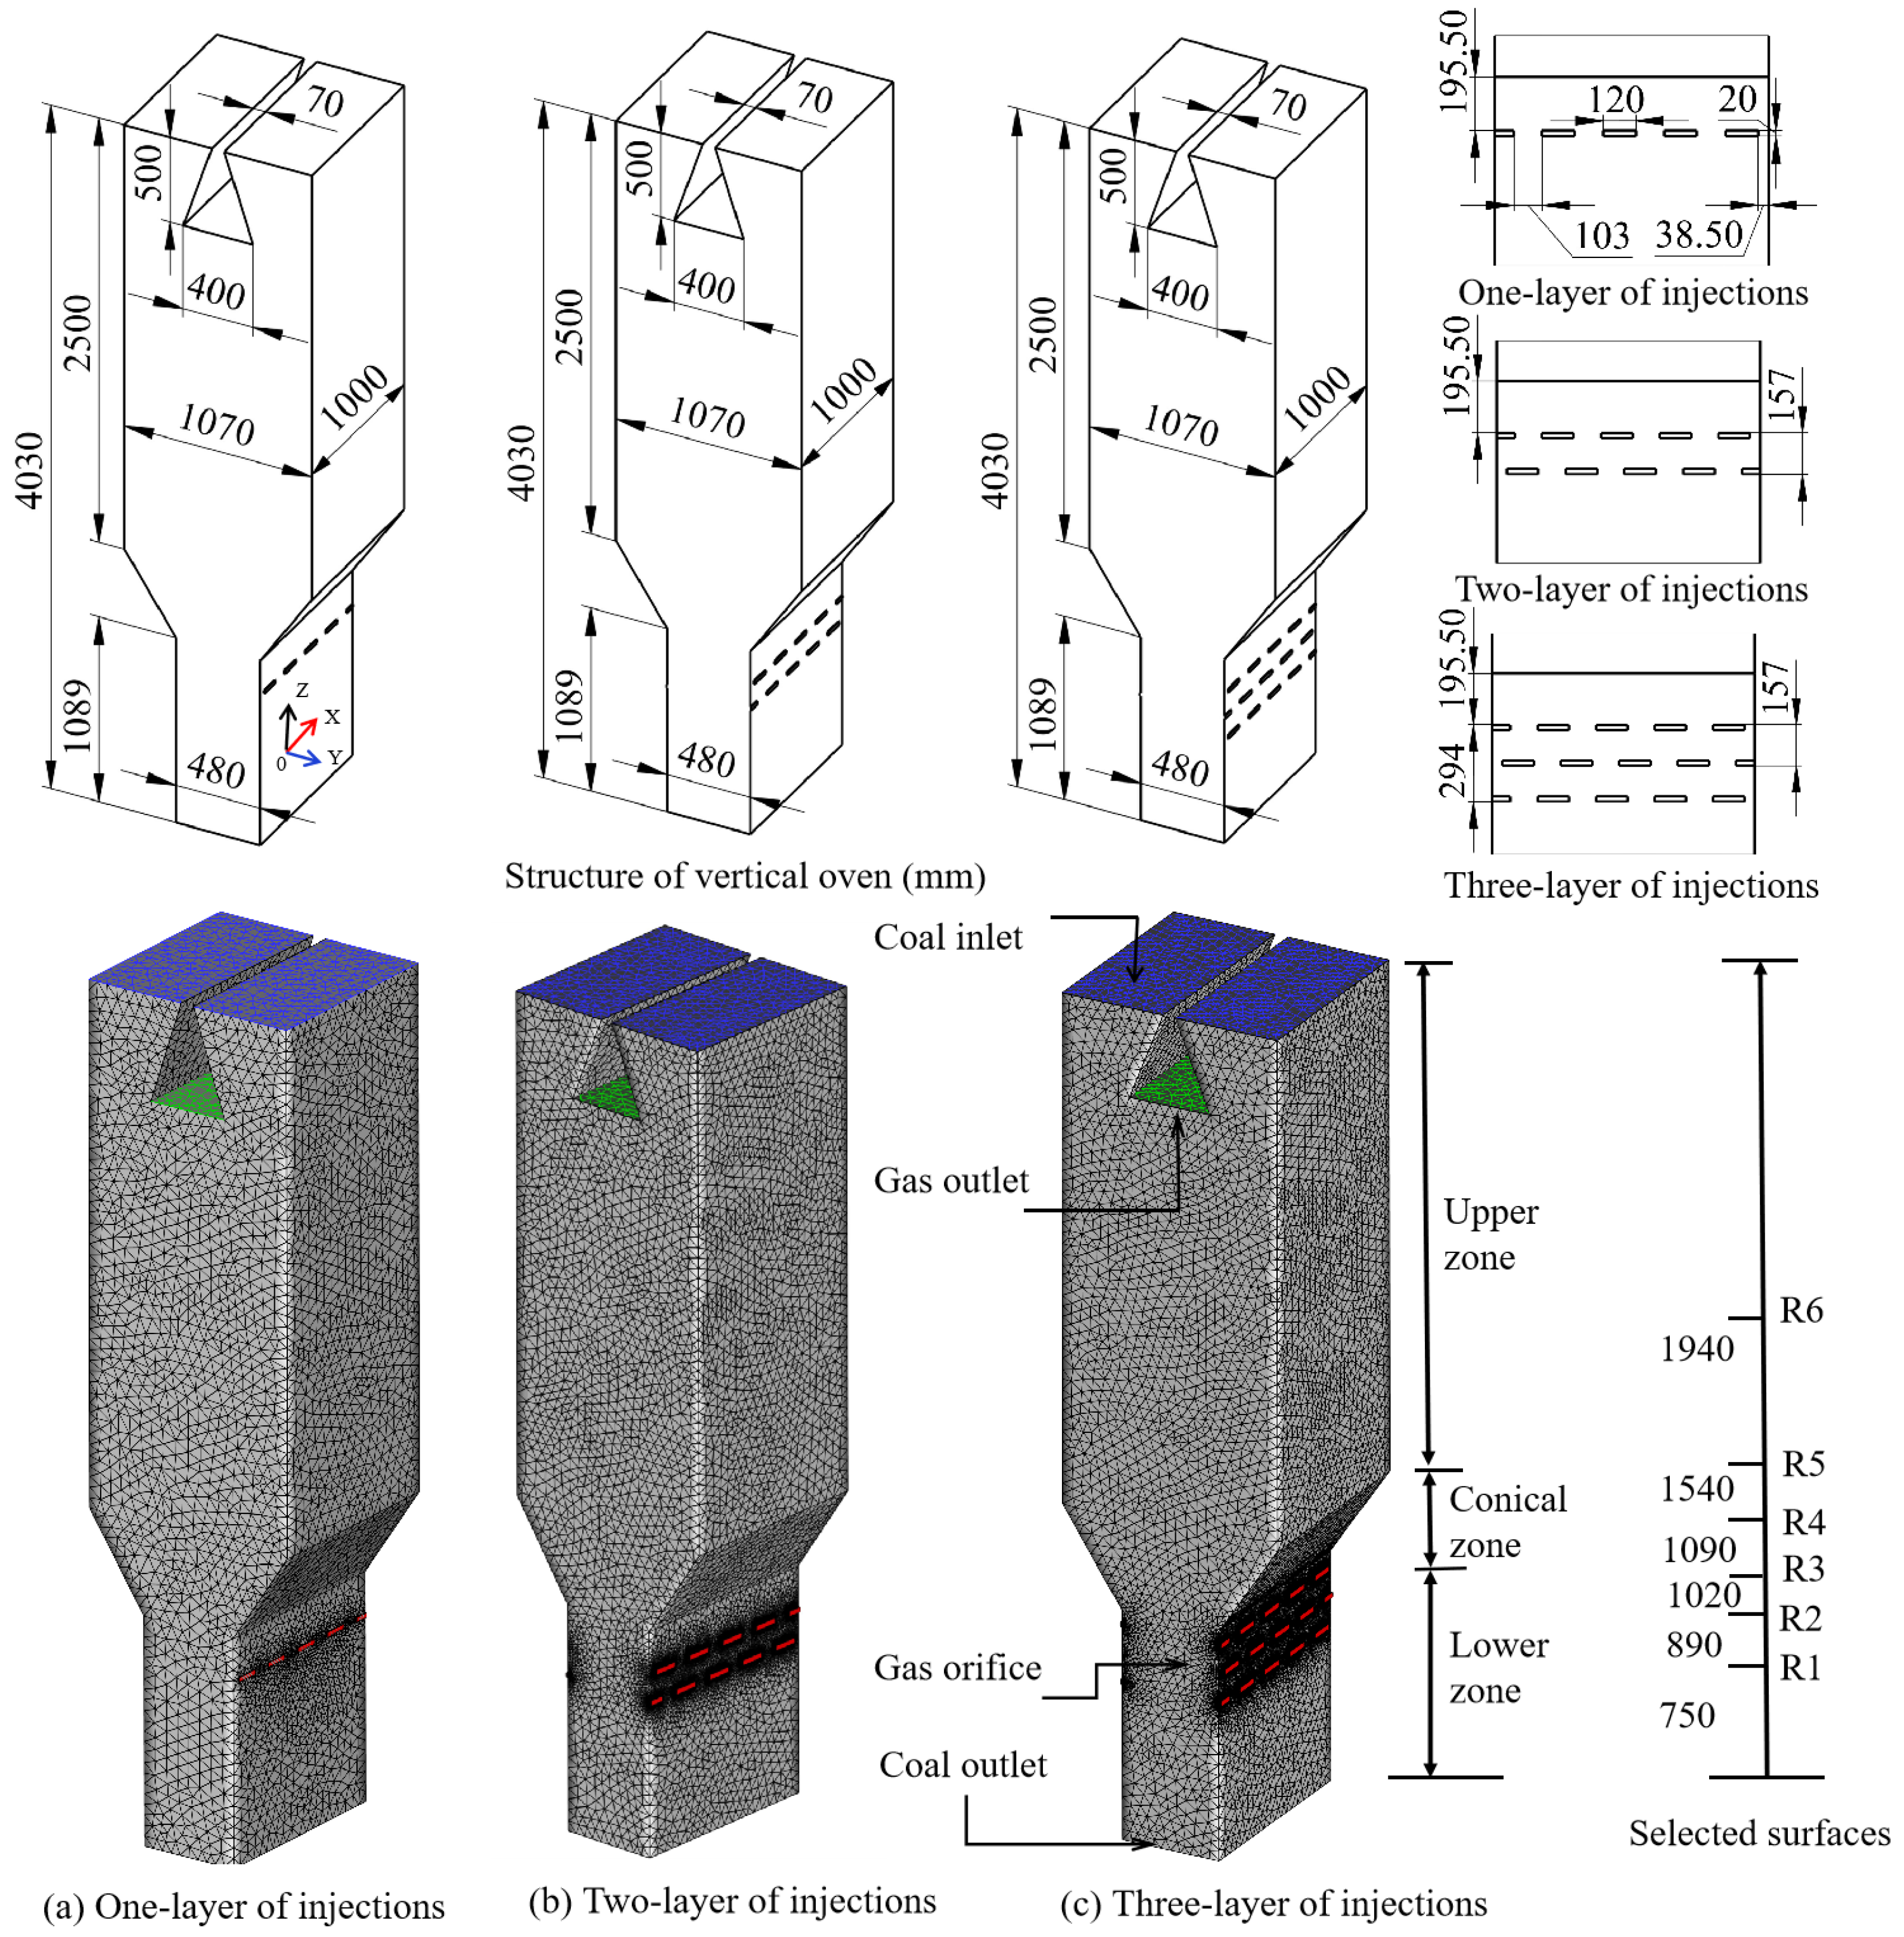
The performance of the commercialized vertical oven depends greatly on its structures. There are many difficulties for improving the oven structure due to lack of theoretical guides. The structure of the vertical oven, which has a great impact on the coal adaptability, gas distribution, and gas–solid interactions, can be divided by the combustion chamber into parallel units. The structural improvement of the minimum unit will increase the overall performance of the vertical oven.
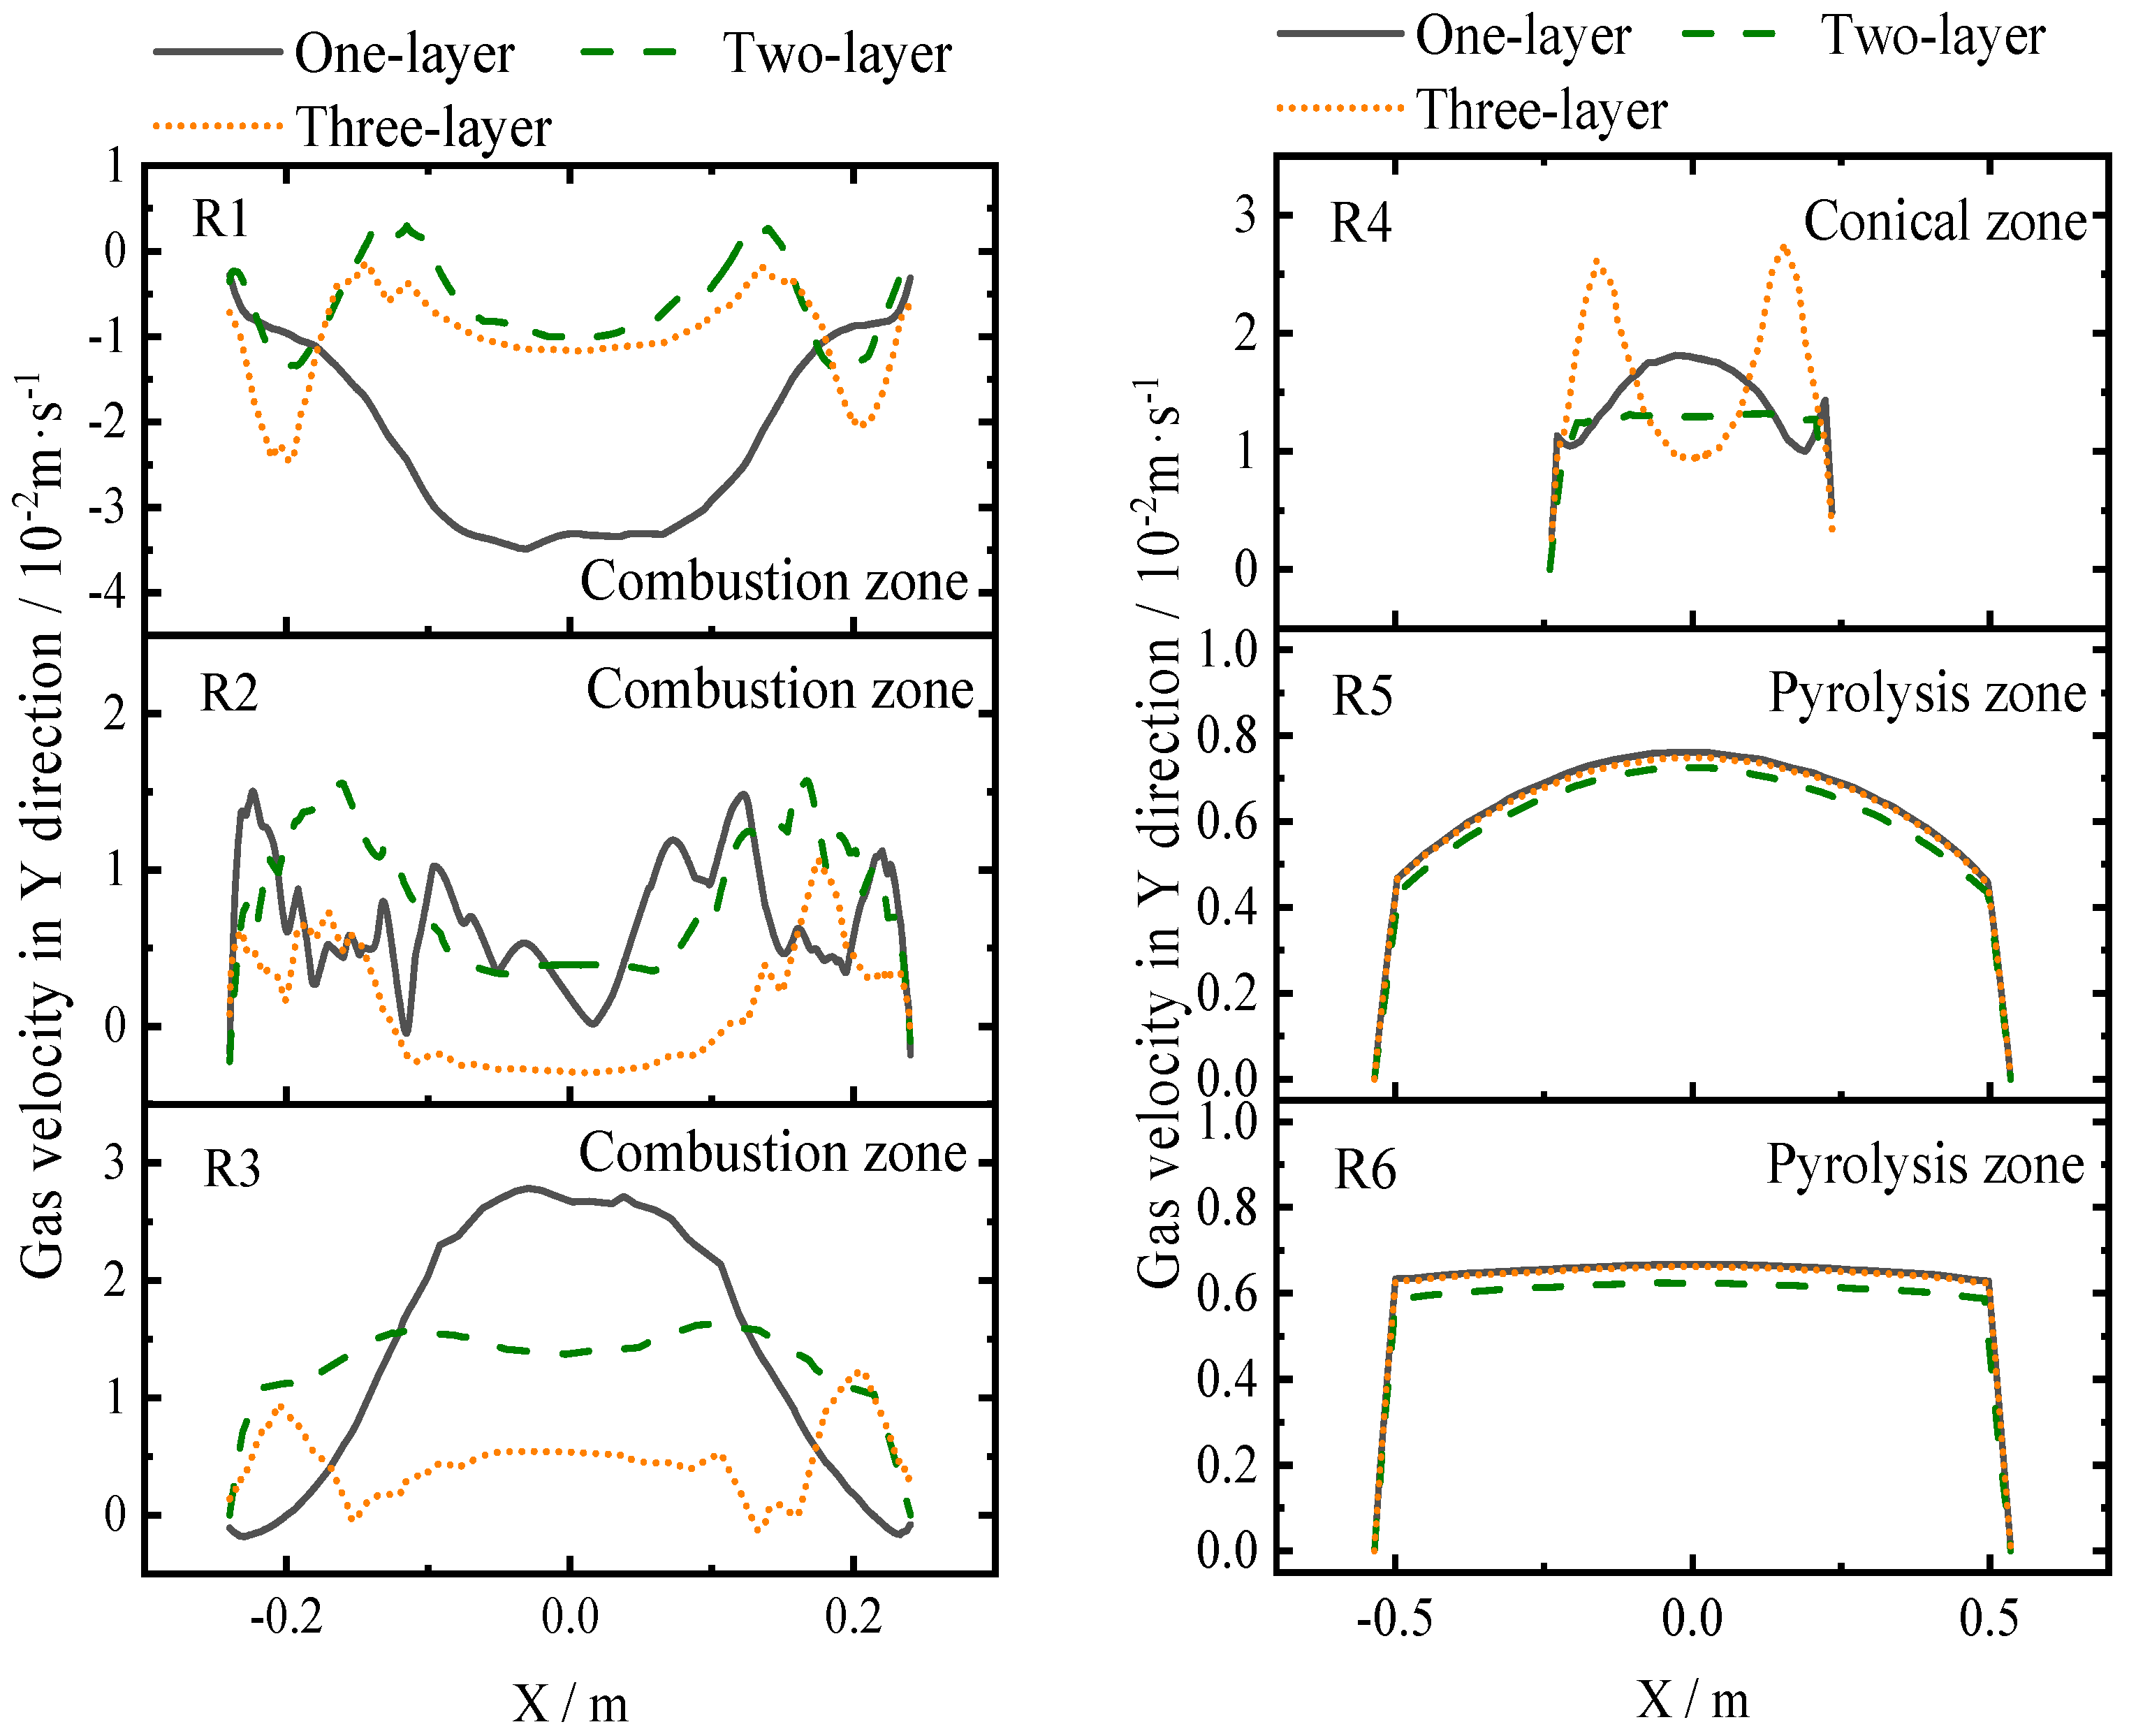
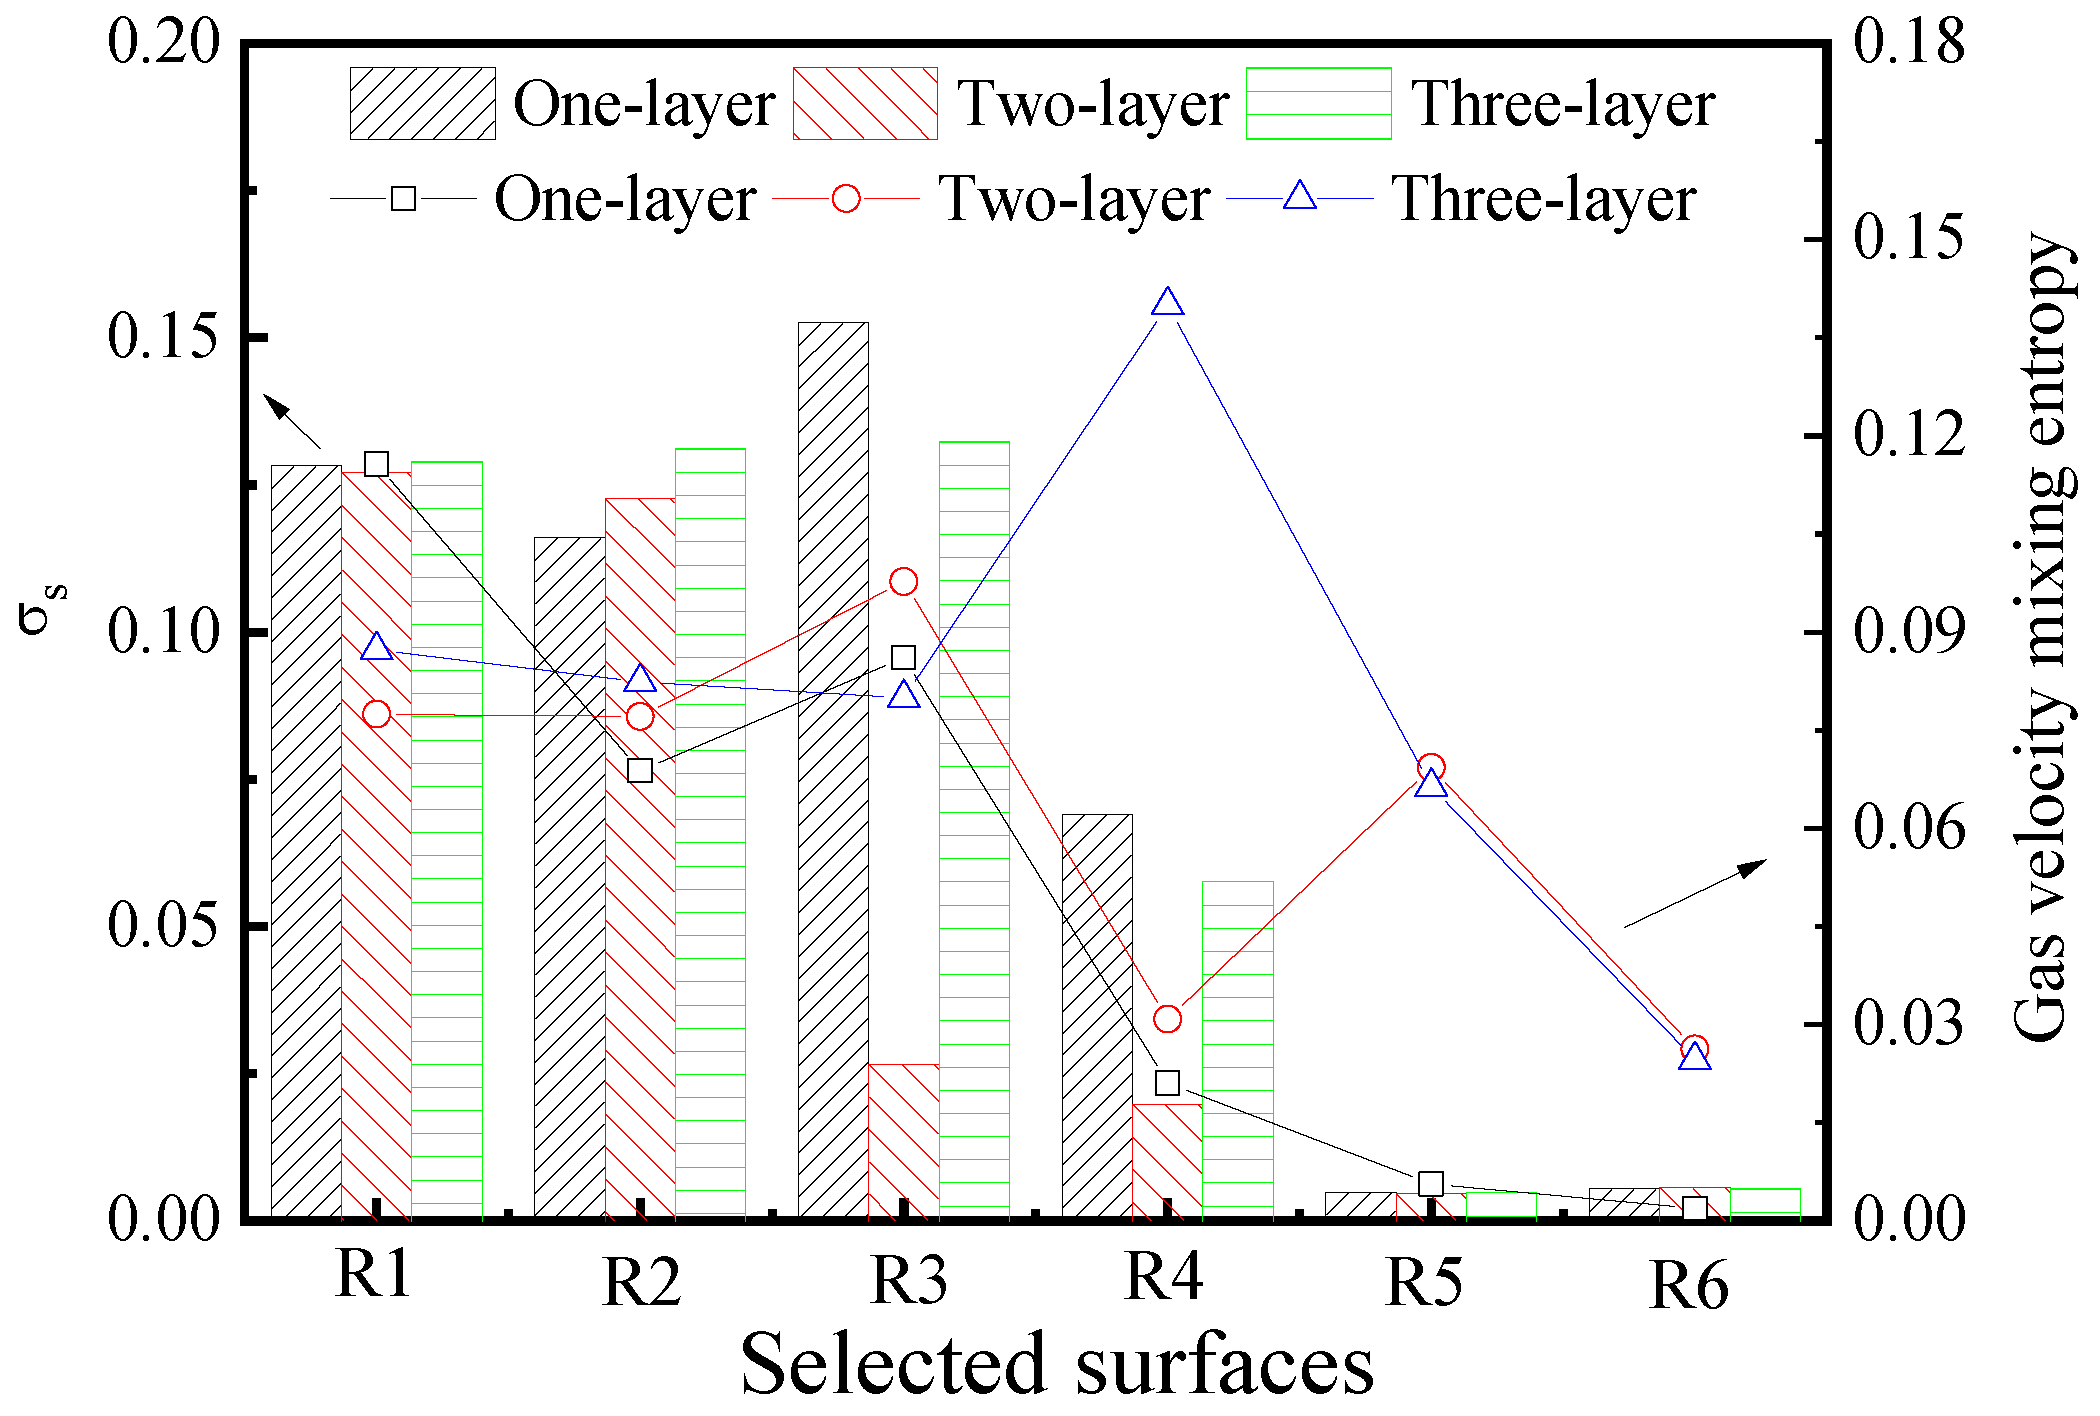
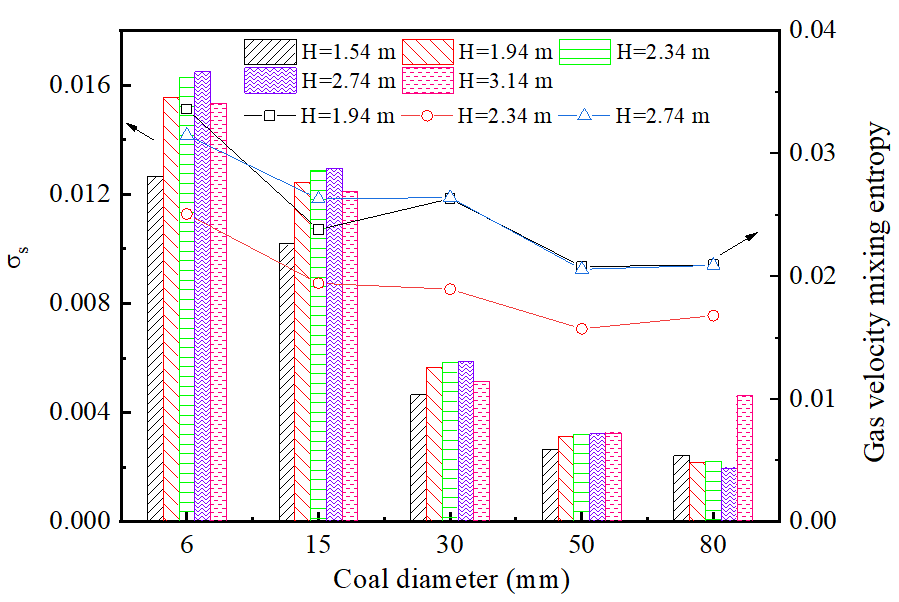
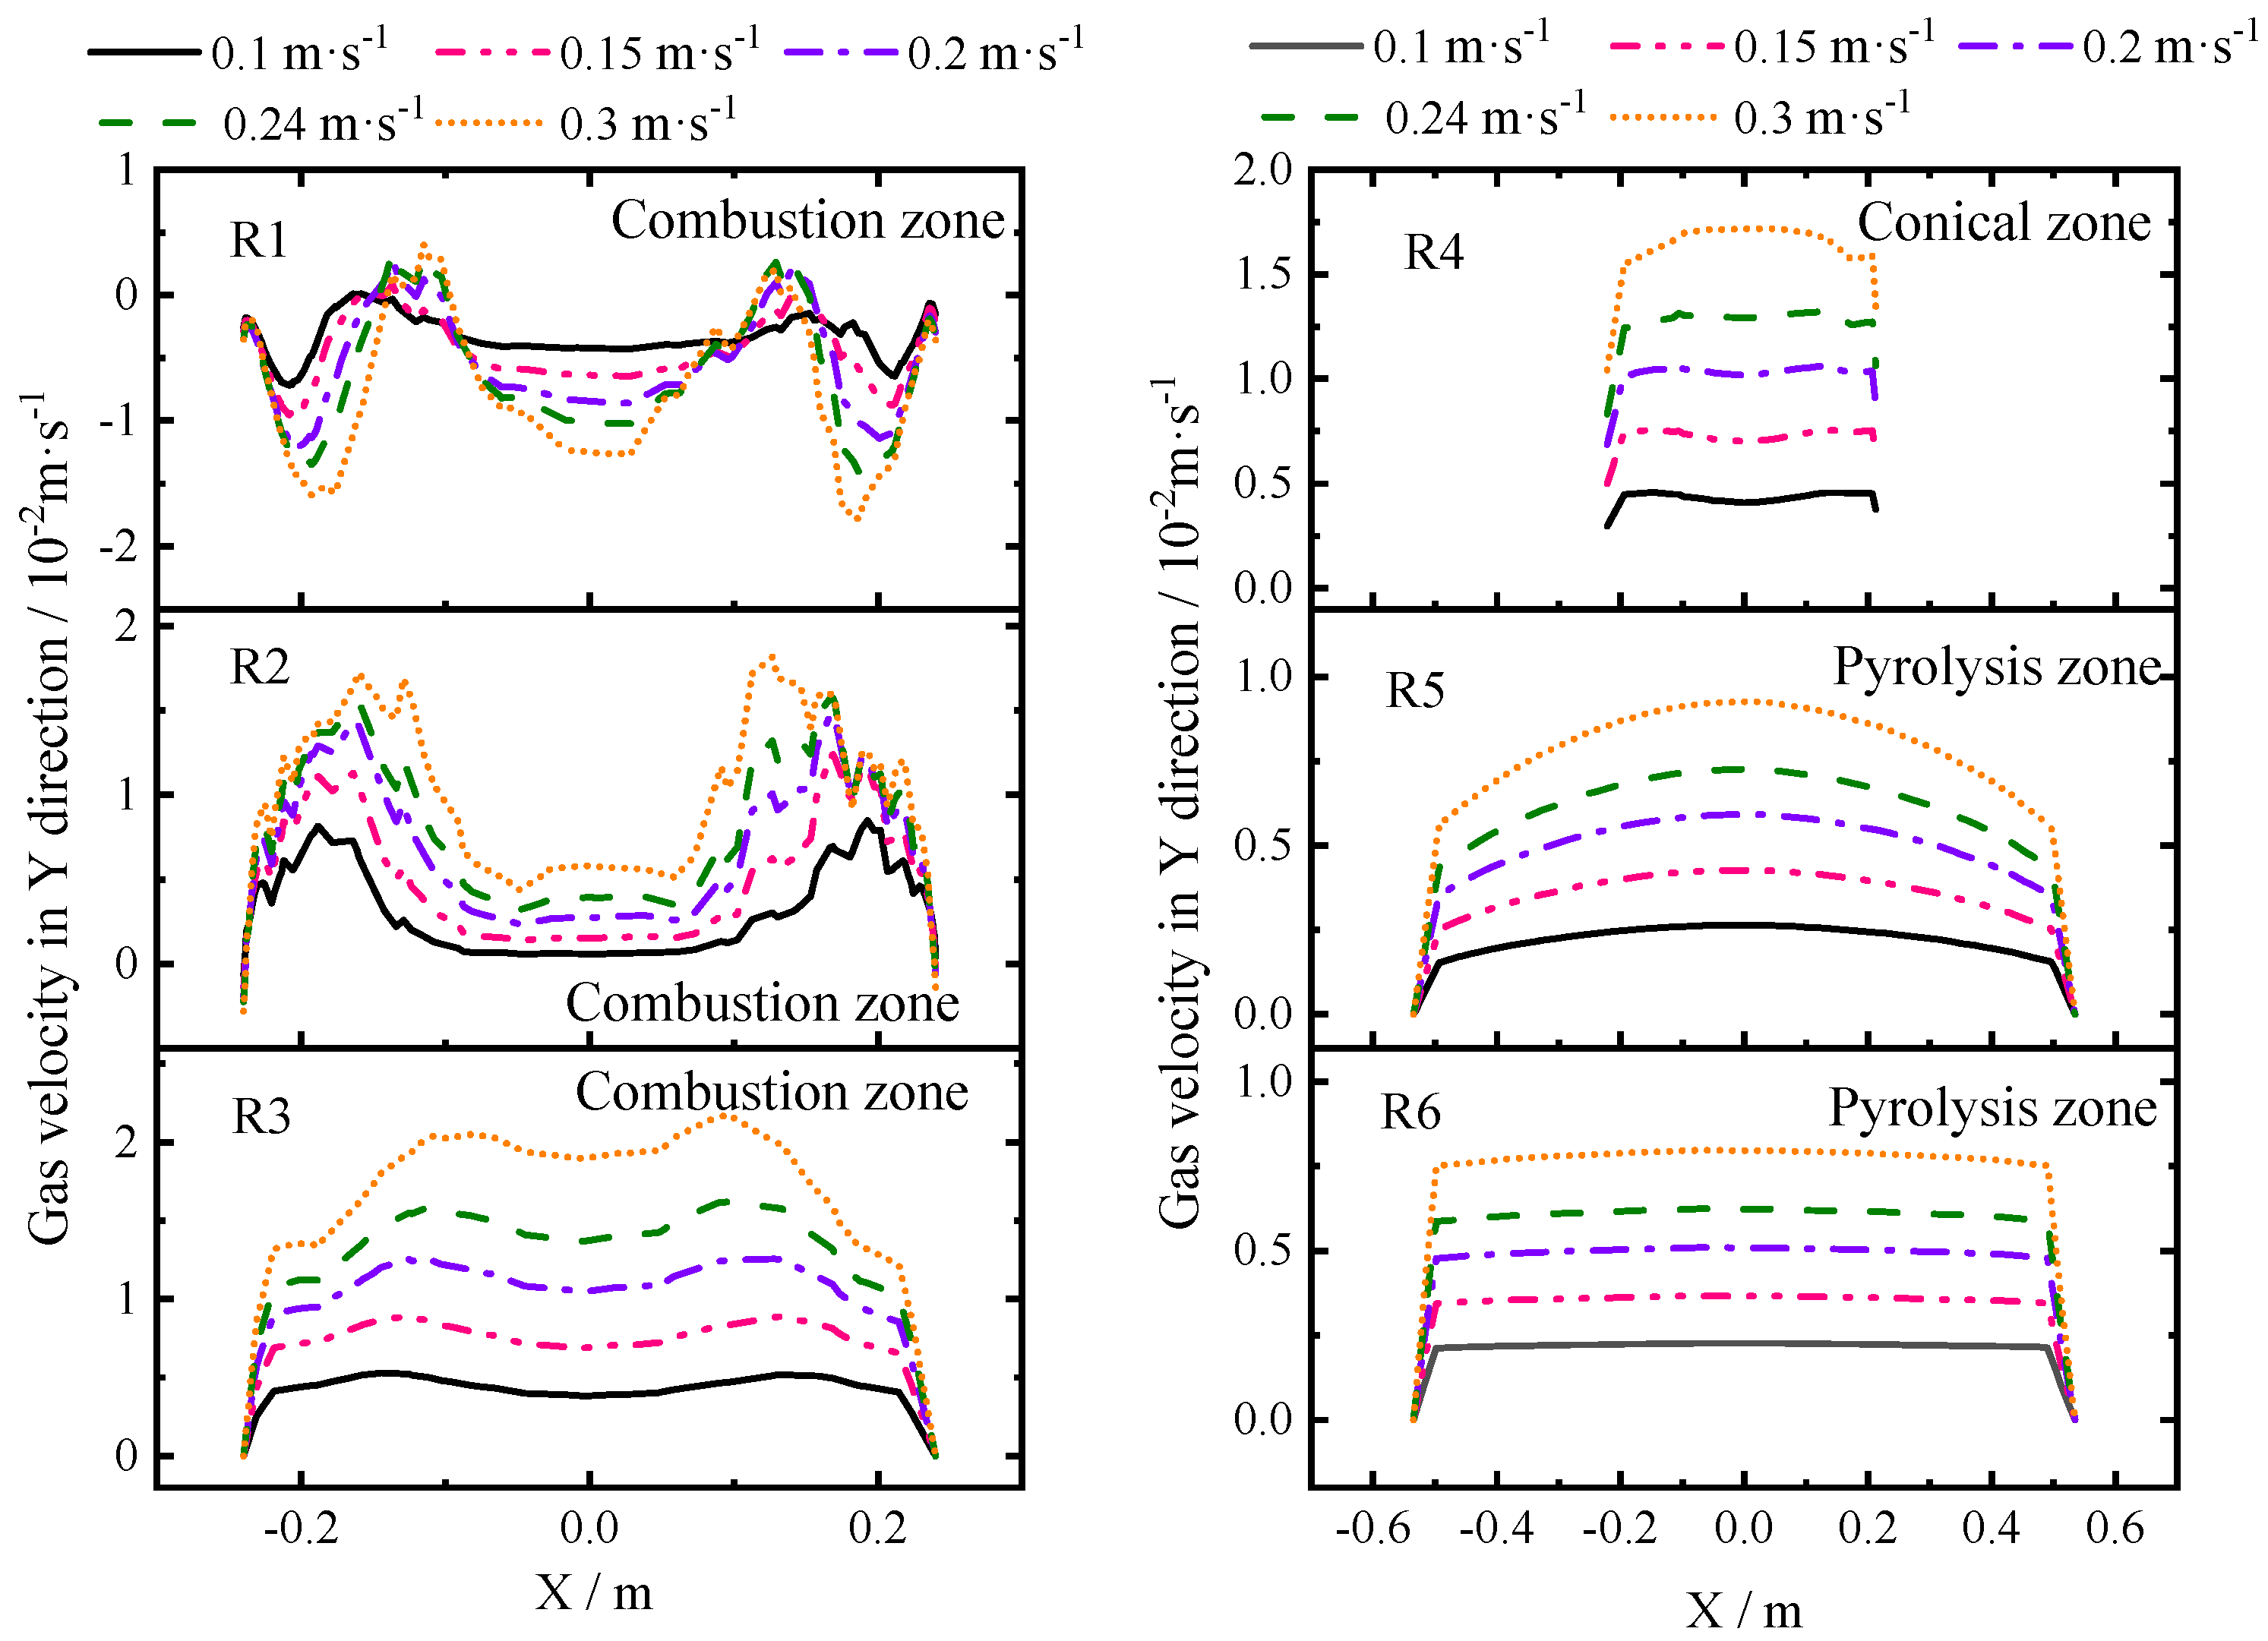
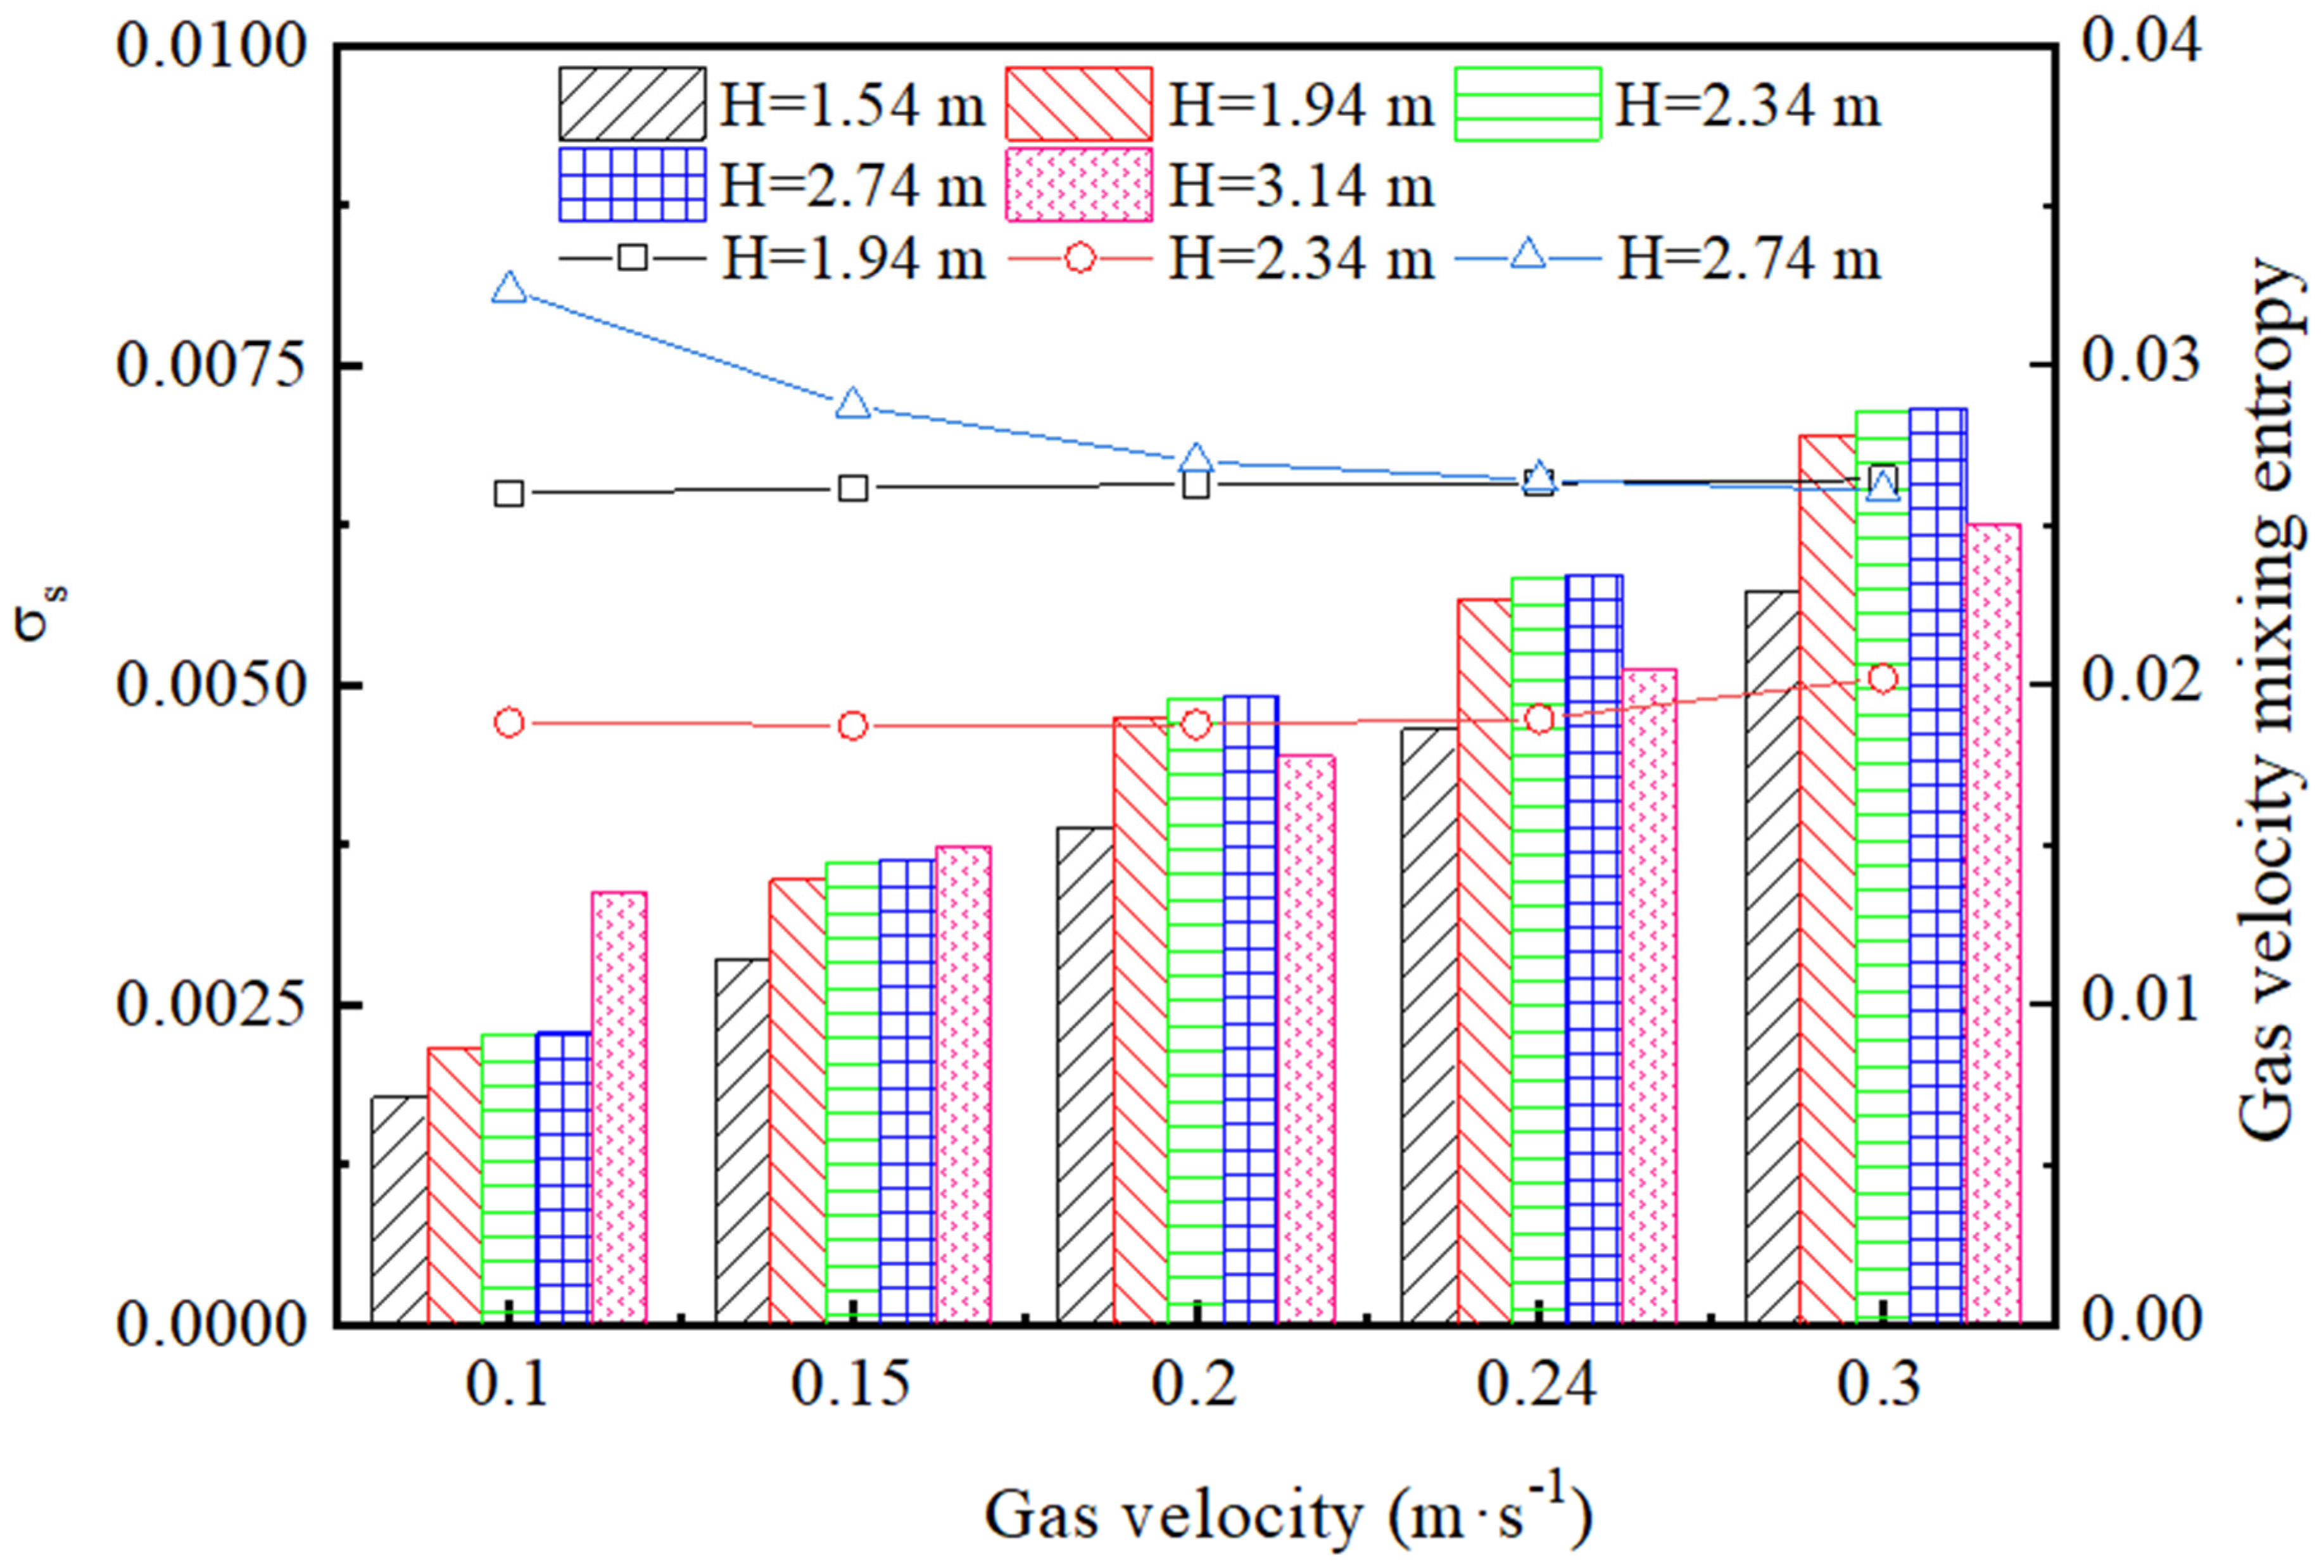
Based on this reasoning, a physical model with only one combustion chamber was constructed in this work to better understand the flow characteristics of the vertical oven based on long-term experience in engineering research. Figure 2 shows the physical model of the minimum unit of the vertical oven according to the industrial installation, ignoring the coke-quenching section. A model with a height of 4030 mm could be divided into three zones (upper zone, conical zone and lower zone) along the bed height. First, the upper zone had a height of 2500 mm and a rectangular section with a width of 1070 mm. A triangle-shaped gas-gathering device with a width of 400 mm was installed on the top of the upper zone. Second, the conical zone was neck area, which was a reduction trapezoid with a height of 441 mm and an incidence angle of 56.22°. The lower zone below the conical zone had a height of 1089 mm. The lower zone had two or three layers of rectangular orifices, as shown in Figure 2. The rectangular orifice had a height of 20 mm and a width of 120 mm. The detailed distribution of the orifices is shown in Figure 2. During the operation, the coal exited from the top of the moving bed and then flowed out the bed from the bottom, as shown by the blue arrow. Part of the gas was recycled into the oven to produce the gas heat carrier. The gas flowed into the moving bed through the orifices and then flowed out from the moving bed through the top triangle-shaped gas-gathering device. The coal–gas flow was a counter current in the reactor. The bed height, gas orifices, and position of the gas-gathering device affected the gas distribution. A uniform gas distribution in the upper zone is difficult to achieve due to the complex coal–gas interactions. Figure 2 shows the unstructured grid of the physical model. The number of grid elements was determined to be 515,000 after a grid independence test. Cross sections L1–L5, at heights of 1.56952, 1.97729, 2.38504, 2.79279, and 3.20054 m, respectively, were selected to compute the standard deviation and mixing entropy.
2.2. Mathematical Model
The main assumptions and simplifications include the following: (1) the solid radial distribution function has a consistent equation in different kinetic models; and (2) the particle diameter is unchangeable. These assumptions can help apply kinetic models to simulate the dense gas–solid flow. The gas–solid phase conservation equations of mass and the momentum conservation equation of fluctuating energy have been widely reported in literature [19]. The control equations are listed in the Supplementary Materials. The effect of gas turbulent on the viscosity is determined by solving the gas phase turbulence models [20]. The enclosed equations of the typical granular kinetic theory include Lun et al.’s [21] solid pressure, Lun et al.’s [21] solid bulk viscosity and Gidaspow et al.’s [22] shear viscosity deriving based on a binary particle collision model. The original formulations of Gidaspow’s (1994) [23] drag model are applied to calculate the dense gas–solid drag force. The Euler–Euler model in the software of FLUENT 6 was applied to simulate the dense gas–solid flow. The governing equations were solved by the finite volume approach. Detailed information can be found in the Supplementary Materials.
2.3. Simulation Setup
This study aimed to investigate the effects of multi-injection structure on gas distribution. The gas inlet featured a rectangular injection structure with a height of 20 mm and a width of 120 mm. Each layer consisted of 4.5 jets. Three injection modes, namely single-layer, two-layer, and three-layer jet, were studied. Unstructured meshes were generated to simulate the complex vertical oven, and the meshes were refined to obtain accurate flow field information. Table 2 shows the grid-independent results, in which the mixed entropy of coal phase volume fraction in the Y5 section was used for grid independence verification. Results showed that the number of grids had little impact on the results when it increased from 515,000 to 3,046,000. Thus, the mesh number of 515,000 was selected for simulation to ensure calculation accuracy while saving computing resources and reducing computing time. In simulations of gas volume fraction distribution, the transient computation time step has been found to have minimal influence within the 1 s to 1 s range. Therefore, a time step of 1 s has been selected in order to conserve computing resources.
Boundary conditions for the gas and coal inlets were set as velocity inlet, while the gas and coal outlet boundary conditions were set to outflow. All other surfaces were defined as the no-slip walls boundary condition. The primary phase was dry air, with coal particles modeled as the solid phase. Each phase within the vertical oven are air and coal. The air density is 1.2 and viscosity is 1.75 . The density of coal is 1250 . Gradients of pressure and flow were discretized using a quick scheme, with second-order upwind discretization schemes utilized for the convection terms. A no-slip boundary condition for granular temperature and solid phase velocity was applied. The solver used SIMPLE algorithms to deal with pressure–velocity coupling. In order to stabilize the solution, under-relaxation was implemented from 0.1 to 0.4, with a convergence criterion of 10−3 specified for each scaled residual component to ensure the relative error between two successive iterations was minimized.
2.4. Indicated Parameters
Based on the simulation results, this paper analyzes the important parameters indicated by the solid fraction standard deviation, gas velocity mixing entropy, and gas velocity standard deviation. The averaged solid fraction and averaged gas velocity are calculated by
where and are the solid fraction and the gas velocity in the cell, respectively, is the bed height, and is the cell belonging to th layers. Table 3 shows th line along the vertical oven. The averaged gas fraction and averaged gas velocity are computed in the layers of the bed height zone.
The expression of the gas velocity mixing entropy, a measure of uncertainty based on the concept of Shannon entropy [24], is shown as follows:
The solid fraction and gas velocity standard deviation are expressed as
where is the total number of cells within the initial bed height zone.
3. Results and Discussion
3.1. Wall Temperature Distribution
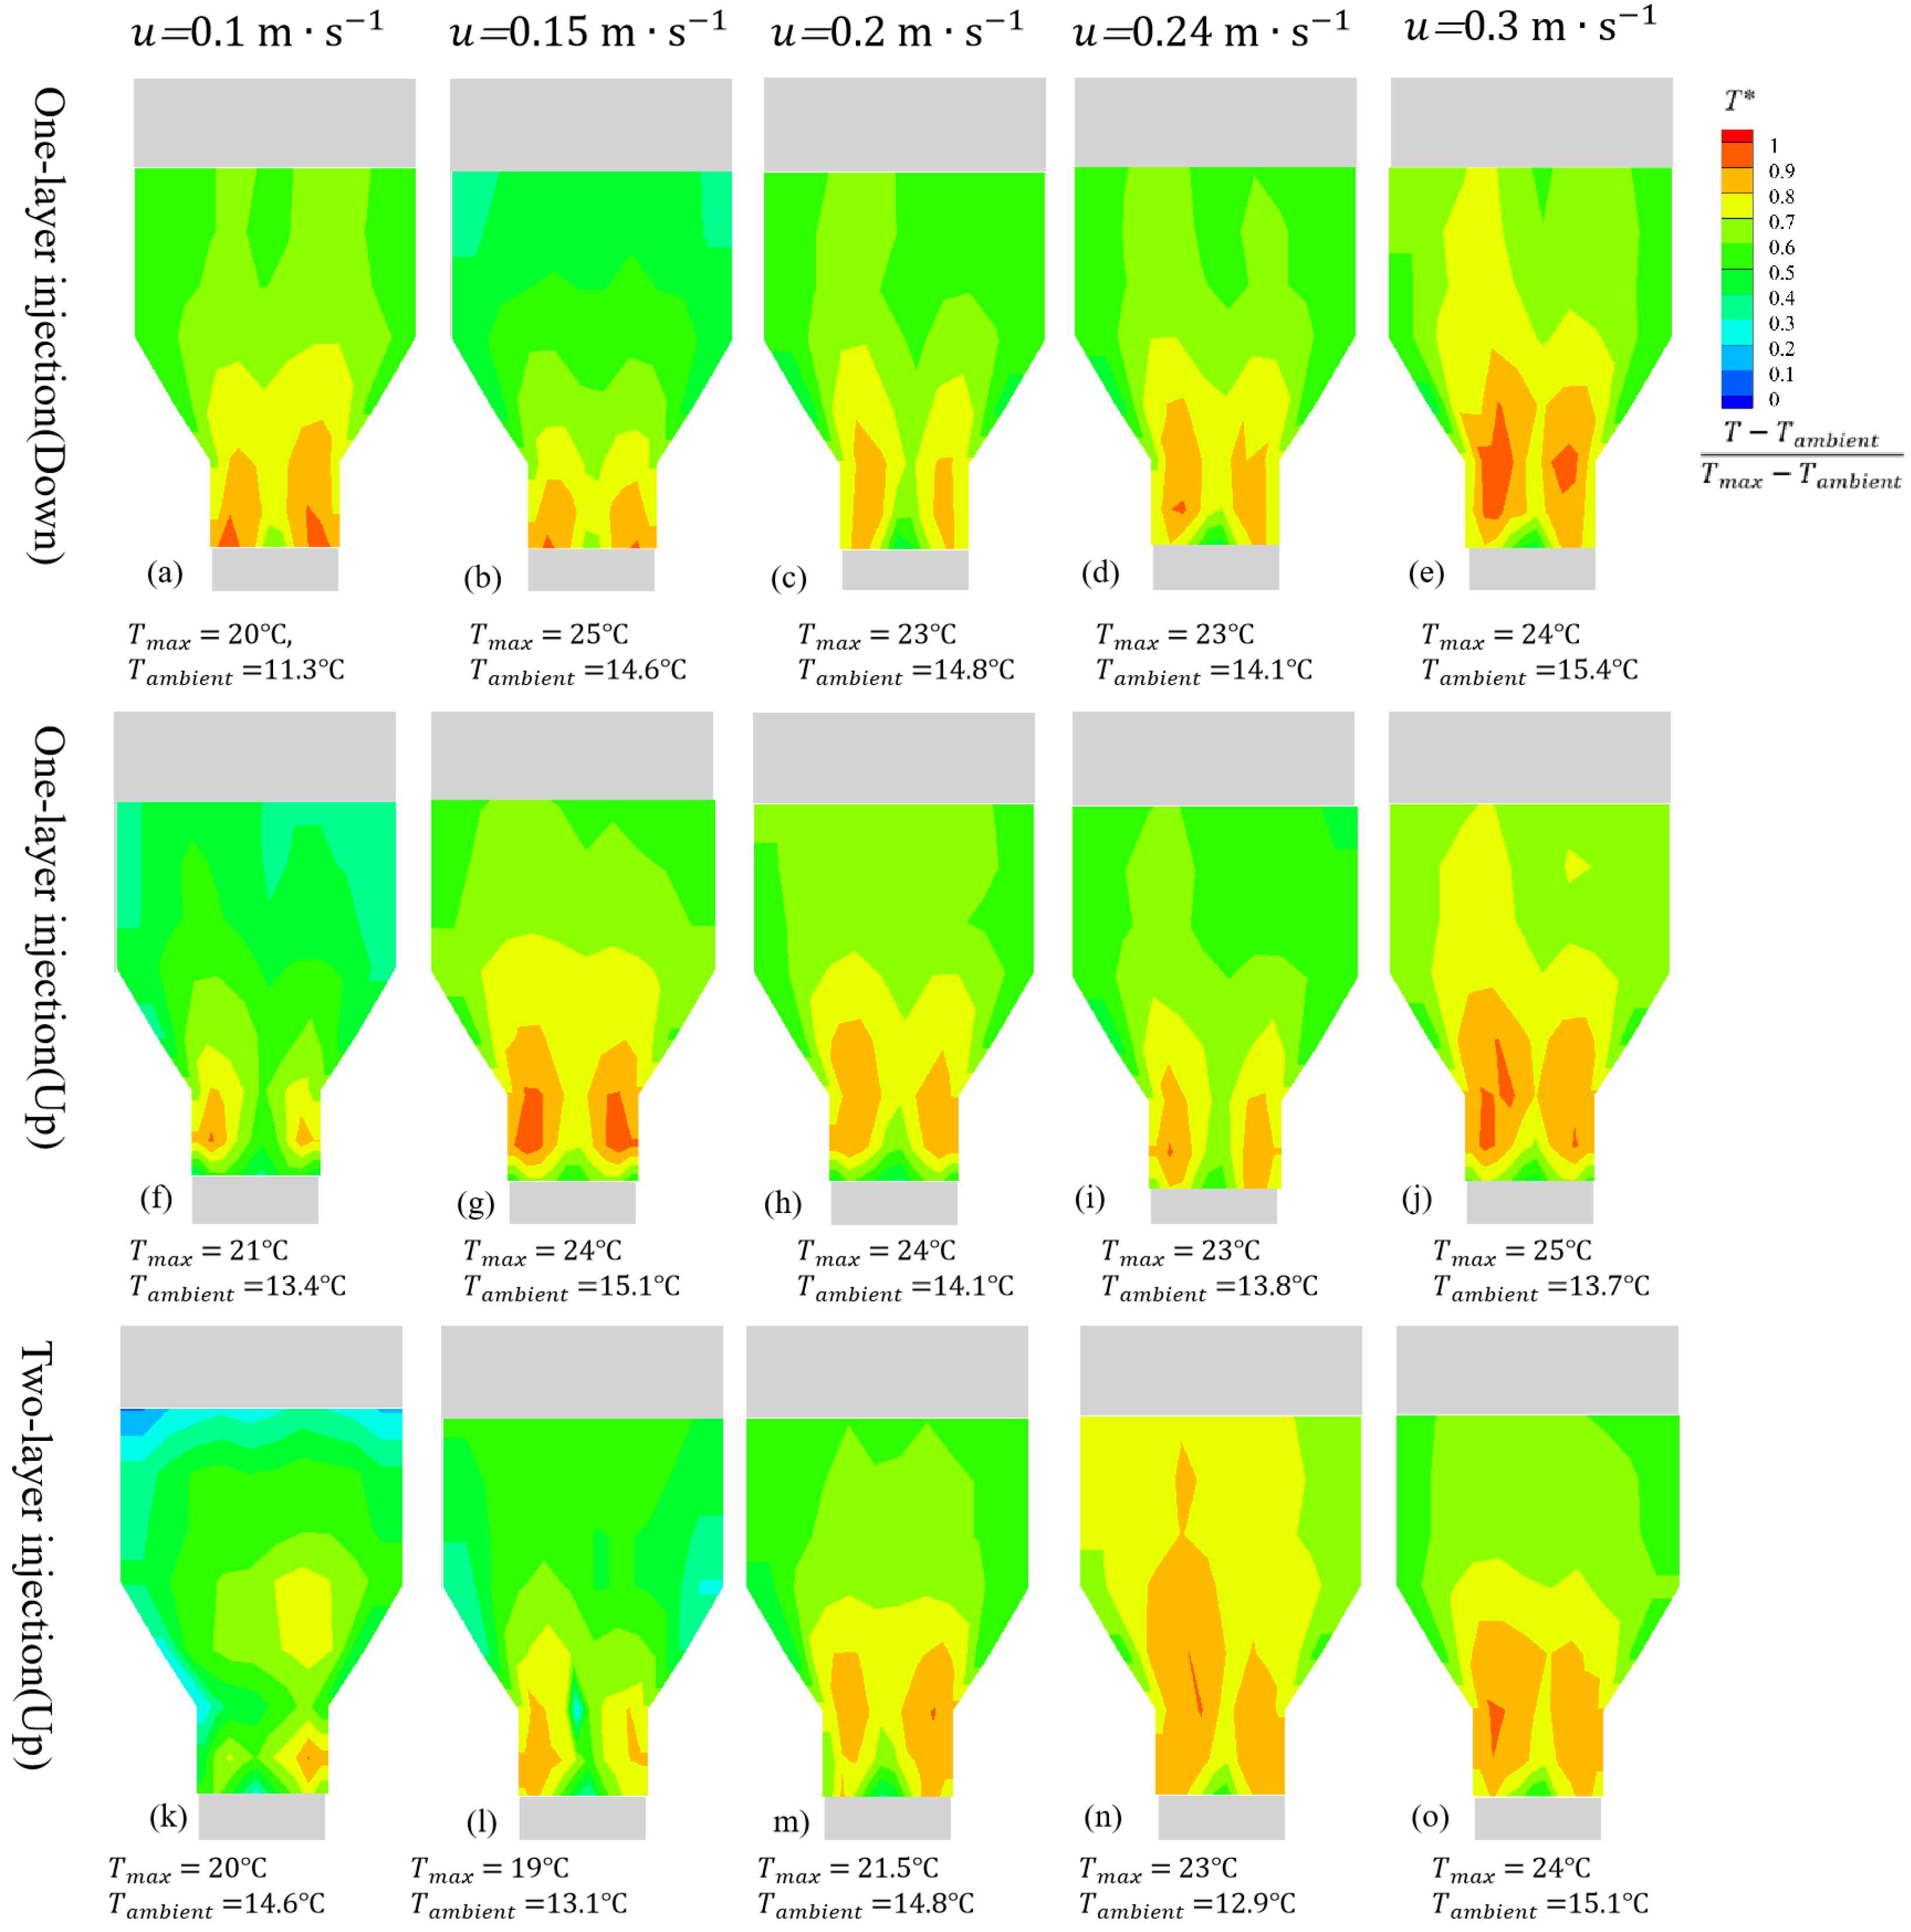
Figure 3 shows the measured wall temperature map. The map is reconstituted by the 80 temperate points. The hot gas flow into the lower zone through the orifice. The temperate near the orifices is much higher than other zone. The hot gas flow upward accompanying the heat transfer from the lower zone to upper zone. An increase in gas velocity increases the high-temperature zone and elevated temperature in the upper zone and lower zone. The one-layer up or down injection produce much more concentration and temperature distribution than the two-layer injection structure. The two-layer injection structure promotes thermal convection by dispersing the gas flow.
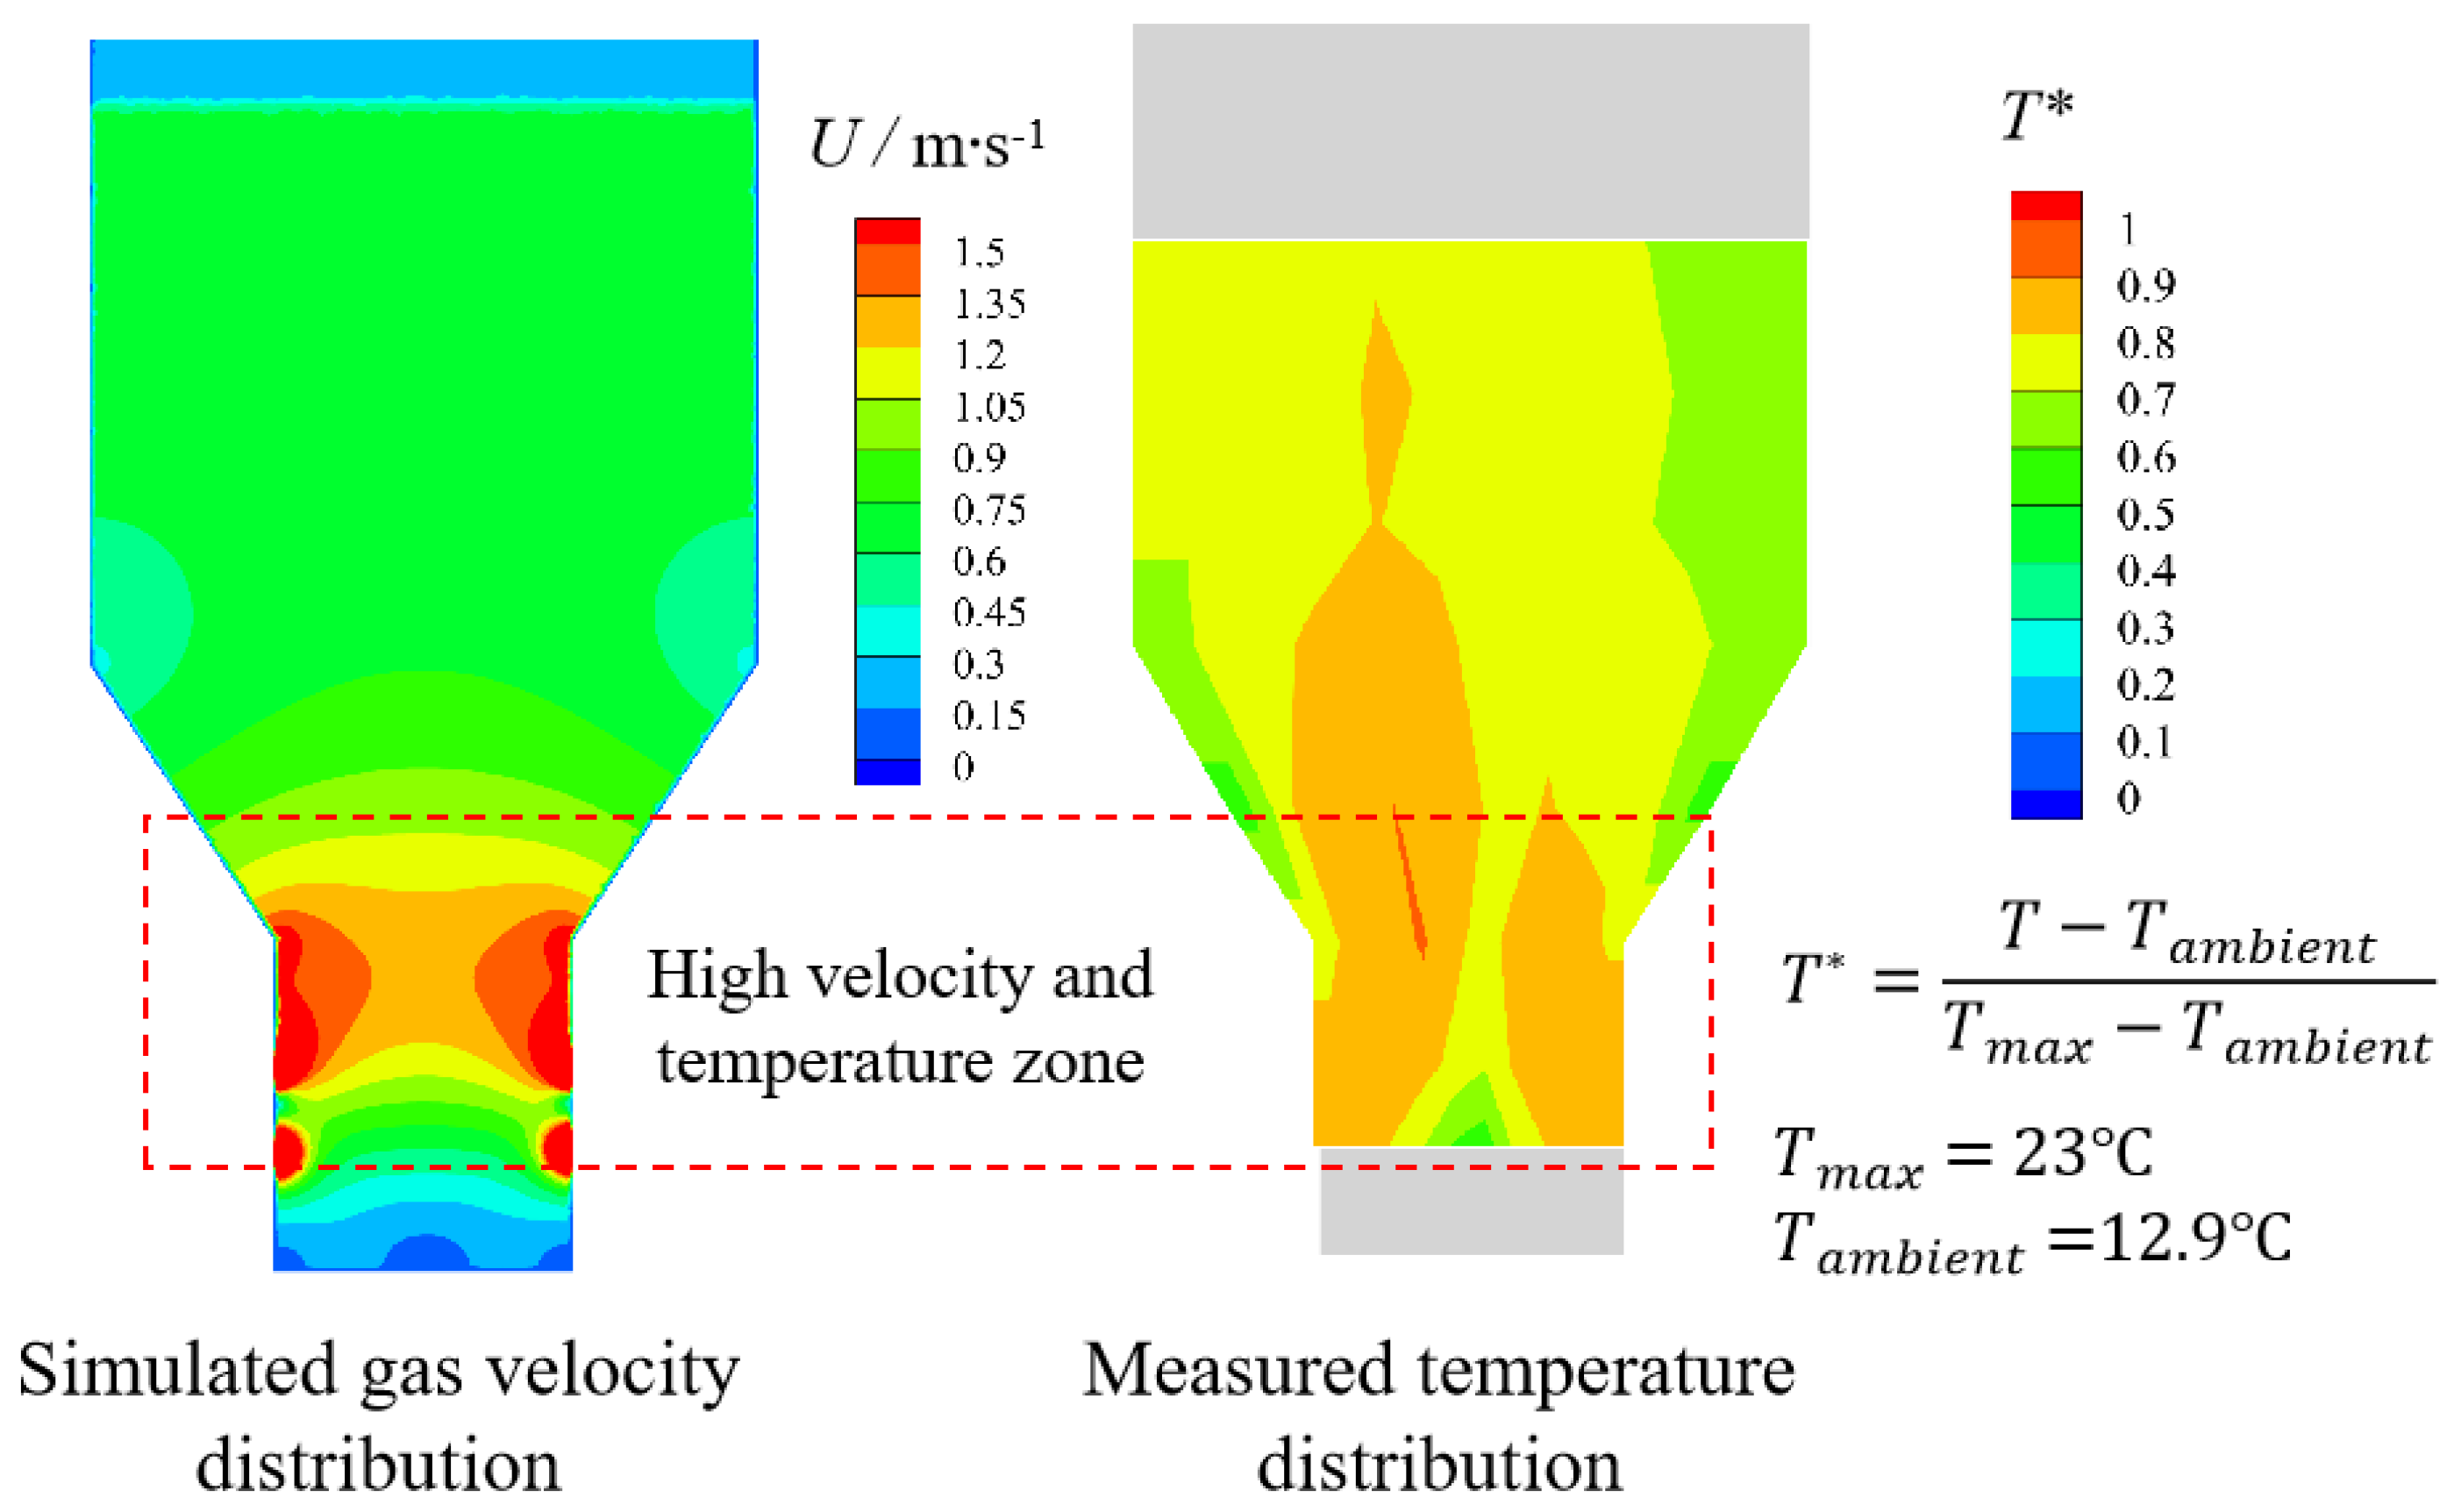
The wall temperature evaluation mainly included the gas convection due to the limited solid heat diffusion. In experiment, the vertical oven filled with small particles, which caused difficulty in directly measuring the gas flow with the PIV (particle image velocimetry) method. The simulation work was conducted to understand the gas flow field. It was found that the simulated high-velocity zone and the measured high-temperate zone were consistent with each other (Figure 4). Two peaks of the velocity and temperate were observed in the simulation and experiment. The high-velocity gas increased the heat convection and then increased the wall temperate near the orifices in the lower zone. By common sense, the fixed small particle layer can uniformly distribute the gas flow. However, Figure 3 and Figure 4 indicate an uneven gas velocity distribution within a packed bed, which is seldom concerned in previous investigations. It should further investigate the effect of operating parameters on uneven gas velocity distribution.
3.2. Effect of Gas-Feeding Layers
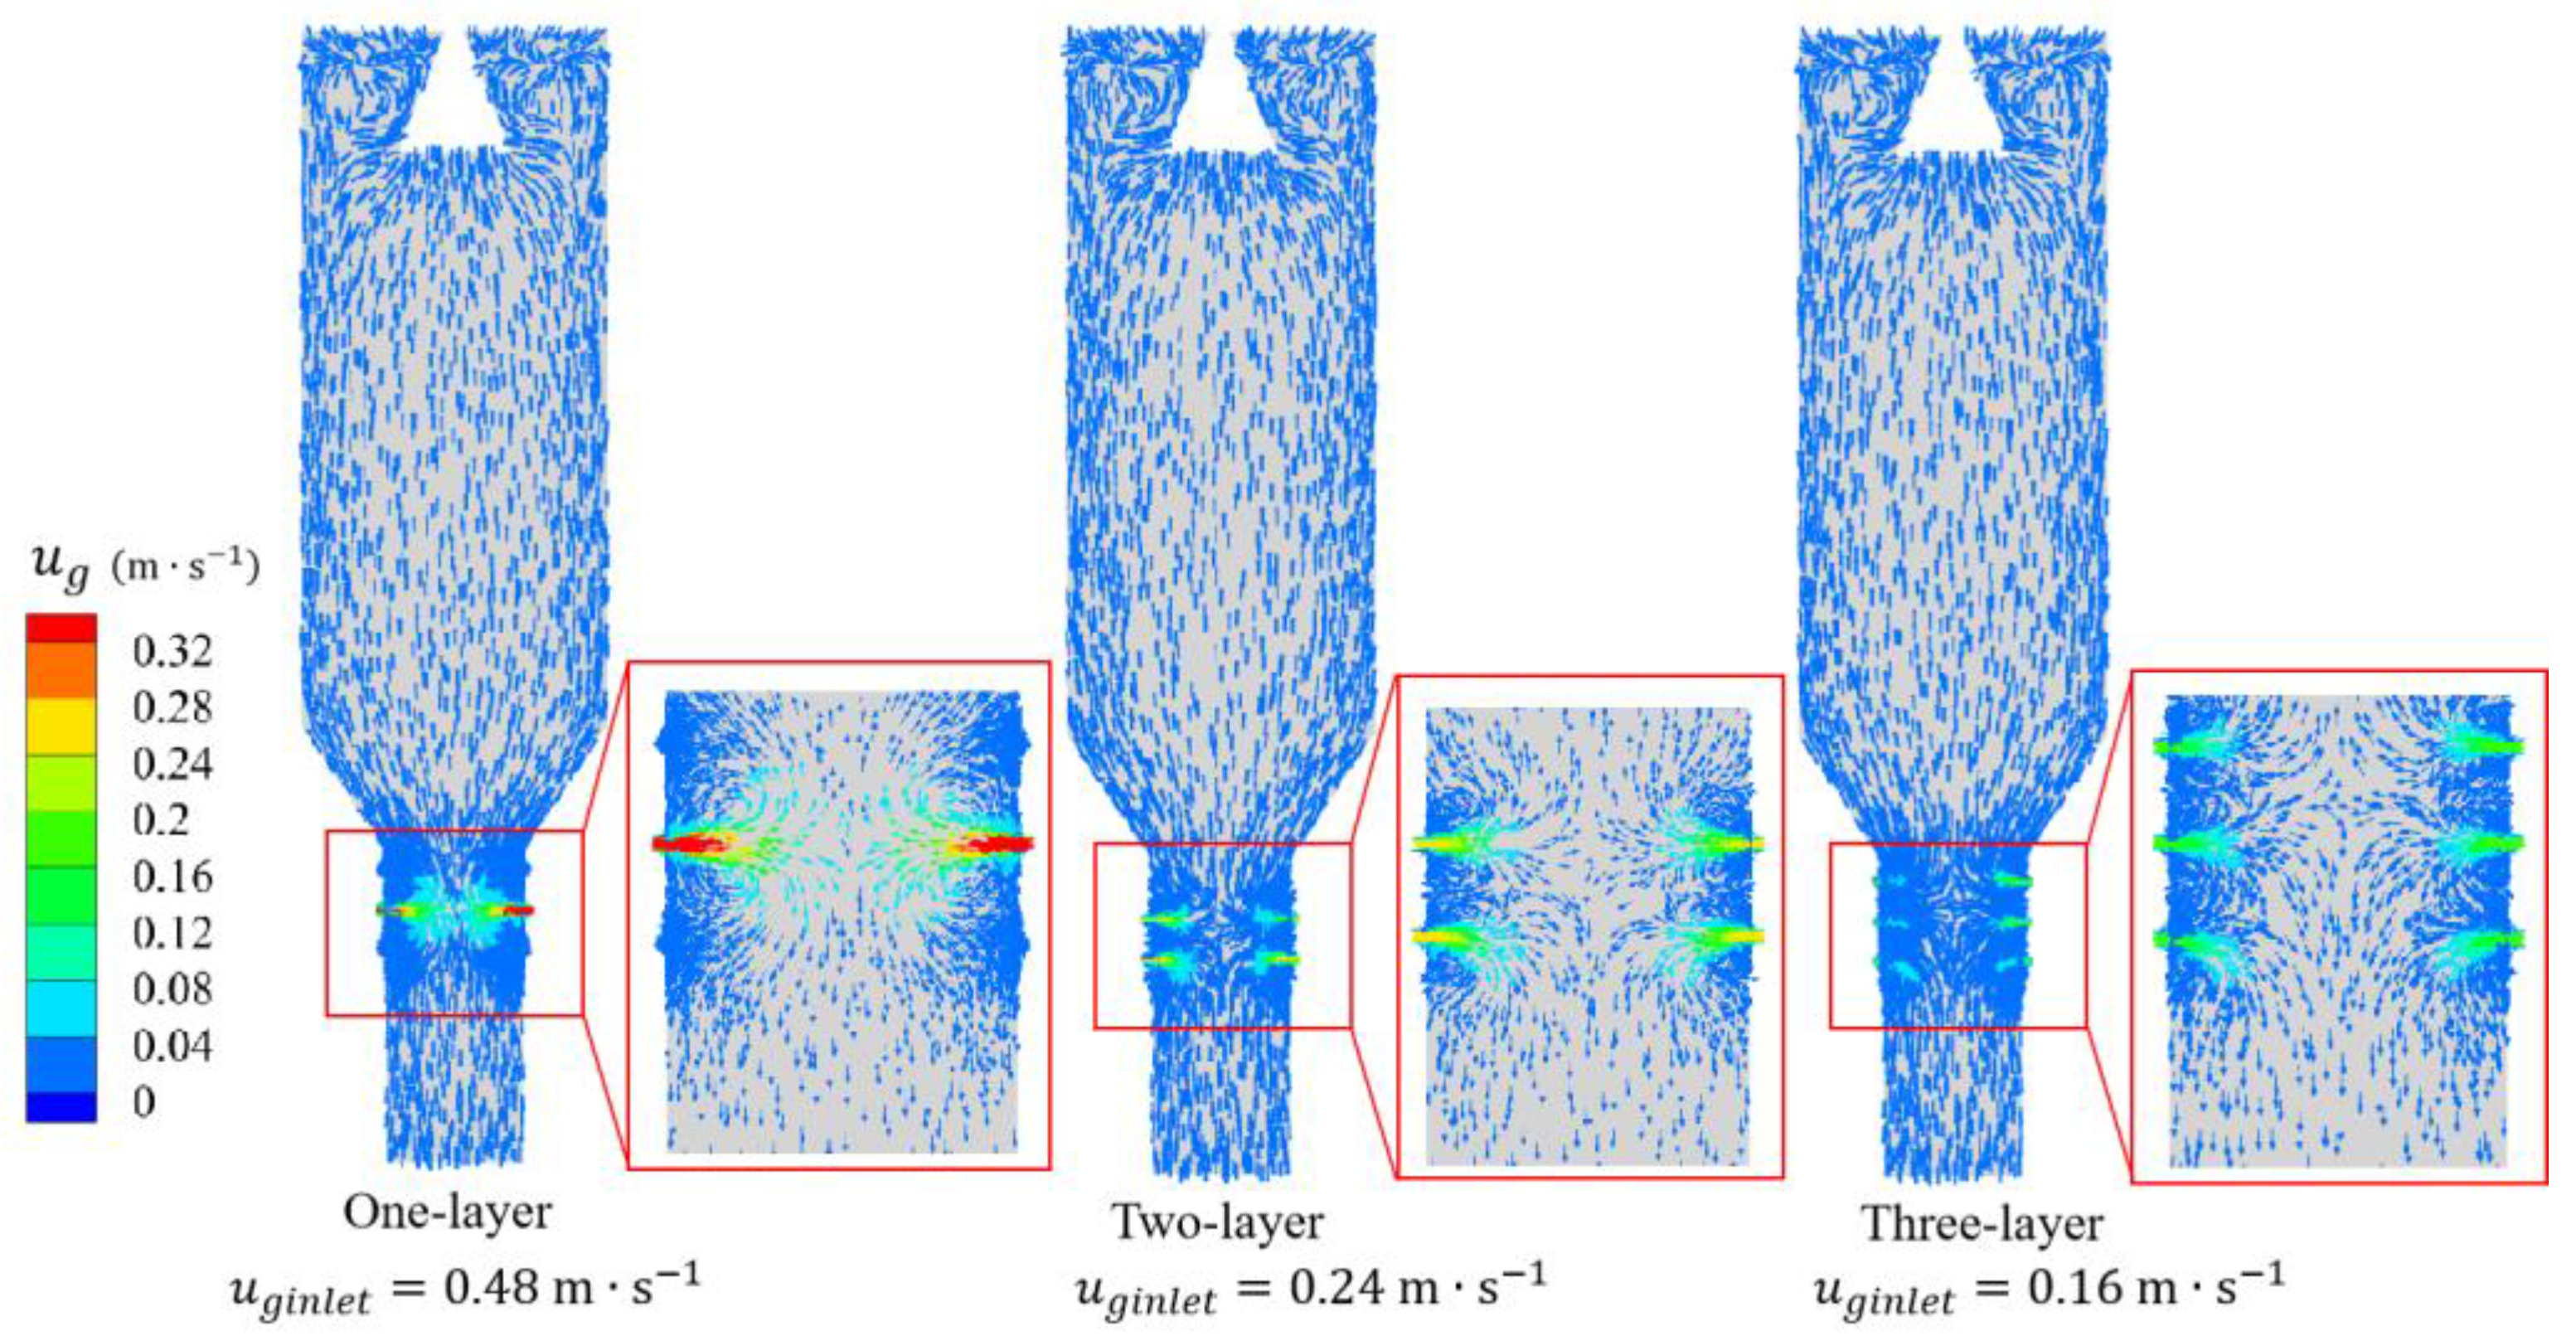
Figure 5 illustrates the impact of the injection layer on the distribution of the gas flow vectors. Three cases were simulated with the same gas volumetric feeding rate. Each injection layer had the same cross-sectional area. The gas feeding rate with a single injection layer was 0.48 , while that with two injection layers was 0.24 , and that with three injection layers was 0.16 . All three cases predicted the injection flow in the lower zone and a uniform gas distribution in the upper zone. In the lower zone, the gas injection length decreased with the increase in the number of orifice layers due to reduced inlet gas velocity. The single-layer case produced the strongest penetration and reflux, whereas the three-layer case had small reflux. These three divergent gas flow characteristics significantly affected the combustion process. The single injection layer was more likely to achieve robust combustion and increase the likelihood of over-burning. Conversely, an increased number of injection layers could produce moderate combustion or a significantly longer injection and a lower gas flow rate injected into the lower zone, thereby increasing the likelihood of under-burning. The design with multiple injection layers allowed flexible control of the air and gas injection possibilities. Li et al. [25] found that secondary gas injection tended to reduce gas back-mixing in a fluidized bed. With better gas–solid mixing, the secondary gas was injected through the distributed jet arrangement. The multiple injection layers in the present work played a similar role to the secondary gas injection. A symmetric arrangement of the injection system is the preferred design.
Figure 6 illustrates the effect of the injection layers on the gas velocity in the Y direction, indicating the flow direction and reflux degree. The injection layers had a significant effect on the gas velocity in the Y direction in the lower zone (R1–R3) and conical zone, whereas the orifice layers hardly had any effect on the gas velocity in the upper zone, such as along the lines of R5–R6. In section R1, the velocity profile of a single injection layer closely resembled the contour of an open–upward parabola with a large range. Xiaoyan [26] also found an open–upward parabola of the velocity profile in the upper zone based on a porous media model for a vertical oven with single injection layer. Wu et al. [27] numerically investigated the flow and heat transfer process during coal pyrolysis in a vertical oven (height of 8400 mm and inlet diameter of 100 mm) with two injection layers. Uniform streamline profiles was simulated inside the inner bed, which was similar to the present results. The maximum velocity in the Y direction was −0.035 , while two and three injection layers produced a much narrower range. In section R2, the velocity profile showed multiple peaks. The cases with one and two injection layers had velocities in the positive direction, while the case with three injection layers had velocities in the negative direction. In section R3, the velocity profile for a single injection layer was a mirror image distribution of R1. All three cases showed a positive velocity distribution, indicating upward flow.
Figure 7 shows how the coal particles were distributed in different areas of the lower and upper zones. The standard deviation of the coal phase volume fraction of the upper zone was higher then that in the lower zone. This means that the distribution of coal particles was more uniform in the upper zone. When two injection layers were used, the distribution of coal particles was more uniform than with one or three injection layers in sections R1, R3, R4, R5, and R6. The average mixing entropy of the gas phase velocity also played an important role. In areas such as R2, R4, R5, and R6, the single-injection-layer case had a lower mixing entropy than two-layer and three-layer cases. This means that the flow process was more efficient when using multiple injection layers, as it reduced the reflux. This information could be useful for applying multiple injection layers in the design of vertical ovens.
3.3. Effect of the Particle Size
The impact of the coal diameter on the bed pressure and temperature has been reported in the literature. Yin et al. [28] found that smaller-particle-size biomass increased the bed pressure drop due to production of much more tar and ash in a pilot-scale fixed-bed gasification system (diameter of 800 mm and a height of 1700 mm). Petal et al. [29] experimentally studied the effect of the lignite particle size on the performance of a pilot-scale (10 kWe) downdraft-type fixed-bed gasifier. They found that increasing the particle size increased the gas production and heating value. A better gasification performance was obtained when feeding a medium size of 22–25 mm. However, the effect of particle size is not always to reduce the temperature and pressure drop. Martínez et al. [30] added fine particles (diameters below 10 mm) in a downdraft fixed-bed gasifier, and they did not observe a temperature decrease and flow resistance due to the short residence time. Mi et al. [31] numerically studied an SJ oven with one layer of injection. They found that the decreased particle size decreased the overall oven temperature by increasing the bed resistance. The pressure increased from 703 to 4184 Pa when the particle size decreased from 40 to 5 mm. The increase in bed pressure could further reduce the gas distribution uniformity.
Figure 8 shows the variation of the solid fraction standard deviation with the bed height in the upper zone. The standard deviation generally decreased in the range of 6–80 mm. This suggested that the increased coal particle diameter resulted in a much lower deviation and a more uniform gas distribution. However, a coal diameter between 6 and 15 mm led to a higher standard deviation of the solid fraction, indicating an uneven gas fraction distribution. Figure 8 illustrates the effect of increasing diameter on the gas velocity mixing entropy. The mixing entropy initially decreased with increasing coal diameter. Furthermore, an increase in the bed height reduced the gas velocity mixing entropy. It is evident that coal diameter had a significant effect on the standard deviation and mixing entropy of the gas velocity.
3.4. Effect of Gas Feeding Velocity
Figure 9 shows the effect of the gas inlet velocity on the gas distribution. There was a remarkable effect of the inlet velocity on the velocity value in the Y direction with the bed height. In the lower zone and the upper zone, the increased inlet gas velocity could increase the velocity value in the Y direction. The velocity profiles along the lines were similar. Figure 10 shows that increasing the gas feeding rate increased the coal solid fraction standard deviation, which indicated that the solid distribution gradually became uneven. The gas velocity mixing entropy slightly decreased with increasing gas inlet velocity in the range of 0.1–0.3 .
3.5. Effect of Gas Feeding Angle
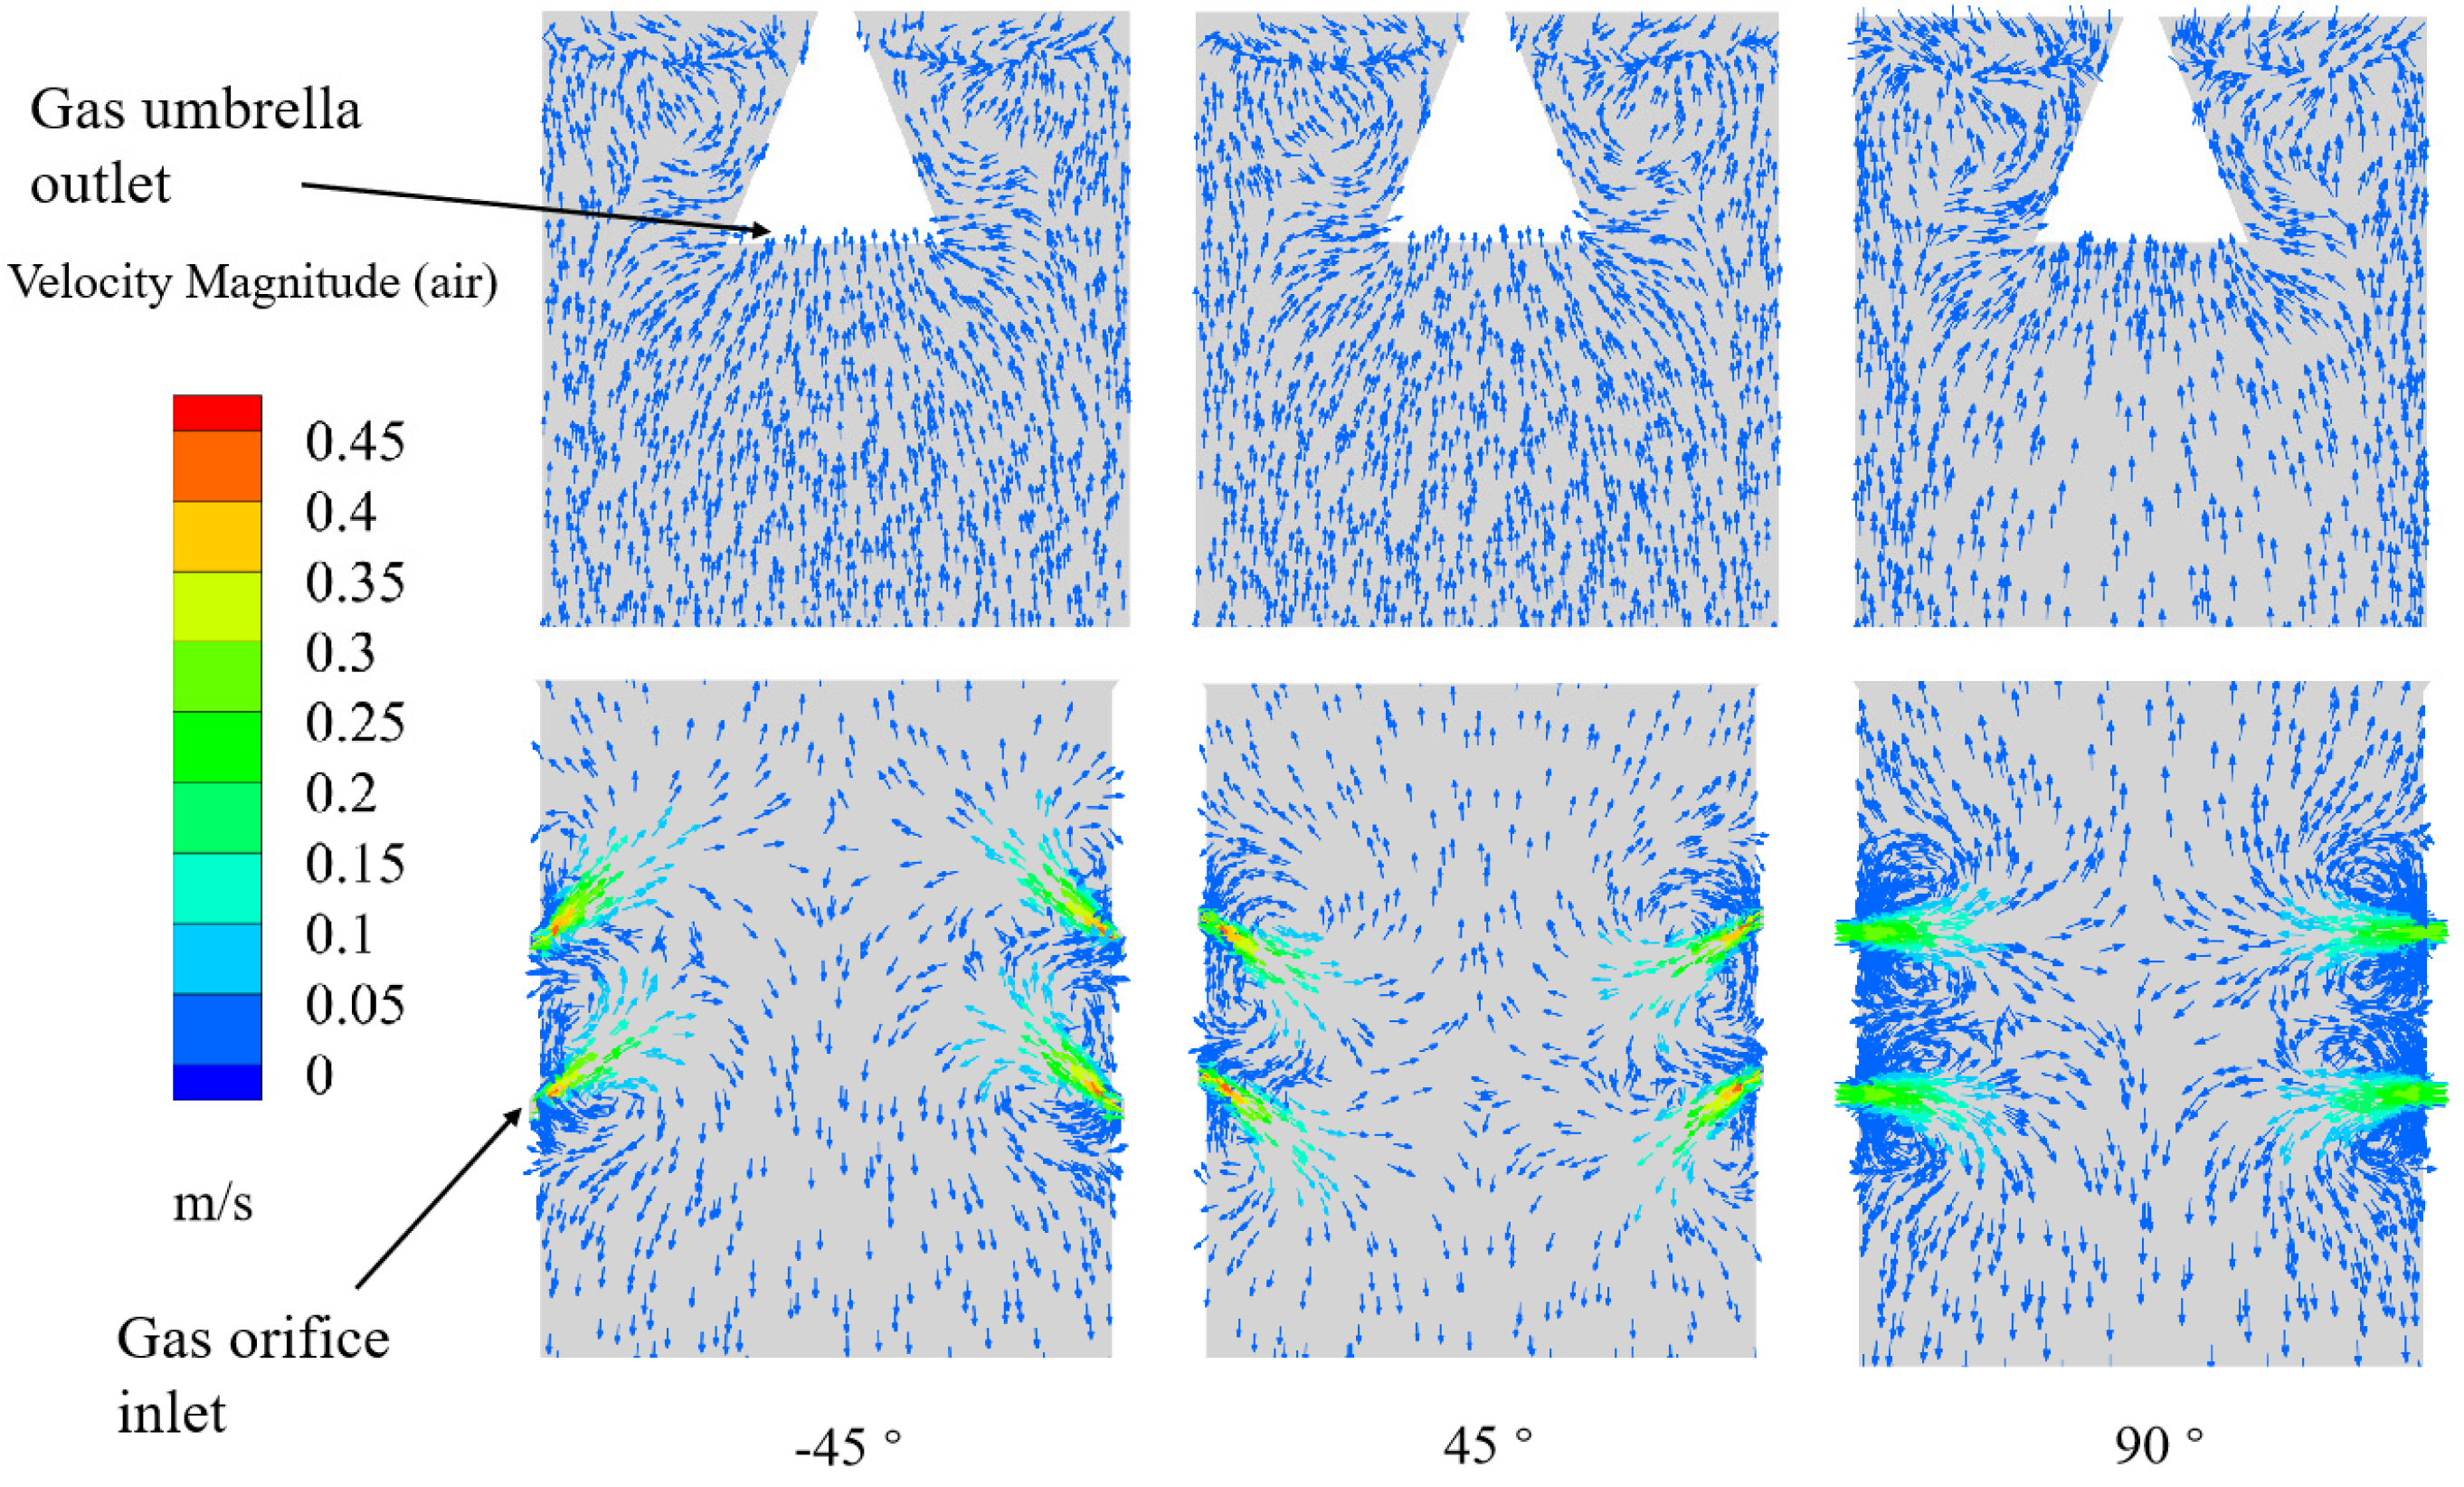
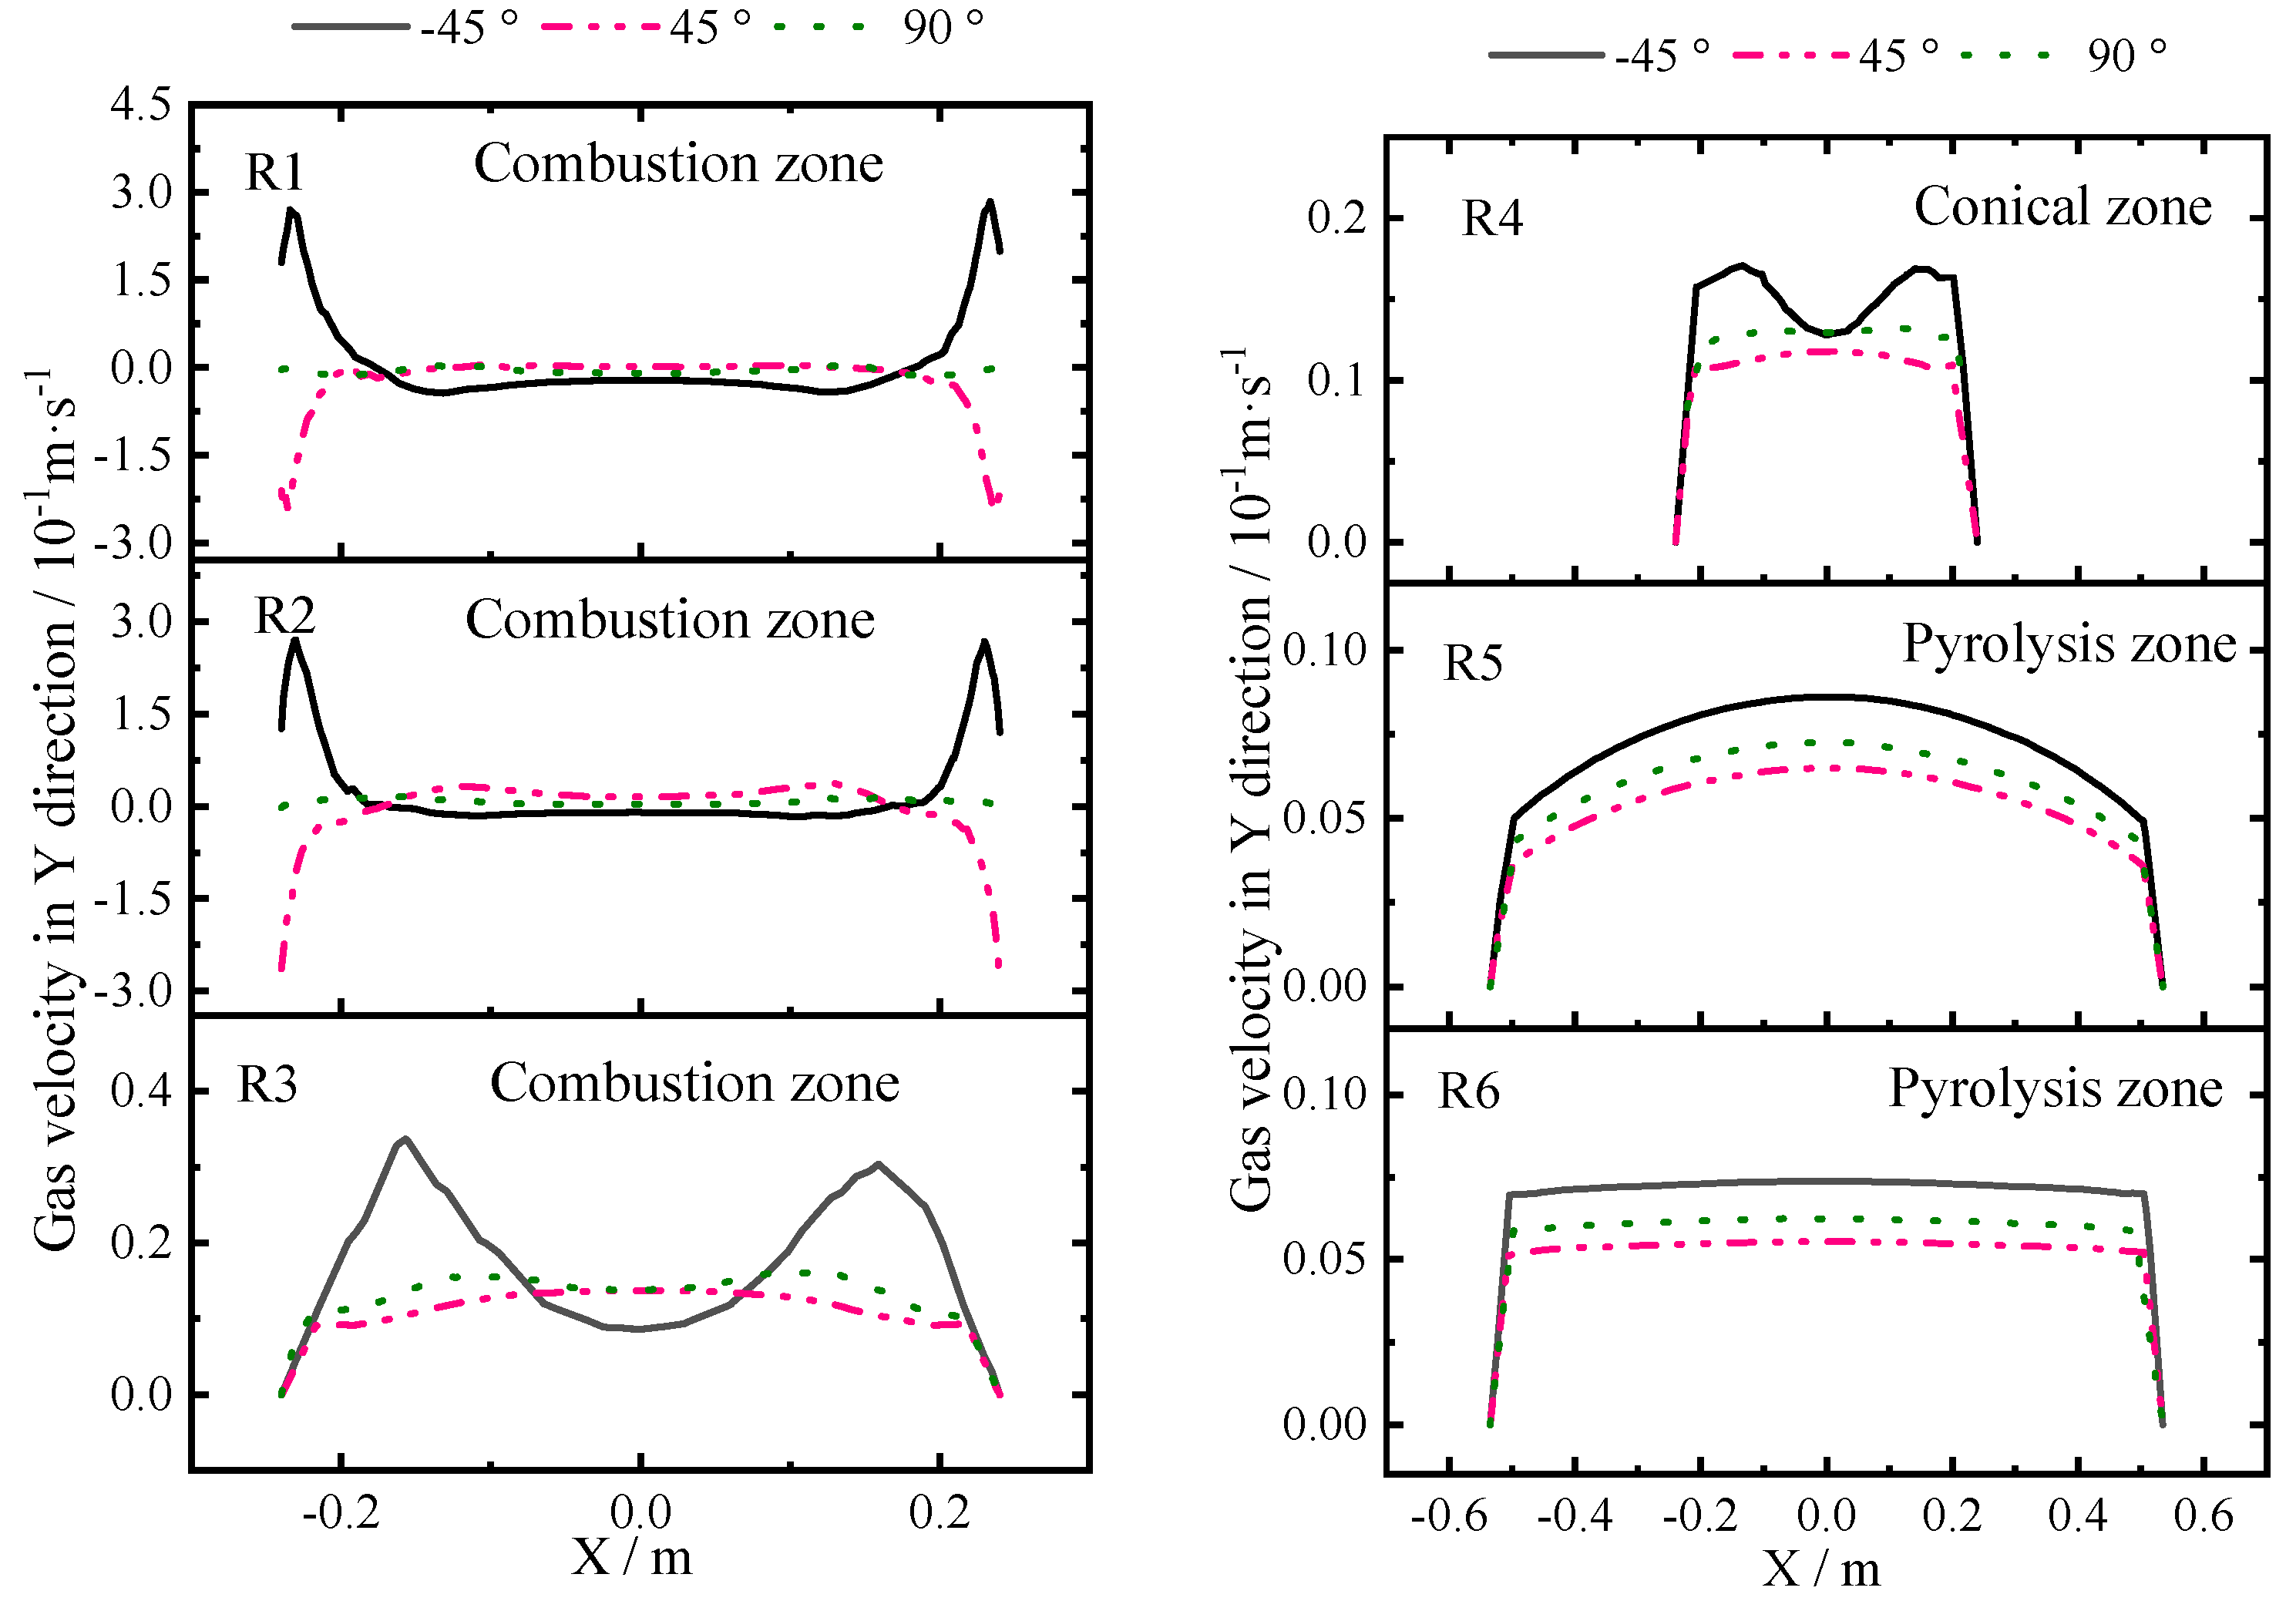
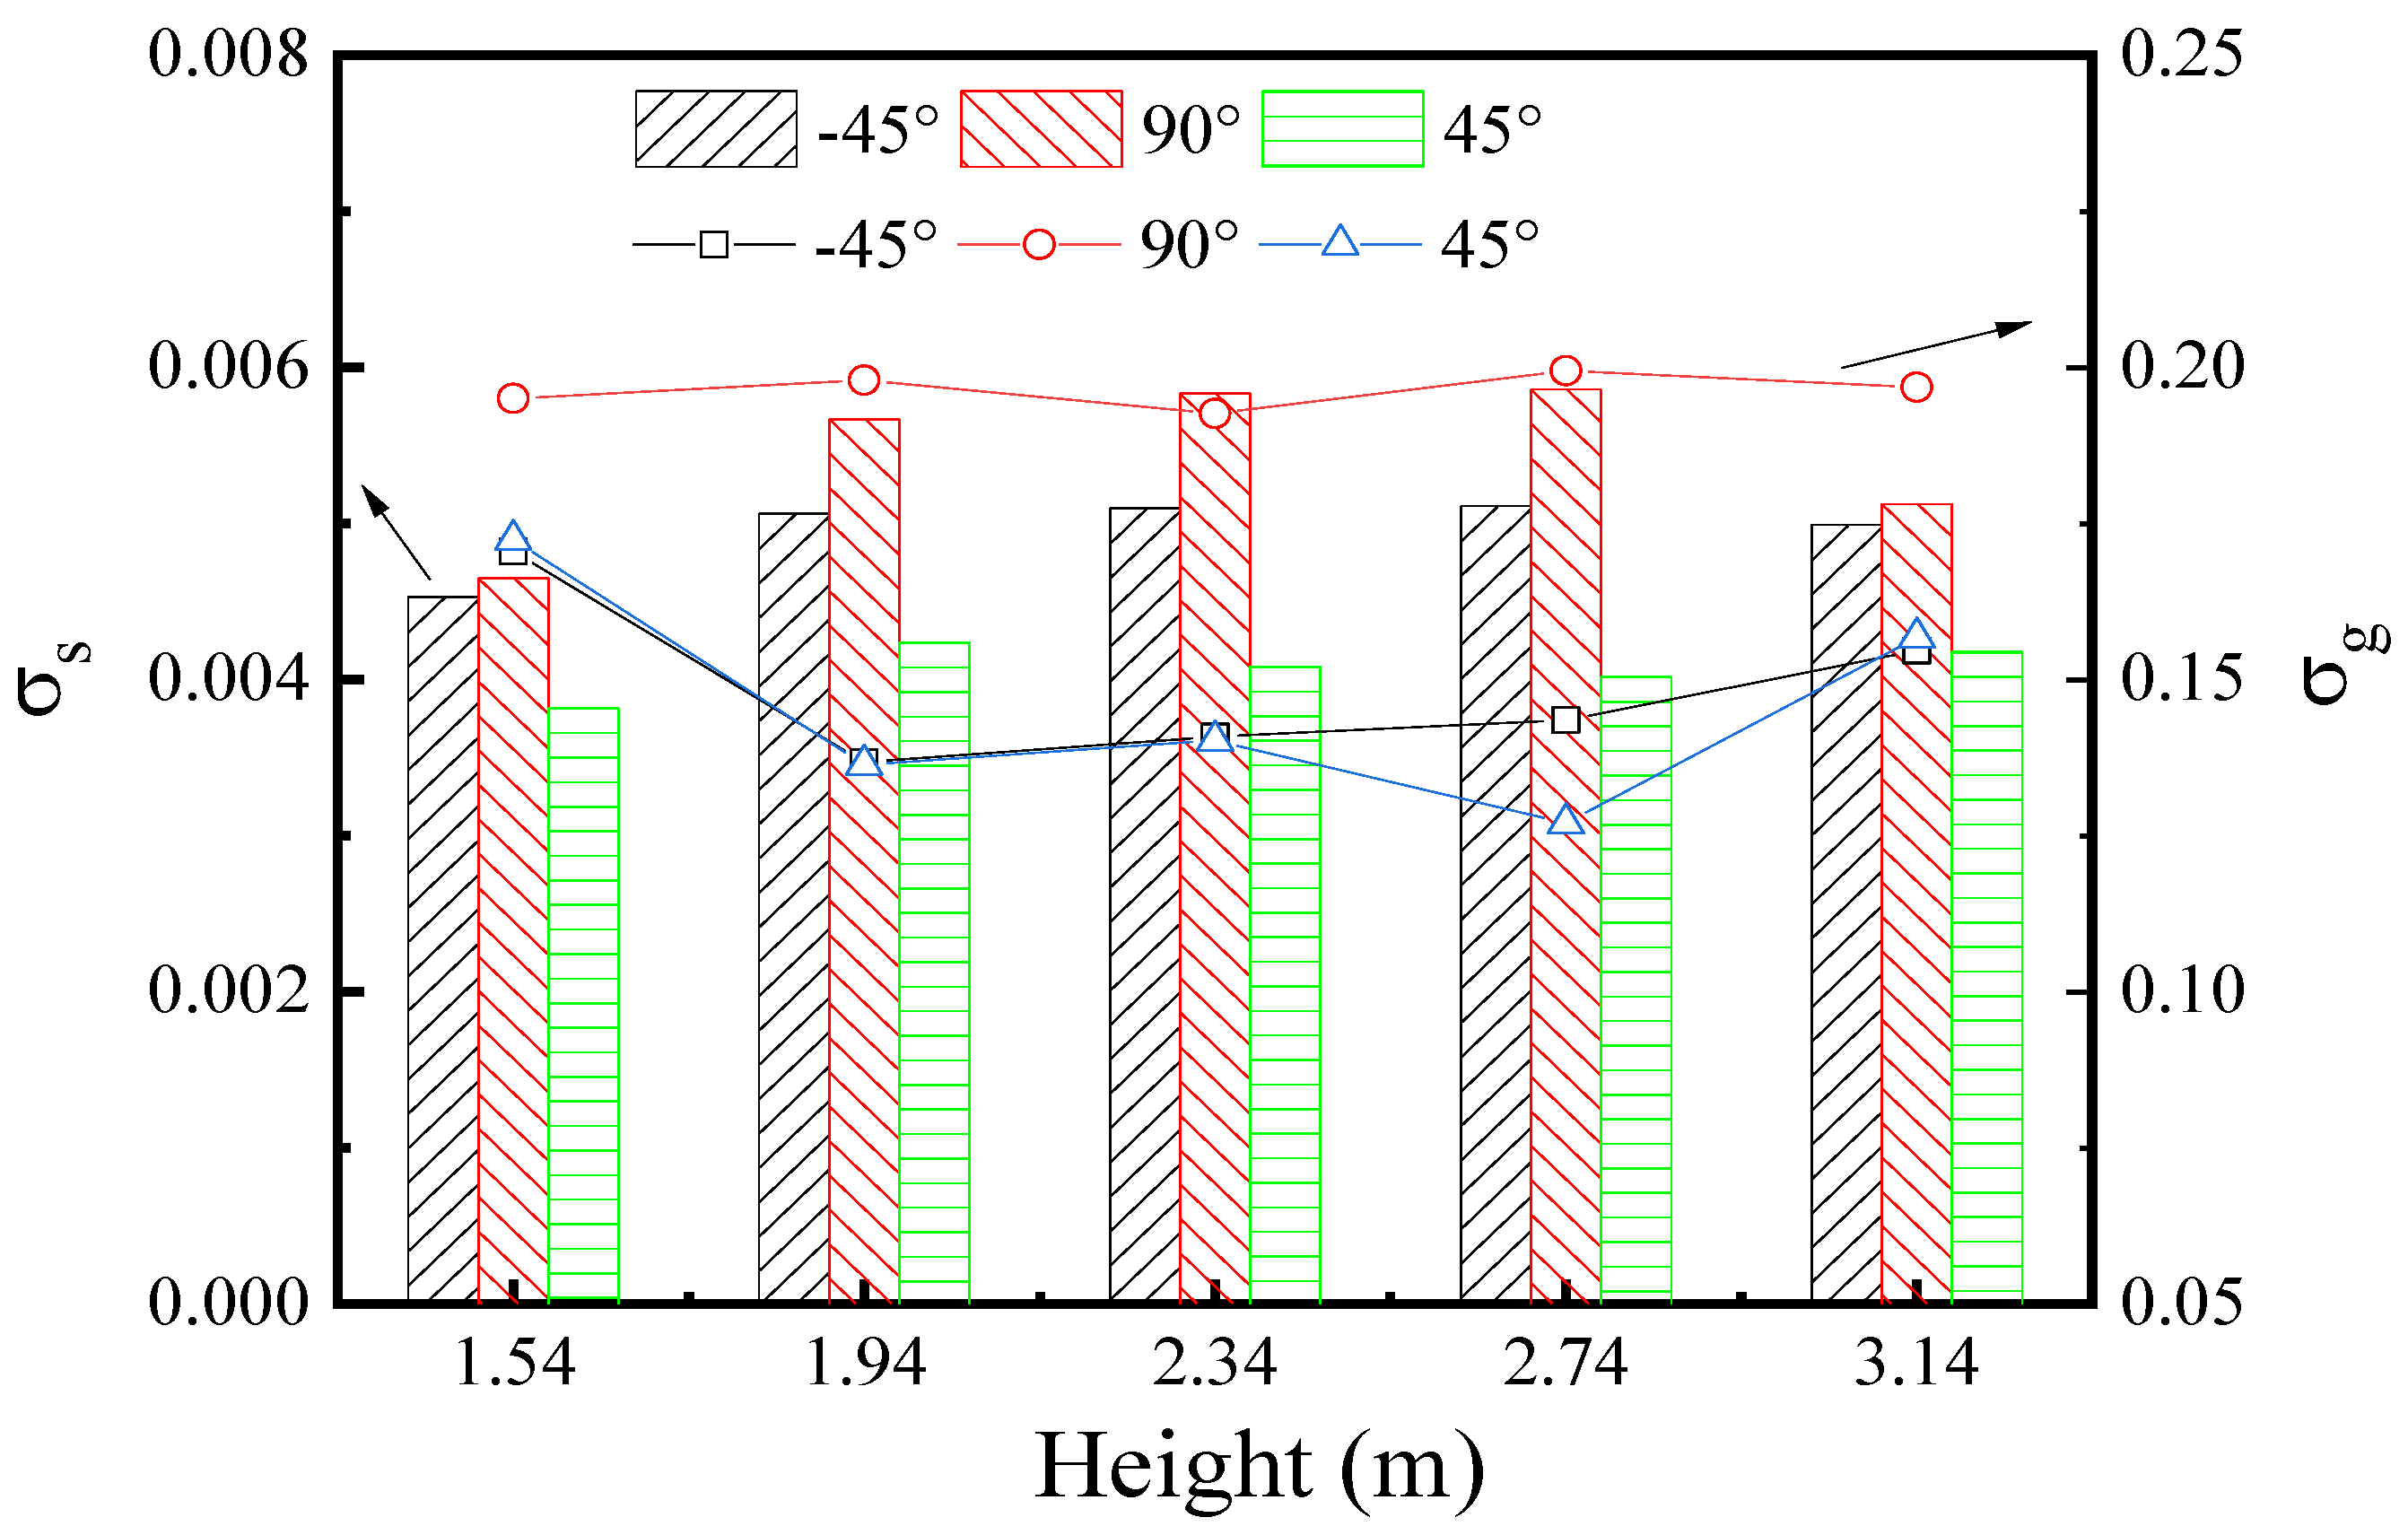
Figure 11 shows the effect of the gas feeding angles of −45°, 90°, and 45° on the gas distribution. The gas feeding angle changed the direction of the flow jet in the lower zone. As the feeding angle decreased from 45° and 90° to −45°, the gas velocity in the Y direction increased to some extent. However, the velocity profile showed high agreement in the upper zone for feeding angles of 45°, 90°, and −45°, as shown in Figure 12. The feeding angle of 45° yielded the minimum coal solid fraction standard deviation and the lowest gas velocity mixing entropy, as shown in Figure 13, which corresponded to a more uniform gas velocity distribution and much less reflux. Wei et al. [32] found that a double-symmetric feeding pipe with a feeding mouth angle of 45° produced a more uniform solid distribution in a fluidized bed. The feeding angle of 45° could prolong the gas residence time to reduce the probability of gas bypassing. This suggested that a feeding angle of 45° should be selected in designing a vertical oven.
4. Model Validation
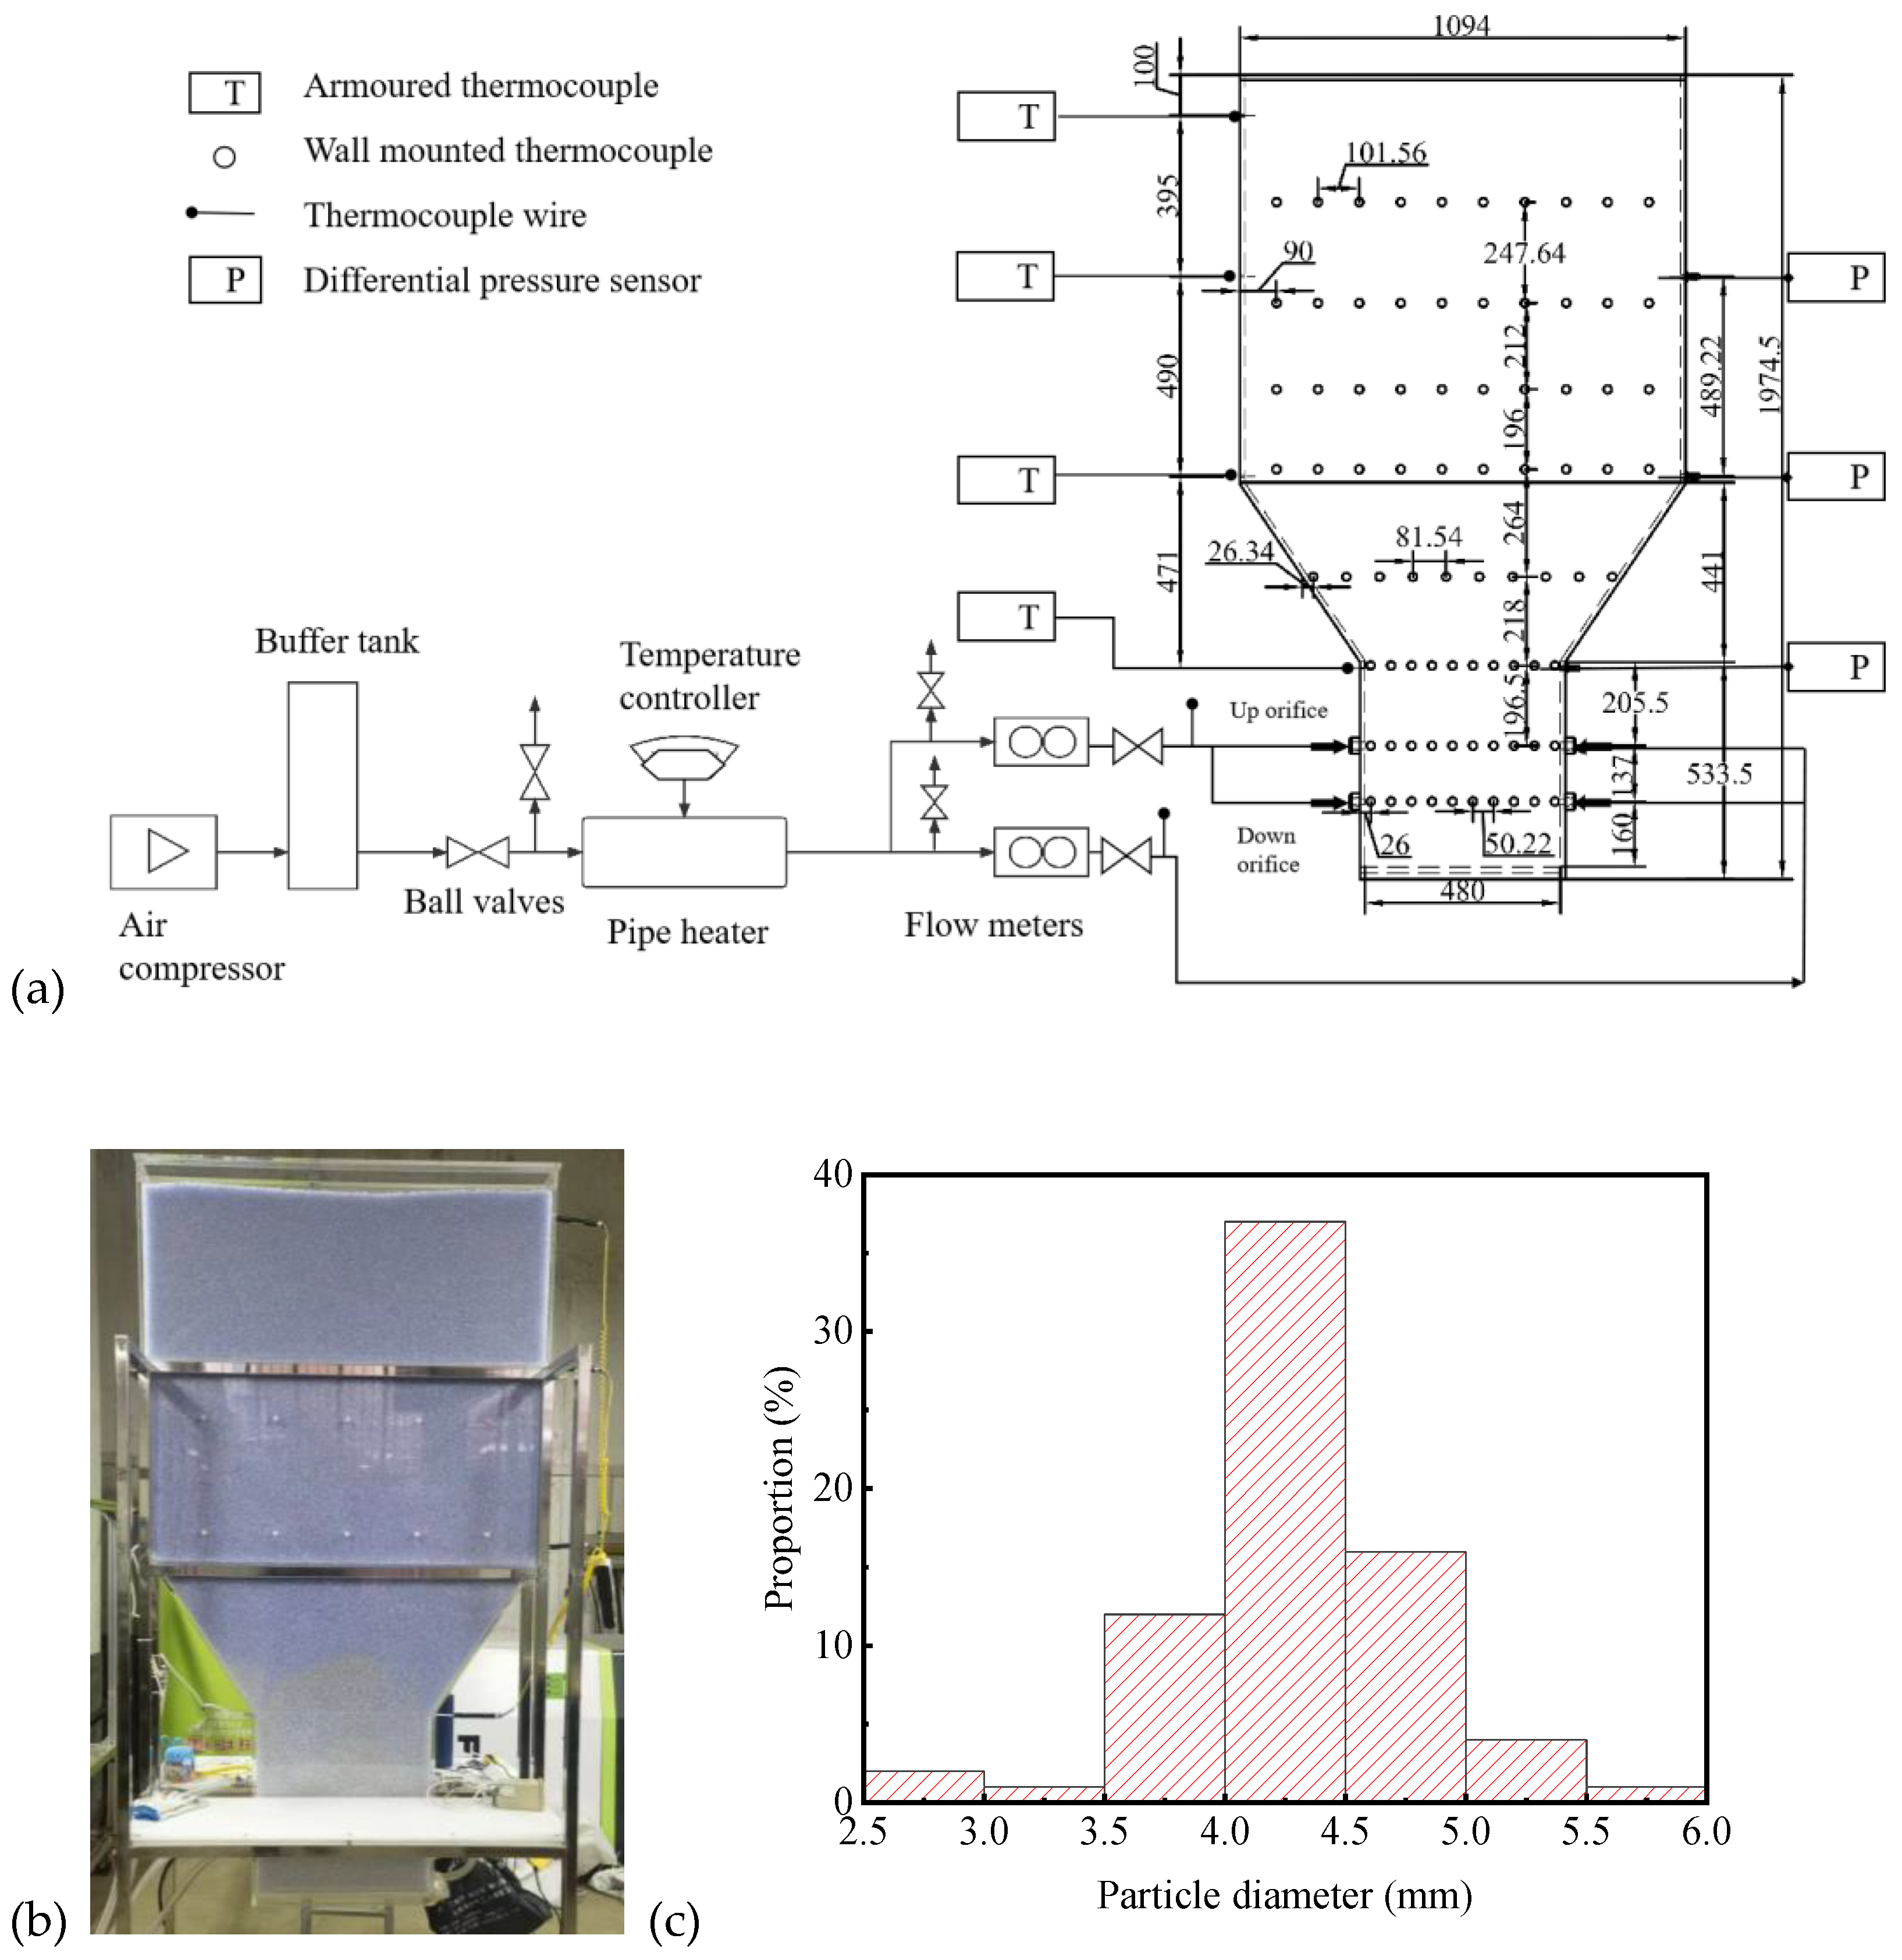
The three-dimensional vertical-oven experimental setup with a multi-injection structure was built. The experimental setup included a hot-gas supply system and an experimental section. A screw compressor (22 kW) was applied to provide air flow. A buffer tank was installed to maintain a stable pressure and reduce pressure fluctuations. The air flow was heated by a pipe heater (6 kW) with a temperature controller. In the experiments, air was compressed and heated by an auto-controlled pipe heater. Its temperature was recorded by an inserted thermocouple wire, and the flux was measured by a vortex flowmeter. The flow rate was regulated by ball valves. The hot air flow was injected into the vertical oven through the orifices. Two layers of orifices were tested in the experiment. The height of the experimental section was 2000 mm, the width of the bottom combustion section was 480 mm, and the height of the main pyrolysis section was 1094 mm (Figure 14a,b). The thickness of the experimental section was 100 mm. Four temperature sensors and three pressure-difference sensors were installed in the experimental section to obtain the bed temperate and pressure drop. In the front wall of the section, 80 points were labeled to record the wall temperature using wall attachment thermocouples. The detailed positions of the temperature measurement points are shown in detail in Figure 14a. The wall temperature of the vertical oven was mainly dependent on the hot-gas flow velocity in the local area. Heat gas can be viewed as a tracer to quantify flow [33]. The measurements of the wall temperature indicated the local gas velocity. Three pressure differential sensors were applied to measured the bed pressure drop. The location of the measurement points are shown in Figure 14. The bed material was polyvinylchloride particles with a real density of 1340 and a narrow diameter range of 3.5–5 mm (Figure 14c).
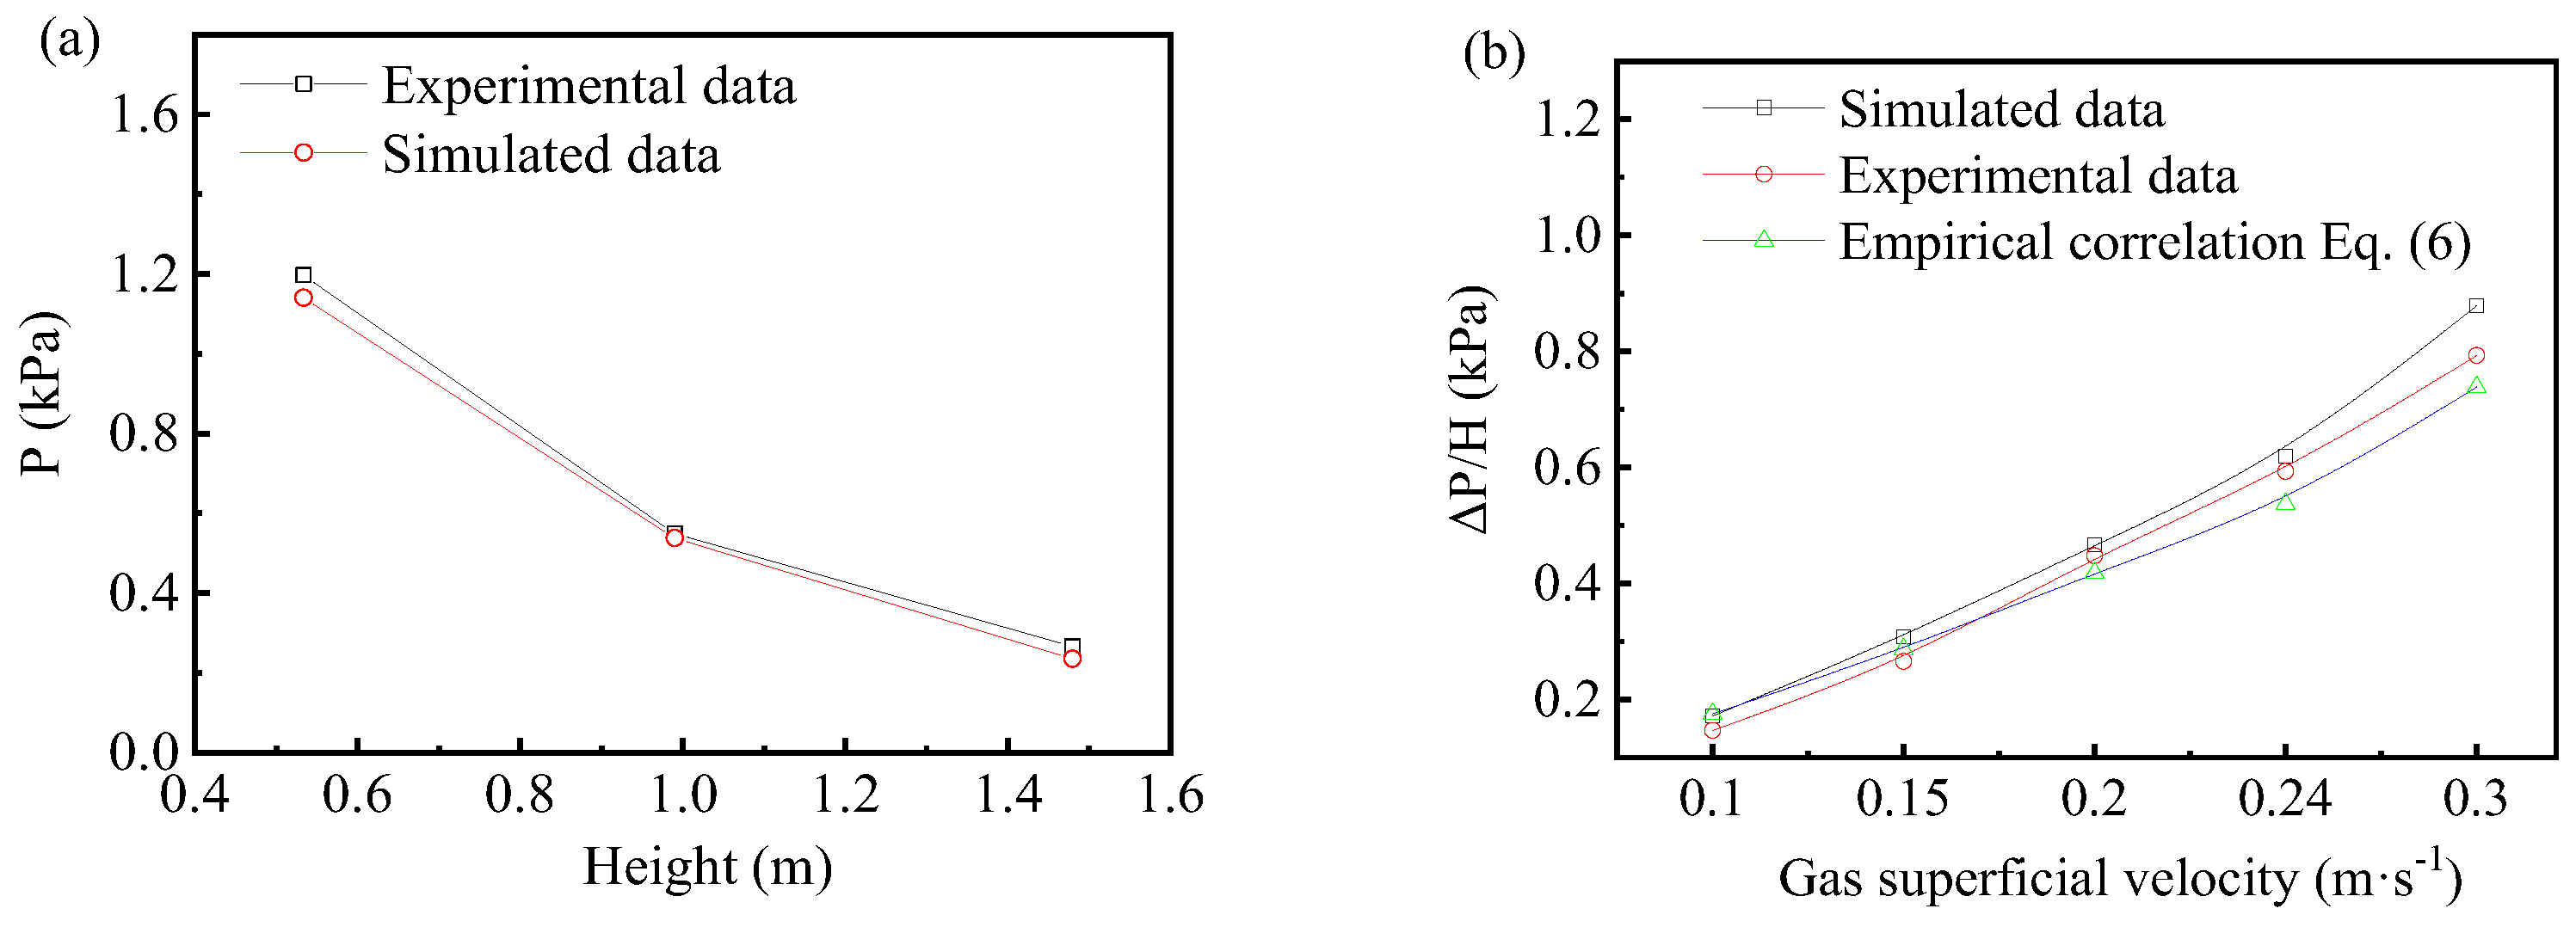
Figure 15 compares the bed pressure drop obtained from the simulations, experiments, and empirical equation. In the simulation, an average diameter of 4 mm was set to simplify the narrow diameter range. The correlation was corrected based on the Ergun equation for moving-bed experimental data [34], shown as follows:
where is the bed pressure drop through the height , is the gas velocity, is the coal feeding velocity, is the gas viscosity, is the gas density, is the particle diameter, and is the sphericity.
Figure 15a shows that the pressure drop decreased with an increase in the bed height. The simulation results were very close to the measured pressure drops, with an averaged deviation of 6.1%. Figure 15b shows that the pressure drop increased with the gas velocity. The simulation results agreed well with the correlation and experimental data, with a deviation below 10%. Zhang et al. [35] experimentally investigated the pressure drop of a moving bed (the maximum material bed height was 700 mm) fed with Yulin coal with a diameter of 30 mm. They found the deviation of the pressure drop calculated by the Ergun equation and the actual industrial operation data was about 10%. The Ergun equation is suitable for predicting the pressure drop of a vertical oven.
5. Preliminary Economic Analysis
Due to the fact that the scope of work in this study mainly focuses on the evaluation and optimization of the vertical-furnace intake method, and the device used in this study is a cold experimental device with a small scale, it is impossible to provide detailed information and cost–benefit analysis of the entire industrial process. Therefore, this study only conducted a preliminary economic analysis on the capital cost and potential income of the improved blue-coke vertical oven process compared to the conventional blue-coke vertical oven process.
5.1. Cost Breakdown
The production cost of blue charcoal usually includes the following:
- ✧
- Raw coal washing and screening;
- ✧
- Vertical oven and auxiliary equipment;
- ✧
- Gas purification and air system;
- ✧
- Tar recovery equipment;
- ✧
- Power distribution and control system;
- ✧
- Waste gas and wastewater treatment.
Compared with conventional vertical oven, the improved blue-coke vertical oven only has some cost for improving the gas intake structure, and the cost for retrofitting a 1 million ton/year blue-coke vertical oven is about 600,000 yuan, with no increase in operating costs. However, it should be considered that compared to before the optimization of the intake structure, the improved structure has a more uniform gas distribution, which is beneficial for improving the quality of the blue coke. The improvement of the production quality will balance the renovation cost.
5.2. Potential Income
By optimizing the operating parameters of the blue-coke vertical oven (optimizing gas velocity) and changing the furnace inlet mode (adjusting the number and angle of inlet layers), the gas distribution during pyrolysis can be more uniform, and the technical indicators of blue-carbon products can be improved to meet the sales quality standards. According to the calculation of a 1 million ton/year coal pyrolysis plant, when the qualification rate of blue carbon products increases by 3%–5%, the annual output can increase by 30,000 to 50,000 tons. The current price of blue coke is about 1000 yuan/ton. The price difference between qualified and defective blue coke is about 200 yuan/ton. It is calculated that an annual profit increase of 6–10 million yuan can be achieved.
The current analysis of cost and benefit information is relatively limited, and not all potential costs and benefits have been evaluated. However, it is clear that the improvement of the gas intake method of the blue-coke vertical oven is a significant product advantage and generates net benefits. This article analyzes the parameters that are conducive to finding the optimal structure and operation, laying the foundation for further and more detailed research in future work.
6. Conclusions
This paper simulated the gas–solid flow of a vertical oven with multiple injection structures. The effects of the number of layers of injection, coal size, gas feeding velocity, and gas feeding angle on the solid distribution and gas velocity distribution were investigated using three parameters: the coal solid fraction standard deviation, gas velocity standard deviation, and gas velocity mixing entropy. The main conclusions were as follows:
- The number of gas injection layers had a significant effect on the gas velocity distribution in the lower zone but a small impact on the upper zone. In the upper zone, the velocity profile closely resembled the contour of an open–upward parabola with a large range. Compared with one or three injection layers, the distribution of coal particles was more uniform when two injection layers were used.
- The decrease in the particle size led to an increase in the bed resistance, which in turn led to a decrease in the gas velocity in the Y direction in the upper zone. Small particle sizes of 6–15 mm increased the bed resistance and solid fraction standard deviation and made the gas fraction distribution uneven.
- The increased inlet gas velocity could increase the velocity values in the Y direction. The reduction of the gas velocity had no significant effect on the gas distribution uniformity. The simulation results suggested using an angle of 45°, instead of the present angle of 90°, could improve the gas distribution.
Supplementary Materials
The following supporting information can be downloaded at: https://0-www-mdpi-com.brum.beds.ac.uk/article/10.3390/coatings13101707/s1, Figure S1: Effect of layers of gas orifice on gas distribution, (a) Gas velocity vectors through in-central cross-section, (b) Gas velocity distribution near the gas orifice inlet and umbrella outlet, (c) Air fraction distribution (t = 20 s), = 6 mm, = 0.24 m/s and = 4.2 m/s; Figure S2: Effect of layers of gas orifice on gas distribution, (a) Gas velocity vectors through in-central cross-section, (b) Gas velocity distribution near the gas orifice inlet and umbrella outlet, (c) Air fraction distribution (t = 20 s), = 30 mm, = 0.24 m/s and = 4.2 m/s; Figure S3: Effect of layers of gas orifice on gas distribution, (a) Gas velocity vectors through in-central cross-section, (b) Gas velocity distribution near the gas orifice inlet and umbrella outlet, (c) Air fraction distribution (t = 20 s), = 50 mm, = 0.24 m/s and = 4.2 m/s; Figure S4: Variation of gas velocity in Y direction with increasing bed height under the effect of layers of orifice, (a) one layer, (b) two layers, (c) three layers; Figure S5: Influence of gas injection layers on gas distribution in the pyrolysis zone, (a) Coal solid fraction standard deviation, (b) Gas velocity standard deviation, (c) Gas velocity mixing entropy, = 0.24 m/s and = 4.2 m/s; Figure S6 Influence of coal feeding rate on gas distribution, (a) Gas velocity vectors through in-central cross-section, (b) Gas velocity distribution near the gas orifice inlet and umbrella outlet, (c) Air fraction distribution (t = 20 s), = 30 mm, = 0.24 m/s; Figure S7 Variation of gas velocity in Y direction with increasing bed height under the effect of coal feeding rate; Figure S8 Influence of coal feeding rate on gas distribution in the pyrolysis zone (a) Coal solid fraction standard deviation, (b) Gas velocity standard deviation, (c) Gas velocity mixing entropy, = 30 mm, = 0.24 m/s.
Author Contributions
Conceptualization, Q.Z. and D.L.; methodology, L.W.; software, Z.Y.; validation, C.Z., Z.Y. and Q.Z.; formal analysis, X.F.; investigation, Q.Z.; resources, D.L.; data curation, Z.Y.; writing—original draft preparation, Q.Z. and Z.Y.; writing—review and editing, L.W.; visualization, Q.Z.; supervision, L.W.; project administration, L.W. and D.L.; funding acquisition, L.W. and D.L. All authors have read and agreed to the published version of the manuscript.
Funding
This research is supported by the National Natural Science Foundation of China (No. 22278332, 2162576216); Shccig-Qinling Program (No.SMYJY20220130); Shaanxi Province’s Key Research and Development Plan (No. 2023-YBGY-317) and Xi’an Qin chuang yuan “Scientist + Engineer” Project (No. 23KGDW0009-2023).
Institutional Review Board Statement
Not applicable.
Informed Consent Statement
Not applicable.
Data Availability Statement
All data that support the findings of this study are included within the article.
Conflicts of Interest
The authors declare no conflict of interest.
Nomenclature
| Pressure (Pa) | |
| Gas velocity mixing entropy | |
| Velocity (m s−1) | |
| Phase fraction | |
| Density (kg m−3) | |
| Viscosity (Pa s) | |
| Standard deviation | |
| Subscripts | |
| cell | Cell |
| g | Gas phase |
| m | Mean diameter |
| s | Solid phase |
| Particle shape factor |
References
- Feng, Y.; Xu, S. Blue-coke production technology and the current state-of-the-art in China. Carbon Resour. Convers. 2020, 3, 82–94. [Google Scholar] [CrossRef]
- Li, K.; Zhu, W.; Peng, J.; Sun, X.T.; Liu, G. Semi-coke producers in Shenfu area today and suggestions on improvement. Sino-Glob. Energy 2016, 21, 21–30. (In Chinese) [Google Scholar]
- Zhou, Q.; Wei, L.; Shen, L.; Ma, B. Development characteristics and suggestions of blue-coke industry in China. Coal Process. Comprehesive Util. 2022, 69–72. [Google Scholar] [CrossRef]
- Xue, F.; Li, D.; Guo, Y.; Liu, X.; Zhang, X.; Zhou, Q.; Ma, B. Technical progress and the prospect of low-rank coal pyrolysis in China. Energy Technol. 2017, 5, 1897–1907. [Google Scholar] [CrossRef]
- Zhao, J.; Chen, X.F.; Gao, W.J.; Xue, X.P.; Shi, J.P. Low-tempe-rature carbonization of Shenfu coal through the vertical internal heating re-tort furnace. Anhui Chem. Ind. 2010, 36–38. (In Chinese) [Google Scholar]
- Gao, W.J.; Xue, X.P.; Shi, J.P.; Zhang, J.Q. Research, development and design of SH2007 internally heated vertical oven. Gas Heat 2010, 30, 14–17+25. (In Chinese) [Google Scholar]
- Wang, L.; Li, N. Technical characteristics and application of RNZL vertical oven 10. Coal Process. Compr. Util. 2015, 185, 48–49+80. (In Chinese) [Google Scholar]
- Song, J.T.; Zhang, L. Discussion on technical renovation of small grained coal. vertical internally heated retort furnace (in Chinese). Coal Chem. Ind. 2017, 45, 27–29. Available online: http://qikan.cqvip.com/Qikan/Article/Detail?id=673029358 (accessed on 10 June 2022).
- Gao, Y.; Yan, L.; Li, J.; Fan, X.; Sun, Y.-Y. Influence of Inlet Diameter on Temperature and Pressure in SJ Low Temperature Dry Distillation Furnace. Liaoning Chem. Ind. 2018, 47, 647–648. [Google Scholar] [CrossRef]
- Zhang, C.; Wu, R.; Hu, E.; Liu, S.; Xu, G. Coal Pyrolysis for High-Quality Tar and Gas in 100 kg Fixed Bed Enhanced with Internals. Energy Fuels 2014, 28, 7294–7302. [Google Scholar] [CrossRef]
- Xu, S.; Lai, D.; Zeng, X.; Zhang, L.; Han, Z.; Cheng, J.; Wu, R.; Mašek, O.; Xu, G. Pyrolysis characteristics of waste tire particles in fixed-bed reactor with internals. Carbon Resour. Convers. 2018, 1, 228–237. [Google Scholar] [CrossRef]
- Zhou, Q.; Zhang, X.; Wang, Y.; Qu, S.-j.; Zhang, Y.; Bai, X.-y.; Pei, X.-f. Pyrolysis behavior of coal in a moving bed with baffled internals under different residence times. J. Fuel Chem. Technol. 2021, 49, 703–711. [Google Scholar] [CrossRef]
- Chen, H.; Chen, Y.; Hsieh, H.-T.; Siegel, N. Computational Fluid Dynamics Modeling of Gas-Particle Flow Within a Solid-Particle Solar Receiver. J. Sol. Energy Eng. 2006, 129, 160–170. [Google Scholar] [CrossRef]
- Mathiesen, V.; Solberg, T.; Arastoopour, H.; Hjertager, B.H. Experimental and computational study of multiphase gas/particle flow in a CFB riser. Aiche J. 1999, 45, 2503–2518. [Google Scholar] [CrossRef]
- Roussel, N.; Geiker, M.R.; Dufour, F.; Thrane, L.N.; Szabo, P. Computational modeling of concrete flow: General overview. Cem. Concr. Res. 2007, 37, 1298–1307. [Google Scholar] [CrossRef]
- Baldelli, A.; Esmeryan, K.D.; Popovicheva, O. Turning a negative into a positive: Trends, guidelines and challenges of developing multifunctional non-wettable coatings based on industrial soot wastes. Fuel J. Fuel Sci. 2021, 301, 121068. [Google Scholar] [CrossRef]
- Yousefian, P.; Pimputkar, S. Computational fluid dynamics modeling of a new high-pressure chemical vapor deposition reactor design. J. Cryst. Growth 2021, 566–567, 126155. [Google Scholar] [CrossRef]
- Gao, G.; Zhang, X.; Xu, M.; Han, Y.; Ao, J.; Cai, Y.; Wang, J. Structural Optimized Design of a Powder Mixer for Multi-Material Directed Energy Deposition Based on CFD-DPM. Coatings 2023, 13, 773. [Google Scholar] [CrossRef]
- Wei, L.; Gu, Y.; Wang, Y.; Lu, Y. Multi-fluid Eulerian simulation of fluidization characteristics of mildly-cohesive particles: Cohesive parameter determination and granular flow kinetic model evaluation. Powder Technol. 2020, 364, 264–275. [Google Scholar] [CrossRef]
- Rusche, H. Computational Fluid Dynamics of Dispersed Two-Phase Flows at High Phase Fractions. Ph.D. Thesis, Imperial College London (University of London), London, UK, 2003. [Google Scholar]
- Lun, C.K.K.; Savage, S.B.; Jeffrey, D.J.; Chepurniy, N. Kinetic theories for granular flow: Inelastic particles in Couette flow and slightly inelastic particles in a general flowfield. J. Fluid Mech. 1984, 140, 223–256. [Google Scholar] [CrossRef]
- Gidaspow, D.; Bezburuah, R.; Ding, J. Hydrodynamics of Circulating Fluidized Beds: Kinetic Theory Approach; Department of Chemical Engineering, Illinois Institute of Technology: Chicago, IL, USA, 1991. [Google Scholar]
- Gidaspow, D. 2—ONE-DIMENSIONAL STEADY GAS–SOLID FLOW. In Multiphase Flow and Fluidization; Gidaspow, D., Ed.; Academic Press: San Diego, CA, USA, 1994; pp. 31–60. [Google Scholar]
- Wei, L.; Lu, Y. Numerical investigation of binary particle mixing in gas-solid fluidized bed with a bubble-based drag EMMS model. Adv. Powder Technol. 2020, 31, 1529–1542. [Google Scholar] [CrossRef]
- Li, T.; Pougatch, K.; Salcudean, M.; Grecov, D. Mixing of secondary gas injection in a bubbling fluidized bed. Chem. Eng. Res. Des. 2009, 87, 1451–1465. [Google Scholar] [CrossRef]
- Hu, X. Simulation Research on the Combustion of Re-turned Gas in the Low-Temperature Distillation Furnace. Master’s Thesis, Xi’an University of Architecture and Technology, Xi’an, China, 2012. [Google Scholar]
- Wu, C.; Zhuo, Y.; Xu, X.; Farajzadeh, E.; Dou, J.; Yu, J.; Shen, Y.; Zhang, Z. A combined experimental and numerical study of coal briquettes pyrolysis using recycled gas in an industrial scale pyrolyser. Powder Technol. 2022, 404, 117477. [Google Scholar] [CrossRef]
- Yin, R.; Liu, R.; Wu, J.; Wu, X.; Sun, C.; Wu, C. Influence of particle size on performance of a pilot-scale fixed-bed gasification system. Bioresour. Technol. 2012, 119, 15–21. [Google Scholar] [CrossRef]
- Patel, V.R.; Upadhyay, D.S.; Patel, R.N. Gasification of lignite in a fixed bed reactor: Influence of particle size on performance of downdraft gasifier. Energy 2014, 78, 323–332. [Google Scholar] [CrossRef]
- Martínez, L.V.; Rubiano, J.E.; Figueredo, M.; Gómez, M.F. Experimental study on the performance of gasification of corncobs in a downdraft fixed bed gasifier at various conditions. Renew. Energy 2020, 148, 1216–1226. [Google Scholar] [CrossRef]
- Mi, W. Study on Temperature Field and Pressure Field of SJ Low-temperature Drying Furnace. Master’s Thesis, Northwest University, Kirkland, WA, USA, 2018. [Google Scholar]
- Wei, L.; Lu, Y.; Wei, J. Hydrogen production by supercritical water gasification of biomass: Particle and residence time distribution in fluidized bed reactor. Int. J. Hydrog. Energy 2013, 38, 13117–13124. [Google Scholar] [CrossRef]
- Rau, G.C.; Andersen, M.S.; McCallum, A.M.; Roshan, H.; Acworth, R.I. Heat as a tracer to quantify water flow in near-surface sediments. Earth-Sci. Rev. 2014, 129, 40–58. [Google Scholar] [CrossRef]
- Shaanxi Coal and Chemical Industry Group Co., Ltd.; Beijing Guodian Futong Technology Development Co., Ltd. Industrial Technology (SM-GF) of Coal Gas Heat Carrier Segment Multilayer Low Rank Coal Pyrolysis. Shaanxi Coal and Chemical Industry Group Co., Ltd.: Xi’an, China, 2018. [Google Scholar]
- Zhang, X.-H.; Qin, F.-F.; Miao, W.-H.; Wu, P.; Chen, Z.-G. Experimental study on bed resistance of moving bed in pyrolysis of coal. Chem. Eng. 2018, 46, 35–39. [Google Scholar]
Figure 1.
Process flowsheet of vertical oven technology.

Figure 2.
Structure and mesh of vertical oven with labeled layers in simulation.

Figure 3.
Measured wall temperature distribution with increasing gas velocity under three-feeding method ( = 4 mm).
Figure 3.
Measured wall temperature distribution with increasing gas velocity under three-feeding method ( = 4 mm).

Figure 4.
The flow field behind the temperate map for two orifice layers, ( = 4 mm, and = 0.24 ).

Figure 5.
Effect of gas injection layers on gas velocity in central cross section (t = 20 s, = 30 mm, and = 4.2 ).
Figure 5.
Effect of gas injection layers on gas velocity in central cross section (t = 20 s, = 30 mm, and = 4.2 ).

Figure 6.
Effect of injection layers on gas velocity in Y direction.

Figure 7.
Influence of gas injection layers on solid fraction standard deviation and gas velocity mixing entropy distribution with = 30 mm and = 4.2 .
Figure 7.
Influence of gas injection layers on solid fraction standard deviation and gas velocity mixing entropy distribution with = 30 mm and = 4.2 .

Figure 8.
Effect of coal diameter on gas distribution in upper zone for two injection layers with = 0.24 and = 4.2 .
Figure 8.
Effect of coal diameter on gas distribution in upper zone for two injection layers with = 0.24 and = 4.2 .

Figure 9.
Variation of gas velocity in Y direction with bed height under effect of gas feeding rate.
Figure 9.
Variation of gas velocity in Y direction with bed height under effect of gas feeding rate.

Figure 10.
Effect of gas feeding rate on gas distribution in upper zone for two injection layers: = 30 mm and = 4.2 .
Figure 10.
Effect of gas feeding rate on gas distribution in upper zone for two injection layers: = 30 mm and = 4.2 .

Figure 11.
Effect of gas feeding angle on gas distribution near gas orifice inlet and umbrella outlet with t = 20 s, = 30 mm, = 0.24 , and = 4.2 .
Figure 11.
Effect of gas feeding angle on gas distribution near gas orifice inlet and umbrella outlet with t = 20 s, = 30 mm, = 0.24 , and = 4.2 .

Figure 12.
Variation of gas velocity in Y direction with bed height under effect of gas feeding angle with = 30 mm, = 0.24 , and = 4.2 .
Figure 12.
Variation of gas velocity in Y direction with bed height under effect of gas feeding angle with = 30 mm, = 0.24 , and = 4.2 .

Figure 13.
Effect of gas feeding angle on coal solid fraction standard deviation and gas velocity mixing entropy with = 30 mm, = 0.24 , and = 4.2 .
Figure 13.
Effect of gas feeding angle on coal solid fraction standard deviation and gas velocity mixing entropy with = 30 mm, = 0.24 , and = 4.2 .

Figure 14.
Vertical-oven experimental setup with multi-injection structure: (a) experimental procedure and measuring points, (b) experiential section, and (c) particle diameter distribution.
Figure 14.
Vertical-oven experimental setup with multi-injection structure: (a) experimental procedure and measuring points, (b) experiential section, and (c) particle diameter distribution.

Figure 15.
Comparison of pressure drops obtained by simulations, experiments, and empirical correlations for two orifice layers: (a) effect of bed height, (b) effect of gas velocity ( = 4 mm).
Figure 15.
Comparison of pressure drops obtained by simulations, experiments, and empirical correlations for two orifice layers: (a) effect of bed height, (b) effect of gas velocity ( = 4 mm).


Table 1.
Technical parameters of vertical oven.
| Items | Unit | Value |
|---|---|---|
| Oven size (length × width × height) | mm | 15,580 mm × 3600 mm × 8200 mm |
| Oven combustion chamber number | / | 14 |
| Oven section area | m2 | 56.088 m2 |
| Amount of raw coal treated | t/a | 30 × 104 |
| Coal diameter | mm | 0–30 |
| Residence time | h | 9~11 |
| Oven air feeding volume | m3/t | 330 |
| Oven coal gas feeding volume | m3/t | 550 |
| Pyrolysis temperature | °C | 600~750 |
| Raw gas outlet temperature | °C | 60~80 |
| Blue-coke outlet temperature | °C | <90 |
| Raw gas outlet pressure | pa | −100~150 |
| Furnace pressure in middle position | pa | 1200~1800 |
| Tar yield | wt% | 6.5 |
Table 2.
Grid independence test.
| Number of Grids | Solid Volume Fraction Mixing Entropy |
|---|---|
| 515,000 | 0.15723 |
| 825,000 | 0.15766 |
| 1,425,000 | 0.15794 |
| 2,193,000 | 0.15793 |
| 3,046,000 | 0.15802 |
Table 3.
Characteristic line along the vertical oven.
| Central Line | Distance from the Bottom H (m) |
|---|---|
| R1 | 0.75 |
| R2 | 0.89 |
| R3 | 1.02 |
| R4 | 1.09 |
| R5 | 1.54 |
| R6 | 1.94 |
Disclaimer/Publisher’s Note: The statements, opinions and data contained in all publications are solely those of the individual author(s) and contributor(s) and not of MDPI and/or the editor(s). MDPI and/or the editor(s) disclaim responsibility for any injury to people or property resulting from any ideas, methods, instructions or products referred to in the content. |
© 2023 by the authors. Licensee MDPI, Basel, Switzerland. This article is an open access article distributed under the terms and conditions of the Creative Commons Attribution (CC BY) license (https://creativecommons.org/licenses/by/4.0/).
Share and Cite
MDPI and ACS Style
Zhou, Q.; Yang, Z.; Zheng, C.; Wei, L.; Li, D.; Fan, X. Effect of the Injection Structure on Gas Velocity Distribution in a 3D Vertical Oven. Coatings 2023, 13, 1707. https://0-doi-org.brum.beds.ac.uk/10.3390/coatings13101707
AMA Style
Zhou Q, Yang Z, Zheng C, Wei L, Li D, Fan X. Effect of the Injection Structure on Gas Velocity Distribution in a 3D Vertical Oven. Coatings. 2023; 13(10):1707. https://0-doi-org.brum.beds.ac.uk/10.3390/coatings13101707
Chicago/Turabian StyleZhou, Qiucheng, Zhanyu Yang, Changsong Zheng, Liping Wei, Dong Li, and Xiaoyong Fan. 2023. "Effect of the Injection Structure on Gas Velocity Distribution in a 3D Vertical Oven" Coatings 13, no. 10: 1707. https://0-doi-org.brum.beds.ac.uk/10.3390/coatings13101707
Note that from the first issue of 2016, this journal uses article numbers instead of page numbers. See further details here.