
The Effect of CO2 Laser Engraving on the Surface Structure and Properties of Spruce Wood


Faculty of Wood Sciences and Technology, Technical University in Zvolen, T.G. Masaryka 24, 960 01 Zvolen, Slovakia
*
Author to whom correspondence should be addressed.
Coatings 2023, 13(12), 2006; https://0-doi-org.brum.beds.ac.uk/10.3390/coatings13122006
Submission received: 2 November 2023
/
Revised: 16 November 2023
/
Accepted: 24 November 2023
/
Published: 26 November 2023
(This article belongs to the Special Issue Advances in Surface Modification and Coatings of Wood and Wood Composites)
Abstract
:This work appraises the influence of CO2 laser irradiation on mass loss, morphology, chemical changes and discolouration of spruce wood surfaces. The amount of energy applied to the surface was expressed as the total irradiation dose, which was demonstrated to have a strong impact on increasing wood weight loss. Along with increasing mass loss, surface roughness also increased, resulting from the differences in density between the early wood and late wood. The evaluated roughness parameters increased linearly with increasing irradiation dose and mass loss. At the maximum irradiation dose, the Ra parameter value parallel to the fibre direction showed a 6-fold increase; perpendicular to the grain, the increase was as much as 33.5-fold. Similar differences were also observed for the parameter Rz. At the lowest laser power and the lowest raster density, the engraved spruce wood surface exhibited some evidence of discolouration (ΔE* ≅ 9). An additional increase in the amount of supplied energy clearly resulted in a novel surface colour compared to the original (ΔE* = 12). The chemical analysis of the wood surface revealed that the discolouration was mainly caused by heat-induced cleavage of C=O groups in the lignin and hemicellulose structures. Part of these structures (so-called chromophores) are responsible for the natural colour of the wood as well as for colour changes caused by engraving. The detected dependences of the wood mass loss and colour values on the total radiation dose are the basis for achieving targeted modifications of spruce wood surfaces using a laser beam.
Keywords:
CO2 laser; spruce wood; engraving; raster density; laser power; morphology; roughness; FTIR analysis; colour1. Introduction
Wood surface treatment with CO2 laser is, aside from cutting, increasingly used to attain proposed changes in wood surface properties, especially those concerning morphology and colour. The energy of the laser beam absorbed in the surface structures of the wood is converted into heat, thus inducing sublimation of the thin surface layer of the contact area between the laser beam and the wood surface. After this treatment, structural changes occur on the surface of the wood, accompanied by melting and formation of a carbonised layer. This is reflected in altered wood surface morphology, discolouration and changes in other surface properties [1,2,3,4,5,6,7,8,9,10].
The wood mass loss affects its surface geometry. However, variable results are reported by different authors. Several works [2,3,8,11] show that laser irradiation of wood can result in a reduction in surface roughness, due to melting cells down to a depth of several micrometres. In this way, ablation of the wood surface fibres released by the precedent machining can lessen roughness. On the other hand, the engraving of wood surface with a laser may exert the opposite effect, i.e., increased roughness [7,8,12,13,14]. The roughness is mainly attributable to non-uniform wood mass degradation within an annual ring due to differences in density between early wood and late wood [8]. The roughness is notably affected by the fibre angle under which the wood surface is treated [15]. The published results confirm that, via appropriate adjustment of the CO2 laser engraving parameters, targeted changes in the wood surface morphology can be ensured [8,13,14].
The results obtained by applying Fourier transform infrared spectroscopy (FTIR), X-ray photoelectron spectroscopy (XPS) and gas chromatography (GC) imply that the energy absorbed by the wood surface during CO2 laser irradiation causes chemical alterations in the main wood components. Proportionate to the energy amount applied, there are reduced polysaccharide amounts as a result of degradation of hemicelluloses and a certain part of the amorphous cellulose fraction [16]. Changes in the lignin structure and an increase in non-polar C–C and C–H bonds were also observed. These chemical changes are also dependent on the wood species [1,2,3,4,8,17].
The changes in morphology and chemical structure associated with wood treatment with a CO2 laser initiate surface discolouration—manifested as darkening [4,7,8,18,19,20,21]. The degree of darkening of the engraved surfaces is dependent on the amount of energy applied, the manner of its application and the width of the engraved track formed by the laser beam passing across the wood surface [8,20,22]. A single laser beam path, aside from track discolouration, causes the removal of a narrow strip of the surface layer. At higher raster density (number of paths per one millimetre of width), the mass loss is more evident at spots where the paths overlap. There is also more apparent discolouration [6,8,23,24,25].
The extent of changes in surface structures of engraved wood are also dependent on the degree and method of energy supply. This energy is possible to control via adjustment of the laser power, the movement speed of the laser head, focal distance and raster density [2,4,7,8,12,19,24,26]. Apart from the energy amount, the thickness of the sublimated layer and the changes in the engraved surface structure are dependent on the wood species, and also on structural heterogeneity occurring within a single species [1,2,3,7,8,11,27,28].
Recognising the impact of all the aforementioned factors is necessary, not only from the viewpoint of the proposed changes to the wood surface structure, but also with regard to the intended discolouration of the modified wood surface. The wood colour is a characteristic feature of the wood. The changes in the colour coordinate values, L*, a* and b*, are relatively easy to measure and, as such, they can serve as indicators of significant chemical changes—and changes in other wood properties—resulting from a specific surface treatment (IR radiation, UV radiation, thermal modification and similar) [29]. This is the main reason for the interest in this issue today [6,8,13,15,25,26,30,31,32,33].
To date, the intended colour modification of a particular wood species has mostly been achieved through practical experience. There, however, arises evidence that this could be approached by quantifying the relationship between the discolouration and the total energy amount delivered onto the wood surface. Fixing the specific laser parameters allows the determination of the total energy applied to the wood surface and its impact on discolouration [8]. As the colour spaces of the different wood species are practically disjunct, the first study phase is to recognise these relations for a particular wood species.
To achieve this goal, it is necessary to perform comprehensive studies on wood surface property modifications in individual wood species using identical methods. It has been shown that the amount of energy delivered onto the wood surface with a laser beam can be expressed through the irradiation dose, H (J·cm−2) [8]. Recognising the dependence of discolouration on the total irradiation dose provides a basis for proposed changes to the surface of individual wood species treated with a CO2 laser.
This work aimed to evaluate the influence of a CO2 laser on the structure, surface morphology, chemical changes and discolouration of spruce wood. The following investigations were conducted:
- −
- Determining the total irradiation dose under variable parameters of s CO2 laser (laser power and density) and this dose’s impact on the wood mass loss;
- −
- The influence of the treatment method on the morphology of the wood surface quantified through roughness parameters;
- −
- Changes in FTIR spectra and discolouration corresponding to various engraving parameters;
- −
- Determining the functional dependence of the colour coordinates on the total irradiation dose.
2. Materials and Methods
2.1. Experimental Materials and Irradiation Conditions
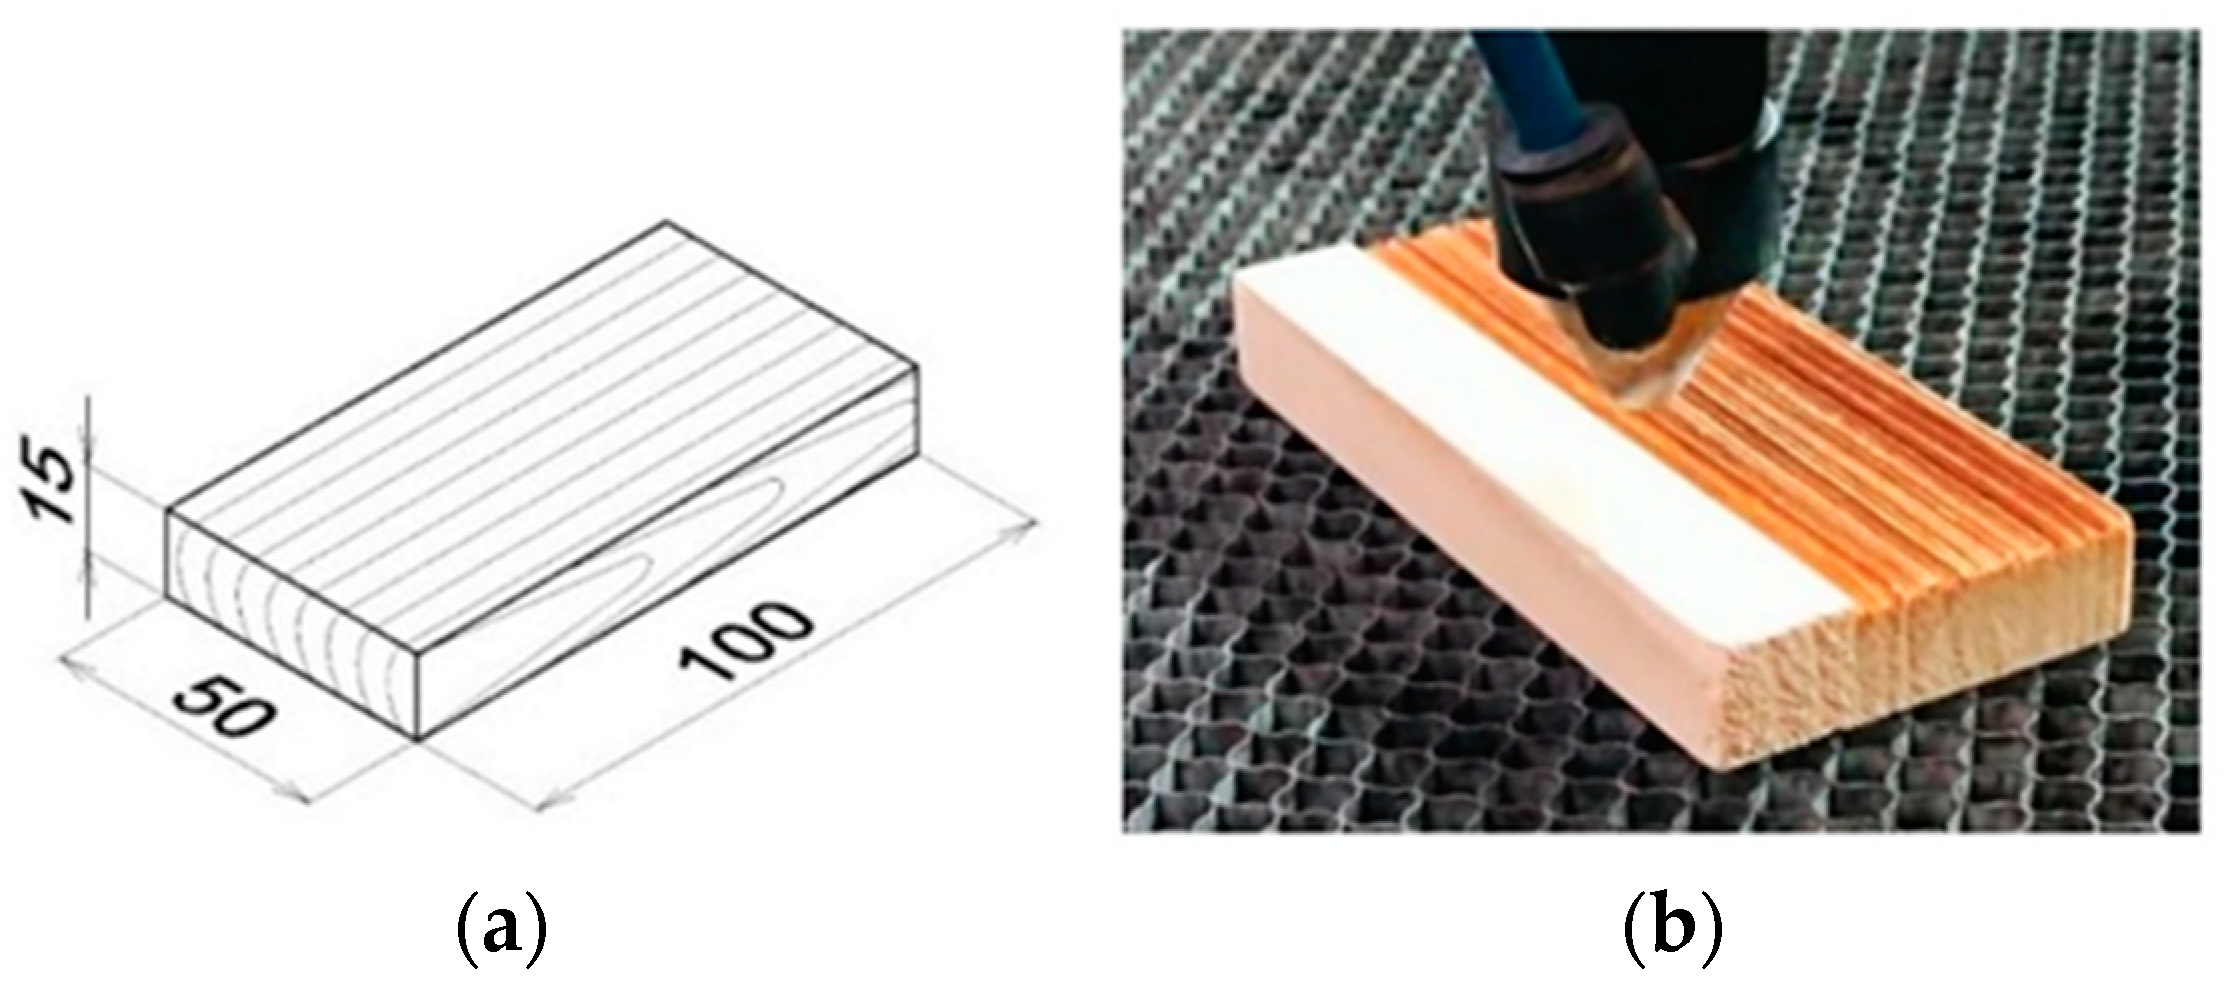
The samples were prepared from spruce stems by cutting logs at a height of approx. 1.3 m. The log length was 2 m, with the diameter ranging from 0.4 to 0.5 m. The logs were used for preparing radial timber which was gradually dried to 12% moisture content. From each log, one plank was selected with a 1000 mm × 80 mm × 20 mm size, which was used to prepare test samples with a radial surface of 100 × 50 mm2 (Figure 1). From each plank, two specimens were randomly selected and subsequently conditioned to 6% moisture content before sanding (P180 grit). The samples’ oven dry density ranged from 405 to 440 kg·m−3.
Engraving of samples followed previously described methods [8]. The samples were placed under the focus of the lens of the CO2 laser equipment (CM-1309, Shenzhen Reliable Laser Tech, Shenzhen, China). The samples´ distance from the lens was 17 mm. The laser head moved over the samples’ surface parallel to the grain. Moving speed of the laser head was 350 mm·s−1 (Figure 1), and maximum laser power was Pmax = 137.5 W (measured on the resonator output according to the method described in previous work [8]). The amount of radiation energy varied according to laser power and raster density. From each wood species, three sample sets were prepared and engraved at laser powers of 8, 12 and 16% (assigned based on the Pmax).
The following raster densities were used: 2, 5, 10, 20 and 30 mm−1, representing, for each wood species, 5 combinations each consisting of 4 samples (plus 4 non-engraved “reference” samples). The samples were irradiated along their entire length and width (Figure 1). The laser parameters were set based on our experience with previous measurements [34], as well as from information collected from the literary sources referenced in Section 1 (Introduction).
The amount of energy applied was expressed as the total irradiation dose, H, per unit area. The H value was, in accordance with the previous work [8], calculated using the following equation:
where Pe is the effective power of the laser beam on the sample surface, x is the sample length, n is the raster density, y is the width of the track incised by the laser beam by one path on the wood surface, v is the speed of the laser head movement and A is the area irradiated by one laser beam path. The track width was measured with the aid of a camera (Leica EC3, Leica Microsystems, Heerbrugg, Switzerland).
2.2. Evaluation of Weight Loss of Wood Mass
The wood mass loss resulting from CO2 laser engraving was evaluated on the samples prepared from each particular wood type. The samples were dried to constant weight at a temperature of 103 ± 2 °C. The dry samples were removed from the drying chamber and placed in an exicator containing silica gel. After cooling, the samples were weighed on a laboratory scale (Precisa 300A, Precisa Gravimetrics AG, Dieticon, Switzerland) with a precision of 0.001 g (mass m01). The prepared samples were engraved at specified laser powers and raster densities. After this process, the samples were weighed again (mass m02). Then, the equation
was used for calculating the weight loss of the wooden mass per unit area, A0.
2.3. Evaluation of Wood Surface Morphology
Wood surface morphology after laser treatment was evaluated from the viewpoints of anatomy and physics [34]. The roughness profiles were measured with a profilometer (Surfcom 130A, Carl Zeiss, Oberkochen, Germany) consisting of a measuring unit and an evaluation unit. The changes to the wood surface morphology induced by CO2 laser engraving were evaluated with respect to the following roughness parameters: Ra (mean arithmetic deviation) and Rz (the maximum peak height plus the maximum depression depth within the cut-off, or sampling length).
The roughness was measured on the irradiated radial surfaces, both parallel with and perpendicular to the grain course. This measurement process started by filtering off the waviness from the basic profile, and then the roughness curve was transferred onto the basic line. The entire transverse length consisted of the run-up segment, lr; five sampling length (cut-off) segments, λc; and the over-travel segment, lp. The basic lines were chosen from the interval 0.025 to 8 mm, based on the preliminary measurements of the roughness parameters, Ra and Rz. For studying the structure of the engraved oak wood surfaces, a light microscope (Leica MZ 9.5, Leica Microsystems, Heerbrugg, Switzerland), camera (Leica EC3) and a digital microscope (Keyence VHX 7000, Keyence International, Mechelen, Belgium) were used. Microscopic slides of the transverse cuts were prepared according to the methods described in a previously published work [7].
2.4. Evaluation of Colour
The colorimetric values L*, a* and b* on the reference and engraved surfaces were measured with a spectrophotometer (Spectro-Guide 45/0 gloss (BYK-GARDNER GmbH, Geretsried, Germany) [8]. The measurements were made at ten locations on each sample. The colour differences, ∆L*, ∆a* and ∆b*, and the total colour difference, ∆E*, were calculated according to the following equations:
where the subscript “1” represents the colour values in the reference sample (not engraved), and “2” indicates the values of the wood sample irradiated with the CO2 laser.
2.5. Detecting Chemical Changes after Engraving
Chemical changes were examined in samples irradiated at 8% and 16% laser power (Pe) and raster density (n) with values 10, 20 and 30 mm−1. For this purpose, FTIR analysis was used. FTIR spectra of the engraved surface of the samples were recorded on a Nicolet iS10 FTIR spectrometer (Thermo Fisher Scientific, Waltham, MA, USA), equipped with a Smart iTR diamond attenuated total reflectance (ATR) sampling accessory. The spectra were acquired by accumulating 64 scans in absorbance mode at a spectral resolution of 4 cm−1 over the range 4000 to 650 cm−1 with baseline correction. Each spectrum was obtained by applying a constant gauge pressure for intimate contact with the ATR crystal (internal reflection element). The diamond crystal was cleaned with ethanol between scans. The obtained data were analysed using OMNIC 9.0 software (Thermo Fisher Scientific, Waltham, MA, USA). Four replicate measurements were performed on the radial surface of each sample.
3. Results and Discussion
The interactions between the laser beam and wood surface were significantly influenced by all engraving process parameters, with important impacts on wood surface chemistry, morphology and colour alteration.
3.1. Total Irradiation Dose and Wood Mass Losses Corresponding to Different Irradiation Parameters
To avoid multifaceted evaluation of the impacts of all the tested laser parameters on the changes in structure and properties of the tested wood surface, all these parameters were replaced with a single variable—the total irradiation dose (H) determined according to Equation (1). The irradiation dose per unit surface area of the samples (at specified parameter values) were calculated according to the given equation and are summarised in Table 1. This shows that values of H ranged from 6.17 to 185.15 J∙cm−2.
Almost all energy concentrated in the laser beam and applied to the given spot on the spruce wood surface was converted to heat. Experimental measurements performed using a thermo-camera with an upper measuring limit of 1000 °C revealed that, at as low as 8% laser power (11 W), the temperature of the wood surface at the moment of impact of the laser beam was near to this limit. The high temperature concentrated within the laser beam of minuscule diameter induced instantaneous sublimation of the thin surface layer at the contact spot. A qualitatively similar phenomenon was also observed in the case of oak wood [8].
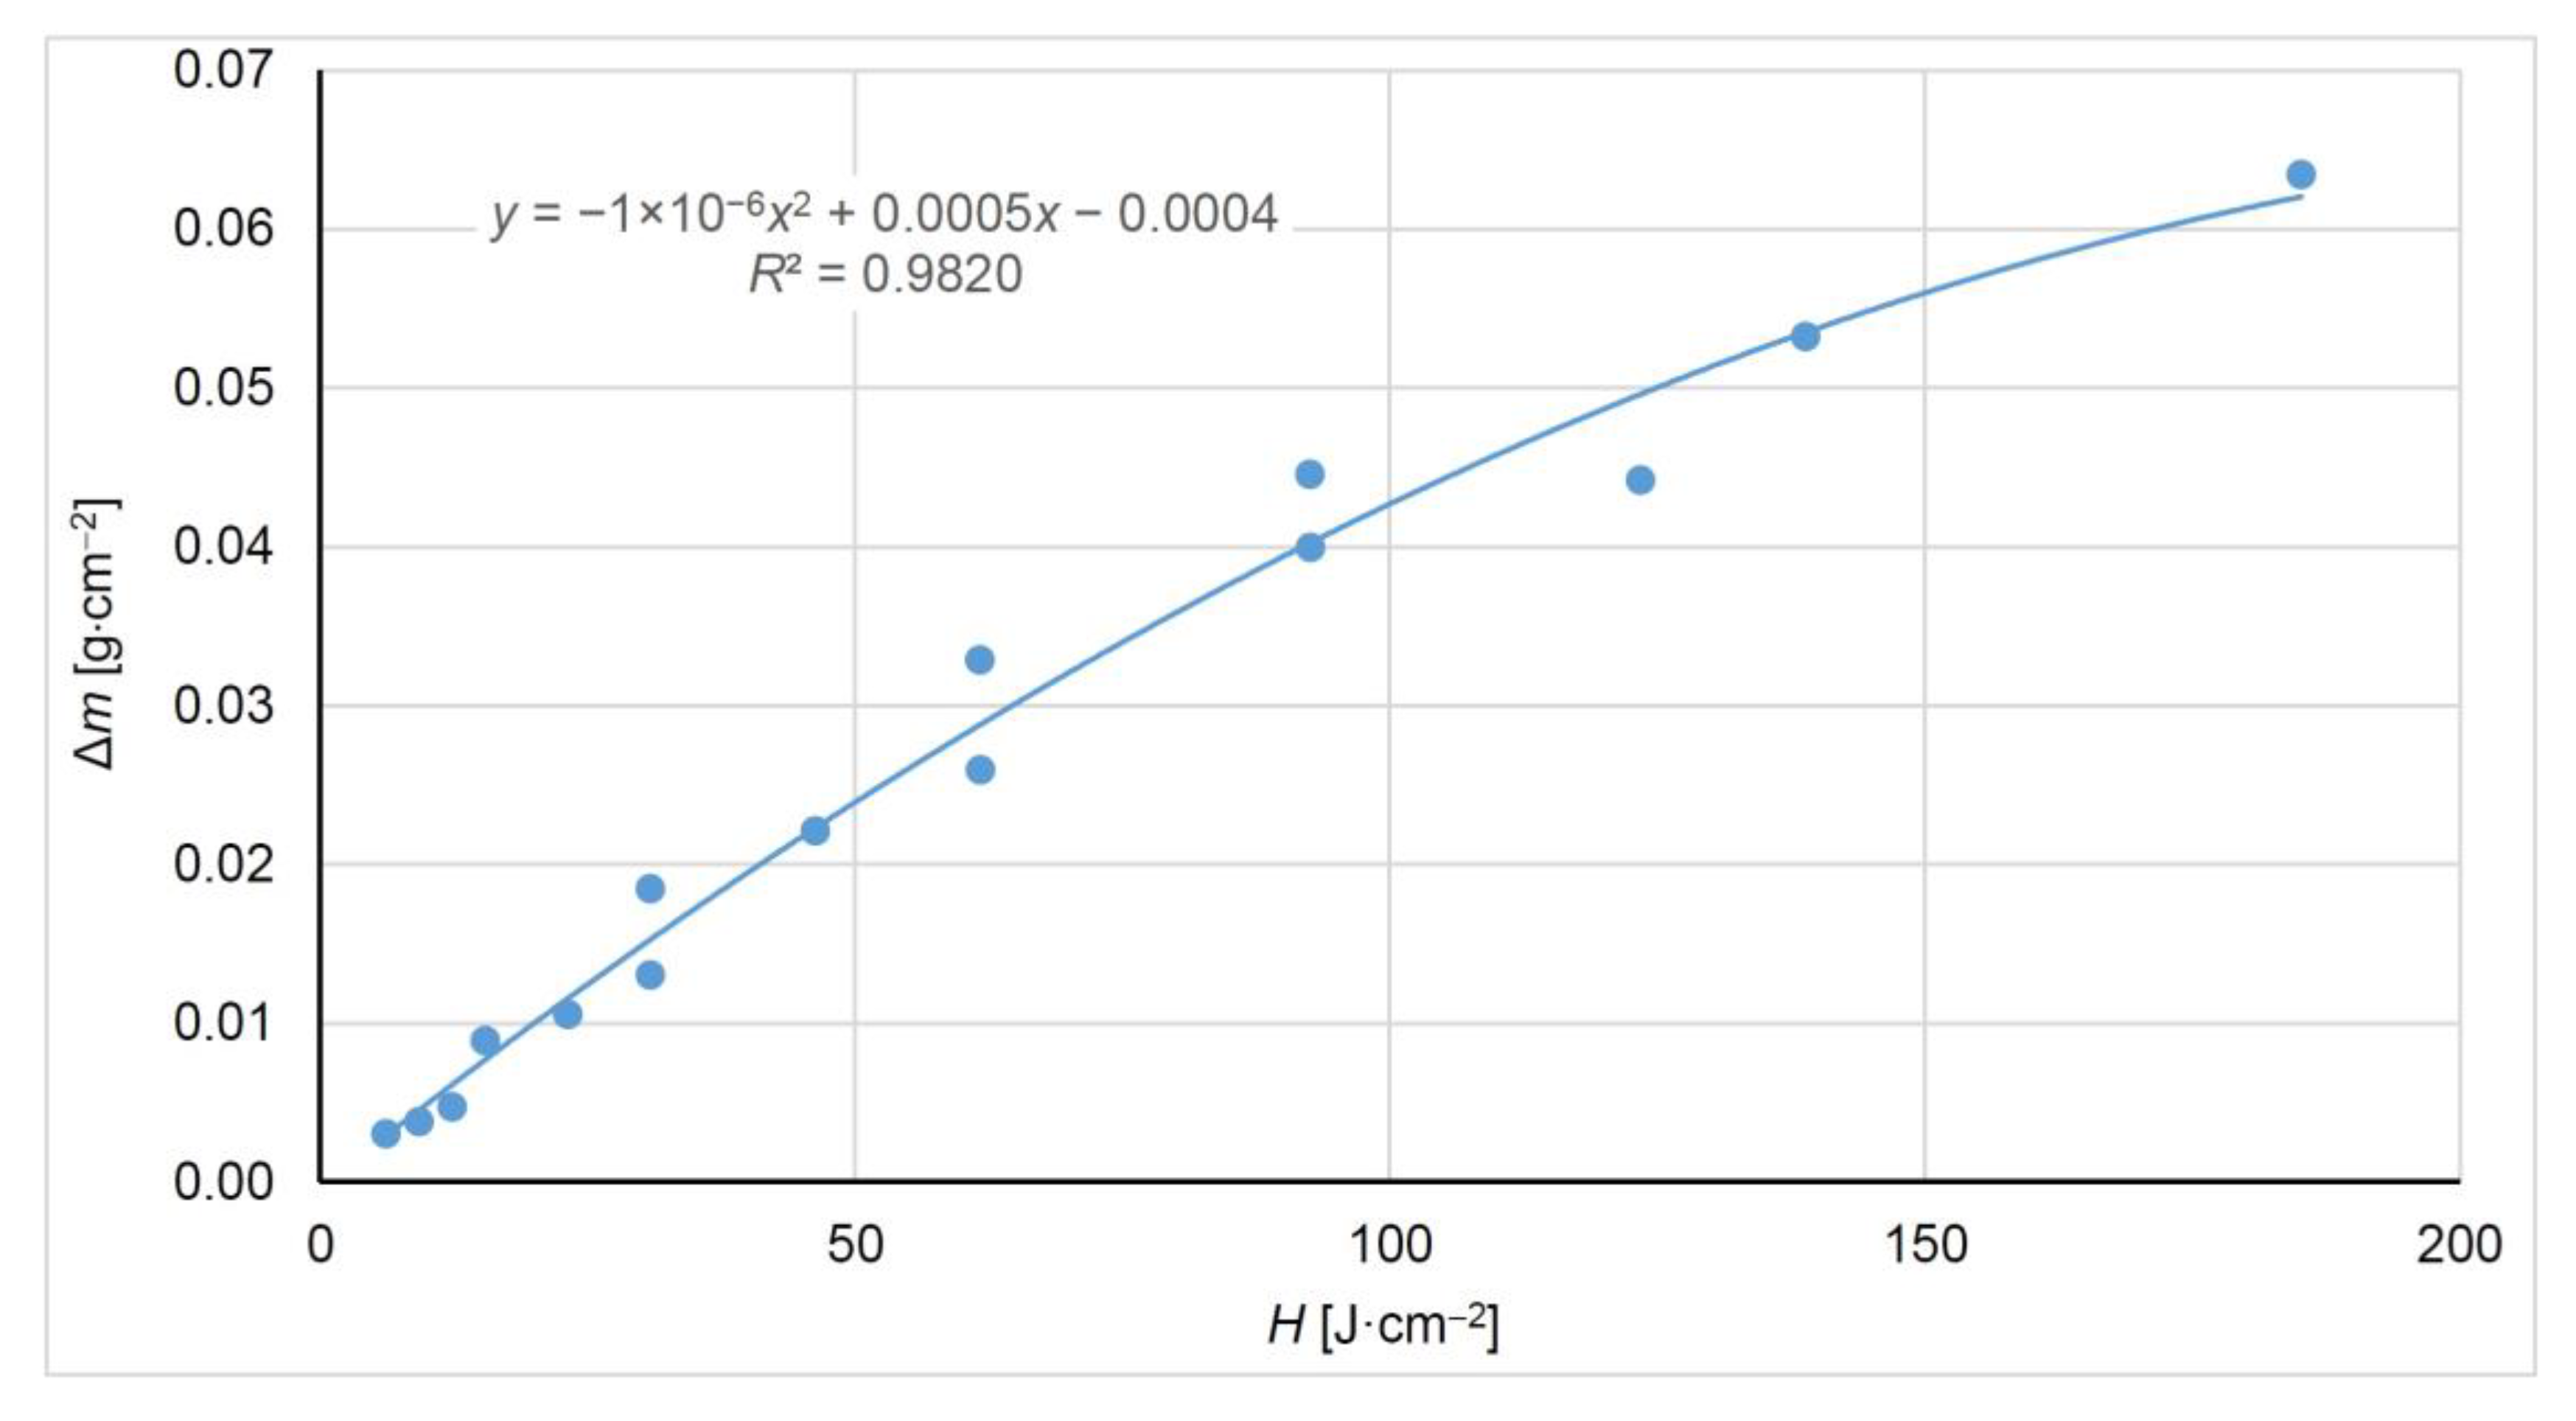
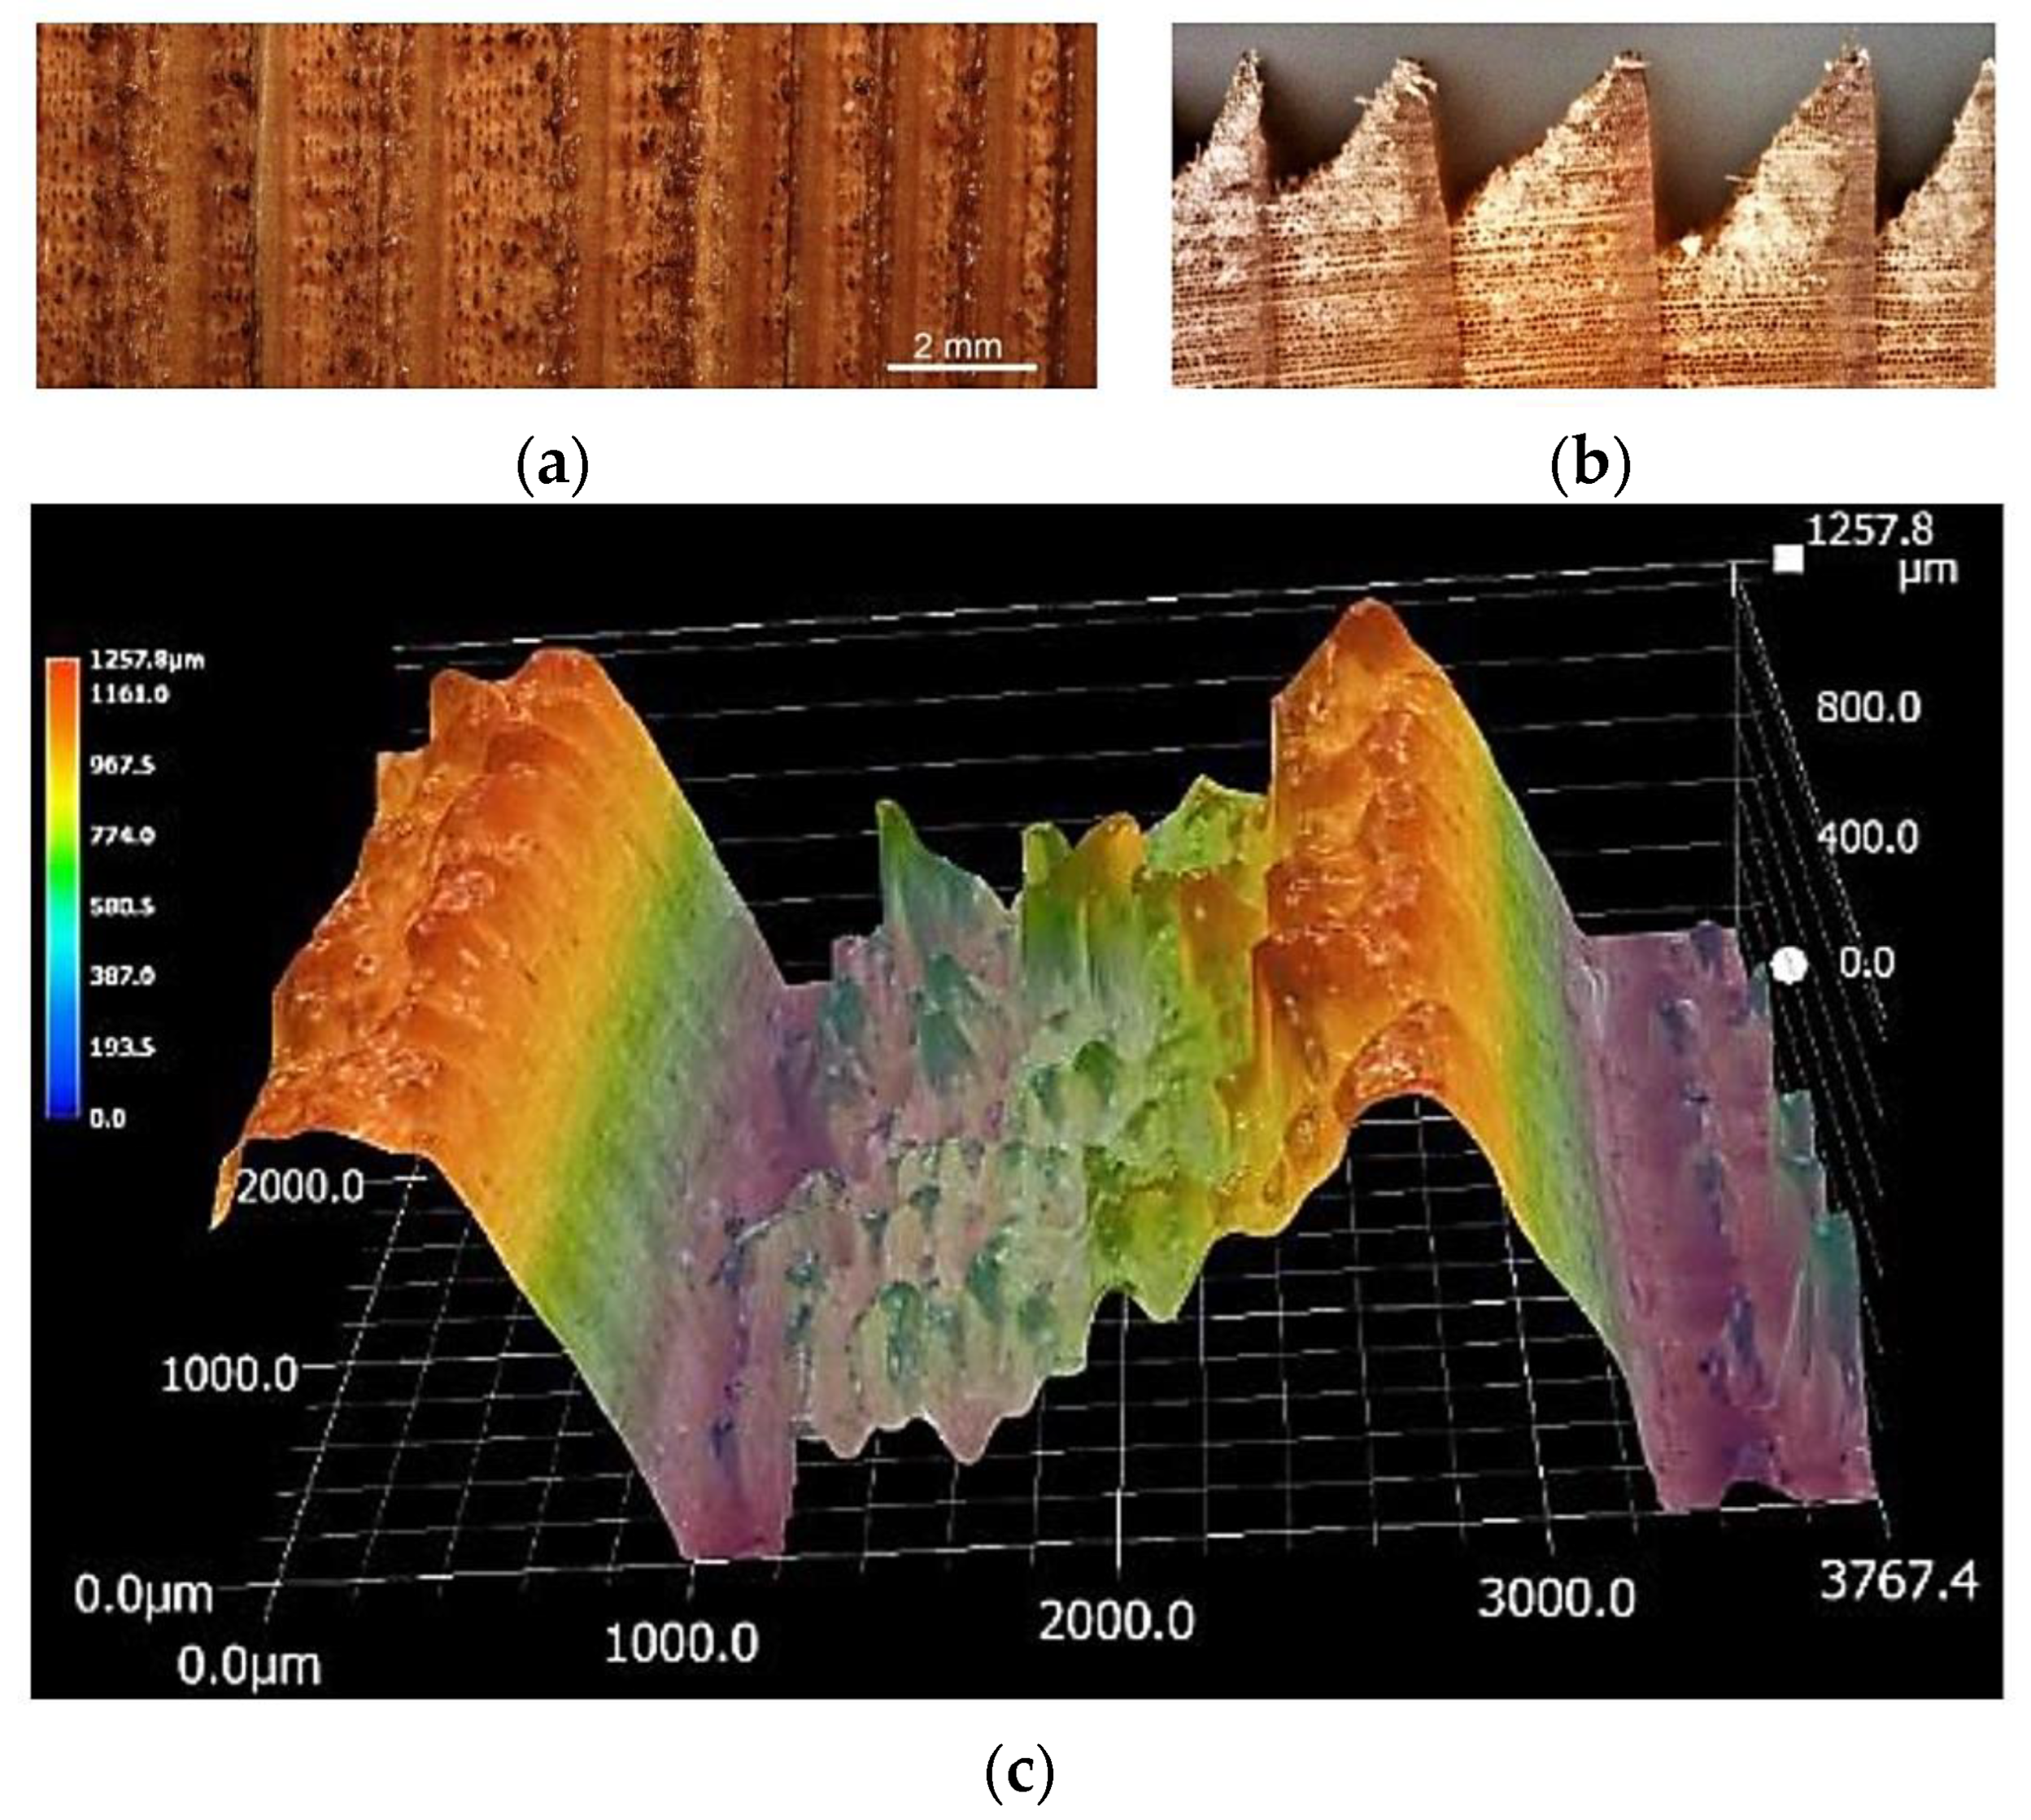
There has been a confirmed close dependence of the wood mass loss per unit area on the total irradiation dose supplied to this area (Figure 2). Due to the heterogeneous spruce wood structure, the wood mass loss corresponding to specific engraving conditions was variable across the wood surface. This fact was significantly reflected by the wood surface morphology (Figure 3).
Figure 3 shows trenches resulting from engraving the spruce wood radial surface. The trenches were parallel to the grain course and, thus, they enhanced the wood roughness mainly in the direction perpendicular to the grain course. With the raster width of 0.14 mm, consequently, beginning with a raster density of 10 mm−1, the trenches were overlapping. At the overlapping spots, the wood mass losses were higher and the original trenches more pronounced. These phenomena were accentuated in wood of lower density.
The most obvious variations in wood morphology were mainly observed within annual rings. In the case of spruce wood annual rings, there were distinct differences in density between early wood and late wood. The average density of early spruce wood is 300 kg·m−3, while that of late wood is 750 kg·m−3 [35]. The cited work shows that neither early nor late wood density depends on the cambial age. On the other hand, the cambial age influences the annual ring widths, and, in this way, also the proportions of the early and late wood in particular rings. With increasing cambial age, the annual rings become narrower due to the decreasing proportion of the early wood.
At the beginning of the growing season, there is an obvious boundary between the early wood and the late wood. In its proximity, the density of the early wood is the lowest, which was also reflected in the intensive wood mass erosion. With the advancing vegetation period, the early wood was gradually transformed to late wood, the wood density increased, and the wood mass destruction declined as a result (Figure 3c).
3.2. Roughness of Wood Surfaces Engraved with a CO2 Laser
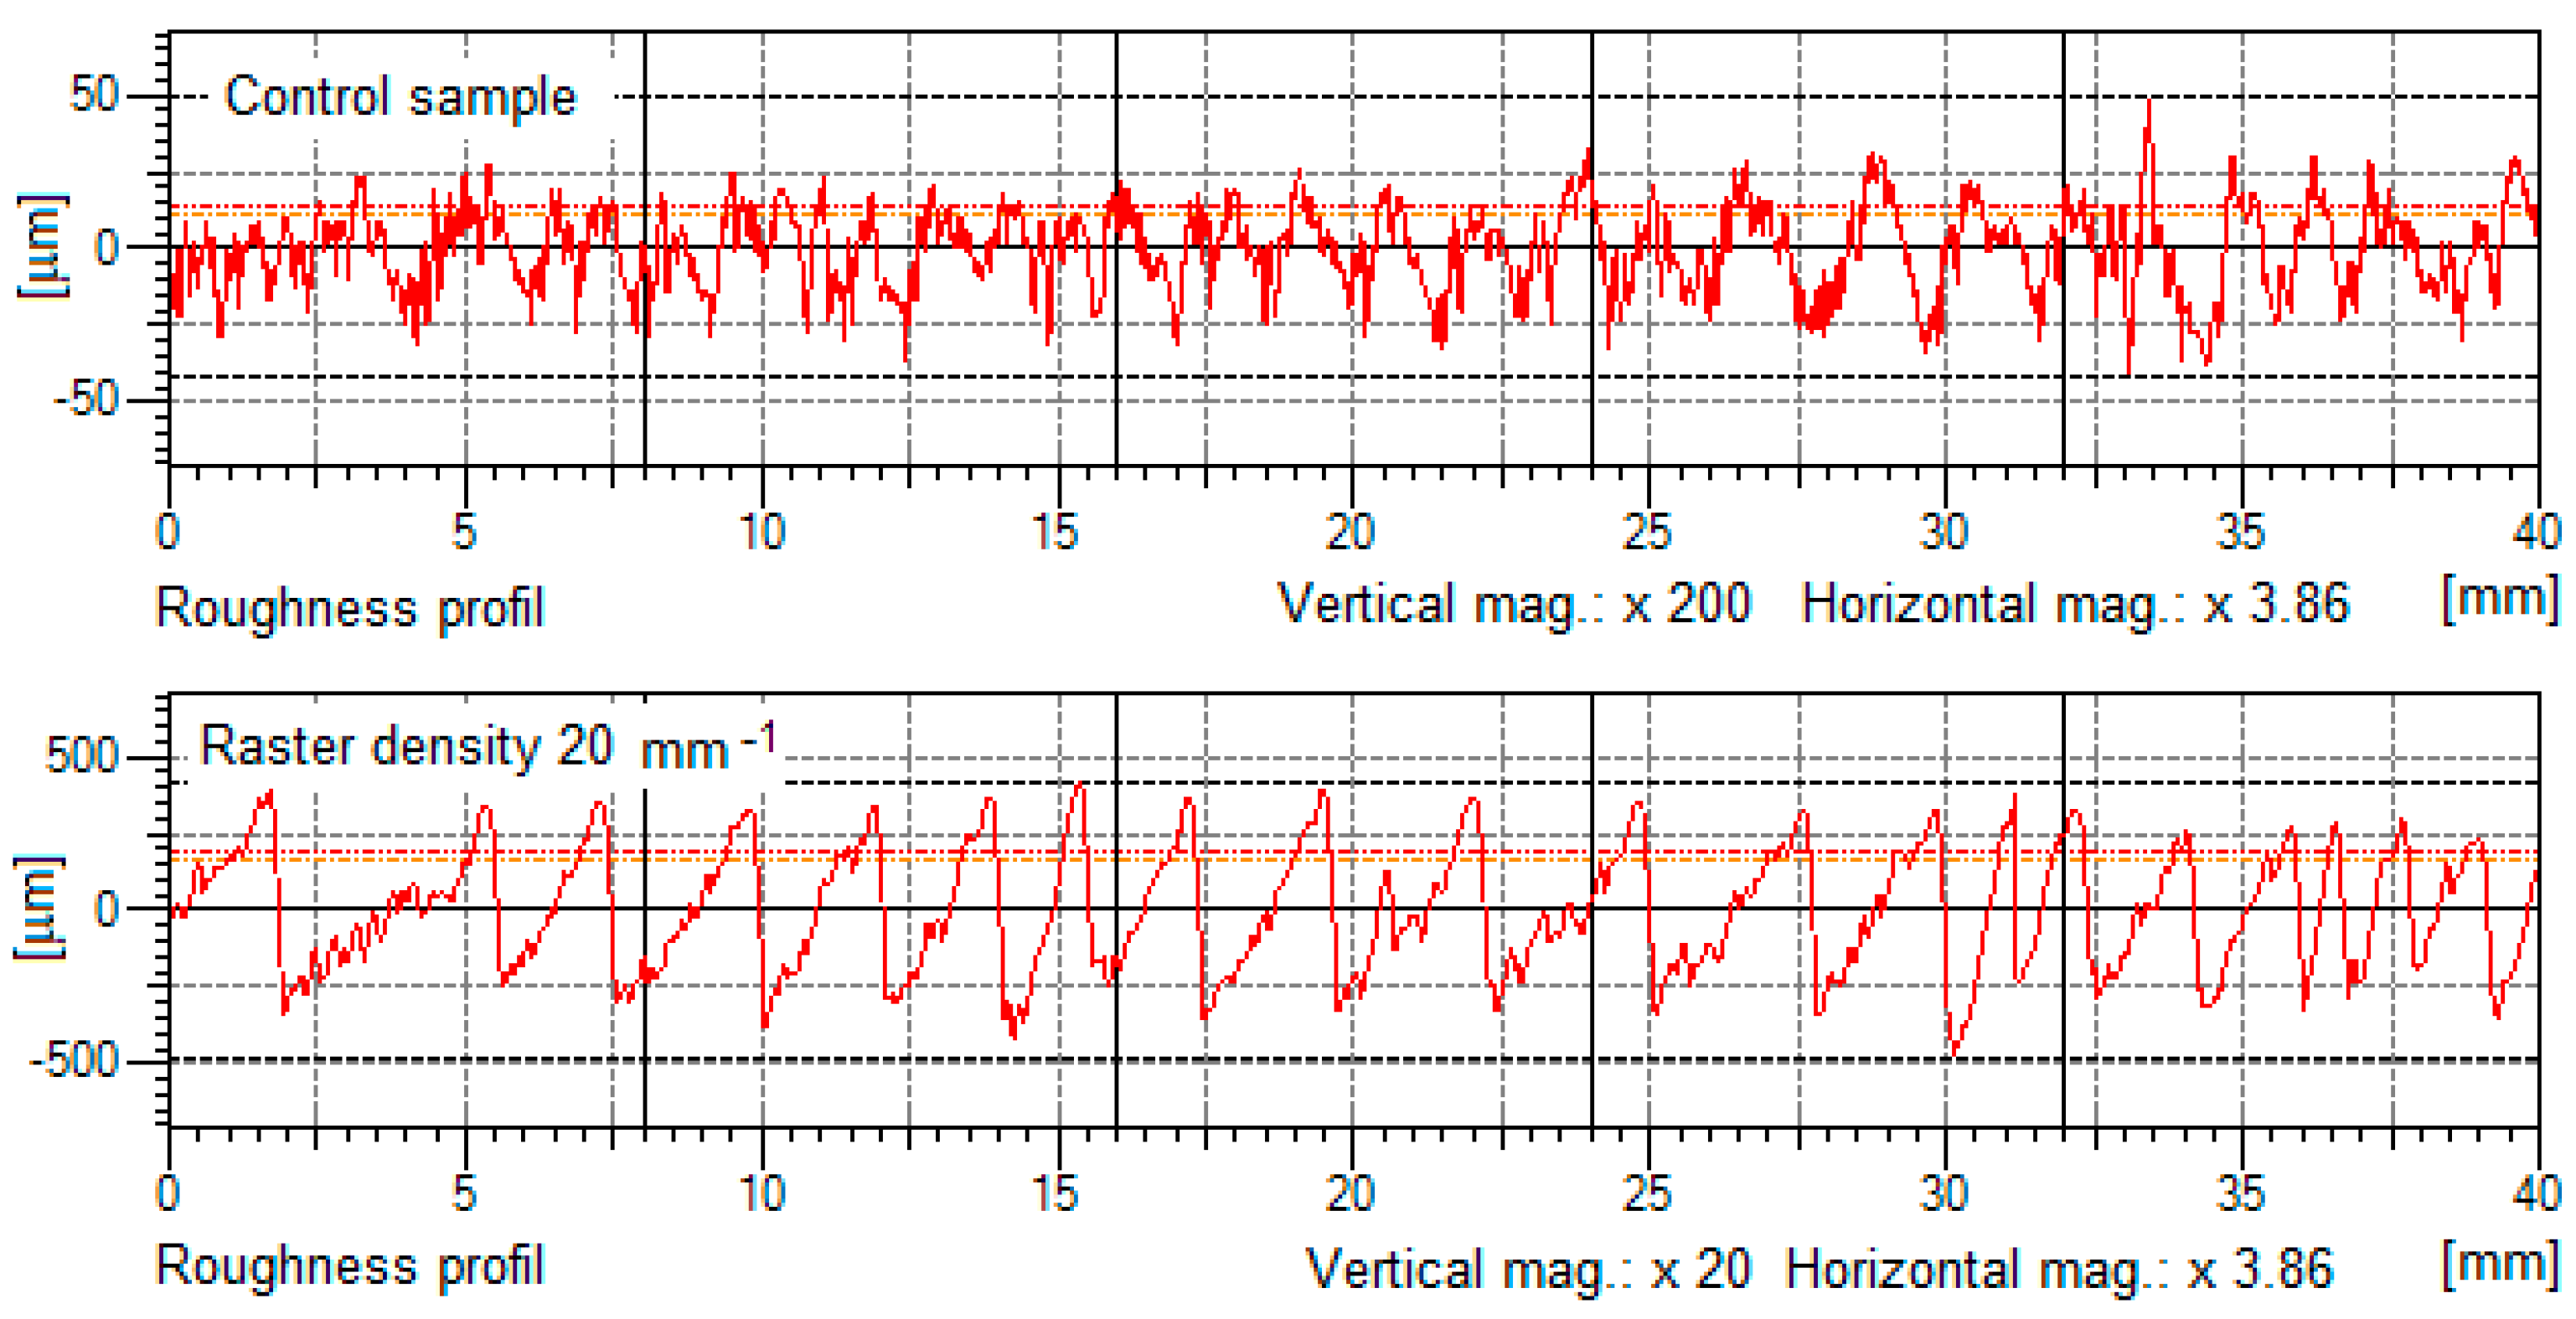
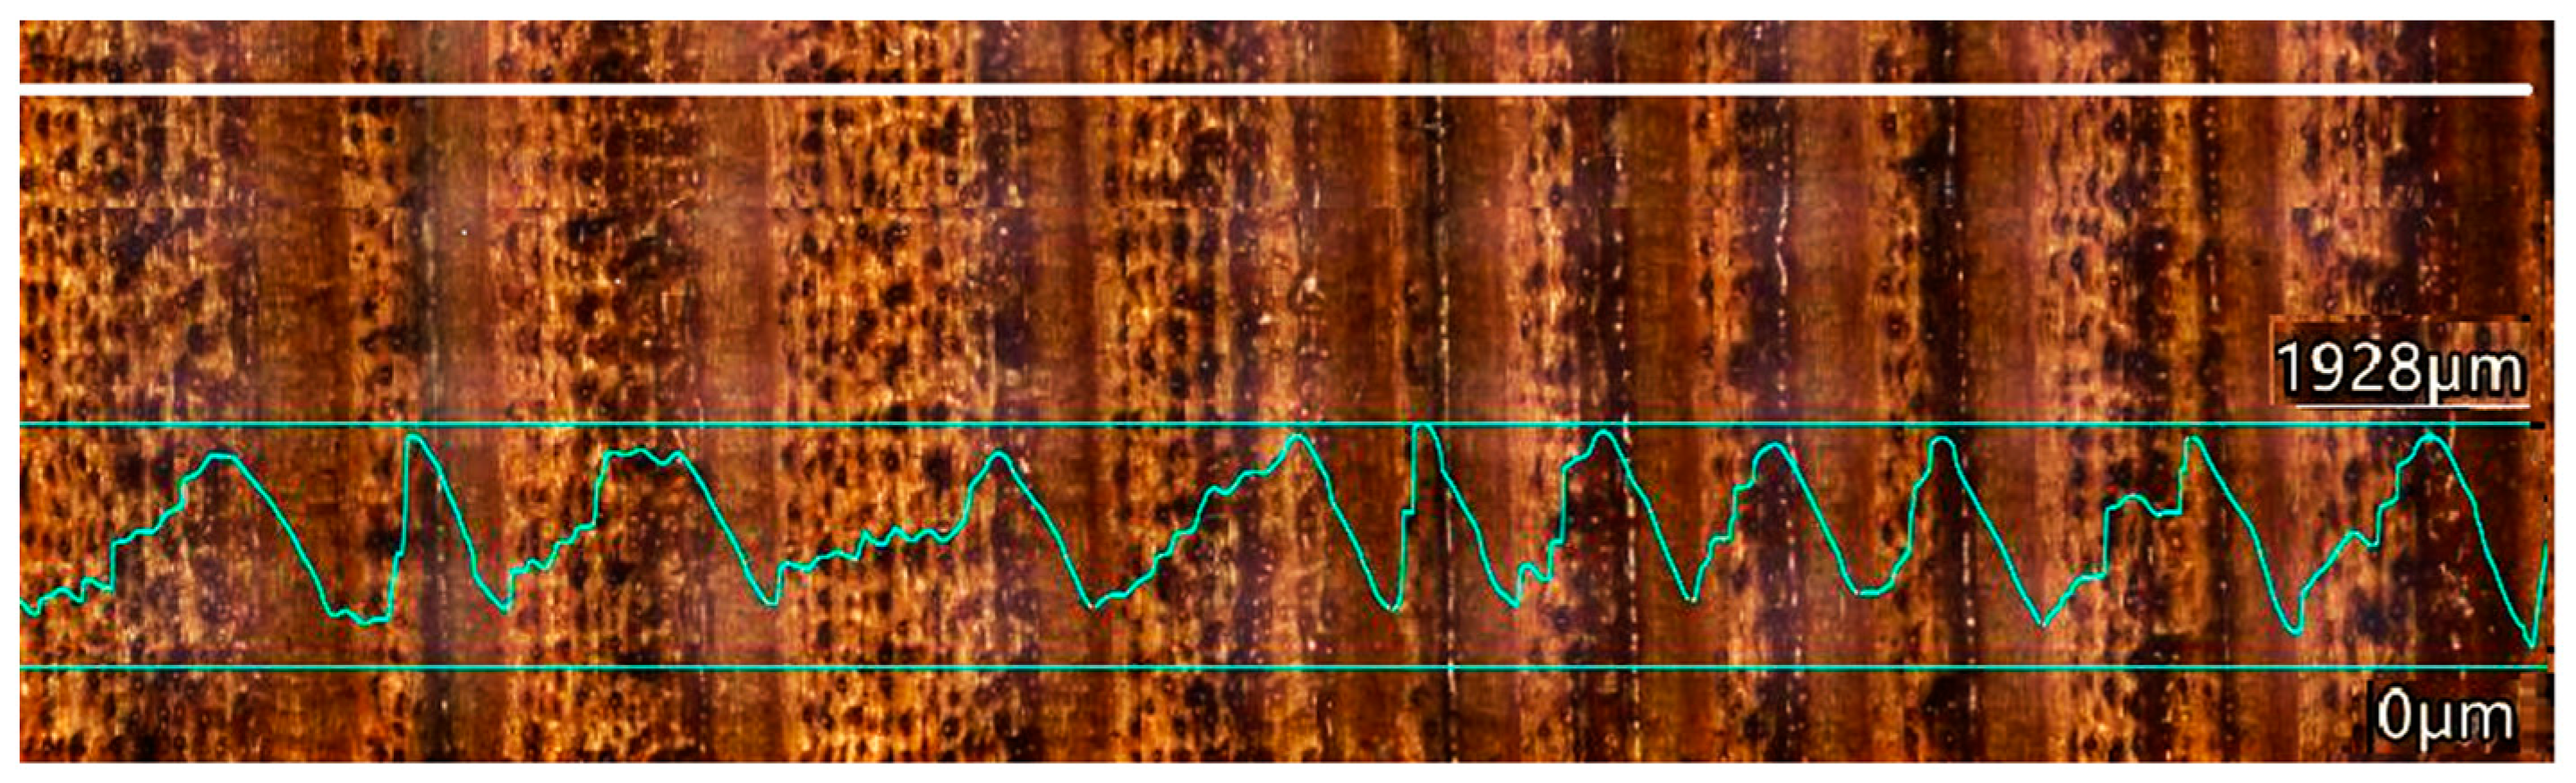
The surface morphology after laser engraving was evaluated on the experimentally measured roughness profiles parallel with and perpendicular to the grain course. Figure 4 illustrates roughness profiles measured using a mechanical profilometer perpendicular to the grain course before and after engraving with a CO2 laser performing at a laser power of 8% and a raster density of 20 mm−1. Figure 5 displays a roughness profile measured with an optical profilometer at a laser power of 16% and a raster density of 30 mm−1. All the measured roughness profiles were evaluated through the roughness parameters Ra and Rz. Figure 4 and Figure 5 show how the non-uniform wood mass erosion within the individual annual rings was reflected by (1) distinct deepening of trenches in the early wood and (2) distances between areas of profile unevenness.
Three-way variance analysis confirmed significant impacts for all the three evaluated factors (raster density, laser power and anatomical direction) and their interactions on the inspected roughness parameters. The basic statistical characteristics of the values of the parameters Ra and Rz for the given raster density range for all three laser power values and the two anatomical directions are presented in Table 2. Table 2 shows that the values of the roughness parameters Ra and Rz in the reference spruce wood samples exhibited the lowest roughness parameter values, both in the grain course and parallel to the grain. The reference roughness was distinctly higher perpendicular to the grain, following from the orientation of the main cell elements.
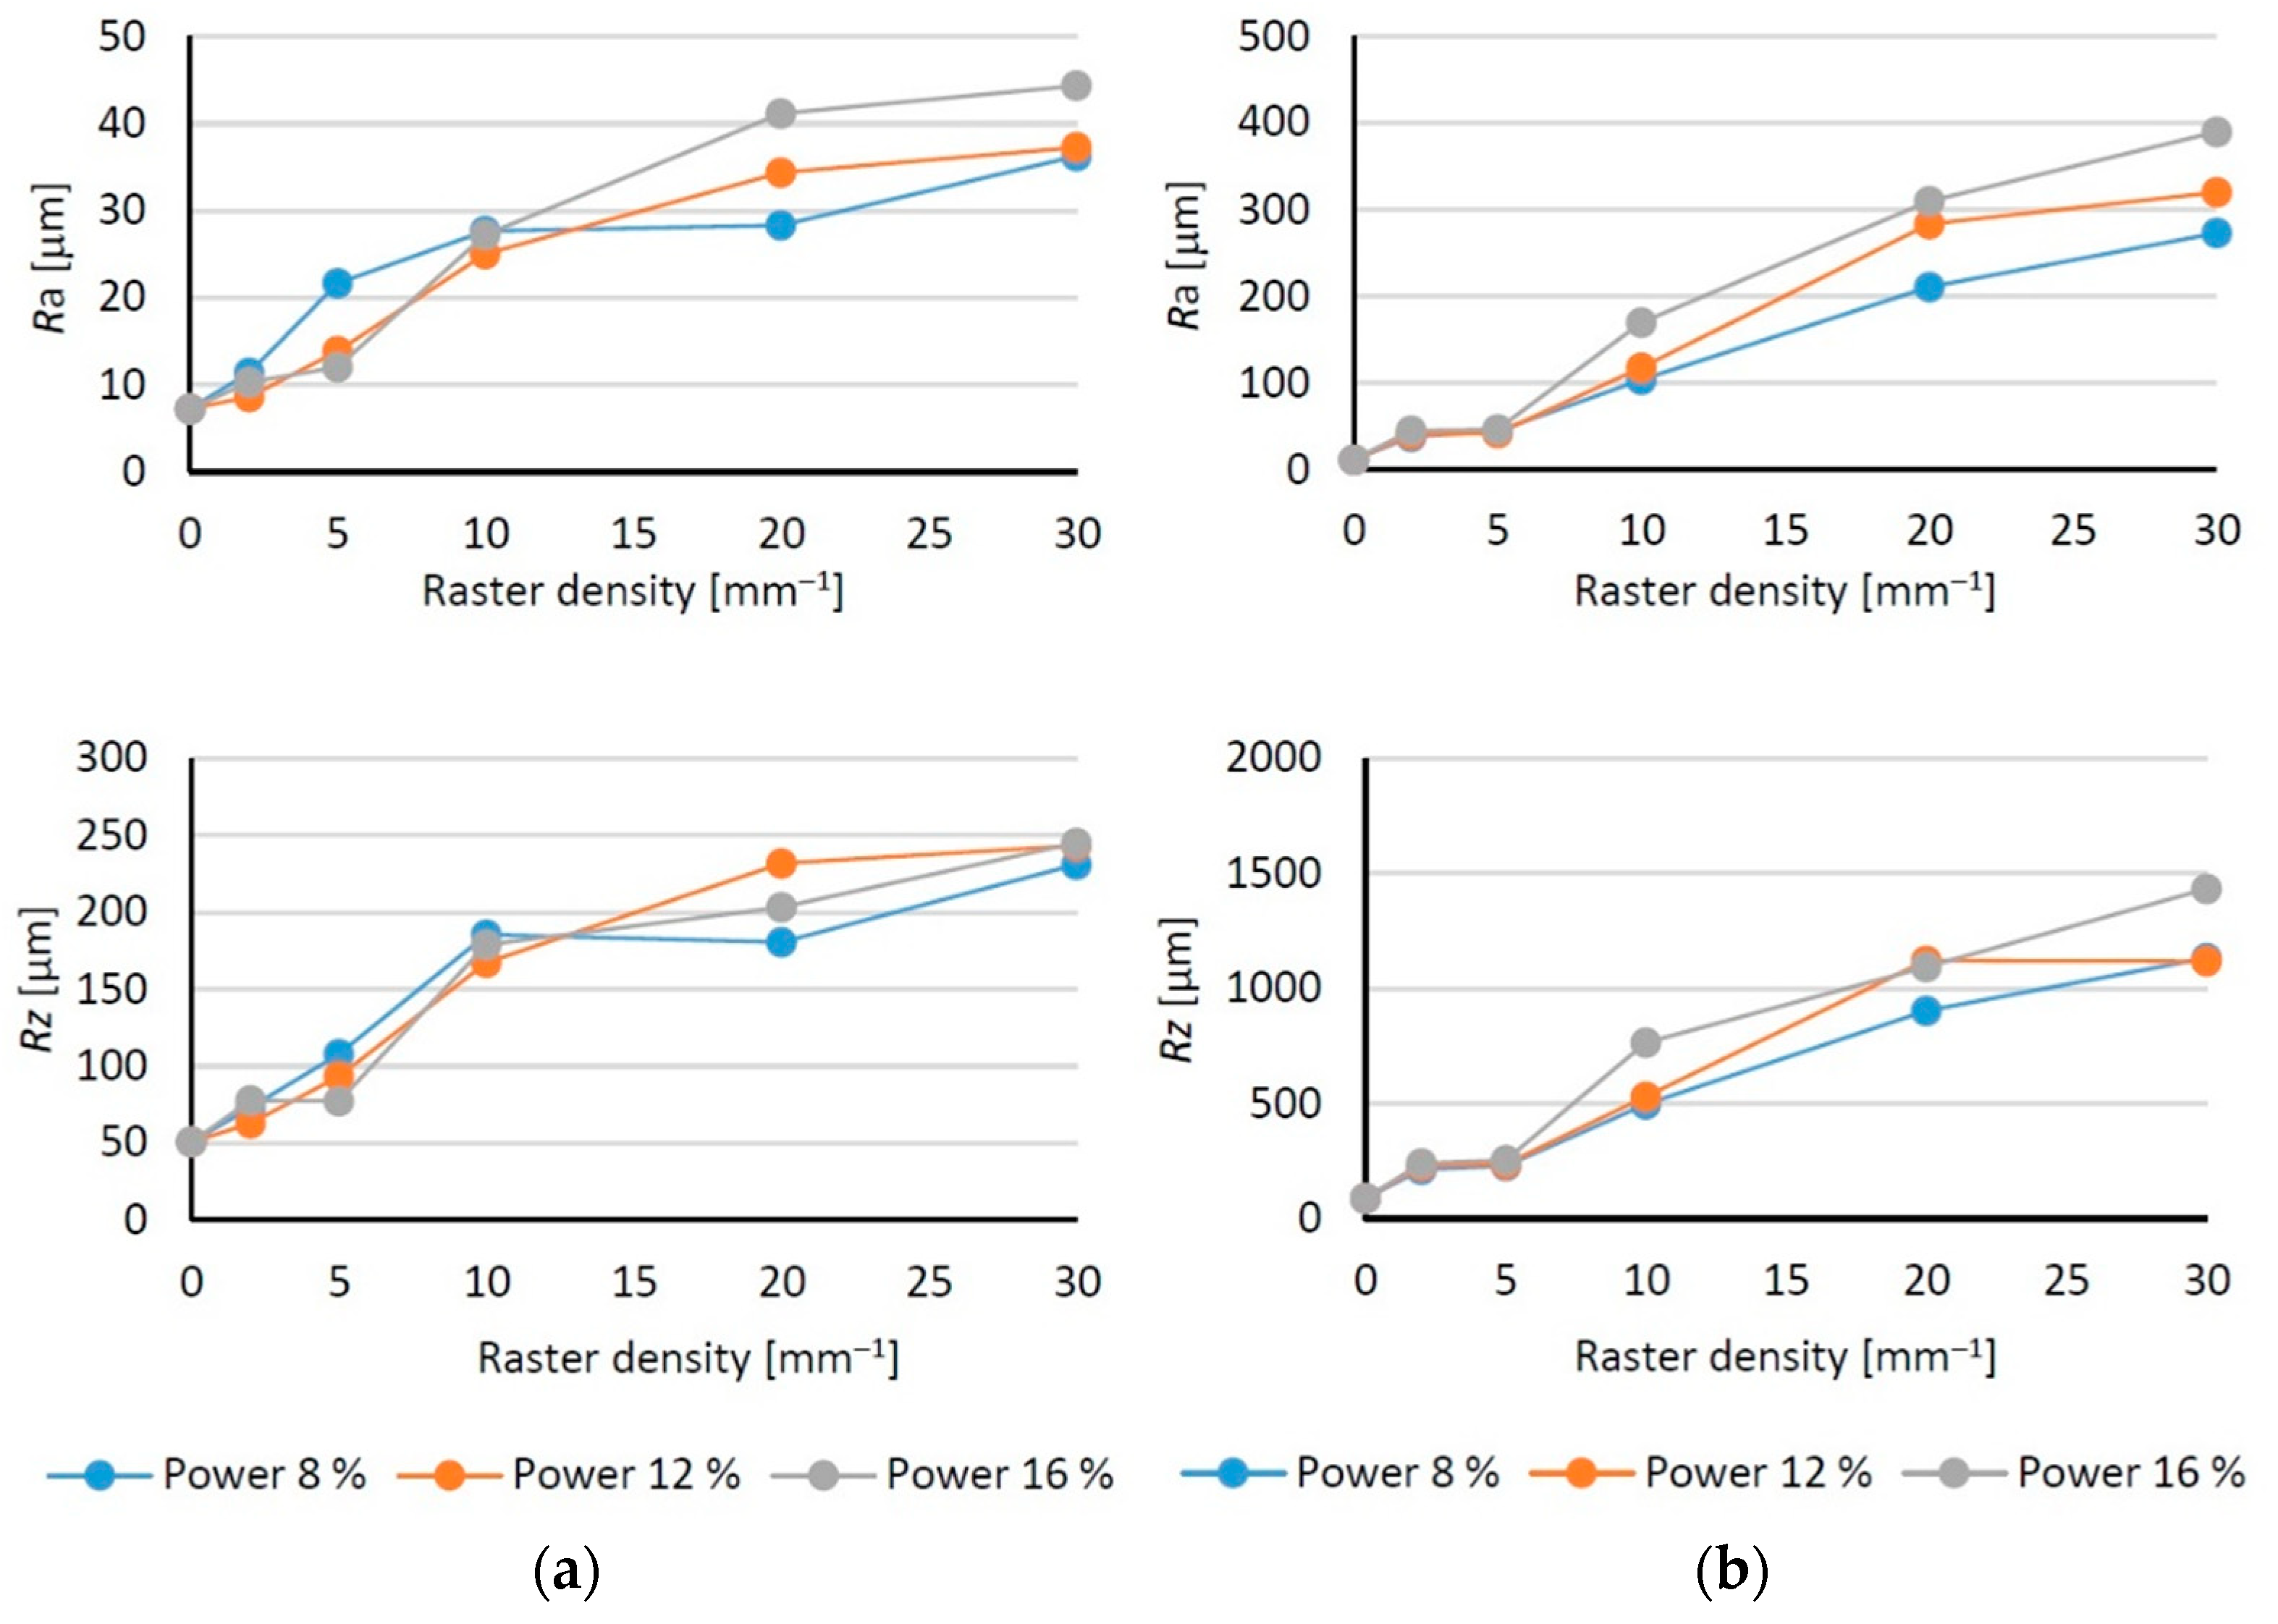
The results confirm that the wood surface engraving with a CO2 laser resulted in significant increases in roughness parameter values, which is in accordance with other research [8,12,14,15,19]. A more significant roughness increase was obtained by increasing n than by increasing the Pe (Figure 6).
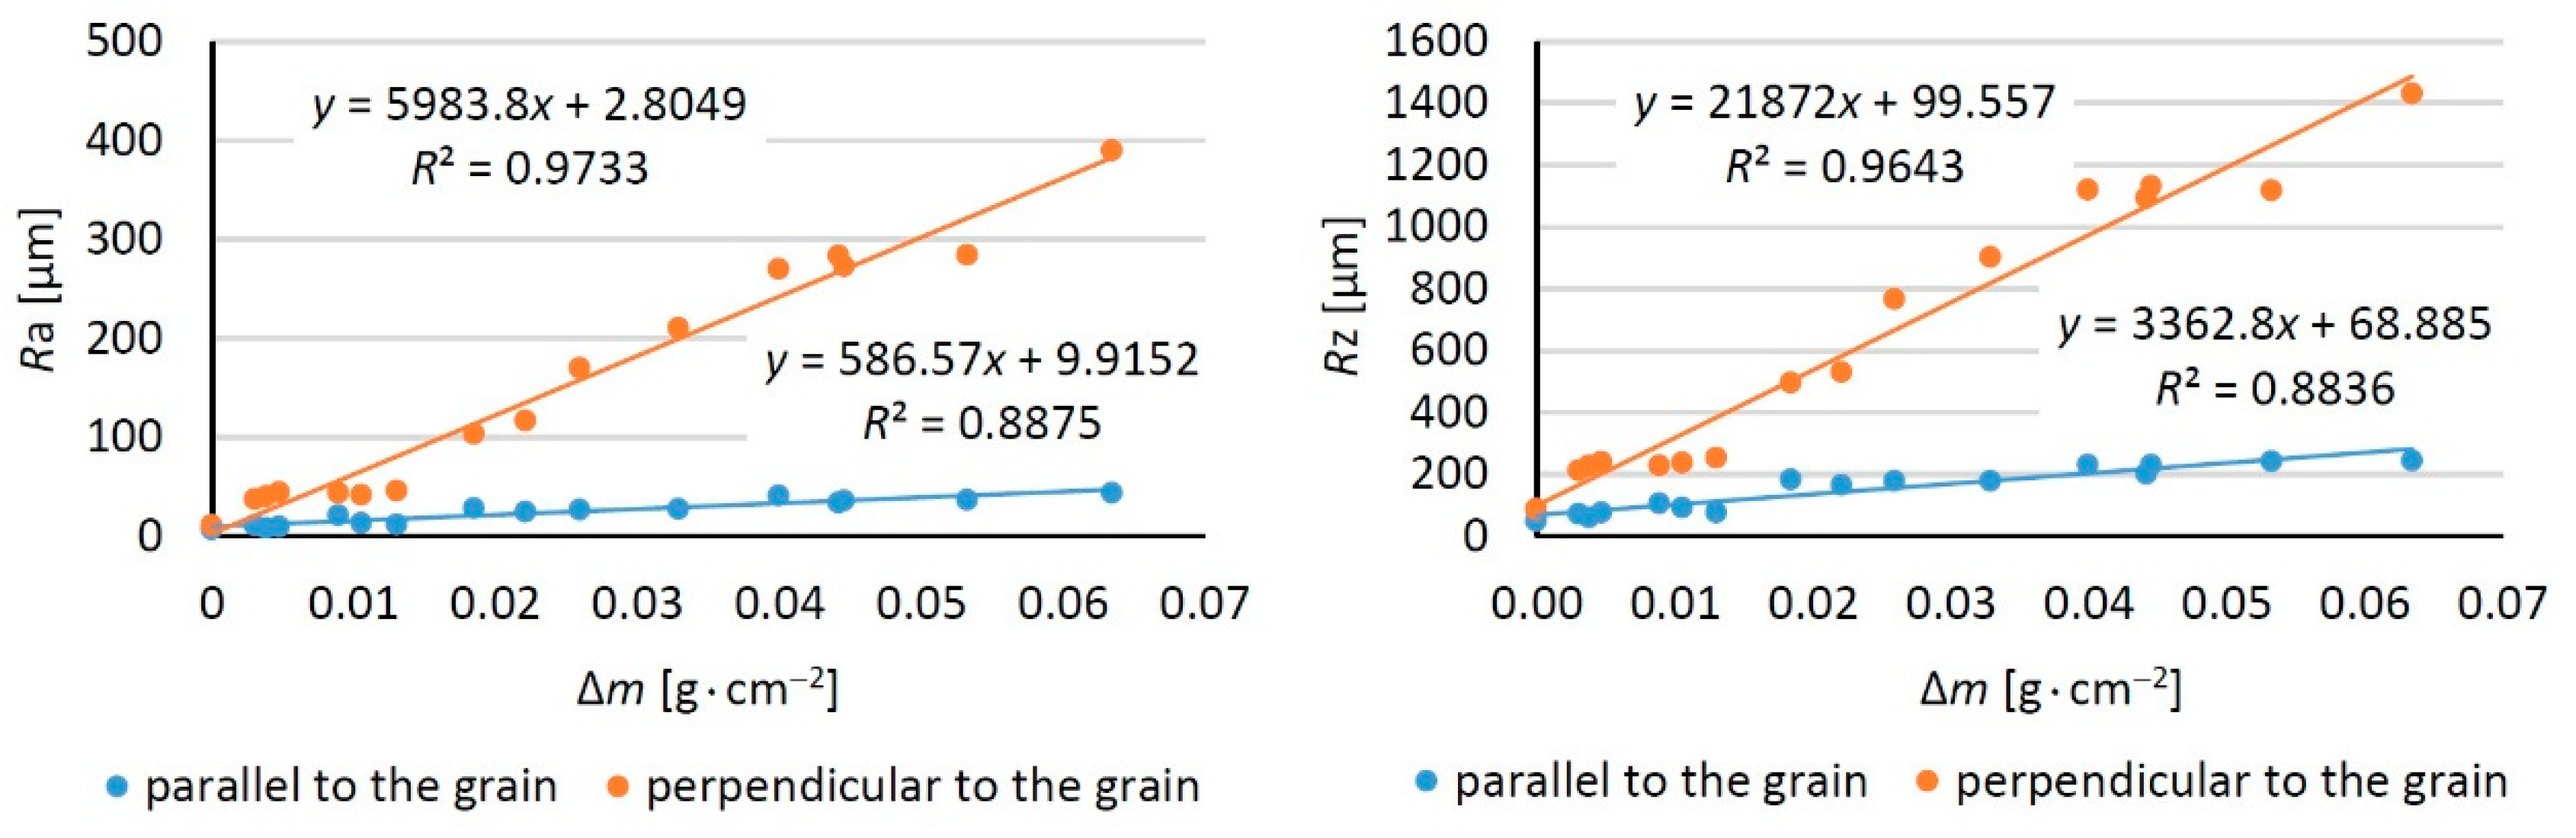
We conclude that the Ra and Rz grew linearly with wood mass loss (Figure 7). At the maximum wood mass loss, the roughness parameter increase in the grain course was several times more than that of the reference value, while perpendicular to the grain, the increase represented even more than one order.
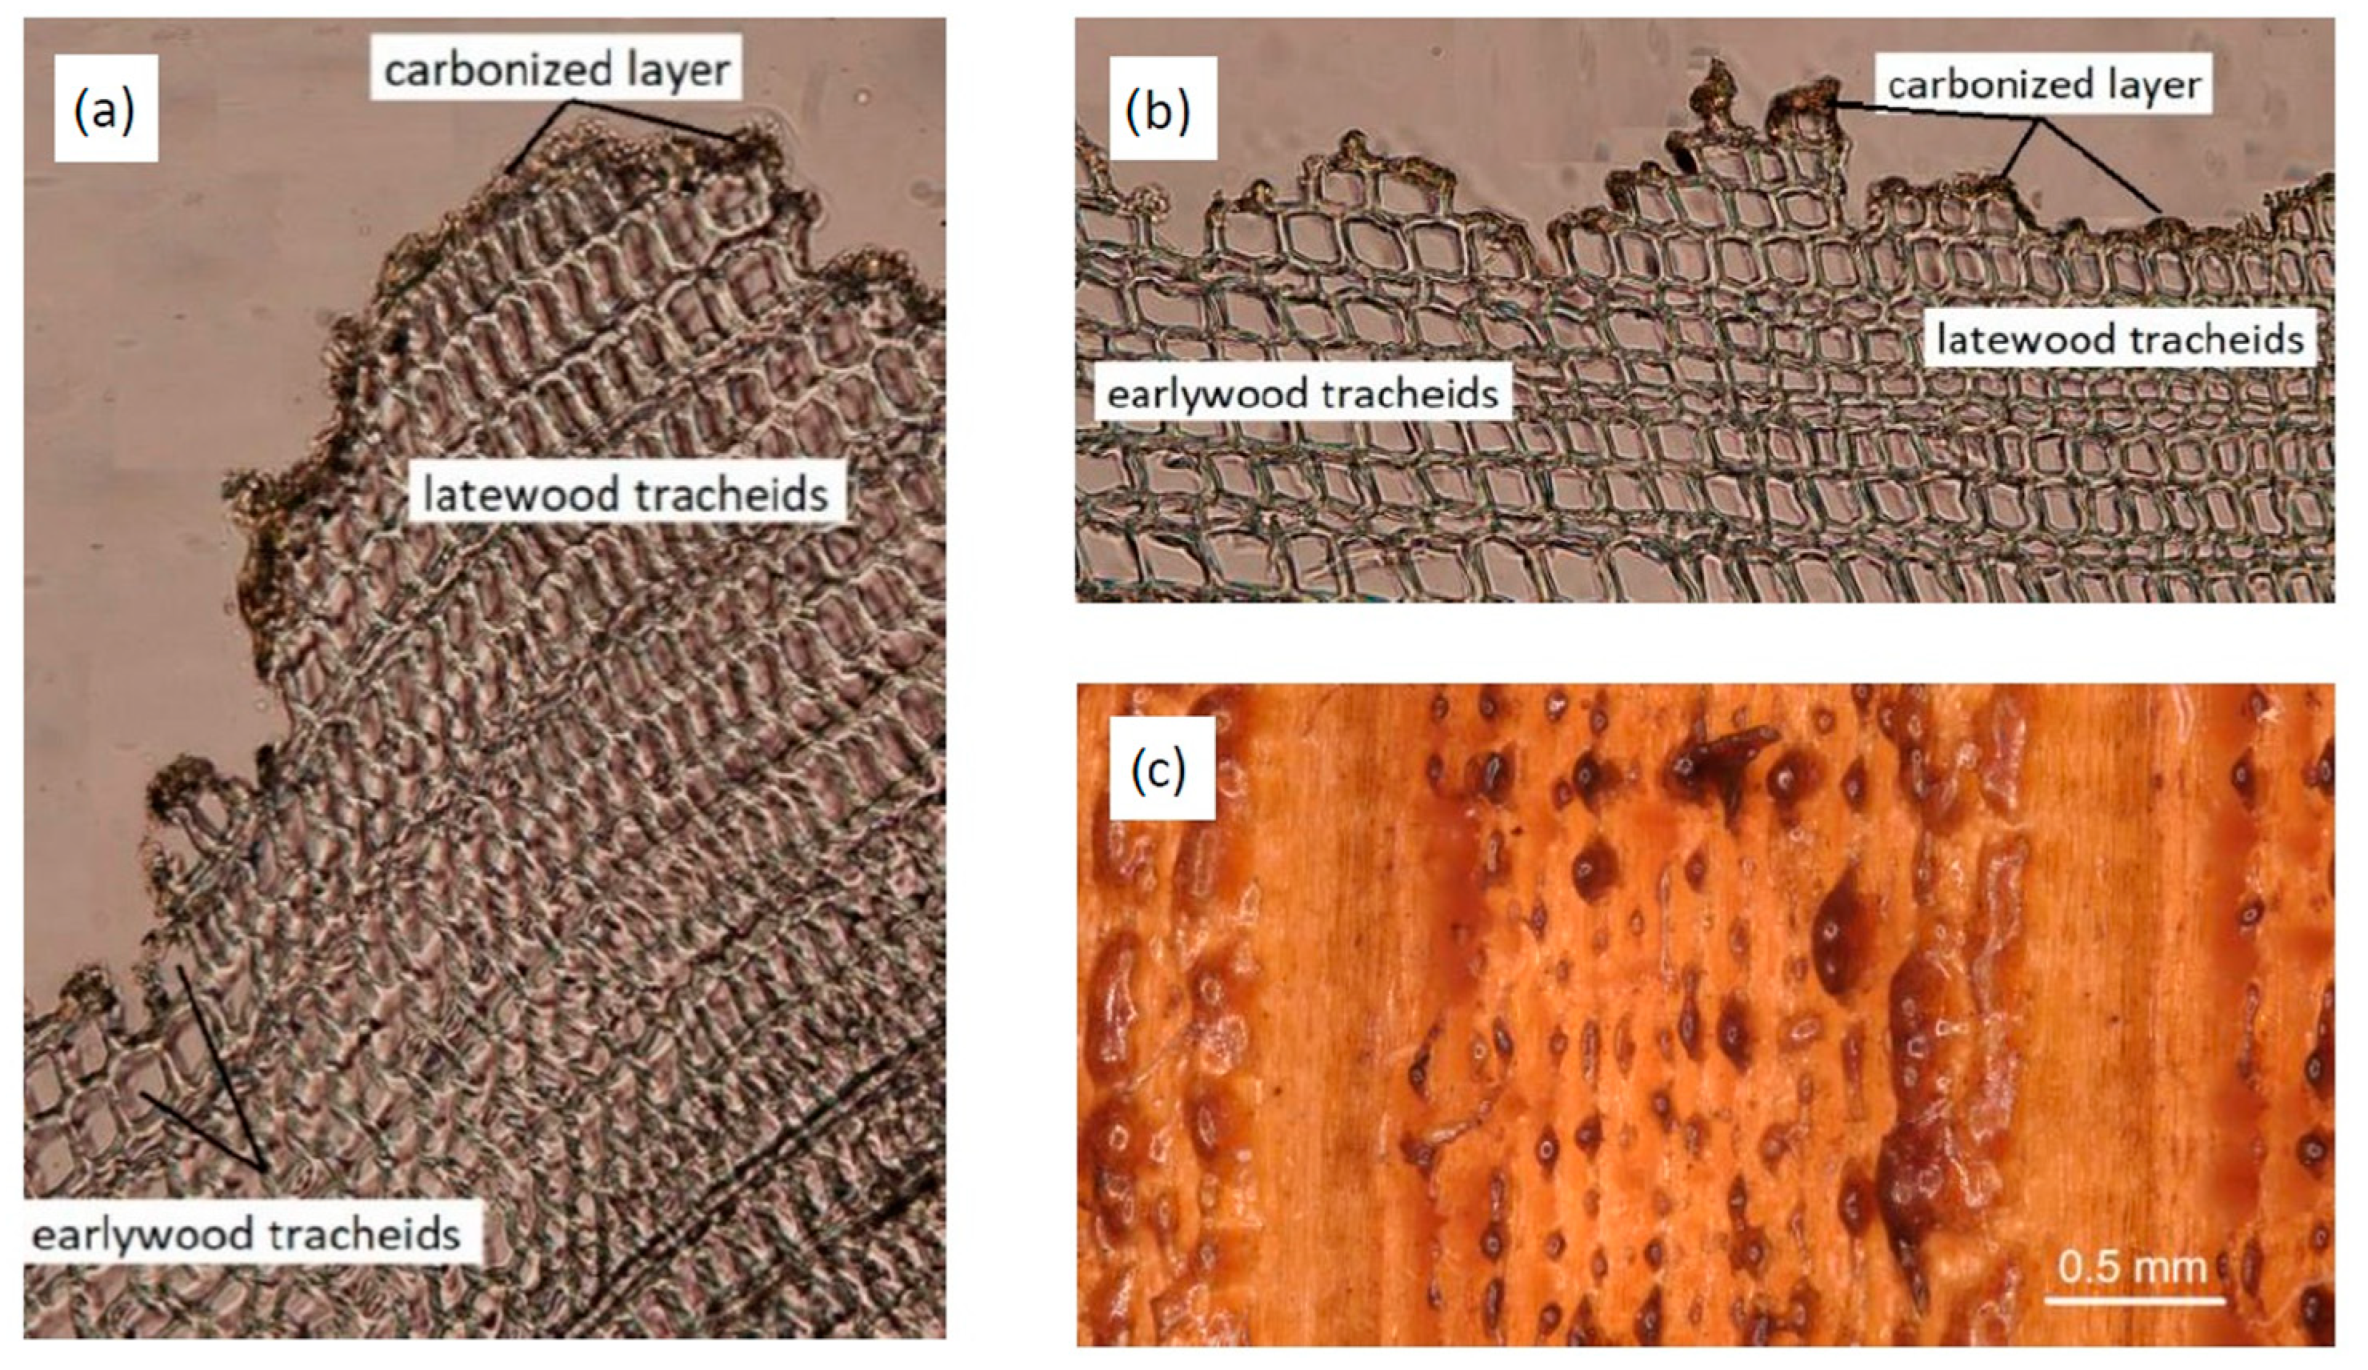
Many early-wood and late-wood tracheids on the engraved spruce wood surface were carbonised. This phenomenon was mostly observed at higher raster densities (20 and 30 mm−1) and at laser power values exceeding 16 W. In the case when the surface layer consisted exclusively of early-wood tracheids, their cell walls were often disturbed due to burn-through by the laser beam, and due to the removal of the very unstable carbonised layer (Figure 8a,b). The radial surfaces also exhibited the occurrence of melted mass, largely due to the resin outflow (Figure 8c). This phenomenon, on the other hand, was more frequent at lower values of raster density and laser power.
3.3. Changes in the FTIR Spectra
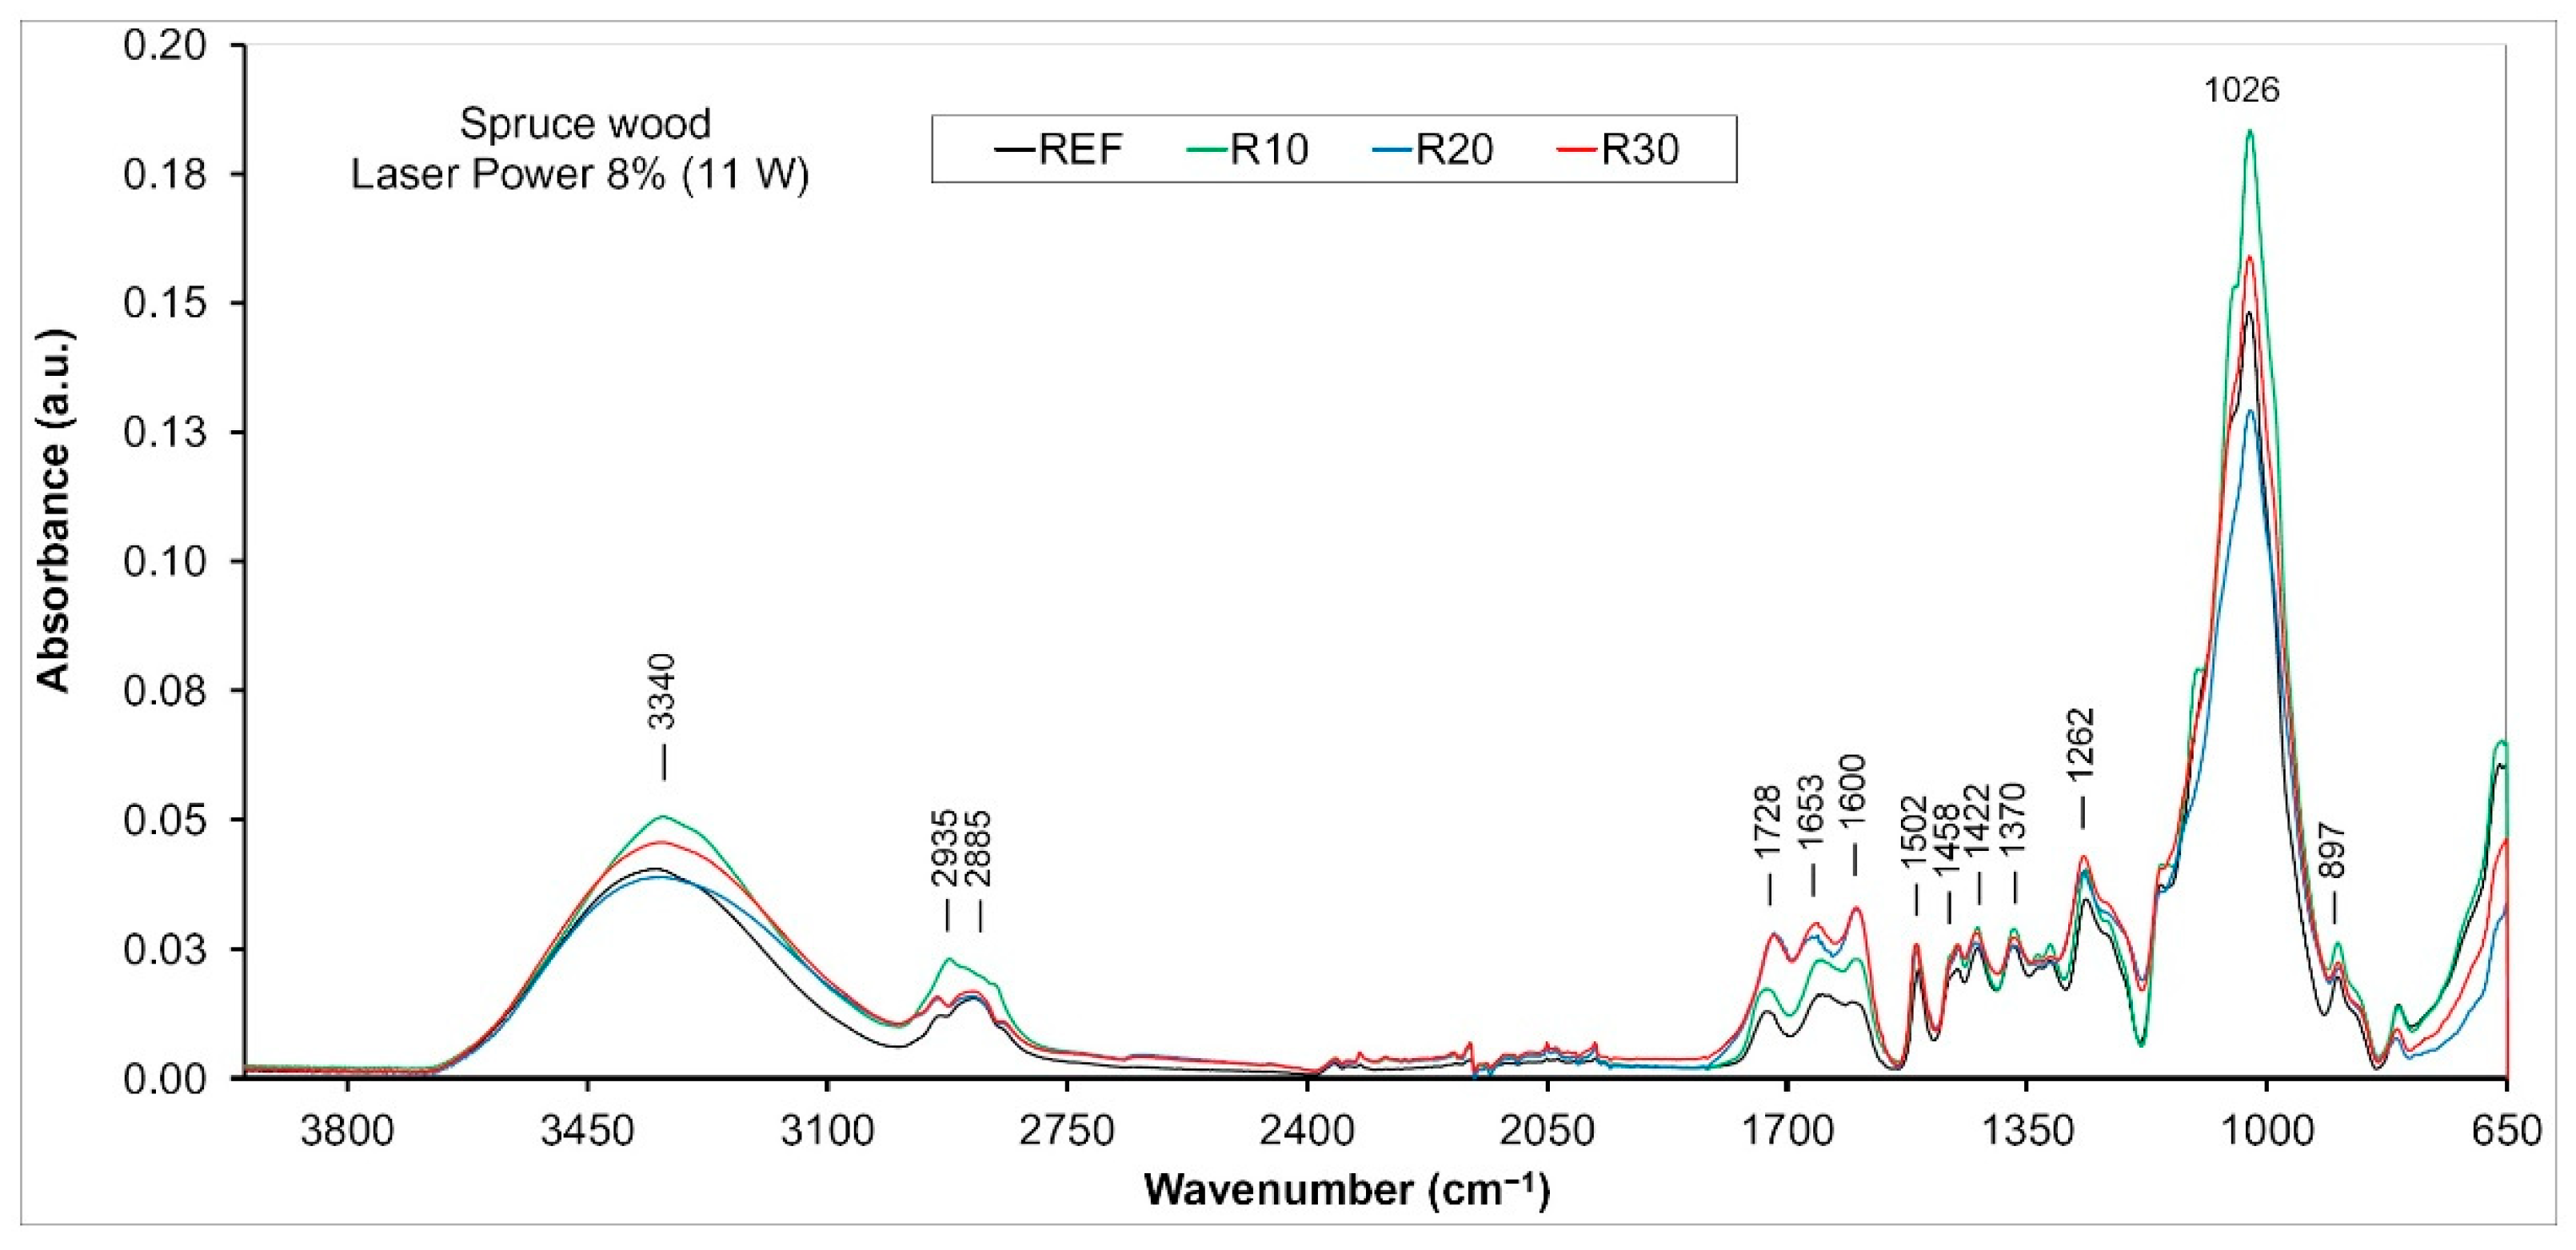
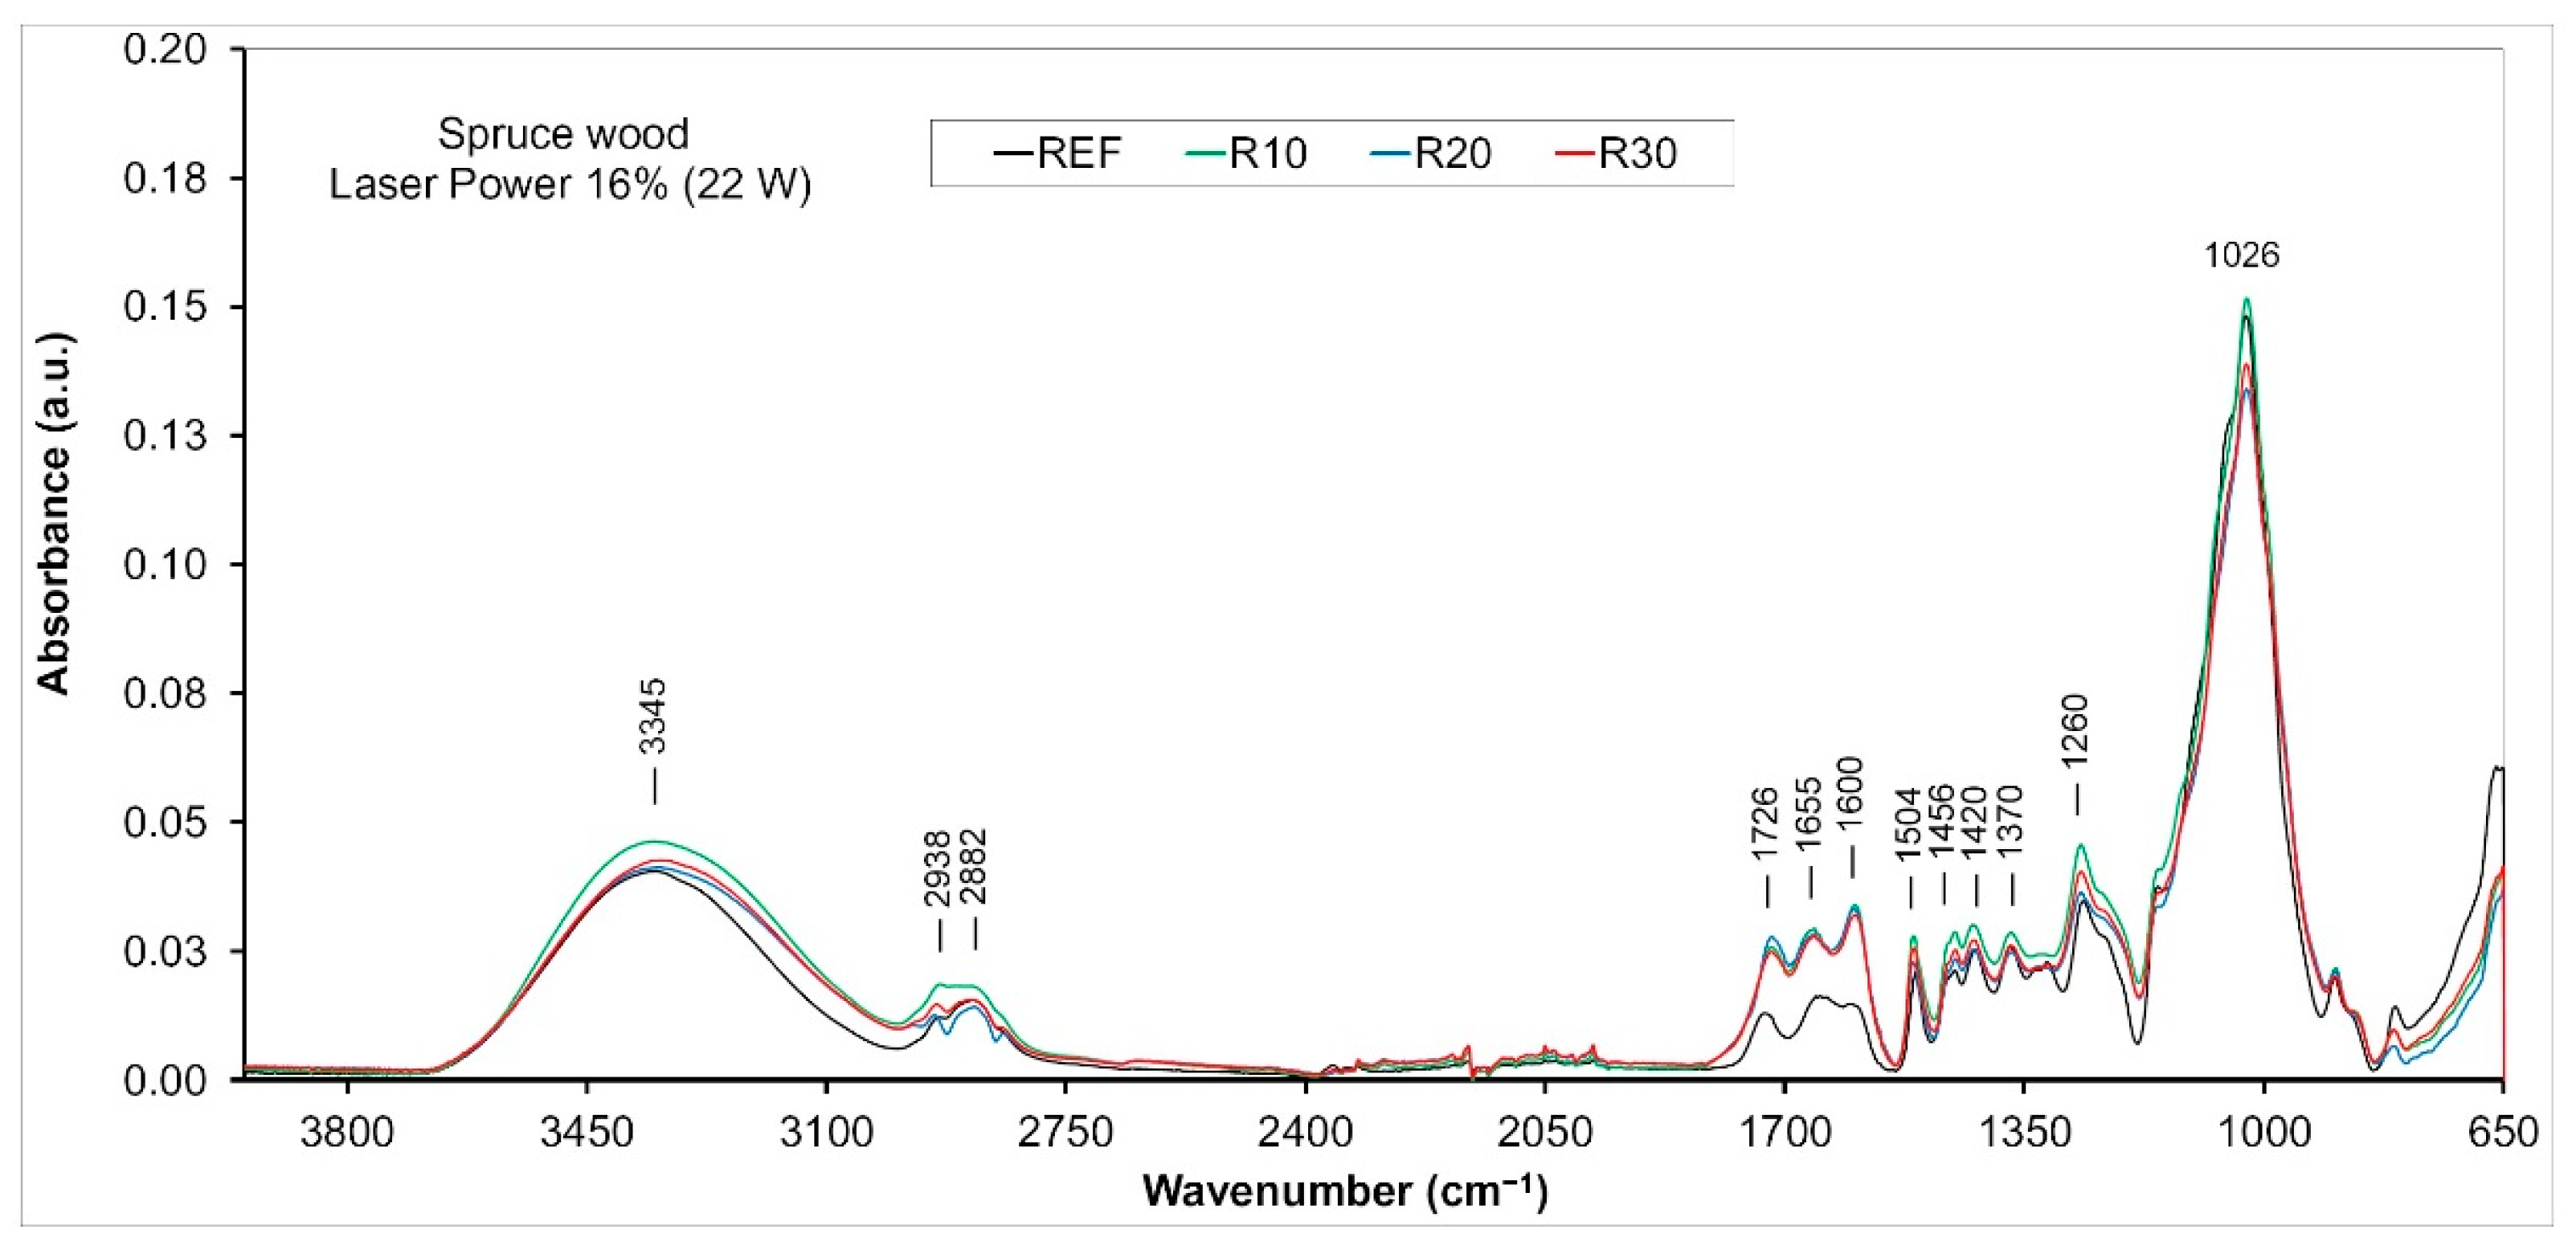
FTIR spectra were examined by applying the ATR technique on the wood surface before and after CO2 laser engraving. The absorption band with a peak at 3350 cm−1 (O−H vibrations in the lignin structure, in hemicelluloses and in cellulose) [16,36], showed apparent variations at all levels of raster density and laser power. Absorbance increase was mainly evident at lower raster densities, while density increase was, contrarily, associated with decreasing absorbance. The reduction of O−H groups was accompanied by condensation of lignin and oxidation to C=O groups [37]. The area from 2950 to 2850 cm−1 (asymmetric and symmetric C−H stretching vibrations in aliphatic compounds) [38] manifested similar patterns. The range from 1800 to 800 cm−1, typical for the stretching and deformation vibrations of all wood components, exhibited more conspicuous variations in the absorbances. The treated samples generally showed increasing absorbance in proximity to 1730 cm−1 (stretching vibrations in unconjugated C=O groups) with increasing raster density of the engraving laser (Figure 9 and Figure 10).
At higher raster densities, a shift in the band´s maximum towards lower wavenumbers (from 1728 to 1712 cm−1) was also recorded, possibly caused by carbonyl group conjugation with other double bonds in alkenes, supported by thermo-oxidation reactions [39]. These facts point to the changes in several functional groups in lignin and in hemicelluloses [40,41]. The growth of the absorbance value of the band (belonging to the non-conjugated C=O groups) indicates increasing amounts of carbonyl and carboxyl groups in lignin and in polysaccharides, formed in oxidation processes [39], which is optically reflected in wood surface darkening [42]. The band decrease can be primarily due to deacetylation of hemicelluloses during exposure of the wood surface structure to heat [4]. A similar trend was also recorded near to the 1650 cm−1 band (conjugated C−O in quinones, coupled with C=O stretching in various groups in lignin) [43,44]. The band increase is thought to be due to removal of acetyl groups from hemicelluloses and lignin, splitting β-alkyl-aryl-etheric bonds, while the decrease is induced by the removal of acetyl groups from hemicelluloses and by the release of acetic acid, accelerating the depolymerisation of saccharides and condensation reactions in lignin [45,46].
Chemical changes in the functional groups present in lignin and in hemicelluloses, primarily the increase in C=O bonds, result in forming of and changes to the chromophore structures. These substances underlie the natural colour of wood, and wood discolouration is induced by various forms of energy. The band close to 1600 cm−1 (C=C stretching vibration conjugated with aromatic ring in lignin, benzene derivatives assigned to ring vibrations) effectively copies the behaviour of the band associated with carbonyl groups. The absorbance value at 1500 cm−1 (C=C stretching vibration and aromatic skeleton vibration) shows only moderate alterations, providing evidence of the relatively good thermal stability in this part of the aromatic structure [46,47]. At higher temperatures, condensation reactions occur in lignin [45].
Moderate absorbance changes, primarily dependent on the raster density, were also observed at 1460 cm−1 (CH3 asymmetric bending) and at 1420 cm−1 (CH2 symmetric bending), related to groups in hemicelluloses and lignin [48], and at 1370 cm−1 (C−H deformation) related to the phenolic hydroxyl groups [49,50]. These changes, triggered by heat, support the theory of splitting the aryl–alkyl–ether bonds in lignin and elimination of methanol during the formation of conjugated ethylene bonds [46,51]. The increased band at 1260 cm−1 (C−O stretching vibrations) indicates the formation of novel guaiacyl units [47].
The range between 1200 and 900 cm−1 is characterised by different overlapping bands typical for all the main wood components [48]. The band with the highest absorption was close to 1026 cm−1 (C−O deformation vibrations). The intensity varied mainly at low laser power values (Figure 9 and Figure 10), which indicated degradation of the structure of cellulose, hemicelluloses and methoxyl groups of lignin [52,53]. This fact may be related to the partial demethoxylation of lignin and to gradual cross-linking of the lignin [46]. Similar changes in the main components of wood engraved with CO2 laser were also indicated in oak wood [8].
3.4. Spruce Wood Surface Discolouration Related to Engraving
The phenomena occurring on spruce wood surface during engraving with a CO2 laser, and the related chemical changes, also caused obvious wood surface discolouration. The basic statistical characteristics of the variables, L*, a* and b*, obtained for spruce wood over the whole raster density range and all three laser power levels are listed in Table 3.
The results of two-way variance analysis confirmed that both studied parameters and their interactions had significant impacts on the discolouration in the engraved wood surfaces. The discolouration of the spruce wood surface was more influenced by the raster density than by the laser power on its own.
The highest lightness, L*, values were measured in the case of spruce wood reference samples (before engraving), as shown in Table 3. With increasing raster density, lightness decreased significantly. The steepest decrease in lightness associated with increasing raster density (61.3%) was recorded at the lowest laser power.
Similar lightness values corresponding to the identical engraving parameters were observed in beech wood and in oak wood [7,8]. In comparison with these two species, the lightness decrease in spruce was the lowest. These differences corresponded to the differences in the physical structure and chemical composition between the respective species. The discolouration was also considerably influenced by the lightness differences between the species before engraving.
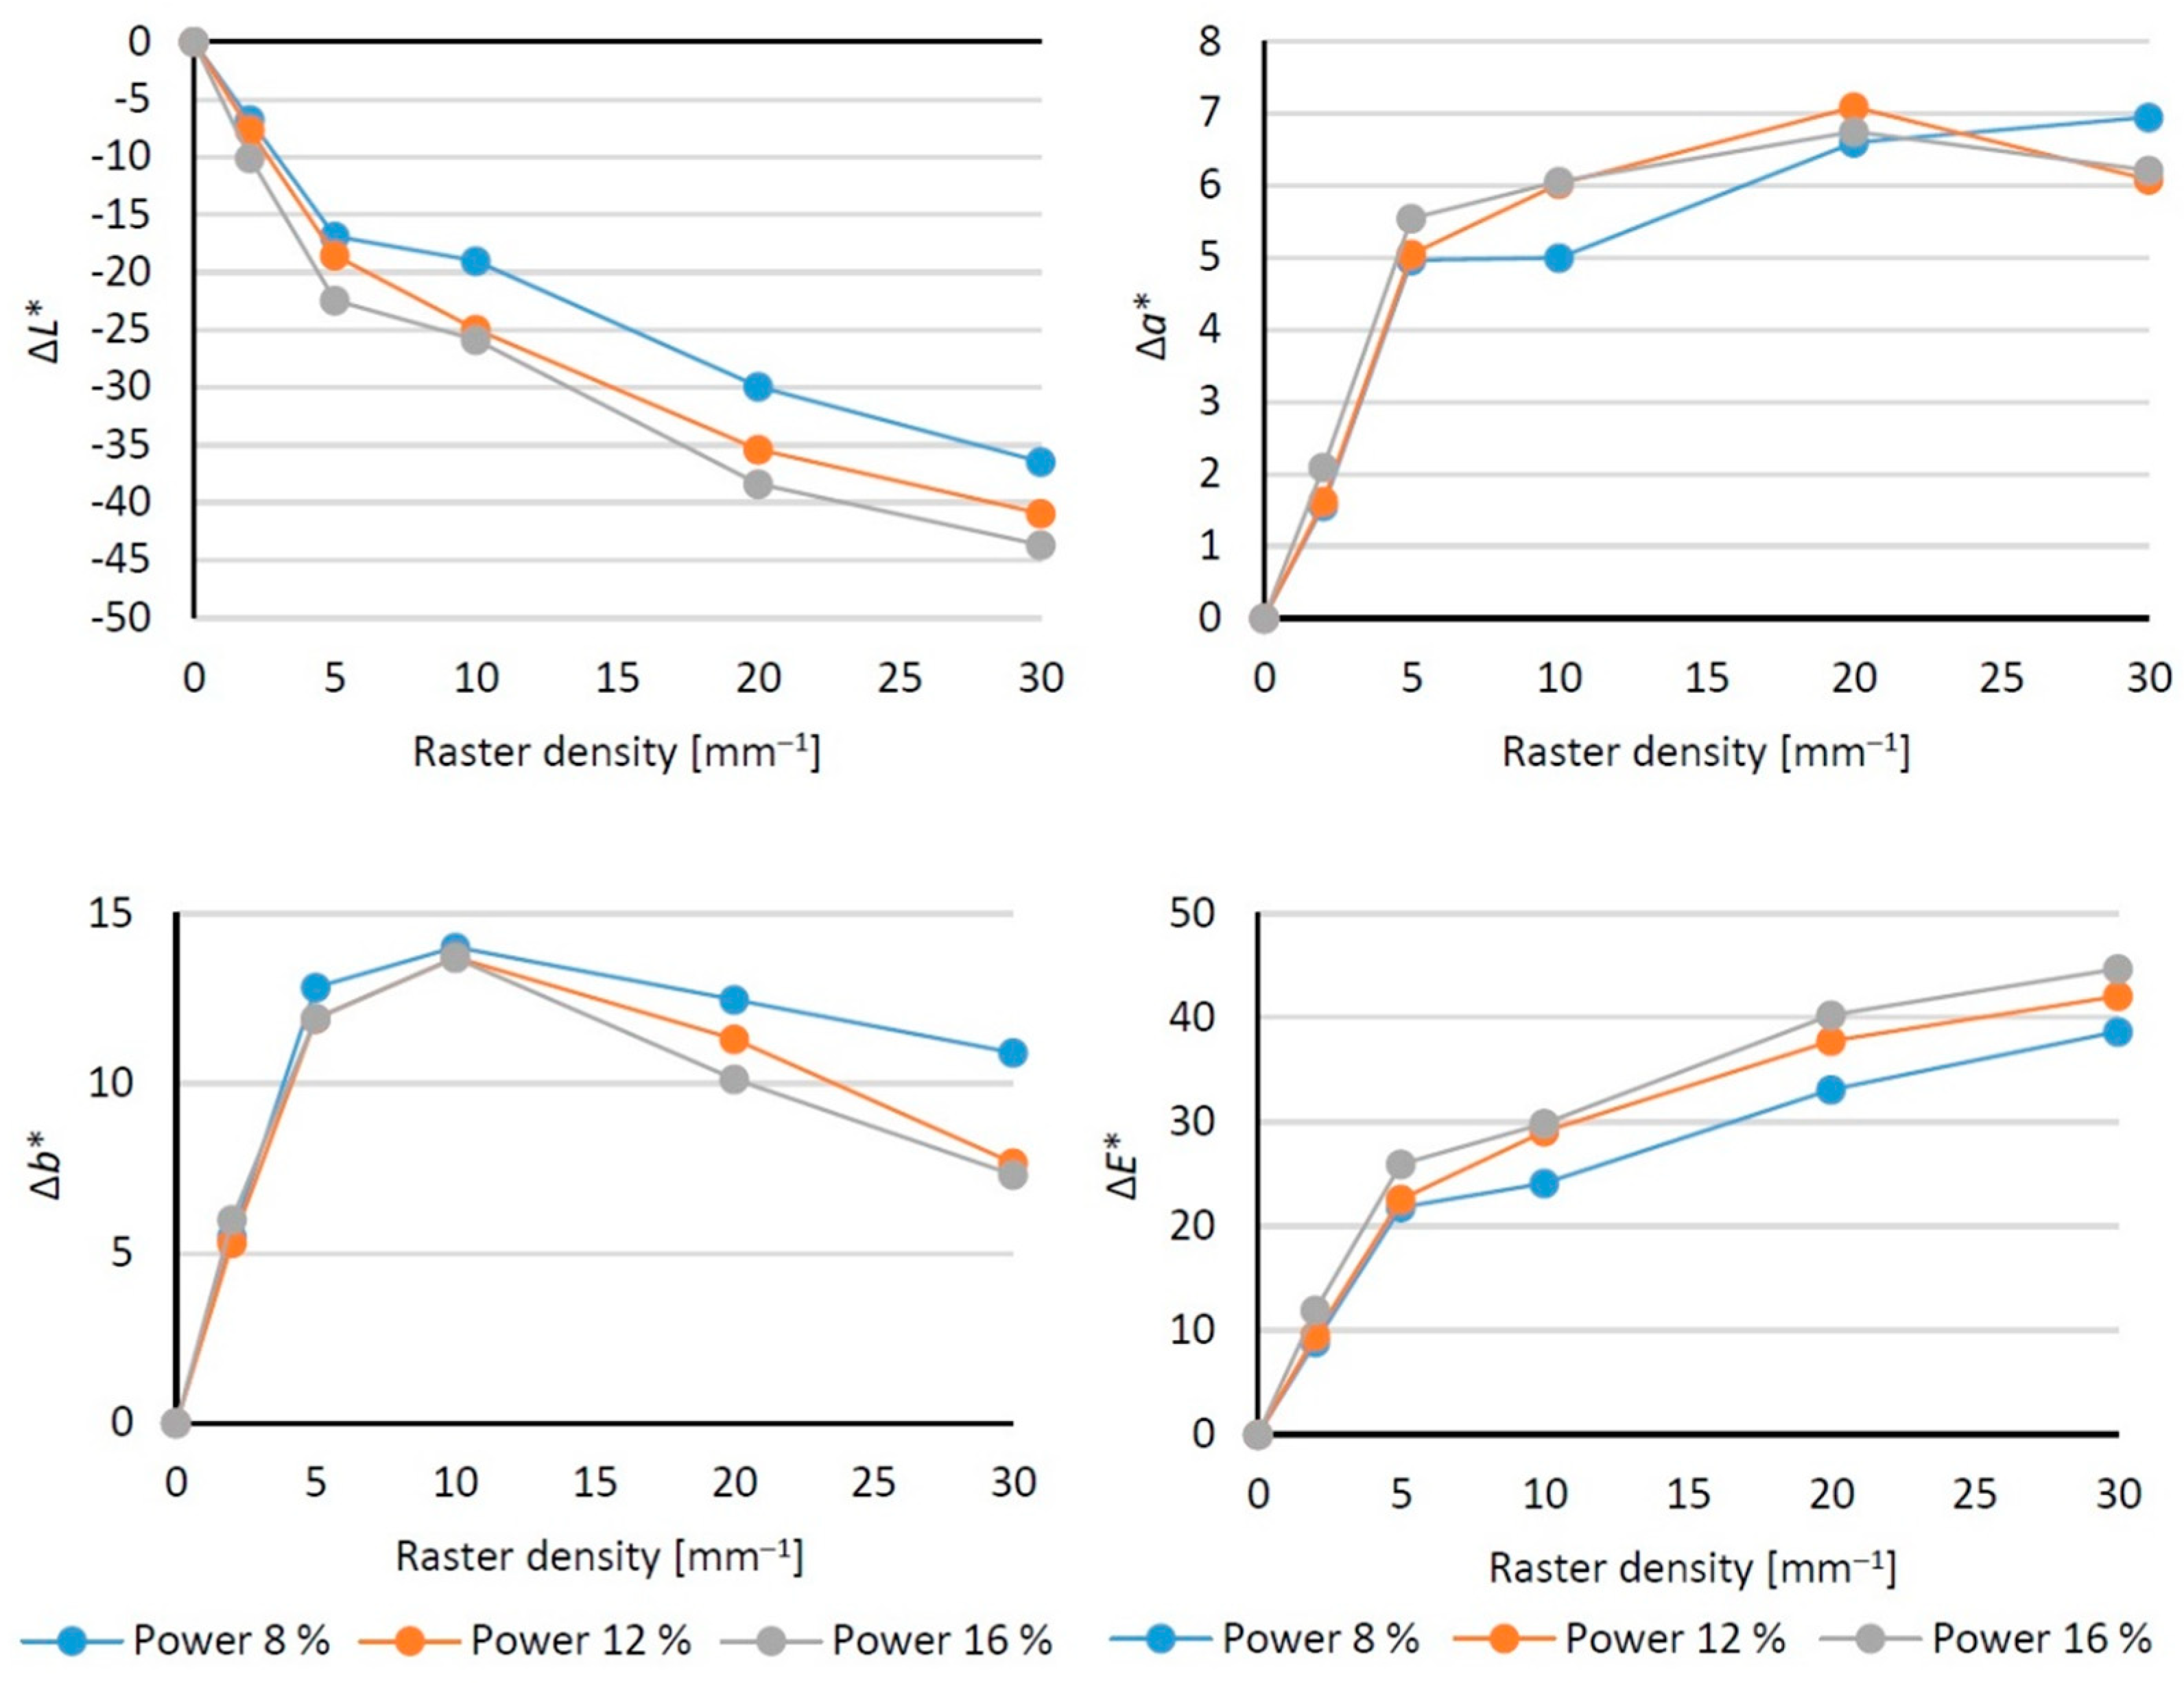
With the variation in the parameters of the laser used in engraving, the colour values a* and b* also varied (Table 3). The influence of raster density and CO2 laser power on the colour differences, ΔL*, Δa* and Δb*, and on the total colour difference, ΔE*, are shown in Figure 11. In all cases, the a* values before engraving ranged within the red colour zone, near to the achromatic colour. At all used laser powers, this colour values gradually shifted to more saturated red. The b* values moved within the yellow zone, with the saturation in engraved surfaces significantly increasing up to a raster density of 10 mm−1, but decreasing progressively as raster density increased further, as a result of the moderate shift towards the achromatic colour.
The total colour difference, ΔE* (Figure 11), reached values from 10 to 12 at the lowest laser power (8%) and raster density (2 mm−1). These values are between the degrees 5 and 6 of the six-degree colour scale [54] and, as such, represent an obvious discolouration compared to the original colour. With the continued increase in laser power and raster density, ΔE* values were far beyond 12, indicating a novel colour compared to the original.
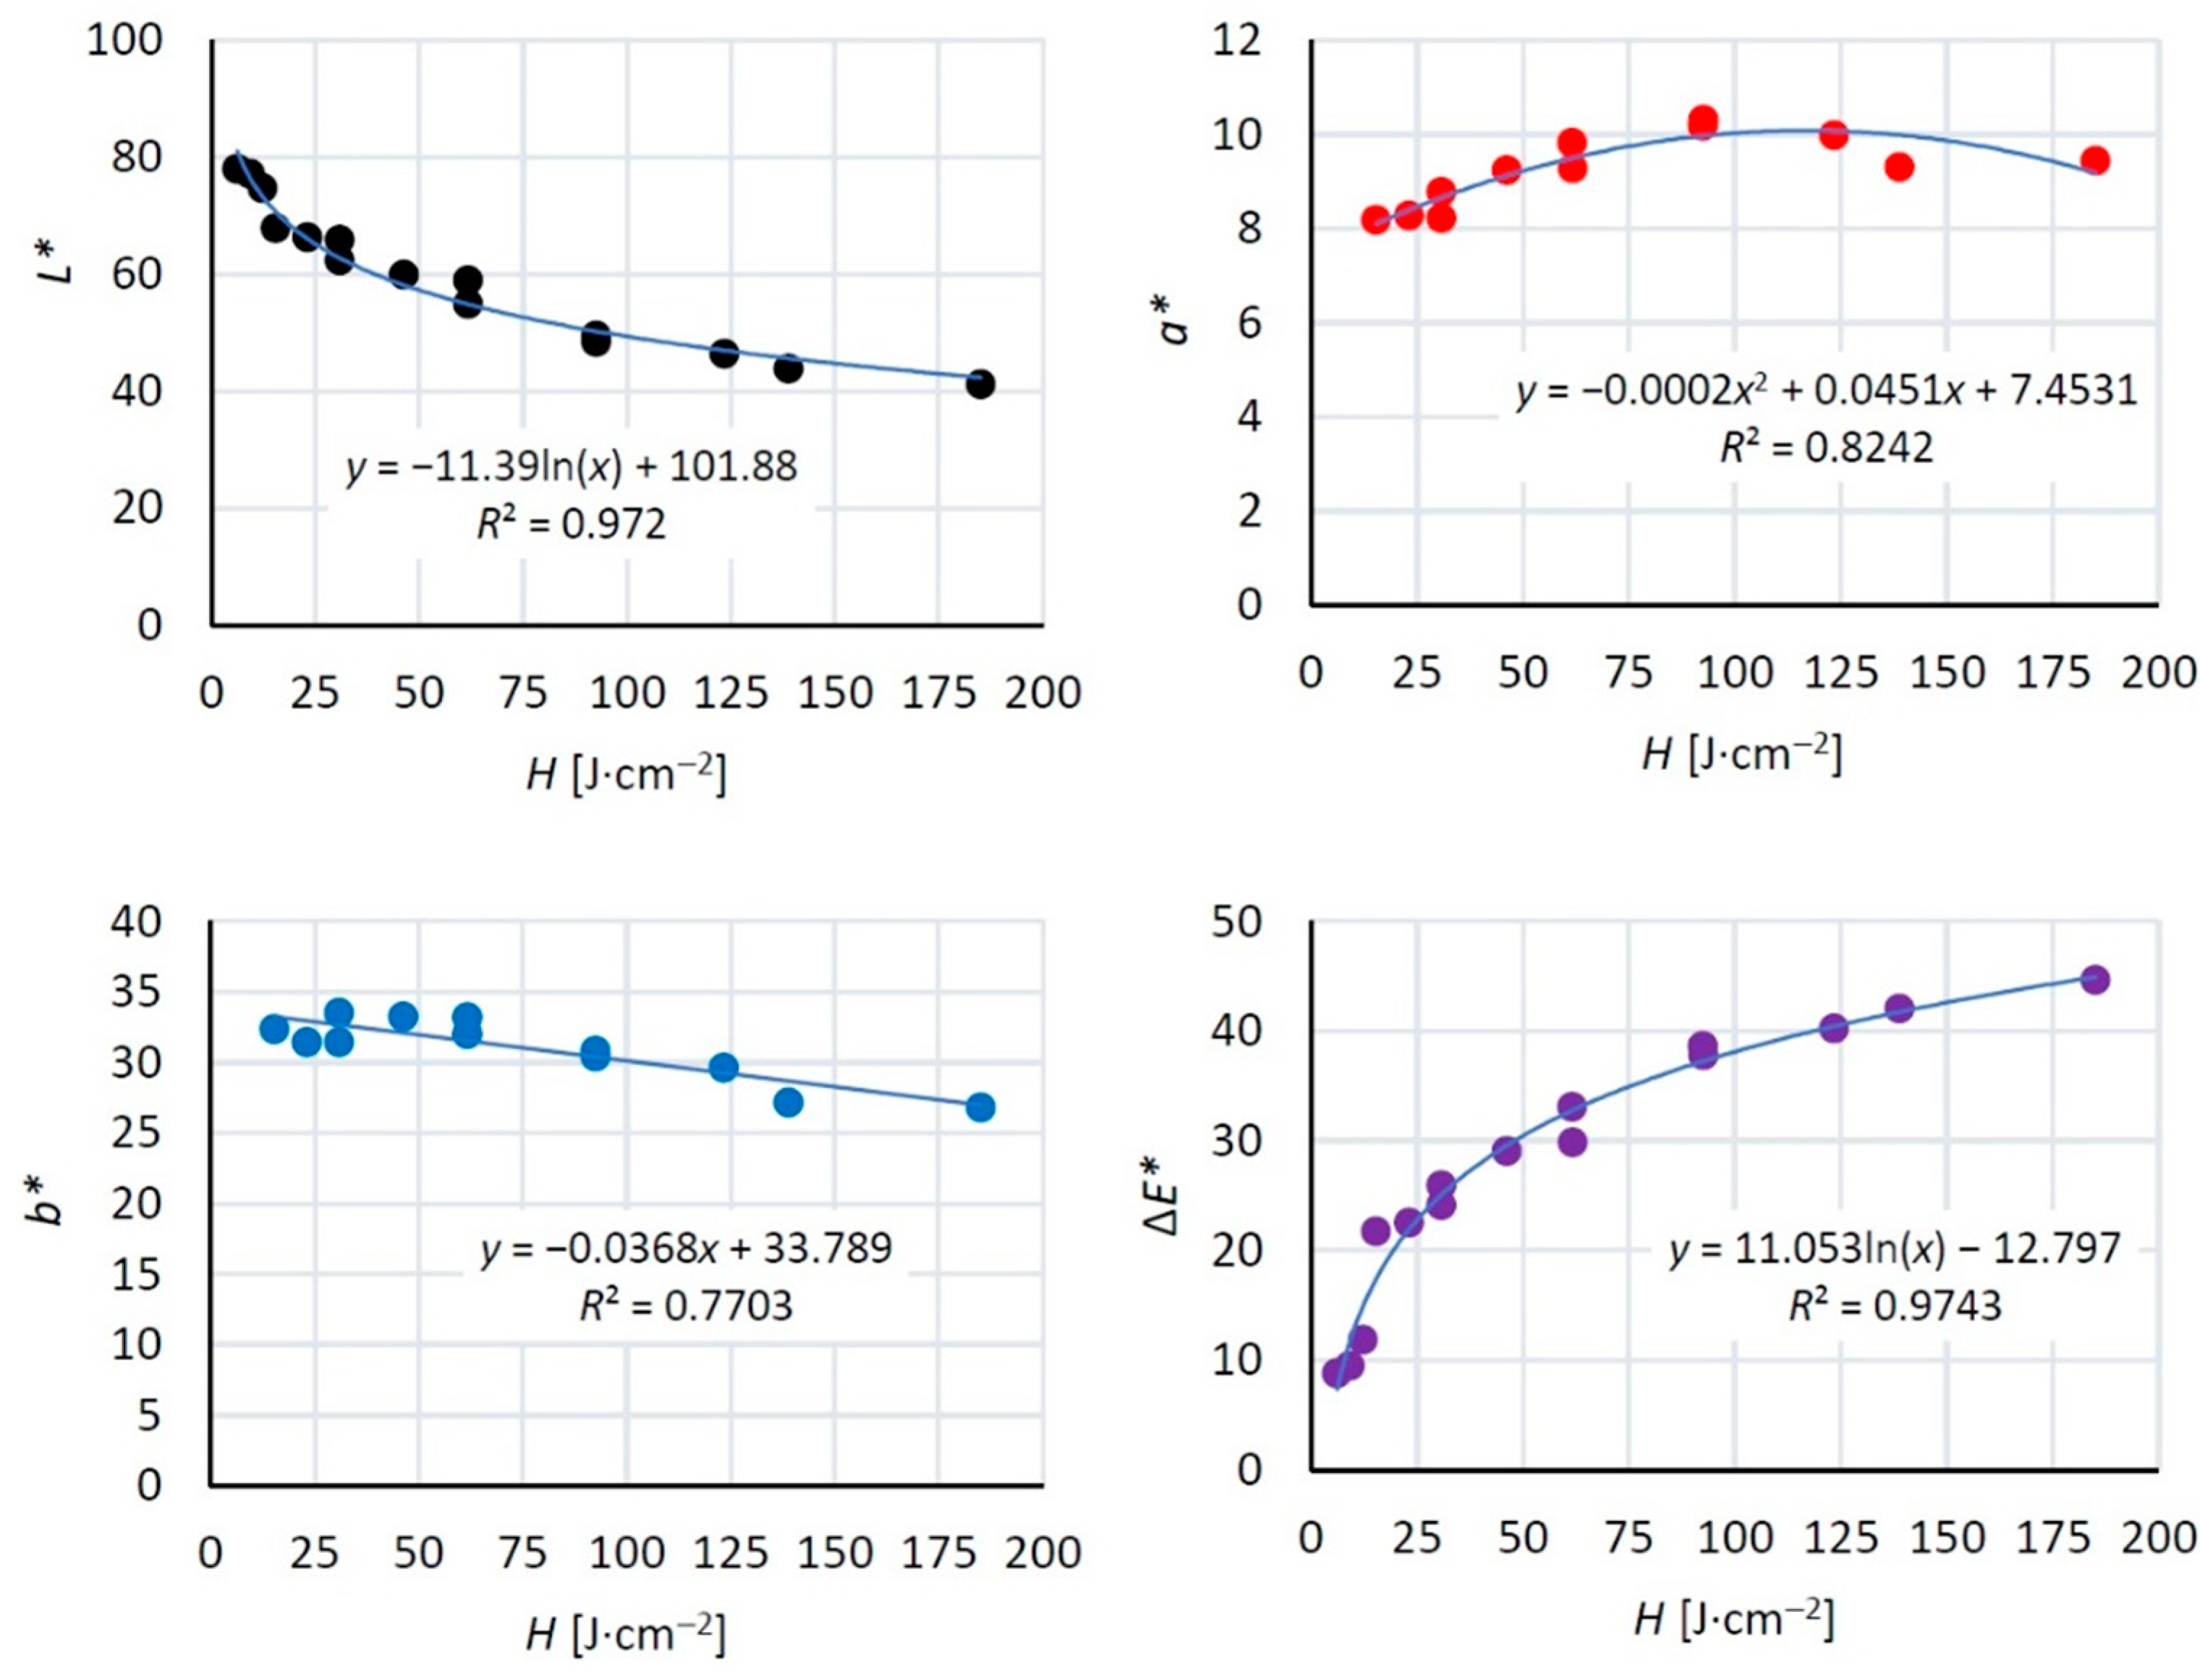
The discolouration of the engraved spruce wood surfaces is also illustrated in the figures embedded in Table 3. These figures show clearly that the engraved surfaces, step-by-step, turned dark brown with increasing raster density. These colour modifications corresponded to the changes in spruce wood chemical structure, discussed in the previous chapter. These qualitative changes are in line with those previously reported [4,7,8,19,20,21,22,23,24,33]. Our results quantitatively differ from the earlier results, given the different wood species examined and the different laser parameters set. As all the laser parameters may be expressed together through the unique variable, total irradiation dose (Equation (1)), our study examined the dependence of wood discolouration on the total irradiation dose. The dependence of colour differences, and the total colour difference, on the total irradiation dose applied is illustrated in Figure 12. The results confirmed the close correlation of the colour coordinate values with the total irradiation dose.
Knowledge about the close dependence of wood mass loss and wood colour coordinates on the total irradiation dose offers better and more objective conditions for targeted colour modification of spruce wood surface treated with a CO2 laser. There are also novel possibilities in creating patterns with higher quality, specifically concerning the plasticity and colourfulness.
4. Conclusions
The results of analysis of spruce wood engraving with a CO2 laser allow us to state the following conclusions:
The investigated engraving parameters have significant effects on mass loss, surface morphology, chemical composition and discolouration of the spruce wood surface.
All the irradiation parameters can be amalgamated into a single variable—the total irradiation dose, H.
During engraving of the radial spruce wood surfaces, immediate destruction and sublimation of thin surface layers occurred. A close correlation was recognised between the wood mass loss and the total irradiation dose.
The wood mass loss varied across the treated surface as a result of density differences between the early and late spruce wood, and this was also reflected in the enhanced surface roughness.
The roughness both parallel with and (mainly) perpendicular to the grain course significantly increased with increasing laser power and raster density. The values of the roughness parameters, Ra and Rz, increased linearly with increasing wood mass loss.
Wood surface treatment with a CO2 laser caused its obvious discolouration. Perceptible discolouration was just discernible at the lowest laser power and raster density. The spruce wood surface was dark-brown-coloured. By further increasing the laser parameters, the spruce wood became even darker and the altered surface colour was recognised as novel in comparison to the original hue. The results confirmed a close dependence of the colour coordinates, and the total colour difference, on the total irradiation dose.
The main factors underlying the discolouration were heat-induced processes associated with degradation of the carbonyl groups in lignin and in polysaccharides; the splitting of the C=O bonds influenced the chromophore content responsible for the natural wood colour, in addition to the colour modification related to engraving.
The identified dependence of wood mass loss and of colour changes on the total irradiation dose can be exploited by setting laser parameters precisely to achieve targeted wood surface discolouration, and to ensure a higher quality of patterns created on the wood surface.
Author Contributions
J.K. conceived and designed the experiments; M.A. measured and analysed the laser power data; I.K. measured and analysed the FTIR data; J.K. and M.A. measured and analysed the colour, roughness and mass loss; J.K., I.K. and M.A. wrote the paper. All authors have read and agreed to the published version of the manuscript.
Funding
This work was supported by the Slovak Research and Development Agency under the Contract no. APVV-20-0159, no. APVV-16-0177 and by the VEGA Agency of Ministry of Education, Science, Research, and Sport of the Slovak Republic and the Slovak Academy of Sciences Grant no. 1/0577/22 and 1/0656/23.
Institutional Review Board Statement
Not applicable.
Informed Consent Statement
Not applicable.
Data Availability Statement
Data are contained within the article.
Acknowledgments
The authors thank Oľga Mišíková for preparing microscopic slides.
Conflicts of Interest
The authors declare no conflict of interest. The funders had no role in the design of the study; in the collection, analyses, or interpretation of data; in the writing of the manuscript; or in the decision to publish the results.
References
- Wust, H.; Haller, P.; Wiedemann, G. Experimental Study of the Effect of a Laser Beam on the Morphology of Wood Surfaces. In Proceedings of the Second European Conference on Wood Modification, Göttingen, Germany, 6–7 October 2005. [Google Scholar]
- Haller, P.; Beyer, E.; Wiedemann, G.; Panzner, M.; Wust, H. Experimental Study of the Effect of a Laser Beam on the Morphology of Wood Surfaces. In Proceedings of the First International Conference of the European Society for Wood Mechanics, Lausanne, Switzerland, 19–21 April 2001; p. 459. [Google Scholar]
- Dolan, J.A. Characterization of Laser Modified Surfaces for Wood Adhesion. Master’s Thesis, The Faculty of Virginia Polytechnic Institute, Blacksburg, VA, USA, 2014; 100p. [Google Scholar]
- Kubovský, I.; Kačík, F. Colour and Chemical Changes of the Lime Wood Surface Due to CO2 Laser Thermal Modification. Appl. Surf. Sci. 2014, 321, 261–267. [Google Scholar] [CrossRef]
- Li, R.; He, C.; Wang, X. Effects of Processing Parameters on Mass Loss and Coating Properties of Poplar Plywood During CO2 Laser Modification. Eur. J. Wood Wood Prod. 2022, 4, 899–906. [Google Scholar] [CrossRef]
- Li, R.; He, C.; Xu, W.; Wang, X.A. Prediction of Surface Roughness of CO2 Laser Modified PoplarWood Via Response Surface Methodology. Maderas. Ciencia y Tecnología 2022, 24, 1–12. [Google Scholar] [CrossRef]
- Kúdela, J.; Kubovský, I.; Andrejko, M. Surface Properties of Beech Wood after CO2 Laser Engraving. Coatings 2020, 10, 77. [Google Scholar] [CrossRef]
- Kúdela, J.; Kubovský, I.; Andrejko, M. Influence of irradiation parameters on structure and properties of oak wood surface engraved with a CO2 laser. Materials 2022, 15, 8384. [Google Scholar] [CrossRef]
- Liu, H.; Hu, Q.; Guo, H.; Wu, R.; Zhang, C. Glaze layer induced by femtosecond laser. Surf. Interfaces 2023, 37, 102716. [Google Scholar] [CrossRef]
- Kim, Y.W.; Song, S.H. Efficient Laser Image Engraving by Work Area Sectioning and Multi-laser Head Cooperation: A Conceptual Study. Int. J. Precis. Eng. Manuf. 2023, 24, 1813–1820. [Google Scholar] [CrossRef]
- Guo, Q.; Wu, Z.; Zhang, C.; Yang, C.; Ma, Y.; Xu, F.; Cao, Z. Study on a New Clean Machining Method Instead of Sanding Technology for Wood. Alex. Eng. J. 2021, 60, 2369–2380. [Google Scholar] [CrossRef]
- Gurău, L.; Petru, A.; Varodi, A.; Timar, M.C. The Influence of CO2 Laser Beam Power Output and Scanning Speed on Surface Roughness and Colour Changes of Beech (Fagus sylvatica). BioResources 2017, 12, 7395–7412. [Google Scholar] [CrossRef]
- Gurău, L.; Coşereanu, C.; Paiu, I. Comparative Surface Quality of Larch (Larix decidua Mill.) Fretwork Patterns Cut through by CNC Routing and by Laser. Appl. Sci. 2021, 11, 6875. [Google Scholar] [CrossRef]
- Gurău, L.; Petru, A. The Influence of CO2 Laser Beam Power Output and Scanning Speed on Surface Quality of Norway Maple (Acer platanoides). BioResources 2018, 13, 8168–8183. [Google Scholar] [CrossRef]
- Gurău, L.; Coșereanu, C.; Timar, M.C.; Lungu, A.; Condoroţeanu, C.D. Comparative Surface Quality of Maple (Acer pseudoplatanus) Cut through by CNC Routing and by CO2 Laser at Different Angles as Related to the Wood Grain. Coatings 2022, 12, 1982. [Google Scholar] [CrossRef]
- Kamperidou, V. Chemical and Structural Characterization of Poplar and Black Pine Wood Exposed to Short Thermal Modification. Drv. Ind. 2021, 72, 155–167. [Google Scholar] [CrossRef]
- Kačík, F.; Kubovský, I. Chemical Changes of Beech Wood Due to CO2 Laser Irradiation. J. Photochem. Photobiol. A 2011, 222, 105–110. [Google Scholar] [CrossRef]
- Petutschnigg, A.; Stöckler, M.; Steinwendner, F.; Schnepps, J.; Gütler, H.; Blinzer, J.; Holzer, H.; Schnabel, T. Laser Treatment of Wood Surfaces for Ski Cores: An Experimental Parameter Study. Adv. Mater. Sci. Eng. 2013, 2013, 123085. [Google Scholar] [CrossRef]
- Li, R.; Xu, W.; Wang, X.; Wang, C. Modeling and Predicting of the Color Changes of Wood Surface During CO2 Laser Modification. J. Clean. Prod. 2018, 183, 818–823. [Google Scholar] [CrossRef]
- Gochev, Z.; Vitchev, P. Colour modifications in plywood by different modes of CO2 laser engraving. Acta Fac. Xylologiae Zvolen 2022, 64, 77–86. [Google Scholar] [CrossRef]
- Chernykh, M.; Zykova, M.; Stollmann, V.; Gilfanov, M. Influence effect of wood laser engraving mode on aesthetic perception of images. Acta Fac. Xylologiae Zvolen 2022, 64, 87–96. [Google Scholar] [CrossRef]
- Li, R.; He, C.; Chen, Y.; Wang, X. Effects of Laser Parameters on the Width of Color Change Area of Poplar Wood Surface During a Single Irradiation. Eur. J. Wood Wood Prod. 2021, 79, 1109–1116. [Google Scholar] [CrossRef]
- Panzner, M.; Wiedemann, G.; Henneberg, K.; Fischer, R.; Wittke, T.; Dietsch, R. Experimental Investigation of the Laser Ablation Process on Wood Surfaces. Appl. Surf. Sci. 1998, 127–129, 787–792. [Google Scholar] [CrossRef]
- Lin, C.J.; Wang, Y.C.; Lin, L.D.; Chiou, C.R.; Wang, Y.N.; Tsai, M.J. Effects of Feed Speed Ratio and Laser Power on Engraved Depth and Color Difference of Moso Bamboo Lamina. J. Mater. Process. Technol. 2008, 198, 419–425. [Google Scholar] [CrossRef]
- Nath, S.; Waugh, D.G.; Ormondroyd, G.A.; Spear, M.J.; Pitman, A.J.; Sahoo, S.; Mason, P. CO2 Laser Interactions with Wood Tissues During Single Pulse Laser-incision. Opt. Laser Technol. 2020, 126, 106069. [Google Scholar] [CrossRef]
- Li, R.; He, C.; Wang, X. Evaluation and Modeling of Processability of Laser Removal Technique for Bamboo Outer Layer. JOM 2021, 73, 2423–2430. [Google Scholar] [CrossRef]
- Arai, I.; Kawasumi, H. Thermal analysis of laser machining in wood III. J. Jpn. Wood Res. Soc. Mokuzai Gakkaishi 1980, 26, 773–782. [Google Scholar]
- Barcikowski, S.; Koch, G.; Odermatt, J. Characterisation and modification of the heat affected zone during laser material processing of wood and wood composites. Holz Roh Werkst. 2006, 64, 94–103. [Google Scholar] [CrossRef]
- Kučerová, V.; Lagaňa, R.; Hýrošová, T. Changes in chemical and optical properties of silver fir (Abies alba L.) wood due to thermal treatment. J. Wood Sci. 2019, 65, 21–31. [Google Scholar] [CrossRef]
- Yang, C.; Jiang, T.; Yu, Y.; Bai, Y.; Song, M.; Miao, Q.; Ma, Y.; Liu, J. Water-jet Assisted Nanosecond Laser Microcutting of Northeast China Ash Wood. Experimental Study. BioResources 2019, 14, 128–138. [Google Scholar] [CrossRef]
- Jurek, M.; Wagnerová, R. Laser Beam Calibration for Wood Surface Colour Treatment. Eur. J. Wood Wood Prod. 2021, 79, 1097–1107. [Google Scholar] [CrossRef]
- Reinprecht, L.; Vidholdová, Z. The Impact of a CO2 Laser on the Adhesion and Mold Resistance of a Synthetic Polymer Layer on a Wood Surface. Forests 2021, 12, 242. [Google Scholar] [CrossRef]
- Lungu, A.; Timar, M.C.; Beldean, E.C.; Georgescu, S.V.; Co¸sereanu, C. Adding Value to Maple (Acer pseudoplatanus) Wood Furniture Surfaces by Different Methods of Transposing Motifs from Textile Heritage. Coatings 2022, 12, 1393. [Google Scholar] [CrossRef]
- Kúdela, J.; Andrejko, M.; Mišíková, O. Wood Surface Morphology Alteration Induced by Engraving with CO2 Laser Under Different Raster Density Values. Acta Fac. Xylologiae Zvolen 2021, 63, 35–47. [Google Scholar] [CrossRef]
- Moliński, W.; Roszyk, E.; Jabloński, A.; Puszyński, J.; Cegiela, J. Mechanical parameters of thermally modified ash wood determined by compression in radial direction. Maderas. Cienc. Tecnol. 2016, 18, 577–586. [Google Scholar] [CrossRef]
- Kubovský, I.; Kačíková, D.; Kačík, F. Structural Changes of Oak Wood Main Components Caused by Thermal Modification. Polymers 2020, 12, 485. [Google Scholar] [CrossRef] [PubMed]
- Nada, A.M.A.; Youssef, M.A.; Sha_ei, K.A.; Aalah, A.M. Infrared spectroscopy of some treated lignins. Polym. Degrad. Stabil. 1998, 62, 157–163. [Google Scholar] [CrossRef]
- Nguila Inari, G.; Pétrissans, M.; Gerardin, P. Chemical reactivity of heat-treated wood. Wood Sci. Technol. 2006, 41, 157. [Google Scholar] [CrossRef]
- Esteves, B.; Marques, A.V.; Domingos, I.; Pereira, H. Chemical changes of heat treated pine and eucalypt wood monitored by FTIR. Maderas. Ciencia y Tecnología 2013, 15, 245–258. [Google Scholar] [CrossRef]
- Colom, X.; Carrillo, F.; Nogués, F.; Garriga, P. Structural analysis of photodegraded wood by means of FTIR spectroscopy. Polym. Degrad. Stabil. 2003, 80, 543–549. [Google Scholar] [CrossRef]
- Lagaňa, R.; Csiha, C.; Horváth, N.; Tolvaj, L.; Andor, T.; Kúdela, J.; Németh, R.; Kačík, F.; Ďurkovič, J. Surface properties of thermally treated European beech wood studied by PeakForce Tapping atomic force microscopy and Fourier-transform infrared spectroscopy. Holzforschung 2021, 75, 56–64. [Google Scholar] [CrossRef]
- Chen, Y.; Gao, J.; Fan, Y.; Tshabalala, M.A.; Stark, N.M. Heat-induced chemical and color changes of extractive-free black locust (Robinia pseudoacacia) wood. BioResources 2012, 7, 2236–2248. [Google Scholar] [CrossRef]
- González-Peña, M.M.; Curling, S.F.; Hale, M.D. On the e_ect of heat on the chemical composition and dimensions of thermally-modified wood. Polym. Degrad. Stabil. 2009, 94, 2184–2193. [Google Scholar] [CrossRef]
- Bhagia, S.; Ďurkovič, J.; Lagaňa, R.; Kardošová, M.; Kačík, F.; Cernescu, A.; Schäfer, P.; Yoo, C.G.; Ragauskas, A.J. Nanoscale FTIR and Mechanical Mapping of Plant Cell Walls for Understanding Biomass Deconstruction. ACS Sustain. Chem. Eng. 2022, 10, 3016–3026. [Google Scholar] [CrossRef]
- Popescu, M.C.; Froidevaux, J.; Navi, P.; Popescu, C.M. Structural modifications of Tilia cordata wood during heat treatment investigated by FT-IR and 2D IR correlation spectroscopy. J. Mol. Struct. 2013, 1033, 176–186. [Google Scholar] [CrossRef]
- Kačík, F.; Luptáková, J.; Šmíra, P.; Nasswettrová, A.; Kačíková, D.; Vacek, V. Chemical alterations of pine wood lignin during heat sterilization. BioResources 2016, 11, 3442–3452. [Google Scholar] [CrossRef]
- Zhang, P.; Wie, Y.; Liu, Y.; Gao, J.; Chen, Y.; Fan, Y. Heat-Induced Discoloration of Chromophore Structures 402 in Eucalyptus Lignin. Materials 2018, 11, 1686. [Google Scholar] [CrossRef] [PubMed]
- Boukir, A.; Fellak, S.; Doumenq, P. Structural characterization of Argania spinosa Moroccan wooden artifacts during natural degradation progress using infrared spectroscopy (ATR-FTIR) and X-Ray diffraction (XRD). Heliyon 2019, 5, E02477. [Google Scholar] [CrossRef] [PubMed]
- Weiland, J.J.; Guyonnet, R. Study of chemical modifications and fungi degradation of thermally modified wood using DRIFT spectroscopy. Holz Roh Werkst. 2003, 61, 216–220. [Google Scholar] [CrossRef]
- Popescu, M.C.; Gazacu, G.; Singurel, G.; Vasile, C. Study of the process of the water desorption from lignins. Rom. J. Phys. 2006, 51, 277–283. Available online: https://www.academia.edu/4749147/Study_of_the_process_of_the_water_desorption_from_lignins (accessed on 24 July 2022).
- Bourgois, J.; Bartholin, M.C.; Guyonnet, R. Thermal treatment of wood: Analysis of the obtained product. Wood Sci. Technol. 1989, 23, 303–310. [Google Scholar] [CrossRef]
- Faix, O. Fourier transform infrared spectroscopy. In Methods in Lignin Chemistry; Lin, S.Y., Dence, C.W., Eds.; Springer: Berlin, Germany, 1992; pp. 83–109. [Google Scholar]
- Ciolacu, D.; Ciolacu, F.; Popa, V.I. Amorphous cellulose-structure and characterization. Cell. Chem. Technol. 2011, 45, 13–21. Available online: https://www.researchgate.net/publication/279897864_Amorphous_cellulose_-_Structure_and_characterization (accessed on 16 March 2020).
- Allegretti, O.; Travan, L.; Cividini, R. Drying Techniques to Obtain White Beech. In Proceedings of the Wood EDG Conference, Bled, Slovenia, 23 April 2009; Available online: http://timberdry.net/downloads/EDG-SeminarBled/Presentation/EDG (accessed on 25 May 2022).
Figure 1.
Wood surface engraving with a CM-1309 CO2 laser. (a) Specimen´s radial surface; (b) engraving process.
Figure 1.
Wood surface engraving with a CM-1309 CO2 laser. (a) Specimen´s radial surface; (b) engraving process.

Figure 2.
Wood mass loss, Δm, in dependence on the total irradiation dose, H, in spruce wood.

Figure 3.
Spruce wood engraved with a CO2 laser performing at a power of 8% (11 W) and a raster density of 20 mm−1. (a) Radial surface, (b) transverse cut and (c) annual ring detail after engraving.
Figure 3.
Spruce wood engraved with a CO2 laser performing at a power of 8% (11 W) and a raster density of 20 mm−1. (a) Radial surface, (b) transverse cut and (c) annual ring detail after engraving.

Figure 4.
Roughness profile measured perpendicular to the grain course, before and after engraving with a CO2 laser performing at a power (Pe) of 8% (11 W) and a raster density (n) of 20 mm−1.
Figure 4.
Roughness profile measured perpendicular to the grain course, before and after engraving with a CO2 laser performing at a power (Pe) of 8% (11 W) and a raster density (n) of 20 mm−1.

Figure 5.
Roughness profile (green curve) measured perpendicular to the grain course, after engraving with a CO2 laser performing at a Pe of 16% (22 W) and a n of 30 mm−1.
Figure 5.
Roughness profile (green curve) measured perpendicular to the grain course, after engraving with a CO2 laser performing at a Pe of 16% (22 W) and a n of 30 mm−1.

Figure 6.
Dependence of roughness parameters Ra and Rz on laser raster density in engraved wood surfaces at laser power vales of 8, 12 and 16%. (a) Parallel to the grain; (b) perpendicular to the grain.
Figure 6.
Dependence of roughness parameters Ra and Rz on laser raster density in engraved wood surfaces at laser power vales of 8, 12 and 16%. (a) Parallel to the grain; (b) perpendicular to the grain.

Figure 7.
Dependence of roughness parameters Ra and Rz on wood mass loss.

Figure 8.
Microscopic spruce wood slides. (a) and (b) Transversal cuts; (c) radial surface.

Figure 9.
FTIR spectra of spruce wood surface engraved with CO2 laser at 11 W power.

Figure 10.
FTIR spectra of spruce wood surface engraved with CO2 laser at 22 W power.

Figure 11.
CO2 laser power and raster density influencing colour differences, ΔL*, Δa*, Δb and ΔE*, in spruce wood.
Figure 11.
CO2 laser power and raster density influencing colour differences, ΔL*, Δa*, Δb and ΔE*, in spruce wood.

Figure 12.
Dependence of the colour values, L*, a*, b* and ΔE*, in spruce wood on the total irradiation dose, H, applied.
Figure 12.
Dependence of the colour values, L*, a*, b* and ΔE*, in spruce wood on the total irradiation dose, H, applied.


Table 1.
Irradiation dose supplied per surface unit area, corresponding to specific laser power and raster density.
Table 1.
Irradiation dose supplied per surface unit area, corresponding to specific laser power and raster density.
| Power [%] | 8 | 12 | 16 |
| Power [W] | 11 | 16.5 | 22 |
| Raster density [mm−1] | Irradiation dose H [J∙cm−2] | ||
| 2 | 6.17 | 9.26 | 12.34 |
| 5 | 15.42 | 23.14 | 30.86 |
| 10 | 30.84 | 46.28 | 61.71 |
| 20 | 61.68 | 92.57 | 123.43 |
| 30 | 92.52 | 138.85 | 185.15 |
Table 2.
Basic statistical characteristics for roughness parameters of spruce wood engraved with a laser performing under different irradiation conditions.
Table 2.
Basic statistical characteristics for roughness parameters of spruce wood engraved with a laser performing under different irradiation conditions.
| Raster Density [mm−1] | Basic Statistical Character. | Laser Power 8% | Laser Power 12% | Laser Power 16% | |||
|---|---|---|---|---|---|---|---|
| Roughness Parameters | |||||||
| Ra | Rz | Ra | Rz | Ra | Rz | ||
| [µm] | |||||||
| Parallel to the Grain | |||||||
| Reference | 7.25 | 50.73 | 7.25 | 50.73 | 7.25 | 50.73 | |
| s | 2.86 | 21.13 | 2.86 | 21.13 | 2.86 | 21.13 | |
| 2 | 11.41 | 73.26 | 8.58 | 62.99 | 10.28 | 77.60 | |
| s | 3.27 | 21.34 | 3.86 | 30.40 | 3.58 | 32.59 | |
| 5 | 21.66 | 107.83 | 13.90 | 93.52 | 12.03 | 77.35 | |
| s | 8.80 | 38.50 | 5.60 | 40.38 | 4.10 | 20.12 | |
| 10 | 27.67 | 180.31 | 25.02 | 167.35 | 27.23 | 179.07 | |
| s | 8.13 | 44.99 | 8.55 | 55.40 | 10.34 | 58.68 | |
| 20 | 28.34 | 185.38 | 34.36 | 231.88 | 41.18 | 203.08 | |
| s | 9.74 | 63.07 | 11.70 | 62.20 | 1.89 | 23.51 | |
| 30 | 36.27 | 231.14 | 37.26 | 243.36 | 44.34 | 245.16 | |
| s | 9.69 | 60.18 | 2.54 | 24.67 | 5.19 | 32.18 | |
| Perpendicular to the grain | |||||||
| Reference | 11.64 | 89.32 | 11.64 | 89.32 | 11.64 | 89.32 | |
| s | 1.58 | 19.20 | 1.58 | 19.20 | 1.58 | 19.20 | |
| 2 | 37.85 | 214.36 | 40.84 | 230.39 | 45.15 | 241.00 | |
| s | 1.34 | 16.32 | 2.27 | 17.22 | 2.01 | 15.14 | |
| 5 | 44.34 | 229.59 | 42.29 | 239.17 | 46.52 | 254.77 | |
| s | 2.17 | 22.33 | 2.23 | 23.31 | 2.68 | 27.13 | |
| 10 | 103.72 | 497.03 | 117.57 | 532.06 | 170.12 | 766.84 | |
| s | 18.18 | 76.13 | 20.86 | 56.64 | 18.24 | 46.68 | |
| 20 | 210.73 | 903.06 | 283.62 | 1074.25 | 310.24 | 1122.00 | |
| s | 34.97 | 103.13 | 9.91 | 31.93 | 5.80 | 18.73 | |
| 30 | 273.03 | 1132.5 | 320.25 | 1245.48 | 389.88 | 1433.28 | |
| s | 17.56 | 70.12 | 8.27 | 37.69 | 7.26 | 46.22 | |
The values of arithmetic mean, , and standard deviation, s, were each calculated based on 60 measurements. The “Reference” is an untreated surface.
Table 3.
Basic statistical characteristics of L*, a* and b* in engraved spruce wood surfaces with a CO2 laser.
Table 3.
Basic statistical characteristics of L*, a* and b* in engraved spruce wood surfaces with a CO2 laser.
| Colour Coordinate | Basic Statistical Character | Power 8% | |||||
|---|---|---|---|---|---|---|---|
| Raster Density [mm−1] | |||||||
| Reference | 2 | 5 | 10 | 20 | 30 | ||
| L* | 84.93 | 78.14 | 68.03 | 65.93 | 54.99 | 48.48 | |
| s | 0.98 | 0.96 | 1.04 | 1.82 | 2.43 | 1.48 | |
| a* | 3.23 | 4.79 | 8.19 | 8.23 | 9.84 | 10.19 | |
| s | 0.39 | 0.34 | 0.31 | 0.61 | 0.51 | 0.45 | |
| b* | 19.53 | 25.02 | 32.37 | 33.54 | 32.00 | 30.45 | |
| s | 0.99 | 0.61 | 0.83 | 0.91 | 1.64 | 0.63 | |
| Visualisation of discolouration of specimens |  | ||||||
| Power 12% | |||||||
| Raster density [mm−1] | |||||||
| Reference | 2 | 5 | 10 | 20 | 30 | ||
| L* | 84.93 | 77.22 | 66.40 | 59.99 | 49.57 | 44.00 | |
| s | 0.98 | 1.45 | 1.17 | 3.72 | 2.55 | 2.06 | |
| a* | 3.23 | 4.86 | 8.29 | 9.25 | 10.33 | 9.31 | |
| s | 0.39 | 0.31 | 0.22 | 0.76 | 0.45 | 0.52 | |
| b* | 19.53 | 24.84 | 31.43 | 33.24 | 30.83 | 27.18 | |
| s | 0.99 | 0.37 | 0.41 | 0.98 | 1.43 | 1.60 | |
| Visualisation of discolouration of specimens |  | ||||||
| Power 16% | |||||||
| Raster density [mm−1] | |||||||
| Reference | 2 | 5 | 10 | 20 | 30 | ||
| L* | 84.93 | 74.84 | 62.52 | 59.09 | 46.54 | 41.27 | |
| s | 0.98 | 0.66 | 3.79 | 3.38 | 2.32 | 2.15 | |
| a* | 3.23 | 5.33 | 8.78 | 9.29 | 9.98 | 9.45 | |
| s | 0.39 | 0.37 | 0.45 | 0.35 | 0.56 | 0.29 | |
| b* | 19.53 | 25.53 | 31.46 | 33.22 | 29.66 | 26.84 | |
| s | 0.99 | 0.61 | 1.05 | 0.98 | 1.52 | 0.97 | |
| Visualisation of discolouration of specimens |  | ||||||
Disclaimer/Publisher’s Note: The statements, opinions and data contained in all publications are solely those of the individual author(s) and contributor(s) and not of MDPI and/or the editor(s). MDPI and/or the editor(s) disclaim responsibility for any injury to people or property resulting from any ideas, methods, instructions or products referred to in the content. |
© 2023 by the authors. Licensee MDPI, Basel, Switzerland. This article is an open access article distributed under the terms and conditions of the Creative Commons Attribution (CC BY) license (https://creativecommons.org/licenses/by/4.0/).
Share and Cite
MDPI and ACS Style
Kúdela, J.; Andrejko, M.; Kubovský, I. The Effect of CO2 Laser Engraving on the Surface Structure and Properties of Spruce Wood. Coatings 2023, 13, 2006. https://0-doi-org.brum.beds.ac.uk/10.3390/coatings13122006
AMA Style
Kúdela J, Andrejko M, Kubovský I. The Effect of CO2 Laser Engraving on the Surface Structure and Properties of Spruce Wood. Coatings. 2023; 13(12):2006. https://0-doi-org.brum.beds.ac.uk/10.3390/coatings13122006
Chicago/Turabian StyleKúdela, Jozef, Michal Andrejko, and Ivan Kubovský. 2023. "The Effect of CO2 Laser Engraving on the Surface Structure and Properties of Spruce Wood" Coatings 13, no. 12: 2006. https://0-doi-org.brum.beds.ac.uk/10.3390/coatings13122006
Note that from the first issue of 2016, this journal uses article numbers instead of page numbers. See further details here.