Article

Microstructure Characterization and Strengthening Mechanism Analysis of X100 Pipeline Steel

1
School of Metallurgical Engineering, Anhui University of Technology, Maanshan 243002, China
2
State Key Laboratory of Vanadium and Titanium Resources Comprehensive Utilization, Pangang Group Research Institute Co., Ltd., Panzhihua 617000, China
3
China Oil & Gas Pipeline Network Corporation, Beijing 100013, China
4
Research Institute of CNPC Bohai Petroleum Equipment Manufacturing Co., Ltd., Tianjin 300457, China
5
Collaborative Innovation Center for Steel Commonality, University of Science and Technology Beijing, Beijing 100083, China
6
Carbon Neutral lnnovation Institute, University of Science and Technology Beijing, Beijing 100083, China
7
School of Petroleum Engineering, Southwest Petroleum University, Chengdu 610500, China
8
Faculty of Metallurgical and Energy Engineering, Kunming University of Science and Technology, Kunming 650093, China
*
Author to whom correspondence should be addressed.
Submission received: 7 March 2023 / Revised: 27 March 2023 / Accepted: 28 March 2023 / Published: 30 March 2023

Abstract

:
The strengthening mechanism of X100 high steel grade pipeline steel, including grain boundary strengthening, solution strengthening, precipitation strengthening, dislocation strengthening, and texture strengthening, was analyzed by the technics of scanning electron microscopy (SEM), electron backscattered diffraction (EBSD), transmission electron microscopy (TEM), X-ray diffraction (XRD), physicochemical phase analysis, and so on. The results showed that the tested steel had a mixed structure of granular bainite and lath bainite, the average effective grain size was refined to about 1 μm by severe hot plastic deformation, the dislocation density was as high as 1.74 × 10¹⁵/m2, and the second phase precipitation was mainly (Ti, Nb)(C, N) in submicron scale and nanoscale NbC. Through orientation distribution function (ODF) orientation analysis, it was found that the tested steel had obvious anisotropy and had a strong rolling direction (RD) texture along the rolling direction compared with the 30° direction: {115}<110> and {113}<110>. After the quantitative analysis of strengthening mechanisms, it was found that the highest strengthening increment was caused by high-density dislocations in bainite of about 268 MPa, while the lowest strengthening increment was induced by precipitation particles of about 31 MPa.

1. Introduction

Since the 1990s of the 20th century, due to the successive discoveries of some super-large and world-class oil and gas fields, the world pipeline industry has entered a new period of development. During this period, efficient transport and safe operation at the same time are top priorities. Coupled with the gradual improvement of natural gas long-distance pipeline transportation efficiency, pipeline transportation pressure is also increasing. Moreover, under the consideration of safety, stability, high pressure, and economy, X100 pipeline steel is one of the best choices [1].
From X42, X52 to X70, X80 and then to X100, X120 steel, the yield strength of pipeline steel has doubled, but the composition system of low-alloy steel has no essential difference, only a slight content change of alloying elements [2]. There are usually four strengthening methods for metal polycrystalline materials: solution strengthening, grain boundary strengthening, dislocation strengthening, and precipitation strengthening, so the strength can be upgraded by relying on the match of different.
Strengthening mechanisms [3,4,5,6]. At present, the microstructure of pipeline steel with X52 strength grade and below is mainly “polygonal ferrite + pearlite”, with a carbon content of <0.12 wt.% and manganese content of <1.4 wt.%. After multi-pass hot rolling, the steel plate was abruptly cooled from the austenite single-phase region to the ferrite + pearlite region by laminar cooling and coiling [7]. Due to the diffusive phase transformation of ferrite, more carbon atoms migrated into austenite, which subsequently transformed into pearlite. So, the interstitial solution carbon content is low in ferrite, and the solution strengthening is limited. Moreover, the dislocation strengthening is also limited due to the low dislocation density of polygonal ferrite is also low due to high-temperature coiling with a slow cooling rate. Additionally, the role of microalloying elements tends to tailor the microstructure rather than provide considerable precipitation strengthening. Fe3C is also a second-phase precipitation but provides a weak strengthening increment, not an effective strengthening method [8]. The main reason locates at the large precipitation size due to the high ripening rate, which mainly depends on the high diffusion coefficient of carbon atoms. Therefore, the strength of X52 and below pipeline steel mainly relies on ferrite grain boundary strengthening, and other strengthening methods, including solution strengthening, precipitation strengthening, and dislocation strengthening also provides some strengthening increment [9].
In order to increase the low strength of X70 and X80 pipeline steel, the low-temperature microstructure of acicular ferrite or bainite was under consideration due to its higher strength than polygonal ferrite. To obtain the low-temperature microstructure, both the combined design of chemical composition and the thermomechanical forming process are selected [10]. For chemical composition design, microalloying elements (Nb, V, Ti) and alloying elements (Mn, Ni, Cr, Mo, Cu, B) are added. Total contents of Nb, V, and Ti are usually lower than 0.1 wt.% when the strength of pipeline steel is lower than X80 grade. Nb, V, and Ti usually have the roles of strengthening in the precipitation state, improving the hardenability, and tailoring microstructure in the solution state [11]. The main role of alloying elements is to increase hardenability and tailor the phase transformation so that the bainite is easier to be obtained. Moreover, the thermomechanical forming process with chemical composition design is helpful to tailor the microstructure types. On the one hand, microalloying elements increased the recrystallization temperature so that more passes appeared at the non-recrystallization region, so-called controlling the cooling. This accumulated deformation causes serious austenite grain distortion, which promotes the ferrite transformation. On the other hand, controlling cooling process changes the microstructure from polygonal ferrite to acicular ferrite and then to bainite, even martensite. This variation increases the dislocation density and refines grain size, which significantly increased the strength from polygonal ferrite to bainite [12].
To develop the X100 pipeline steel, many efforts have been made in terms of chemical composition design and process control. Liu et al. reported that the carbon content of 0.065%, the reheating temperature of 1200 °C, lower final rolling temperature, higher cooling rate, and lower coiling temperature of 350 °C than X80 steel were designed to develop the new-type X100 steel [13]. Finally, the ideal structure of X100 pipeline steel of “granular bainite + lath bainite” can be obtained, and the strength can be greatly improved by dislocation strengthening, fine-grain strengthening, and solid solution strengthening. Regretfully, the industrial window is too small, and the standards for experimental steel composition are too stringent, which has some impact on actual industrial production. In addition, S. Abroad Nafisi conducts a systematic study on the texture and mechanical properties of API X100 steel manufactured by different processes [14]. It is found that the final rolling temperature plays a key role in the texture generation and mechanical properties of X100 steel. The final rolling temperature below Ar3 can form a {332}<113> texture of sufficient strength. When the final rolling temperature is high, not only the percentage content of {332}<113> texture is reduced, but also the strength of {113}<110> texture is decreased. These results are of great significance to the development and optimization of X100 pipeline steel. There is no appropriate model or empirical method to estimate the strength increase brought on by texture strengthening; hence, there has been some debate on the increase in X100 pipeline steel’s strength caused by texture. Fiber-reinforced polymer is used by Hossein Nassiraei to increase the static strength of tubular x-joints [15]. In order to forecast the ultimate strength of x-joints with FRP, therefore, a theoretical formula based on the yield body model is provided after the parameter investigation. The suggested formula has also passed muster with the UK Department of Energy’s acceptance standards.
All of these discoveries have some drawbacks, but they all have a substantial influence on the development and enhancement of X100 pipeline steel. In China, only X80 pipeline steel has been used extensively in engineering, and there are not many studies on the interactions between X100 pipeline steel’s microstructure, mechanical properties, and the strengthening process. Thus, optimizing the chemical composition and process design depends on knowing the strengthening mechanism of X100 pipeline steel. In comparison to other studies on X100 pipeline steel, this work elaborates on a strengthening mechanism that is more systematic and all-encompassing and ties it to actual industrial production.

2. Materials and Methods

The tested steel was made of commercial X100 pipeline steel, has a specified thickness of 15 mm, and is chemically composed as given in Table 1 (mass fraction, weight%). Before microstructure observation, the samples were mechanically sequentially ground by 150#~1000# sandpapers and then were further polished by the polishing machine subsequent with blow-drying. After being etched with a 4% nitric acid alcohol solution, the polished sample was cleaned with water and dried again. The microstructure evolution was observed by FEI Quanta 650 field emission scanning electron microscopy (SEM) equipped with energy dispersive spectrometer (EDS). The specimen was mechanically ground, polished, and electrolytically polished in 10% perchlorate alcohol for electron backscattered diffraction (EBSD) testament (Oxford Nordlys F+). The accelerating voltage of 10 kV, scanning step of 0.25 μm, and scanning area of 100 μm × 100 μm were selected. The effective grain size was evaluated by the linear Intercept method on the high-angle grain boundary over 15°. Transmission electron microscopy (TEM: Tecnai G2F20) equipped with EDS was used to characterize the microstructure, precipitation particles, and large number of dislocations. The TEM samples were first mechanically ground less than 50 μm and punched into a diameter of 3 mm, and then prepared with 10% perchloric acid alcohol and 90% alcohol solution for twin-jet electrolytic polishing with the current of 50–80 mA and a temperature of −20 °C.
Physicochemical phase analysis [16,17] was used to quantify the MC phase. First, a 20 × 80 × 5 mm sheet specimen of the tested steel was electrolyzed in 1% ammonium sulfate solution and 1% citric acid solution, and then the residue in the electrolyte was washed, filtered, and dried for subsequent analysis. Second, the structure of the precipitate was determined by X-ray diffraction (XRD). With Co Kα (λ = 0.1789 nm) as the target, the scanning speed was 2°/min, and the XRD measurement was carried out in the range of 2θ = 35~55°. Finally, the precipitate was redissolved with 5% hydrochloric acid, 1% nitric acid and 1% hydrofluoric acid solution, then diluted with water into a 100 mL volume flask to determine the composition of the precipitate by inductively coupled plasma atomic emission spectrometry (ICP-AES).
Considering that the welding method for X100 pipe application, there was 30° angle between weld and the rolling direction, the mechanical properties in the 30° direction are also very important. Therefore, samples are taken at different angles (0° and 30°) with the rolling direction of the steel plate, and the tensile specimen was mechanically machined according to GB/T228.1-2010 standard. The tensile properties of rolled and 30° samples were measured using the Instron-5958 electronic universal testing machine with a tensile strain rate of 1 × 10⁻³ S−1 and a load rate of 1 mm/min. To reduce random error, two replicates were performed before and after the sample.

3. Results

3.1. Mechanical Properties

The mechanical properties of the tested steel are shown in Table 2. The tensile properties along the rolling direction are as follows: yield strength of 742.5 MPa, tensile strength of 835 MPa, total elongation of 26.5%, and yield ratio of 0.89 was obtained. Along the 30º direction, the yield strength of 705 MPa, the tensile strength of 805 MPa, the total elongation of 29%, and the yield ratio of 29% were obtained. It can be seen that the yield strength was lower, about 40 MPa, the tensile strength was lower, about 30 MPa, while the elongation was slightly higher, showing significant anisotropy.

3.2. Microscopy

According to Figure 1, the experimental steel’s microstructure consists of granular bainite (GB), bainite ferrite (BF), and diffusion distribution martensite austenite (M/A) components. In the high-power scan below 3c, a distinct slatted bundle structure can be seen, with the carbide evenly distributed between the slats, i.e., bainite ferrite slats. The large deformation and accumulation of non-recrystallization zone during the rolling process that results in the slatted structure is a BF structure, which gives X100 pipeline steel ultra-high strength. The GB with ferrite base in the structure is a soft phase relative to the BF structure, which guarantees toughness for X100 pipeline steel.
Figure 2 shows the inverse pole figure (IPF), grain boundary figure, and kernel average misorientation (KAM) figure of the X100 pipeline steel strip along the rolling direction and 30°, in which the thick black line represents the high-angle grain boundary with orientation difference greater than 15° and the red thin line represents the low angle grain boundary with orientation difference of 2~15°.
Through the comparison of Figure 2a,d it can be seen that the two tissues are made up of BF and GB, and as indicated by the markings in the figure, there are many clumped fine grains with irregular grain boundaries. These boundaries are large-angle grain boundaries, which can act as grain segmentation boundaries, resulting in an overall “effective grain size” (in pipeline steel, effective grain size refers to the grain size surrounded by a large-angle interface with adsorption). The KAM diagram Figure 2c,f also reveals that this degree is much lower than that of other areas in the same location, demonstrating that the fine grain is analogous to the soft phase of the matrix structure to guarantee the material’s exceptional strength and toughness.
There are the following two ways for estimating the effective grain size statistics in Figure 2: one is the line intercept method, and the other one depends on the grain boundary angle that is over 15°. The result is listed in Table 3. It shows that the average grain size along the rolling direction was about 0.88 μm, while the average grain size along the 30° direction is about 1.11 μm. The average grain size of the tested steel was different along the horizontal and longitudinal directions using the line intercept method, showing the grains were flattened. The aspect ratio of the rolling direction was about 1.3, while the aspect ratio of the 30° direction was about 1.8, indicating that the tested steel had a certain crystallographic orientation or texture [18].

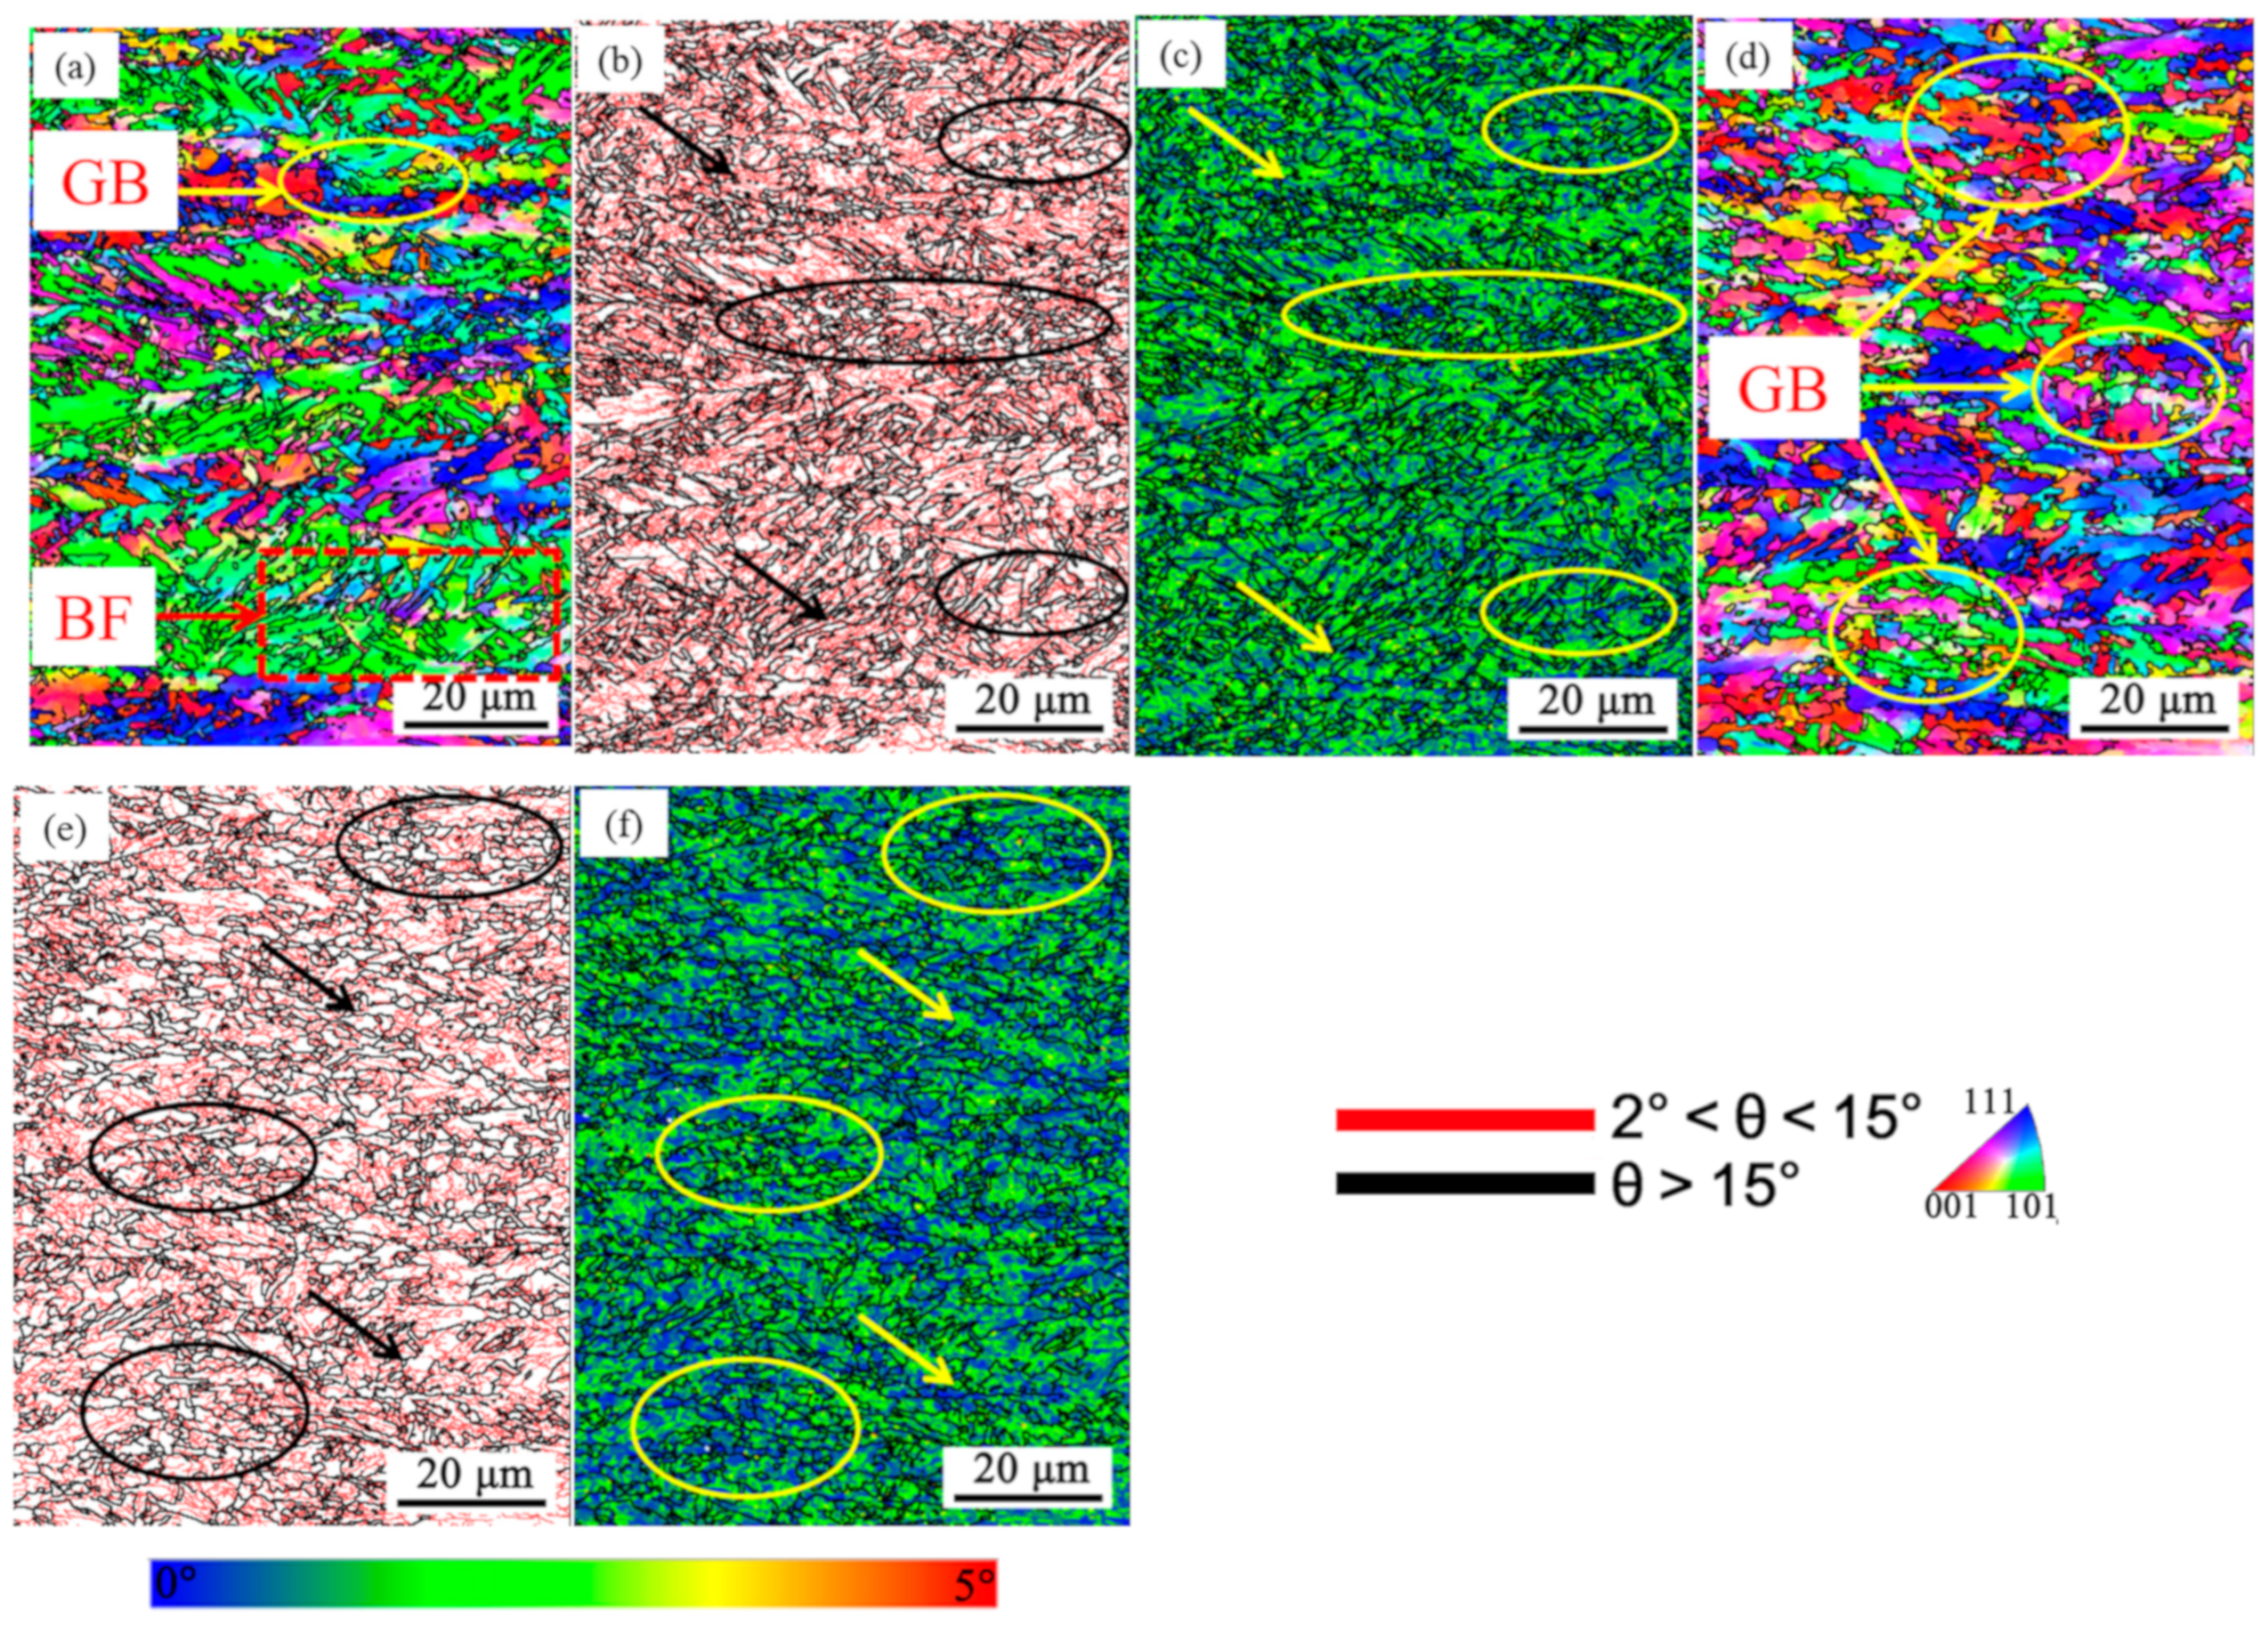
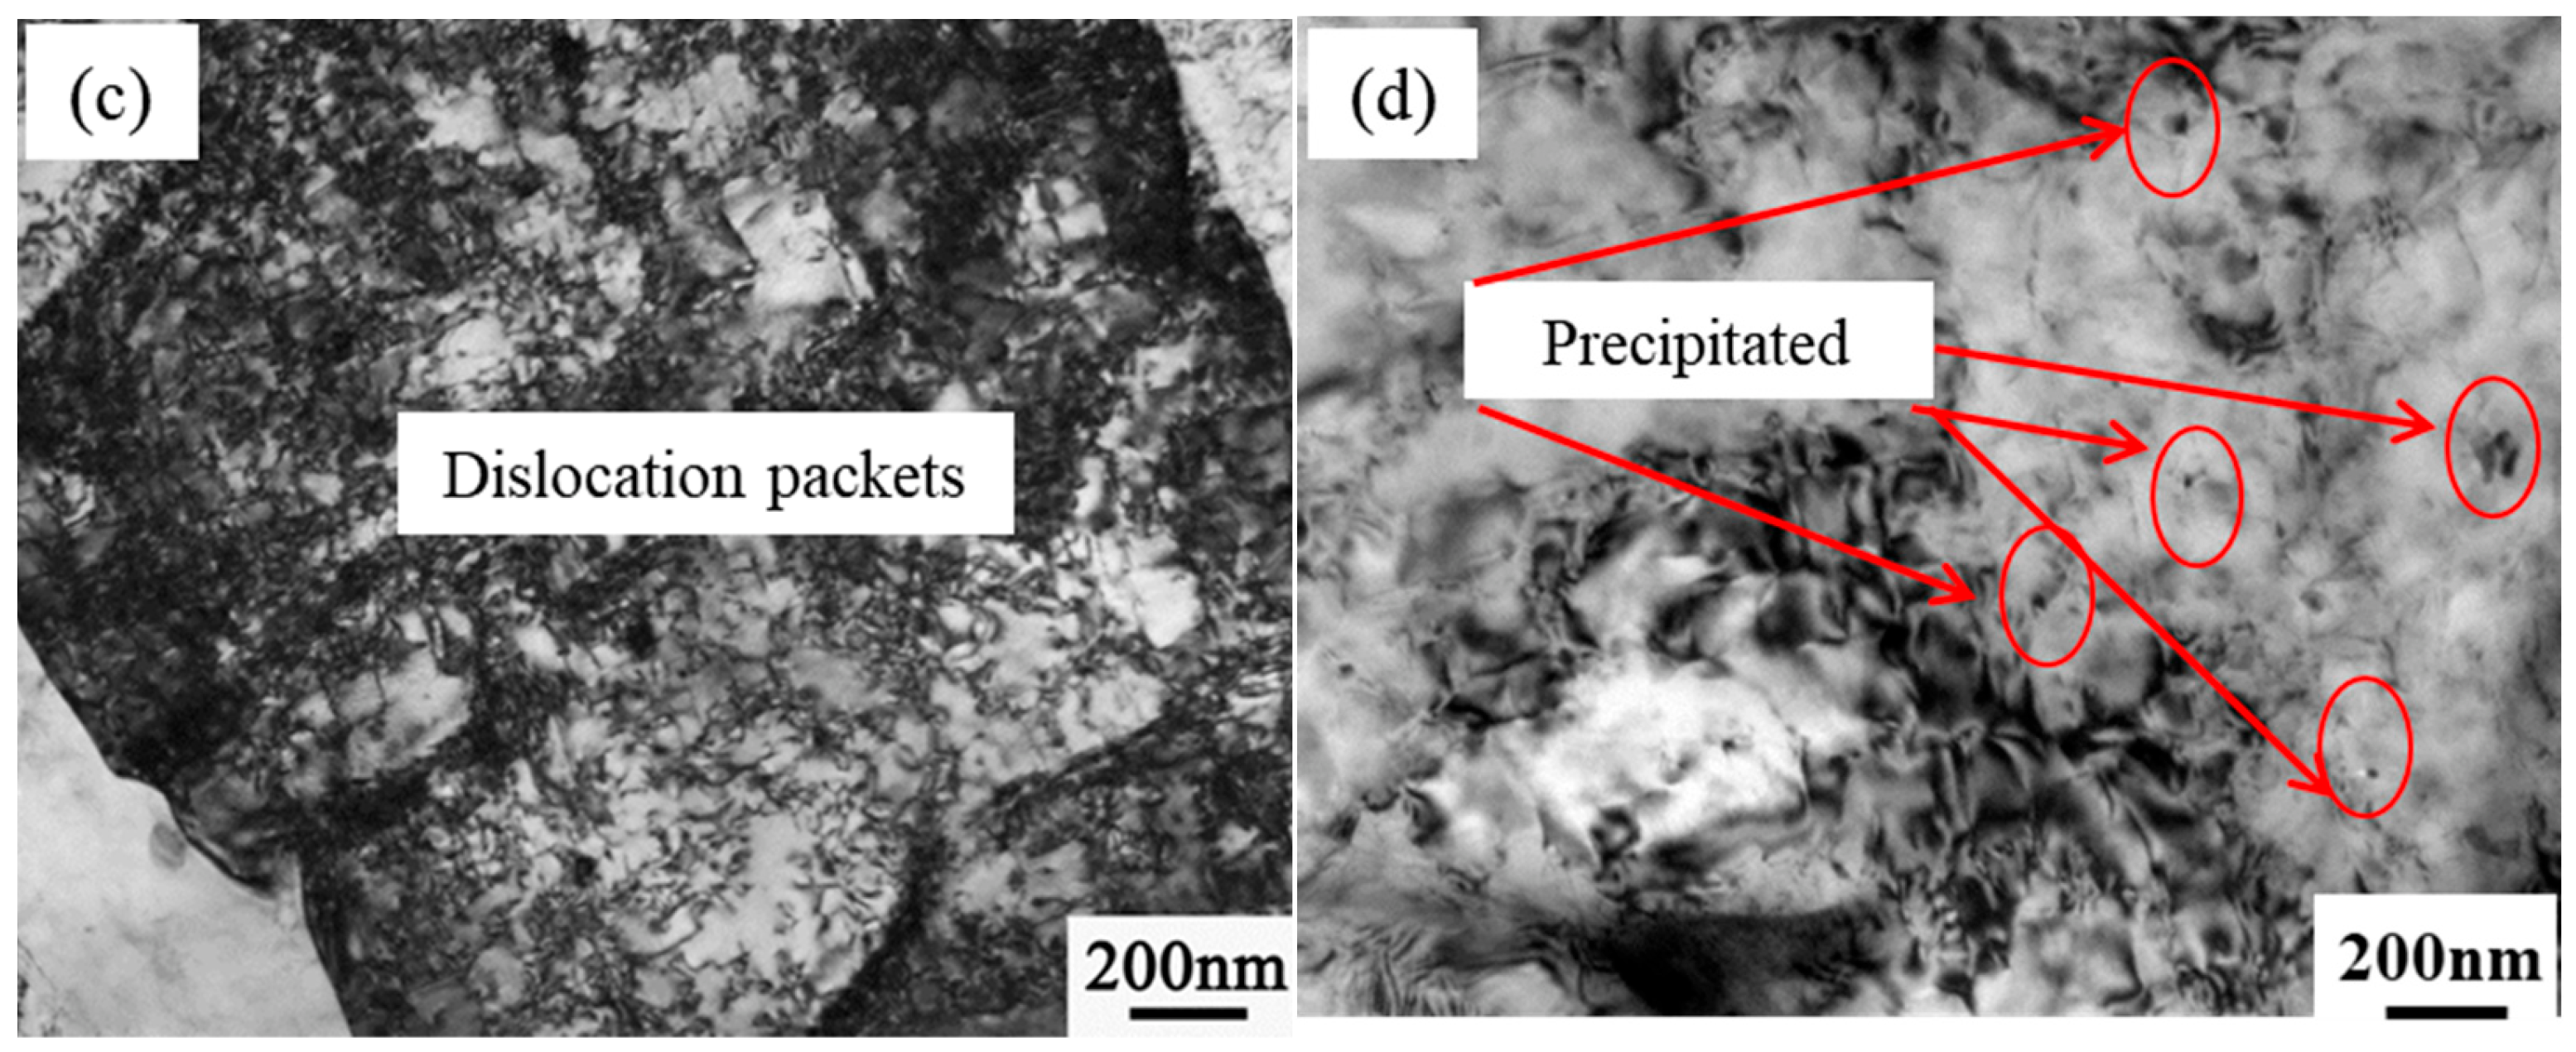
3.3. Microstructure and Dislocation Morphology Characterization

To directly observe the dislocation morphology, the microstructure in X100 pipeline steel was characterized by TEM, as shown in Figure 3. Figure 3a shows the typical lath structure morphology in bainite ferrite, and the lath width was about 300 nm~1000 nm. Large numbers of dislocations are present inside the slats, some of which are entangled to form a substructure, considerably enhancing the strength of X100 pipeline steel [19]. It was granular bainite with a lath structure in Figure 3b. The morphology of slats in granular bainite lacks evident slats bundle morphology, the thickness of the slats is greatly coarsened, M/A components are present in the tissue, and the matrix dislocation density is significantly decreased when compared to BF. Figure 3c,d show the high-density dislocation in granular bainite, leading to the strong elastic stress field. The strong elastic stress field caused the strong interaction so that the dislocations were entangled, forming the cell structure. When the cell structure size increased, the dislocation moving resistance was high, causing the dislocation strengthening. Therefore, it was not hard to infer that the dislocation strengthening was an important part that could not be ignored [20]. In addition, dislocations were accompanied by nanoscale second-phase precipitation. In order to obtain granular bainite microstructure, the coiling temperature was relatively low. Although the thermodynamic conditions of the second phase precipitation based on microalloying elements could be met, the kinetic conditions were difficult to meet, indicating that it is difficult to form the second phase precipitation during the coiling process. Therefore, the microalloying elements nano-precipitated in austenite single-phase region and had a spherical morphology depending on the Cube-on-Cube orientation relationship with austenite. This was consistent with our observations in Figure 3d.

3.4. Second Phase Characterization

The second phase precipitation of the tested steel was studied by carbon extraction replicas, and the results are shown in Figure 4. The precipitation particles were TiC, NbC, and their miscibility. It was noted that both TiC and NbC possessed face-centered cubic structures, and they had similar lattice constants, so they could dissolve each other. TiC and TiN usually had lower solubility products, so they could precipitate at higher temperatures with larger particle sizes, as shown in Figure 4a. The square precipitation particles were about 200 nm and contained most part of Ti and little Nb elements Figure 4b. It could be analyzed that these particles mainly precipitated during steel squid or just solidification. Nb has a lower melting point than Ti, and Ti’s temperature range during precipitation will be much higher than Nb’s throughout the cooling phase [21] product so that they could precipitate at lower temperatures with smaller particle sizes, as shown in Figure 4c. Particles with both several and tens of nanometers were found. The particles with 30 nm were contained more Nb than Ti Figure 4d, indicating that they precipitated at a lower temperature, such as the hot rolling in the recrystallization region. As the steel temperature further decreased to the non-recrystallization region for hot rolling, the precipitation particle size decreased to no more than 10 nm. The lower temperature, the lower diffusion velocity of elements, and the smaller the precipitation size. Different precipitation particles have different precipitation strengthening effects, which will be discussed later.

4. Discussions

The strength of metallic materials is usually the result of several strengthening methods, which can be expressed using Equation (1) [22]. Where σ0 is the lattice resistance of dislocation movement, σsh is the solid solution strengthening increment, σph is the second phase strengthening increment, σdh is the dislocation strengthening increment, σth is the texture strengthening increment, and σg is the grain boundary strengthening increment.
σ s =   σ 0 + σ ss + σ p + σ d + σ t + σ g
The calculated value of σ0 for α-Fe often has a large deviation. Yong Qilong [23] believed that σ0 was about 53 MPa, Gao et al. [24] reported that σ0 was about 50 MPa in medium carbon steel, and Hajy Akbary et al. [25] thought that σ0 was about 41 MPa in martensite steel when calculating the strengthening increment. In our calculation, σ0 of 41 MPa was selected due to the low carbon content and bainite microstructure of the tested steel.

4.1. Solution Strengthening

In order to disrupt the lattice or prevent dislocation movement, heterogeneous atoms must enter the matrix. Solid solution strengthening of interstitial atoms (C and N) is the most significant of these strengthening effects, whereas the strengthening effect of displacement atoms depends on the size difference between the two atoms as follows: the greater the atomic size difference, the more obvious the strengthening effect. The composition of the alloy in the X100 pipeline steel has a direct impact on the strengthening increase in this component. Within a certain content range, the empirical formula for the solution-strengthening increment caused by solution atoms was as follows:
σ ss = 4570 C + 83 S i + 37 M n + 11 M o 30 C r + 38 C u
[i] represented the content of solution element i in 1 wt.%. The content of Al was little, and the strengthening effect was limited, so it was not considered. The atomic radius of Ni was comparable to the atomic radius of Fe and basically did not play a strengthening effect, so a large amount of the literature indicated that its strengthening increment coefficient was 0 MPa. In addition, the solution strengthening of Nb was also not considered. On the one hand, the content was little, and the strengthening was restricted, even if the strengthening increment coefficient was high. On the other hand, most Nb would precipitate so that the Nb in the solution was less. Through physicochemical phase analysis, the content of each element in the MC phase and M3C phase is shown in Table 4 and Table 5.
By subtracting the second phase precipitation results detected in the physicochemical phase analysis by subtracting the average composition of X100 pipeline steel in Table 1, the solid solution element content can be obtained, and the solid solution strengthening result is calculated as 238.3 MPa, as shown in Table 6.

4.2. Second Phase Strengthening

The existence of the second phase prevented the dislocation motion, and there is the following certain coupling relationship with the dislocation: one is that the dislocation bypasses the non-deformable second phase particles, so-called the Orowan bypass mechanism; the other is that the dislocation encounters the deformable second phase, so-called the shear mechanism. When the second phase size was small, the cutting mechanism occurred under the lowest lattice mismatch; Otherwise, the Orowan bypass mechanism would occur because the lattice mismatch would increase as the size increased. The strengthening caused by this mechanism is mainly related to the microalloying elements added to the steel, and the temperature time and temperature before laminar cooling after the finishing stage in the rolling process will affect the precipitation of the main microalloying elements [26]. Since microalloying carbonitrides usually have lower interfacial energy, resulting in a small critical transition size. Even so, the precipitated second phases of several nanometers observed by the above TEM were larger than the critical transition size, so the Orowan bypass mechanism occurred. For ferrite, the precipitation strengthening increment resulting from the bypass mechanism was as follows:
σ p = 8.985 × 10 3 f 1 / 2 d ln 2.417 d
where, σp was the precipitation strengthening increment, MPa; d was the precipitation particle size, and f was the precipitation volume fraction.
In order to accurately obtain the precipitated particle size and precipitation volume fraction, detailed characterization by physicochemical phase analysis was required. The particle size distribution is shown in Figure 5. After calculation, the strengthening increment can be obtained in Figure 5. The root mean square superposition was used for different particle size ranges [27,28], and the final calculation results are shown in Figure 5.

4.3. Dislocation Reinforcement

The key to the calculation of the dislocation strengthening increment of X100 pipeline steel lay in how to quantitatively or semi-quantitatively measure the dislocation density of the test steel. There were many methods for calculating dislocation density using XRD, such as the most widely used WH method, the MWH method considering strain diversity, and the MWA method. The former one had the widest range of adaptation, but the calculation results were high. The calculation results of the latter two were relatively accurate, but they needed more diffraction peaks tested by XRD. As shown in Figure 6, only three diffraction peaks appeared. On the one hand, no larger diffraction angle was selected before measurement; on the other hand, the device’s capabilities were limited. Most importantly, the selected Co target wavelength was larger, resulting in a limited diffraction angle. Therefore, the latter two calculation methods were not suitable, and only the most widely used WH method could be used; the formula was as follows:
Δ K α s D + N b ρ K
where, αs was the shape factor, dimensionless. For spherically symmetric cubic crystals, 0.9 was used. N was the dimensionless constant, about 0.263. ρ is the dislocation density.
K = 2sinθ/λ
where θ was the diffraction angle, λ was the Co target wavelength.
Differentiation of θ on both sides of the equation yielded the following: ΔK = 2Δθ × cosθ/λ, where 2Δθ was full width at half maximum of the diffraction peak. After fitting the diffraction peaks using Jade 6.0 software, some very small motley peaks were eliminated, and the full width at half maximum of the three diffracted peaks was accurately quantified. After substituting the processed data, ΔK and K were found, respectively, and then a linear fit was performed on the two. After obtaining the slope, the dislocation density of 1.74 × 10¹⁵/m2 could be calculated. Finally, the dislocation strengthening of 267.8 MPa was estimated by substituting Equations (3)–(6).

4.4. Texture Strengthening

The deformation texture made the structure anisotropic as follows: the transverse yield strength is higher than the longitudinal yield strength, and the transverse is the most important force direction for pipeline steel. To characterize and analyze various textures in crystals, the spatial orientation distribution function (ODF) was usually used, and it displayed a set of cross-sections along φ2. As shown in Figure 7, the ODF cross-sections of X100 pipeline steel at 30° and rolling direction were exhibited. It was noted that the deformation texture was usually represented by {HKL}<UVW>, where {HKL} was parallel to the rolling surface and <UVW> was parallel to the rolling direction. For body-centered cubic metals, the main textures are distributed on isosections such as φ2 = 45° [29] in orientation space. For different thickness positions in the rolling direction, the texture was mainly a RD texture located between and {115}<110> and {113}<110> in the orientation space, a TD texture between {111}<112> and {332}<113> in the orientation space, and a {001}<110> texture. For different thickness positions in the 30º direction, the texture was mainly an RD texture between {223}<110> and {112}<110> in the orientation space, and also contained weaker {111}<110>, {332}<113> and {001}<100>texture. Comparing Figure 7a–c and Figure 7d–f, the phenomenon was found the following: on the one hand, the overall texture strength in the 30° direction was significantly lower than that in the rolling direction; On the other hand, there were also obvious changes in the texture types in both directions, for example, there was no {001}<110> texture in the 30° direction, and a weaker {001}<100> texture appeared. In general, RD texture usually resulted in anisotropy in strength and toughness; {001}<110> texture would cause embrittlement of the material and reduce the material properties, which was generated by the large deformation of the austenite recrystallization region {001}<100> texture [30]; In contrast, {111}<uvw>, {554}<225> and {332}<113> textures provided uniform angles when cleavage occurred, and so that the {110} crystal faces parallel to the fracture plane were evenly distributed in all directions without causing anisotropy in toughness. It could be seen that the RD texture with higher strength between the orientation space {115}<110> and {113}<110> in the rolling direction compared to the 30° direction made the strength in this direction increase, but the improvement was limited.

4.5. Grain Boundary Strengthening

S. Morito [31] has shown that the strength control unit of low-carbon martensitic steel is martensitic block size, which was defined as effective grain size. The Hall–Petch relationship between strength and grain size usually followed the following formula:
Y S G = 2 α G b 3.35 L D 1 / 2 = k y D 1 / 2
where, G was the shear modulus of elasticity of the crystal, L was the length of the dislocation line, ky was the fine-grained strengthening strength increment coefficient, and D was the effective grain size.
The effective grain size in the above equation was the result of the statistics in Table 3. Huda et al. [32] and Shibata et al. [33] both used a strength increment factor of 0.21 MPa × m0.5 for lath martensitic steel. In this calculation, the increment coefficient of 0.21 MPa × m0.5 was used for calculation, and the calculation results are shown in Table 7.

4.6. Reinforcement Method Superposition

After calculating the above enhancement increments separately, the superposition was carried out in the form of Equations (1) and (2), and the superposition results are shown in Table 8. In fact, there was not only a difference in grain size between the rolling direction and the rolling direction of 30°, but also the difference in dislocation density and the content and size of the precipitation second phase, but the change of this difference was small, so it is not considered. In addition, the main strengthening mechanisms of X100 pipeline steel were a solid solution, fine grain, and dislocation strengthening, which was consistent with the above analysis results.

5. Conclusions

(1)
The microstructure of X100 pipeline steel was a mixed granular bainite and slatted bainite; the average effective grain size reached 1~2.5 μm, the dislocation density was about 1.74 × 10¹⁵/m2, and its grain boundary strengthening was calculated as one of the important ways to improve strength.
(2)
There was a lot of second-phase precipitation. It included a square large-size (Nb, Ti)C second phase with a size of about 100 nm, a spherical NbC second phase with a size of 10~20 nm, and a nanoscale NbC second phase with a size of less than 10 nm, among which the precipitation strengthening of the nanoscale precipitated phase is one of the important ways to improve the strength.
(3)
The texture of the tested steel in the rolling direction was mainly the RD texture located between the orientation space {115}<110> and {113}<110>, the TD texture between {111}<112> and {332}<113> in the orientation space, and the {001}<110> texture. For different thickness positions in the 30ºdirection, the texture was mainly RD texture between {223}<110> and {112}<110> in the orientation space, and also includes weaker {111}<110>, {332}<113> and {001}<100> texture. There is no significant difference between the rolling direction and the 30° texture.
(4)
The strengthening method of X100 pipeline steel was the combined effect of solution strengthening, grain boundary strengthening, dislocation strengthening, and precipitation strengthening. The solution strengthening increment was calculated to be 238.3 MPa. The grain boundary strengthening in the rolling direction was 195.6 Mpa, and the grain boundary strengthening in the rolling direction was 30° with 185.1 Mpa. The dislocation strengthening was about 267.8 Mpa, and the second phase precipitation strengthening was about 30.8 Mpa. After the above strengthening increments were superimposed, the yield strength of the rolling direction was 744.5 Mpa, and the yield strength in the 30° direction was 734 Mpa. This is mainly because the effective grain size in different directions was different, and the yield strength was consistent with the measured value.

Author Contributions

Writing, original draft, X.Y.; Data curation, S.C.; Conceptualization, T.L.; Methodology, Q.M.; Software, G.L.; Writing—review and editing, Z.H.; Visualization, J.G.; Project administration, S.Y. All authors have read and agreed to the published version of the manuscript.

Funding

This research received no external funding.

Institutional Review Board Statement

Not applicable.

Informed Consent Statement

Not applicable.

Data Availability Statement

Not applicable.

Conflicts of Interest

The authors declare no conflict of interest.

References

  1. Belato Rosado, D.; De Waele, W.; Vanderschueren, D.; Hertelé, S. Latest developments in mechanical properties and metallurgical features of high strength line pipe steels. In Proceedings of the 5th International Conference on Sustainable Construction and Design, Ghent, Belgium, 20–21 February 2013; Volume 4. [Google Scholar]
  2. Han, Y.D.; Wang, R.Z.; Wang, H.; Xu, L.Y. Hydrogen embrittlement sensitivity of X100 pipeline steel under different pre-strain. Int. J. Hydrogen Energy 2019, 44, 22380–22393. [Google Scholar] [CrossRef]
  3. Cai, Z.; Mao, X.; Bao, S.; Zhao, G.; Xu, Y. Influence of vanadium microalloying on deformation-induced pearlite transformation of eutectoid steel. Metals 2019, 9, 268. [Google Scholar] [CrossRef] [Green Version]
  4. Hu, S.; Mao, Y.; Liu, X.; Han, E.H.; Hänninen, H. Intergranular corrosion behavior of low-chromium ferritic stainless steel without Cr-carbide precipitation after aging. Corros. Sci. 2020, 166, 108420. [Google Scholar] [CrossRef]
  5. Liang, G.; Tan, Q.; Liu, Y.; Wu, T.; Yang, X.; Tian, Z.; Atrens, A.; Zhang, M.-X. Effect of cooling rate on microstructure and mechanical properties of a low-carbon low-alloy steel. J. Mater. Sci. 2021, 56, 3995–4005. [Google Scholar] [CrossRef]
  6. Muñoz, J.A.; Khelfa, T.; Komissarov, A.; Cabrera, J.M. Ductility and plasticity of ferritic-pearlitic steel after severe plastic deformation. Mater. Sci. Eng. A 2021, 805, 140624. [Google Scholar] [CrossRef]
  7. Martin, L.P.; Switzner, N.; Oneal, O.; Curiel, S.; Anderson, J.; Veloo, P. Quantitative Evaluation of Microstructure to Support Verification of Material Properties in Line-Pipe Steels. In Proceedings of the International Pipeline Conference, Calgary, AB, Canada, 26–30 September 2022; American Society of Mechanical Engineers: Newyork, NY, USA, 2022; Volume 86588, p. V003T05A013. [Google Scholar]
  8. Xiong, Z.; Timokhina, I.; Pereloma, E. Clustering, nano-scale precipitation and strengthening of steels. Prog. Mater. Sci. 2021, 118, 100764. [Google Scholar] [CrossRef]
  9. Cho, L.; Bradley, P.E.; Lauria, D.S.; Martin, M.L.; Connolly, M.J.; Benzing, J.T.; Seo, E.J.; Findley, K.O.; Speer, J.G.; Slifka, A.J. Characteristics and Mechanisms of Hydrogen-Induced Quasi-Cleavage Fracture of Lath Martensitic Steel. Acta Mater. 2021, 206, 116–635. [Google Scholar] [CrossRef]
  10. Soliman, M. Microstructural control and properties optimization of microalloyed pipeline steel. Metals 2020, 10, 1499. [Google Scholar] [CrossRef]
  11. Xu, G.; Gan, X.; Ma, G.; Luo, F.; Zou, H. The development of Ti-alloyed high strength microalloy steel. Mater. Des. 2010, 31, 2891–2896. [Google Scholar] [CrossRef]
  12. Kim, H.S.; Jo, M.; Park, J.Y.; Kim, B.J.; Kim, H.C.; Nam, D.; Kim, B.; Ahn, Y.S. Effects of Ti microalloying on the microstructure and mechanical properties of acicular ferrite casting steel for high-speed railway brake discs. Mater. Sci. Eng. A 2022, 857, 144125. [Google Scholar] [CrossRef]
  13. Liu, Q.Y.; Li, B.; Jia, S.J.; Ren, Y. Toughening mechanism and control technology of high steel grade low temperature pipeline steel. Angang Technol. 2020, 56, 8–17. [Google Scholar]
  14. Nafisi, S.; Arafin, M.; Collins, L.; Szpunar, J. Texture and mechanical properties of API X100 steel manufactured under various thermomechanical cycles. Mater. Sci. Eng. A 2012, 531, 2–11. [Google Scholar] [CrossRef]
  15. Nassiraei, H.; Rezadoost, P. Static capacity of tubular X-joints reinforced with fiber reinforced polymer subjected to compressive load. Eng. Struct. 2021, 236, 112041. [Google Scholar] [CrossRef]
  16. Bösing, I.; Marquardt, G.; Thöming, J. Effect of heat treatment of martensitic stainless steel on passive layer growth kinetics studied by electrochemical impedance spectroscopy in conjunction with the point defect model. Corros. Mater. Degrad. 2020, 1, 77–91. [Google Scholar] [CrossRef] [Green Version]
  17. Wang, X.; Li, Z.; Zhou, S.; Wang, W.; Yong, Q.; Yang, Z.; Shen, J.; Shang, C.; Liu, Q. Precipitation behavior of Ti–Nb–V–Mo quaternary microalloyed high strength fireresistant steel and its influence on mechanical properties. Mater. Sci. Eng. A 2021, 807, 140865. [Google Scholar] [CrossRef]
  18. Després, A.; Zecevic, M.; Lebensohn, R.; Mithieux, J.; Chassagne, F.; Sinclair, C. Contribution of intragranular misorientations to the cold rolling textures of ferritic stainless steels. Acta Mater. 2020, 182, 184–196. [Google Scholar] [CrossRef]
  19. Li, J.; Cao, Z.; Liu, L.; Liu, X.; Peng, J. Effect of microstructure on hardness and wear properties of 45 steel after induction hardening. Steel Res. Int. 2021, 92, 2000540. [Google Scholar] [CrossRef]
  20. Sob, P.B. Enhancing nanocrystalline material yield strength during ARB process by using Solute atoms as reinforcement. IJERT 2020, 13, 2519–2525. [Google Scholar] [CrossRef]
  21. Webel, J.; Herges, A.; Britz, D.; Detemple, E.; Flaxa, V.; Mohrbacher, H.; Mücklich, F. Tracing microalloy precipitation in Nb-Ti HSLA steel during austenite conditioning. Metals 2020, 10, 243. [Google Scholar] [CrossRef] [Green Version]
  22. Duan, L.-N.; Chen, Y.; Liu, Q.-Y.; Jia, S.-J.; Jia, C.-C. Microstructures and mechanical properties of X100 pipeline steel strip. J. Iron Steel Res. Int. 2014, 21, 227–232. [Google Scholar] [CrossRef]
  23. Yong, Q.L. Second Phase in Iron and Steel Materials; Metallurgical Industry Press: Beijing, China, 2006. [Google Scholar]
  24. Gao, G.; Gao, B.; Gui, X.; Hu, J.; He, J.; Tan, Z.; Bai, B. Correlation between microstructure and yield strength of as-quenched and Q&P steels with different carbon content (0.06–0.42 wt.%C). Mater. Sci. Eng. A 2019, 753, 1–10. [Google Scholar]
  25. HajyAkbary, F.; Sietsma, J.; Böttger, A.J.; Santofimia, M.J. An improved X-ray diffraction analysis method to characterize dislocation density in lath martensitic structures. Mater. Sci. Eng. A 2015, 639, 208–218. [Google Scholar] [CrossRef]
  26. Zheng, Y.; Wang, Q.; Zhu, L.; Han, B.; Guo, Z.; Wang, B.; Feng, J.; Lu, S.; Shen, W.; Cao, R. Microstructure evolution and carbide precipitation behavior of microalloyed TS800TB steel during hot rolling and coiling processes. Mater. Sci. Eng. A 2022, 840, 142902. [Google Scholar] [CrossRef]
  27. Chang, K.; Feng, W.; Chen, L.Q. Effect of second-phase particle morphology on grain growth kinetics. Acta Mater. 2009, 57, 5229–5236. [Google Scholar] [CrossRef]
  28. Suwa, Y.; Saito, Y.; Onodera, H. Phase field simulation of grain growth in three dimensional system containing finely dispersed second-phase particles. Scr. Mater. 2006, 55, 407–410. [Google Scholar] [CrossRef]
  29. Yang, X.L.; Xu, Y.B.; Tan, X.D.; Wu, D. Relationships among Crystallographic Texture, Fracture Behavior and Charpy Impact Toughness in API X100 Pipeline Steel. Mater. Sci. Eng. A 2015, 641, 96–106. [Google Scholar] [CrossRef]
  30. Lan, L.; Chang, Z.; Kong, X.; Qiu, C.; Zhao, D. Phase Transformation, Microstructure, and Mechanical Properties of X100 Pipeline Steels Based on TMCP and HTP Concepts. J. Mater. Sci. 2017, 52, 1661–1678. [Google Scholar] [CrossRef]
  31. Morito, S.; Yoshida, H.; Maki, T.; Huang, X. Effect of block size on the strength of lath martensite in low carbon steels. Mater. Sci. Eng. A 2006, 438, 237–240. [Google Scholar] [CrossRef]
  32. Huda, N.; Gianetto, J.; Ding, Y.; Lazor, R.; Gerlich, A.P. Investigation of local tensile strength and ductility properties of an X100 submerged arc seam weld. Mater. Sci. Eng. 2019, 768, 138475. [Google Scholar] [CrossRef]
  33. Shibata, A.; Nagoshi, T.; Sone, M.; Morito, S.; Higo, Y. Evaluation of the Block Boundary and Sub-block Boundary Strengths of Ferrous lath Martensite Using a Micro-bending Test. Mater. Sci. Eng. A 2010, 527, 7538–7544. [Google Scholar] [CrossRef]
Figure 1. Different magnifications of SEM characterizations for high-grade X100 pipeline steel at 1/4 thickness: (a) 2000×; (b) 5000×; (c) 10,000×.
Coatings 13 00706 g001
Figure 2. EBSD Figures of the rolling direction and 30° direction of X100 pipeline steel: (a,d) IPF diagram; (b,e) Large and low angle grain boundary diagrams; (c,f) KAM diagram.
Coatings 13 00706 g002
Figure 3. TEM figures of X100 pipeline steel: (a,b) lath structure with lots of dislocations in bainite ferrite; (c,d) lath and dislocation structures with nanoprecipitations in granular bainite.
Coatings 13 00706 g003aCoatings 13 00706 g003b
Figure 4. TEM figures basing on the carbon extraction replicas of the tested steel: (a) Ti(C, N); (b) NbC precipitation.
Coatings 13 00706 g004aCoatings 13 00706 g004b
Figure 5. The volume percentage of precipitated phase at different scales and its corresponding strength increment in the test steel.
Coatings 13 00706 g005
Figure 6. XRD pattern of X100 high-grade pipeline steel.
Coatings 13 00706 g006
Figure 7. ODF figures under the cross-section of φ2 = 45° in X100 pipeline steel: (ac) the upper, center, and lower parts along the rolling direction; (df) Upper, center, and lower in the 30° direction; (g) Annotation of colors.
Coatings 13 00706 g007
Table 1. Chemical composition of test steel (wt.%).
CSiMnPSCrNiMoCuNbVTi
0.060.271.930.009≤0.0010.290.260.270.270.0890.0270.019
Table 2. Tensile properties of X100 pipeline steel strip.
SampleRt0.5 (MPa)Rm (MPa)Rt0.5/RmA (%)
0°-17458350.8926
0°-27408350.8927
30°-17008050.8728.5
30°-27108050.8829
standard690–840760–990<0.97-
Table 3. Effective grain size of X100 pipeline steel along rolling direction and 30º direction.
Direction>15° (μm)Longitudinal (μm)Transverse (μm)
Rolling direction0.881.031.34
30°1.111.231.82
Table 4. Chemical composition of MC phase tested by physicochemical phase analysis (wt.%).
MoNbTiC*σ
0.0030.0460.0160.010.075
Table 5. Chemical composition of M3C phase tested by physicochemical phase analysis (wt.%).
FeMnCrMoC*σ
0.2240.0060.0030.0040.0170.254
Table 6. Calculation results of solution element content and solution strengthening (wt.%).
CSiMnMoNiCrCuNbTiAlσss
0.0310.282.0140.2730.270.2770.280.04500.026238.3 MPa
Table 7. Calculation results of grain boundary strengthening in different directions.
DirectionLocationAverage
(μm)
Strength
(MPa)
Average Strength
(MPa)
Rolling directionUpper edge1.25187.8195.6
Center1.44175
Lower edge0.88223.9
30° directionUpper edge1.28185.6185.1
Center1.52170.3
Lower edge1.11199.3
Table 8. Yield strength calculation results and measured results.
Directionσ0 (MPa)σss (MPa)σg (MPa)σp (MPa)σd (MPa)σyCalculation (MPa)σy Measured (MPa)
Rolling direction41238.3195.630.8267.8744.5750
30° direction41238.3185.130.8267.8734.0725
Disclaimer/Publisher’s Note: The statements, opinions and data contained in all publications are solely those of the individual author(s) and contributor(s) and not of MDPI and/or the editor(s). MDPI and/or the editor(s) disclaim responsibility for any injury to people or property resulting from any ideas, methods, instructions or products referred to in the content.

