
High-Temperature Oxidation Properties of Ti-Hf-Mo-Ta-Nb-B Composite Coating Deposited on Ti60 Alloy with Laser Cladding

1
State Key Laboratory of Materials Processing and Die and Mould Technology, Huazhong University of Science and Technology, Wuhan 430074, China
2
Key Laboratory of Laser Technology and Optoelectronic Functional Materials of Hainan Province, Hainan Normal University, Haikou 571158, China
*
Author to whom correspondence should be addressed.
Coatings 2023, 13(9), 1646; https://0-doi-org.brum.beds.ac.uk/10.3390/coatings13091646
Submission received: 25 August 2023
/
Revised: 15 September 2023
/
Accepted: 15 September 2023
/
Published: 20 September 2023
(This article belongs to the Special Issue Laser-Assisted Coating Techniques and Surface Modifications)
Abstract
:In order to improve the high-temperature oxidation resistance of Ti60 alloy, a Ti-Hf-Mo-Ta-Nb-B composite coating was prepared on Ti60 alloy with Ti, Hf, Mo, Ta and Nb powder and B powder as raw materials using laser cladding. The microstructure and oxidation behavior of the coating before and after oxidation at 1100 °C × 120 h in static air were studied with XRD, SEM, EDS and isothermal oxidation techniques. The results show that the coating was mainly composed of six phases, (Ti0.2Hf0.2Mo0.2Ta0.2 Nb0.2)B2, TiB, HfB2, Mo4.00 B3.40, TiHf and Hf1.86Mo0.14. The high-temperature oxidation of the coating and Ti60 alloy followed parabolic law, and the oxidation weight gain rate of the coating after 110 °C × 120 h was only 1/4.8 of that of the Ti60 alloy. The improvement of the high-temperature oxidation resistance of the coating may benefit from high-temperature oxidation resistance (Ti0.2Hf0.2 Mo0.2Ta0.2Nb0.2)B2, HfB2 and TiB boride ceramic phases.
1. Introduction
Ti60 alloy is a kind of near α type high-temperature titanium alloy designed for a long-term service temperature of 600 °C. The alloy is based on Ti-Al-Sn-Zr and adds a certain amount of Ta-Nb-Mo and other elements. The alloy is made into a heat-strength titanium alloy with multiple composite strengthening, which integrates fine crystal strengthening, solid solution strengthening and second phase (α2 and silicide) dispersion strengthening. It has a good match of high oxidation resistance, thermal strength and thermal stability at working temperature [1]. However, at a long-term oxidation temperature of more than 700 °C, not only does the alloy form a thick oxide layer on the surface, the peeling of oxidation products also leads to poor long-term oxidation resistance of the Ti60 alloy. At the same time, the surface layer of the alloy also has a microstructure transformation due to the entry of oxygen, forming an embrittlement layer [2]. In order to improve the application of Ti60 alloy at higher temperatures, as early as 1998, Liu et al. [2] used vacuum cathode ion plating equipment to deposit the NiCrAlY coating on the Ti60 alloy and observed its oxidation behavior at 700 °C × 1000 h, as well as the protective effect of the NiCrAlY coating at different thicknesses. The results show that the NiCrAlY coating can inhibit the oxidation of Ti60 alloy caused by titanium diffusion from inside to outside, and the oxidation resistance of the NiCrAlY coating can meet the requirements of long-term use at 700 °C. In the same year, Tang et al. [3] studied the effects of sputtering Al, NiCrAl, TiAl, TiAlCr and reactive sputtering Al2O3 coatings on the oxidation resistance of Ti60 alloy, and the results show that sputtering pure Al, Ti-36Al, Ni-16Cr-2.5Al and reactive sputtering Al2O3 coatings can improve the oxidation performance of Ti60 alloy by 2–4 times at 700 °C × 100 h and 800 °C × 100 h. In 2004, Xiong et al. [4] studied the effect of an ultra-fine special enamel coating on the oxidation performance of Ti60 alloy at 800 °C × 100 h. The results show that the oxidation rate of the coating is about 0.8 mg /cm2, which is 10 times higher than that of the substrate. In 2010, Li et al. [5] studied the high-temperature oxidation behavior of Ni-Co-Cr-Al-Y-Si coating deposited on Ti60 alloy with cathodic multi-arc ion plating at 600 °C, 650 °C and 750 °C × 120 h, and the results show that the Ni-Co-Cr-Al-Y-Si coating improves the oxidation resistance of Ti60 alloy at 600 °C, 650 °C and 750 °C by 13 times, 8 times and 1.5 times, respectively. In the same year, Yan et al. [6] used arc ion plating technology to deposit Ti-48Al-12Cr coating on Ti60 alloy and carried out isothermal oxidation of the coating at 900 °C, but no experimental results for isothermal oxidation of Ti60 alloy at the same temperature were reported. The results show that a continuous and dense Al2O3 protective oxide film was formed on the surface of the coating; no cracks appeared under the oxide film and the coating remained intact. In 2017, Chen [7] prepared NiCrAlYSi coating on Ti60 alloy using cathodic multi-arc ion plating technology and confirmed that after oxidation at 600 °C and 650 °C × 120 h, it had a good antioxidant protection effect, and the oxidation performance was increased by 13 times and 6 times, respectively. However, a titanium element was found in the oxide skin at 800 °C. This indicates that the oxygen in the environment can pass through the coating and oxidize with the substrate, and the oxidation resistance of the coating at this temperature was only 1.5 times higher than that of the substrate.
It can be seen from the above that the highest temperature of the high-temperature anti-oxidation coating prepared on Ti60 alloy reported in the literature does not exceed 900 °C, and although there are many literature reports [8,9,10,11,12] on the preparation of high-temperature oxidation-resistant coatings on the surface of different titanium alloys, such as TA2 [8], TA15 [9] and TC4 [10,11,12], using laser cladding, there is no literature report on the preparation of high-temperature anti-oxidation coating resistant to 1100 °C on Ti60 alloy. The melting point of titanium is 1668 °C, the boiling point is 3260 °C, and the density is 4.5 g/cm3, which has a wide range of uses in the aerospace field. With the increase in the thrust-to-weight ratio, the pursuit of titanium alloys with higher temperature resistance has become the research goal of scientists. Although scientists are studying TiAl-based alloys at 900 °C and Nb-TiAl-based alloys above 1000 °C, both of them have the disadvantages of low room temperature plasticity and difficult processing [13]. These cannot be solved in the short term, and we still need to greatly improve their oxidation resistance temperature via coating modification technology.
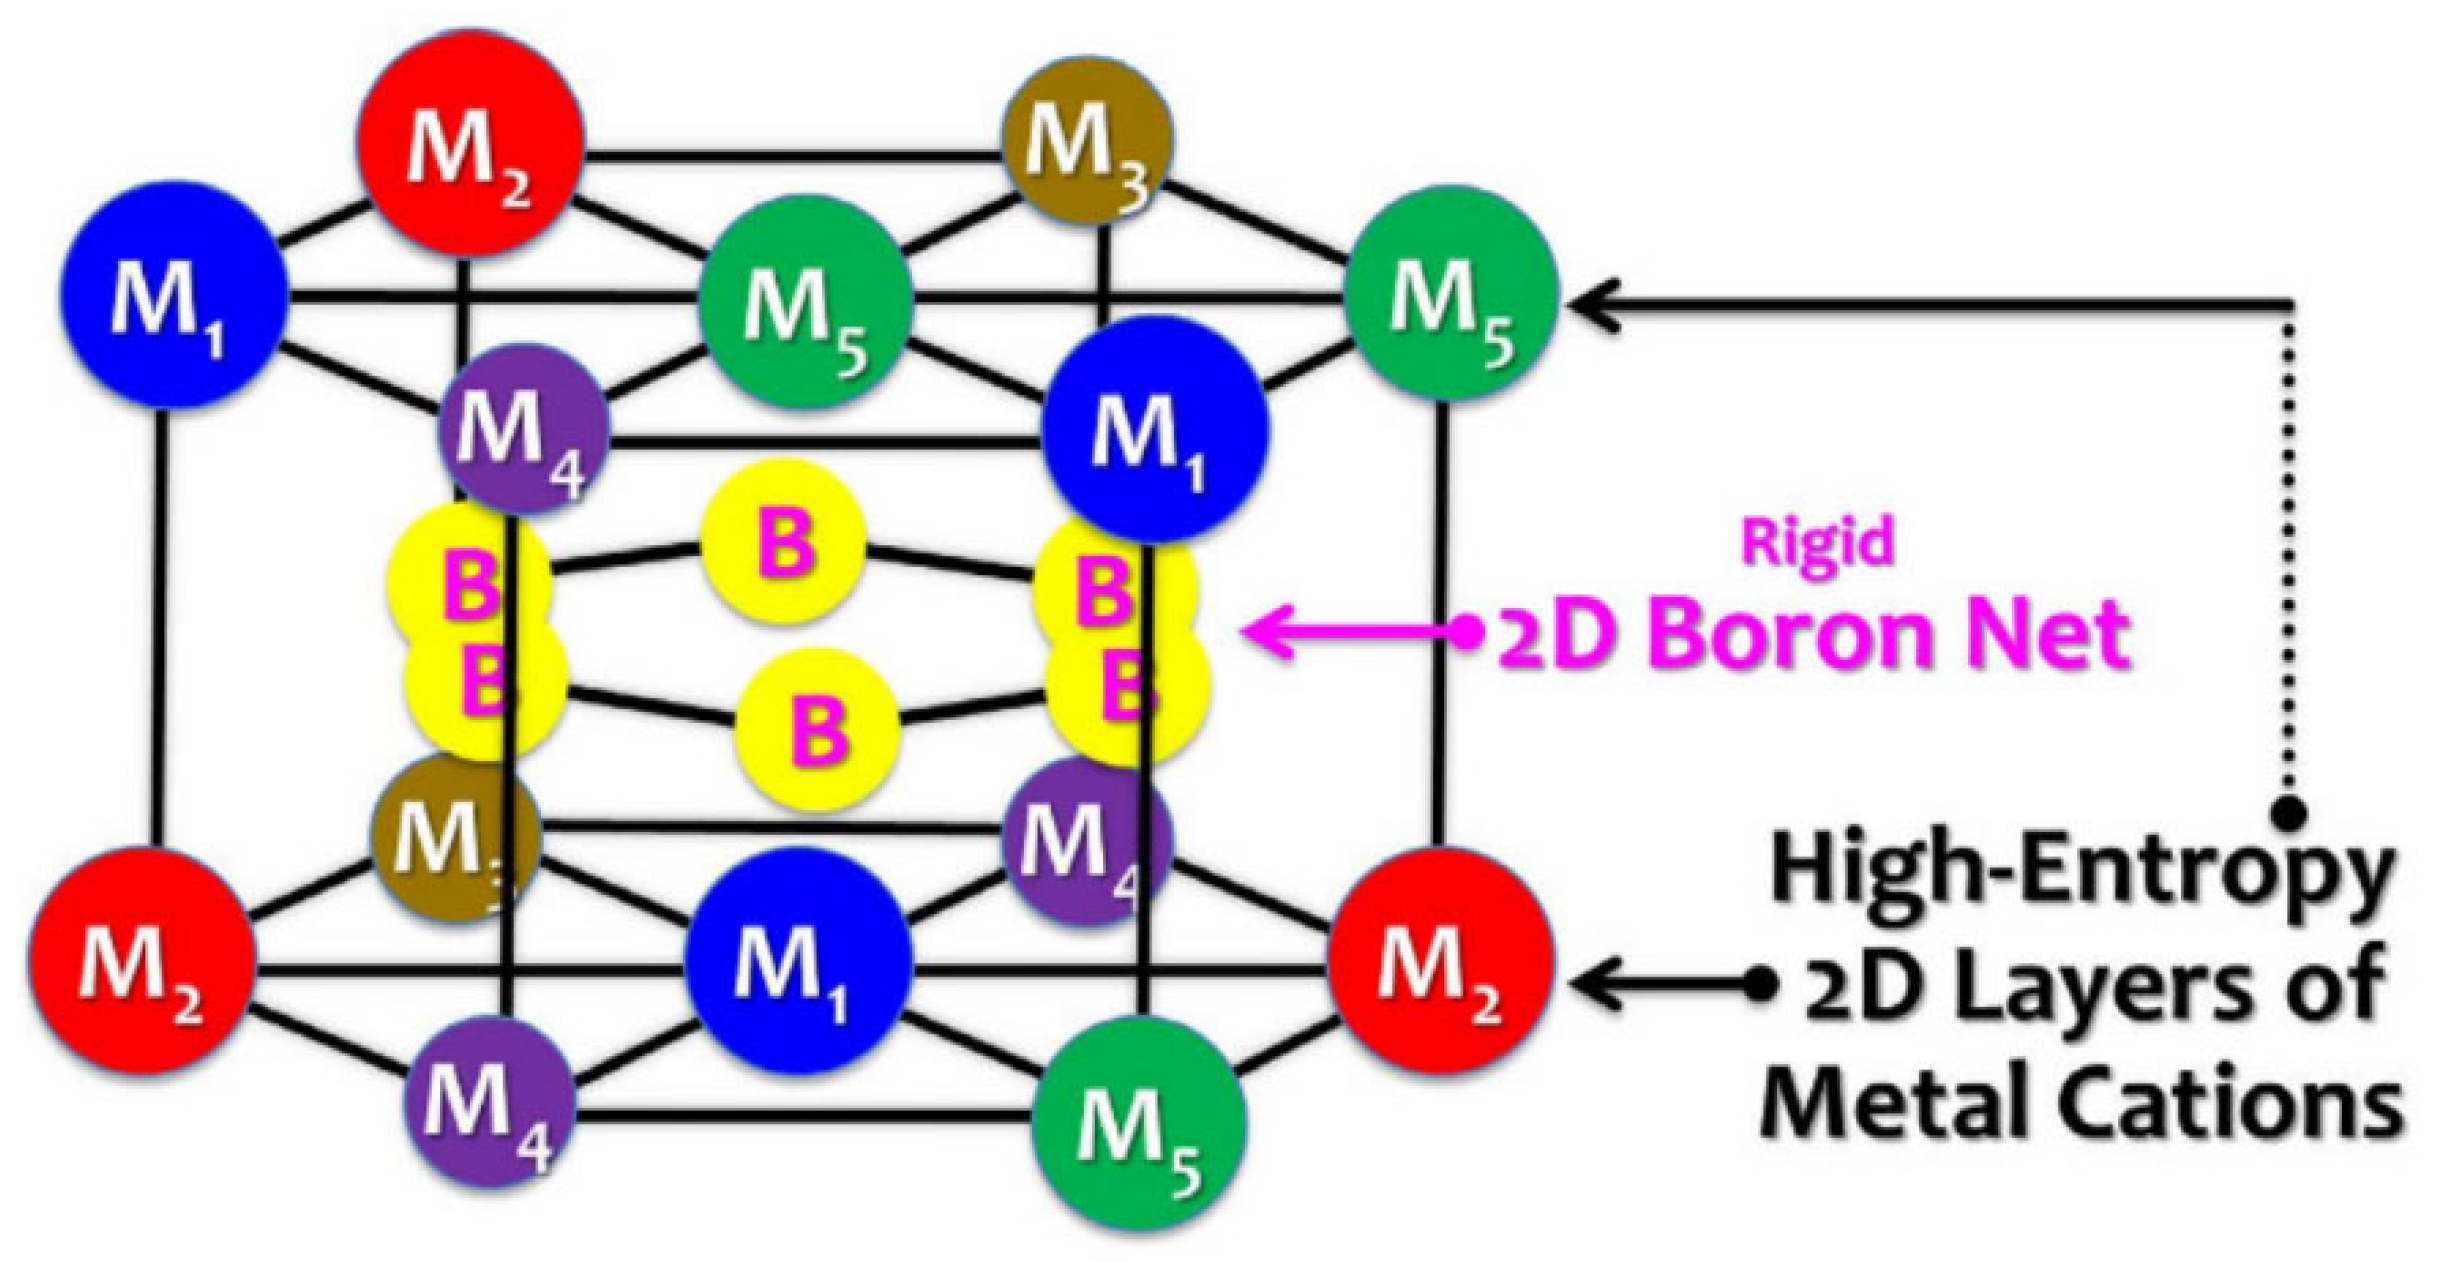
On the other hand, high-entropy borides are formed with a solid solution of five or more single-component diborides, usually forming an AlB2 hexagonal structure with an alternating two-dimensional boron network and a high-entropy cation layer. Due to their excellent high-temperature oxidation resistance and mechanical properties [14], they have been a subject of wide concern throughout the world, and their structure schematic diagram is shown in Figure 1.
The two-dimensional high-entropy metal layers are separated by a rigid two-dimensional boron network without any significant stratified segregation between the metal atomic layers perpendicular to the C-axis, and M-B bonds have mixed ionic and covalent bond properties. In the two-dimensional metal layer, M-M bonds are significantly affected by the stronger B-B bonds formed by the rigid boron network. This unique structure makes the hardness and oxidation resistance of high-entropy borides better than the average performance of five single metal diborides prepared via the same process. Mayrhofer et al. [15] reported that (Zr0.23V0.14Ti0.20Ta0.24Hf0.19)B2 high-entropy boride coating at 1500 °C still has thermal stability, not breaking down into two-boride, and the coating hardness at 1500 °C is for at least 36 GPa after annealing. However, when the temperature is greater than 1100 °C, the affinity of the coating for oxygen is also high, showing significant boron loss and oxygen absorption, thus limiting its thermal stability, which is also the reason why 1100 °C was used as the isothermal oxidation temperature in this paper. Kirnbauer et al. [16] reported that (HfTaVWZr)B2 coating still maintains a single-phase structure at 1200 °C, and the high-entropy borides decompose into a very small amount of (HfTaZr)B2 and (VW)B2 at 1400 °C, most of which are still single-phase solid solutions, with the mechanical properties almost unchanged. Zhang et al. [17] reported that (Hf0.25Zr0.25Ti0.25Cr0.25)B2-SiC-Si coating can protect the C/C matrix from oxidation for more than 205 h at 1700 °C, which is mainly due to the formation of a dense and stable Hf-Zr-Ti-Cr-Si-O oxide layer. Up to now, there have been limited reports on high-entropy boride coating, especially the study of the oxidation properties of high-entropy boride composite coating prepared with laser cladding at high temperature. In this paper, Ti, Mo, Hf, Ta and Nb pure metal powder was mixed with amorphous B powder, and an in situ reaction occurred under the action of a laser heat source so as to synthesize a high-entropy boride composite coating containing high-temperature oxidation resistance, aiming to improve the oxidation resistance of Ti60 alloy at higher temperatures. The oxidation behavior of the composite coating at 1100 °C in static air was studied.
2. Materials and Methods
The base material was Ti60 alloy with a size of 100 mm × 50 mm × 5 mm, and its composition is shown in Table 1. First, equal molar Ti, Mo, Hf, Ta and Nb metal powder with a purity of 99.9 wt.% and amorphous B powder with a purity of 99.99 wt.% were mixed evenly using a grinding machine. Then, 4 wt.% PVA solution was used as a binder to preset the mixed powder on the surface of the Ti60 alloy. The thickness of the preset powder layer was about 1.5 mm. The ratio of mixed powder is shown in Table 2.
The Raycus RFL-C6000 fiber laser (Wuhan Raycus Fiber Laser Technology Co., LTD, Wuhan, China) was used for laser cladding, and argon was used to protect the cladding process. The laser cladding process parameters were as follows: the laser power was 2600 W, the spot diameter was 4.5 mm, the laser scanning speed was 8 mm/s, the laser spot overlap rate was 30%, the argon purity was 99.99% and the pressure gas flow rate was 15 L/min. After laser cladding, the coating and Ti60 alloy were wire-cut to 9 mm × 9 mm × 5 mm for XRD and SEM and 9 mm × 9 mm × 1.2 mm for high-temperature oxidation. The phases of the coating and Ti60 alloy before and after oxidation were analyzed using an X ’Pert PRO X-ray meter (XRD) produced by the PANalytical Company in Almelo, Newtherlands. The morphologies and compositions of the coating and Ti60 alloy before and after oxidation were observed using a JSM-7600F scanning electron microscope (SEM) produced by JEOL Company in Tokyo, Japan, equipped with energy disperse spectroscopy. The corrosion reagent used was HF:HNO3:H2O = 1:1:3. Using the static air oxidation weighing method, the coating and Ti60 alloy were put into different crucibles, and the isothermal oxidation experiment was carried out for 120 h in the Muffle furnace at 1100 °C. Among them, each high-temperature oxidation weight gain experiment was carried out three times, and the average value of the three times was taken as the oxidation weight gain value under each oxidation time. The M1210 1200 °C box furnace produced by Henan Chengyi Equipment Technology Co., Ltd (Zhengzhou, China). and the Swiss Mettler Toledo XS105 Dual Range (Mettler Toledo, Zurich, Switzerland) analytical balance with an accuracy of 0.1 mg were used in the oxidation experiment.
3. Results and Discussion
3.1. Microstructure
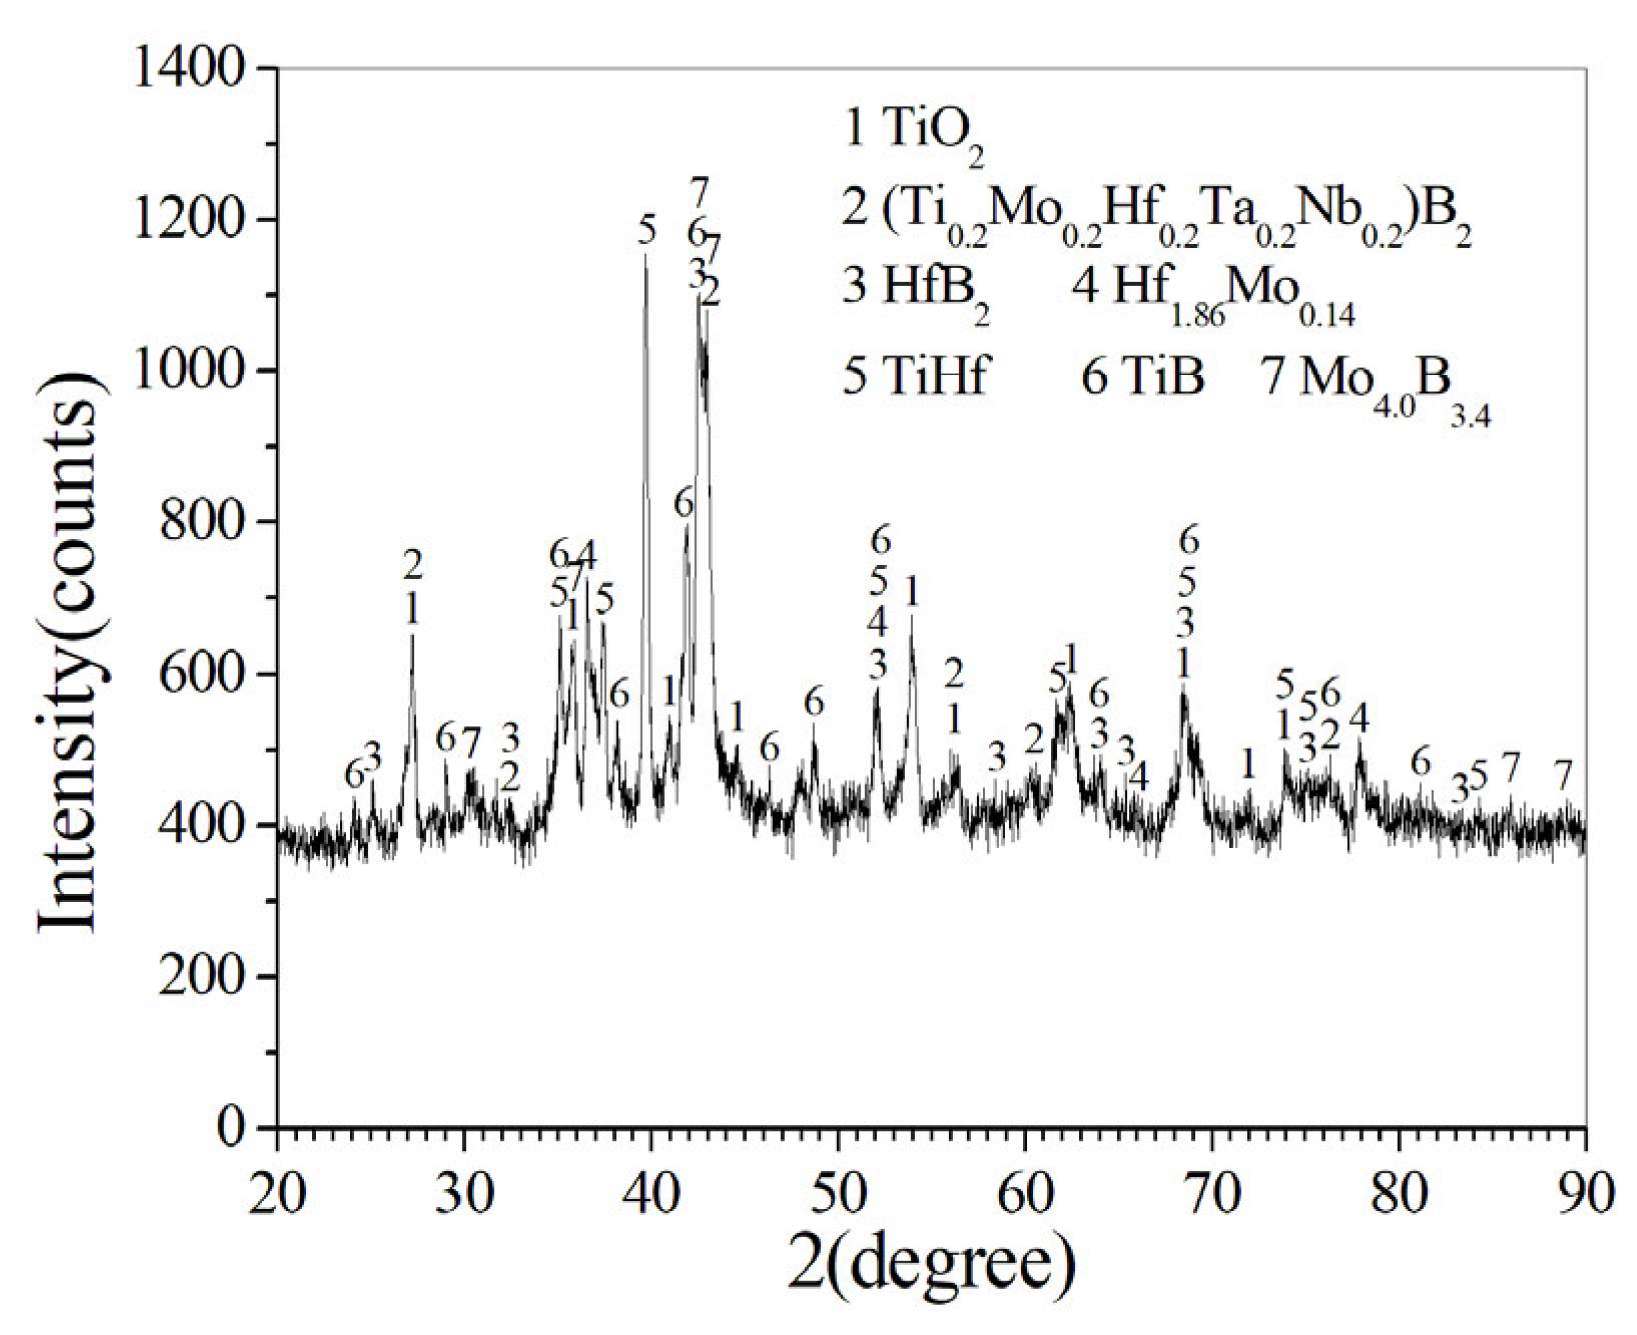
Figure 2 shows the XRD pattern of the laser cladding coating. As can be seen from the figure, the coating was mainly composed of seven phases, (Ti0.2Hf0.2Mo0.2Ta0.2Nb0.2)B2, HfB2 (JCPDS 96-151-0712), TiB (JCPDS 96-900-8947), Mo4.00 B3.40 (JCPDS 96-434-3334), TiHf (JCPDS 96-152-3026), Hf1.86Mo0.14(JCPDS 96-152-2717) and TiO2 (JCPDS 96-900-4145). The existence of the TiO2 phase was mainly due to the involvement of oxygen in the air during the laser cladding process. The diffraction peak positions of the (Ti0.2Hf0.2Mo0.2 Ta0.2Nb0.2)B2 phase are consistent with what was reported in the literature [18]. Under the action of the laser, the melted mixed powders were mixed with the partially melted Ti60 matrix to form a laser melt pool, and various borides and intermetallic compounds were generated via in situ reaction. The following reactions may occur in the laser melt pool:
In addition, Figure 2 shows that in addition to the designed (Ti0.2Hf0.2Mo0.2Ta0.2 Nb0.2)B2 phase, the coating also generated HfB2, Hf1.86Mo0.14, TiHf, TiB, Mo4.00B3.40 and TiO2. According to the different intensity of the strongest diffraction peak of each phase, the semi-quantitative content of each phase in the coating can be calculated by using the XRD-K value method reported by Zheng et al. [19]. That is, the ratio of the mass fraction of phase i and phase j in the coating is calculated according to Formula (8):
where and represent the mass fraction of phase i and phase j, respectively; Wc represents the mass fraction of the added standard material, such as Al2O3; Ii and Ij represent the 2θ diffraction intensity corresponding to the strongest diffraction peak of the i and j phases, respectively; and and represent the reference intensity values (RIR values) of the i and j phases, respectively.
The strongest diffraction peaks of the TiO2, (Ti0.2Hf0.2Mo0.2Ta0.2Nb0.2)B2, HfB2, Hf1.86Mo0.14, TiHf, TiB and Mo4.00B3.40 phases were (110), (101), (101), (011), (101), (111) and (101), respectively. The corresponding RIR values were 3.5, 9.56, 15.36, 32.23, 14.93, 1.85 and 5.94, respectively. According to Formula (8), the mass fractions of each phase in the coating are 5.91%, 29.27%, 6.10%, 2.65%, 9.07%, 34.23% and 12.77%, respectively. That is to say, TiB and (Ti0.2Hf0.2 Mo0.2Ta0.2Nb0.2)B2 are the two main generation phases.
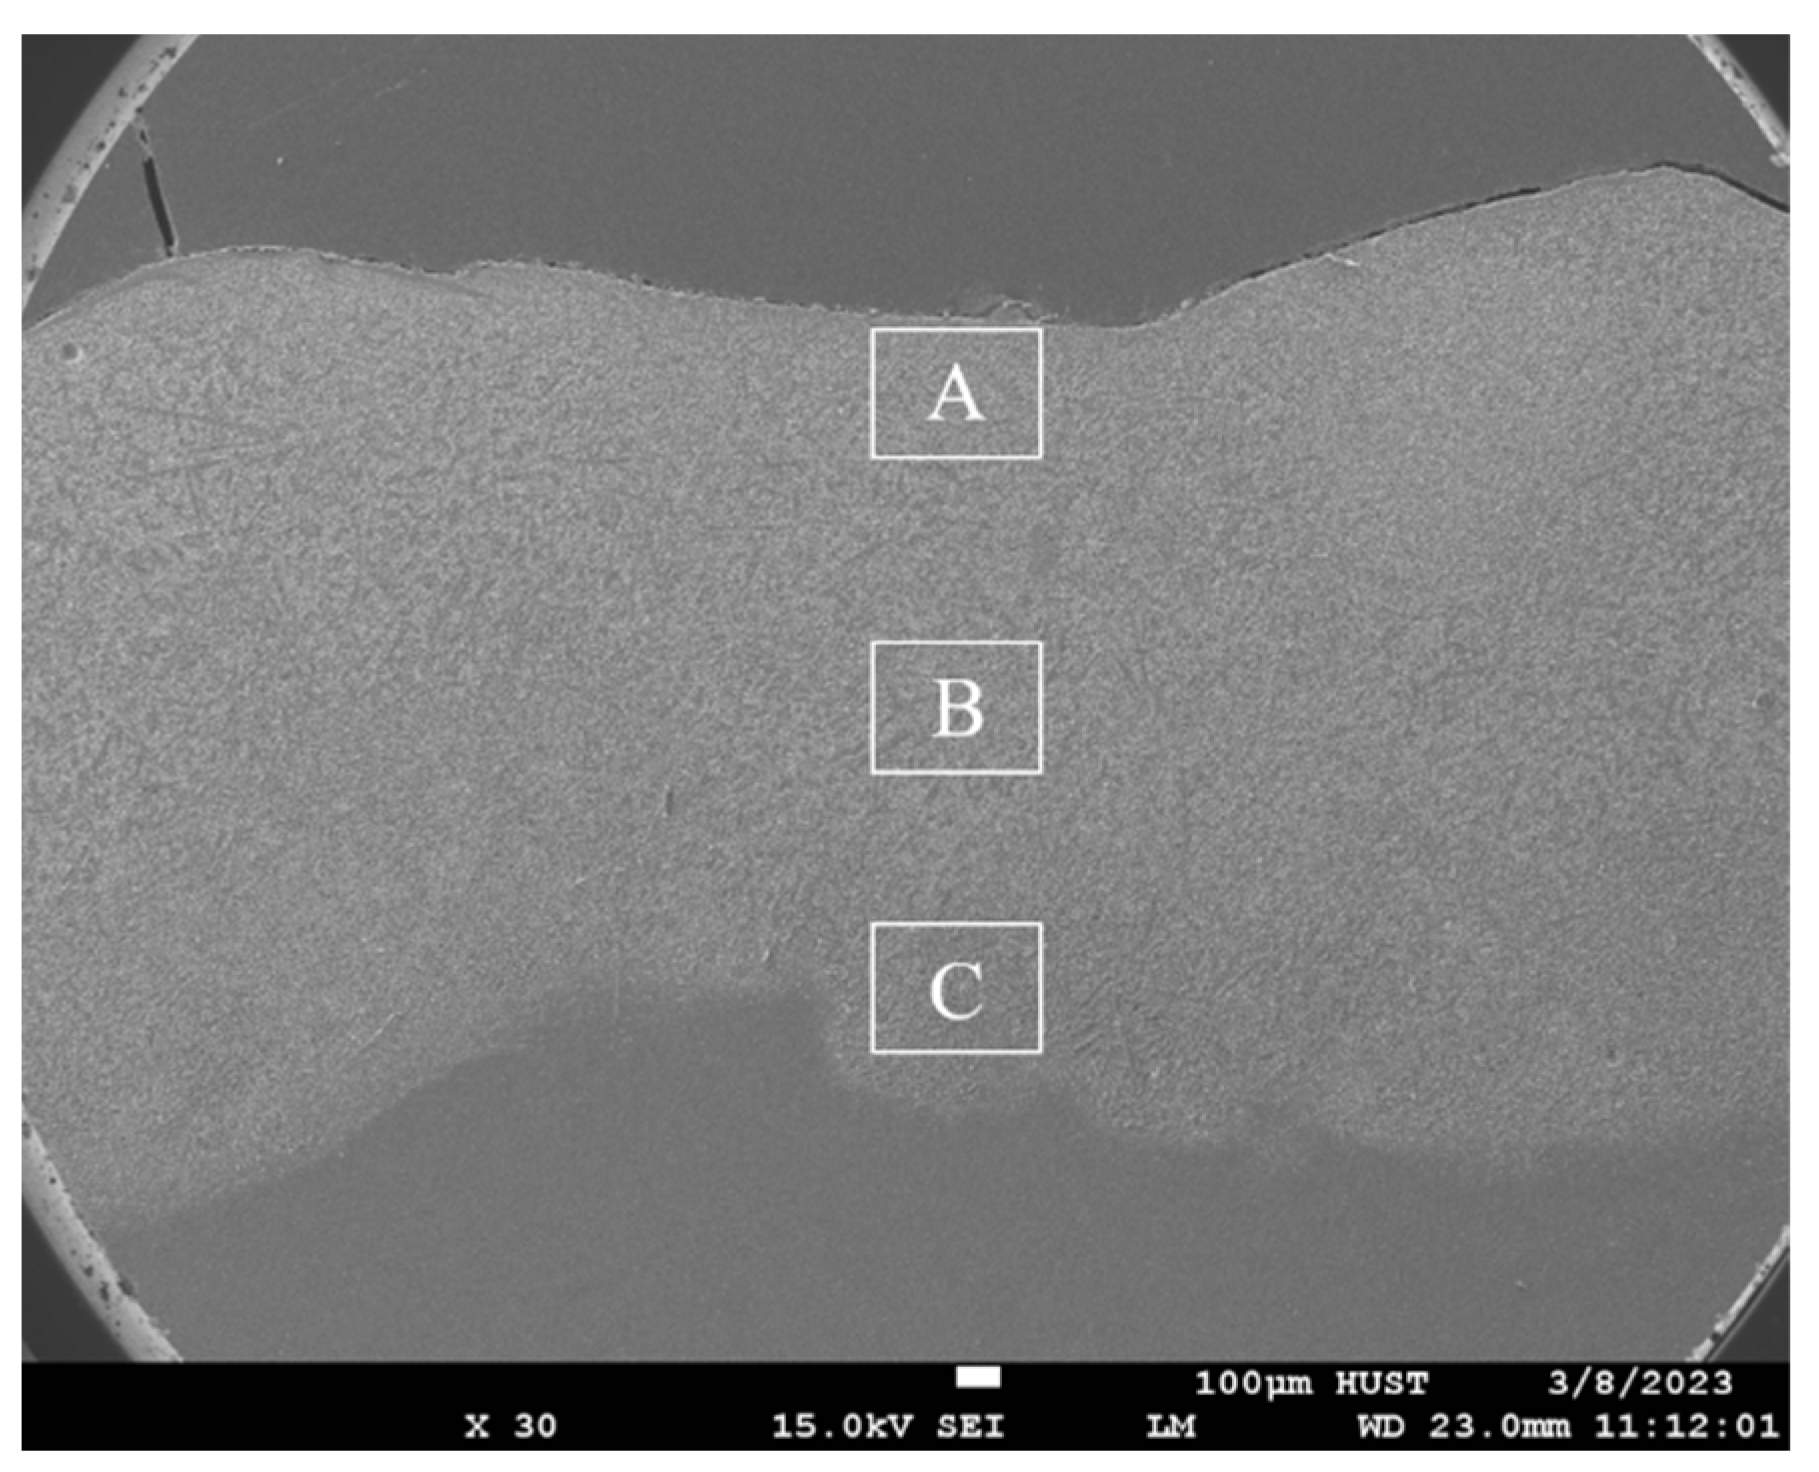
Figure 3 shows the overall morphology of the laser cladding cross-section coating. It can be seen from the figure that there are no obvious defects, such as pores and cracks, in the laser cladding coating. The interface of the coating and the Ti60 matrix are well combined. The thickness of the coating is about 1.6~2.4 mm.
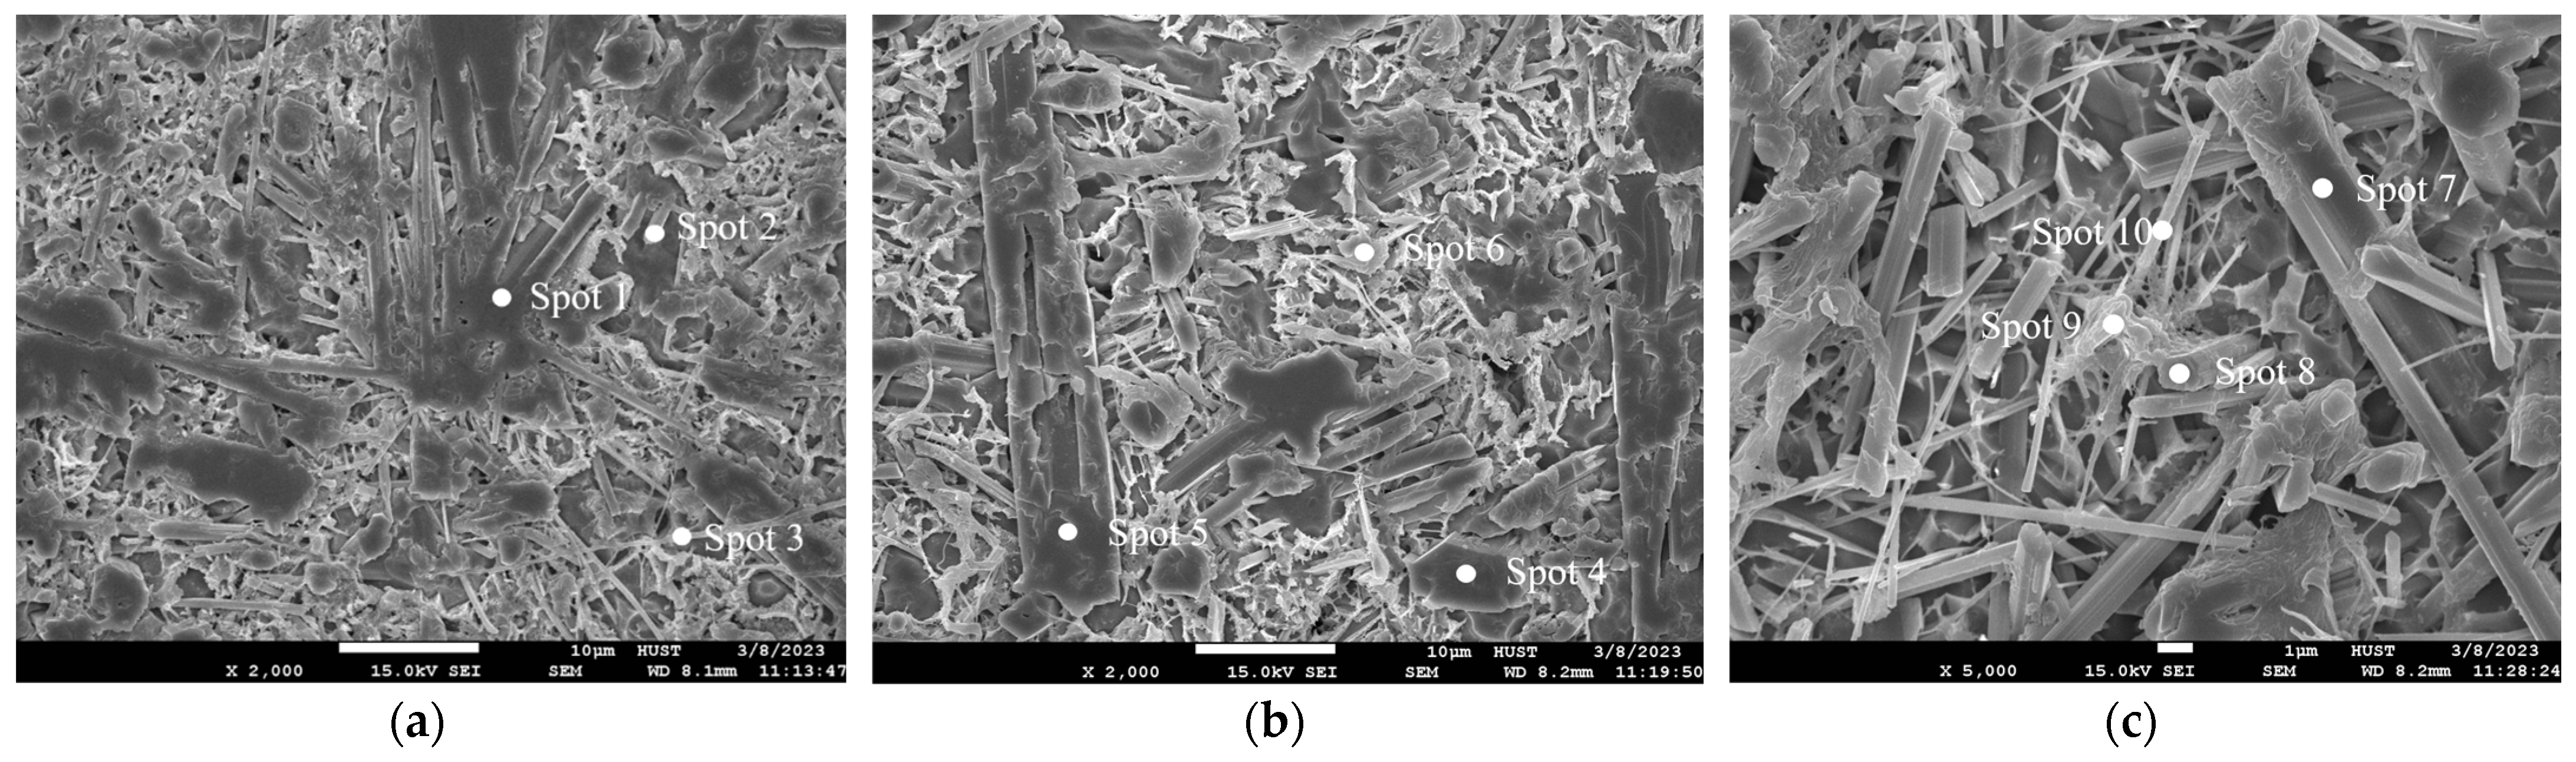
Figure 4 shows the SEM amplified morphology at different zones in Figure 3. It can be seen from Figure 4 that the laser cladding coating is mainly composed of a whisker or prismatic microstructure. Due to the effect of convection mass transfer during laser cladding, there is no significant difference in the morphology of different parts of the molten pool. From the combination of the EDS results in Table 3 and the XRD calibration results in Figure 2, it can be roughly speculated that the phase formation process is as follows: in the process of solidification, first of all, the HfB2 (melting point 3380 °C) and (Ti0.2Hf0.2Mo0.2Ta0.2Nb0.2)B2 (melting point 3006 °C) phases with high melting points are solidified from the liquid phase; as the temperature of the molten pool decreases, TiB (melting point 2227 °C), TiHf, Mo4.00B3.40 and Hf1.86Mo0.14 with low melting points are solidified successively from the remaining liquid phase. The specific formation mechanism needs to be further studied in the future. One of the more interesting facts is the formation process of whisker or prismatic structure TiB: as TiB has a B27 structure, it grows faster in the direction (010) than in other directions, and it is easy to form a whisker or prismatic structure [20], which plays a role in the strengthening phase in the coating [21]. The structure morphology of TiB in Figure 4 is consistent with reports in the literature [22,23]. Moreover, as the (001) plane grows at the fastest rate, it cannot form a crystal plane, and the remaining (100), (101) and () crystal faces are the sides of TiB, so the cross sections of whisker-like or prismatic structures are mostly hexagonal [21].
In addition, the size of the TiB formed at the bottom of the molten pool is small, which is due to the large temperature gradient near the bottom of the molten pool [24]. When the temperature drops to room temperature, the coating finally forms the TiB mixed structure with a whisker or prismatic structure as the main body.
3.2. High-Temperature Oxidation Properties
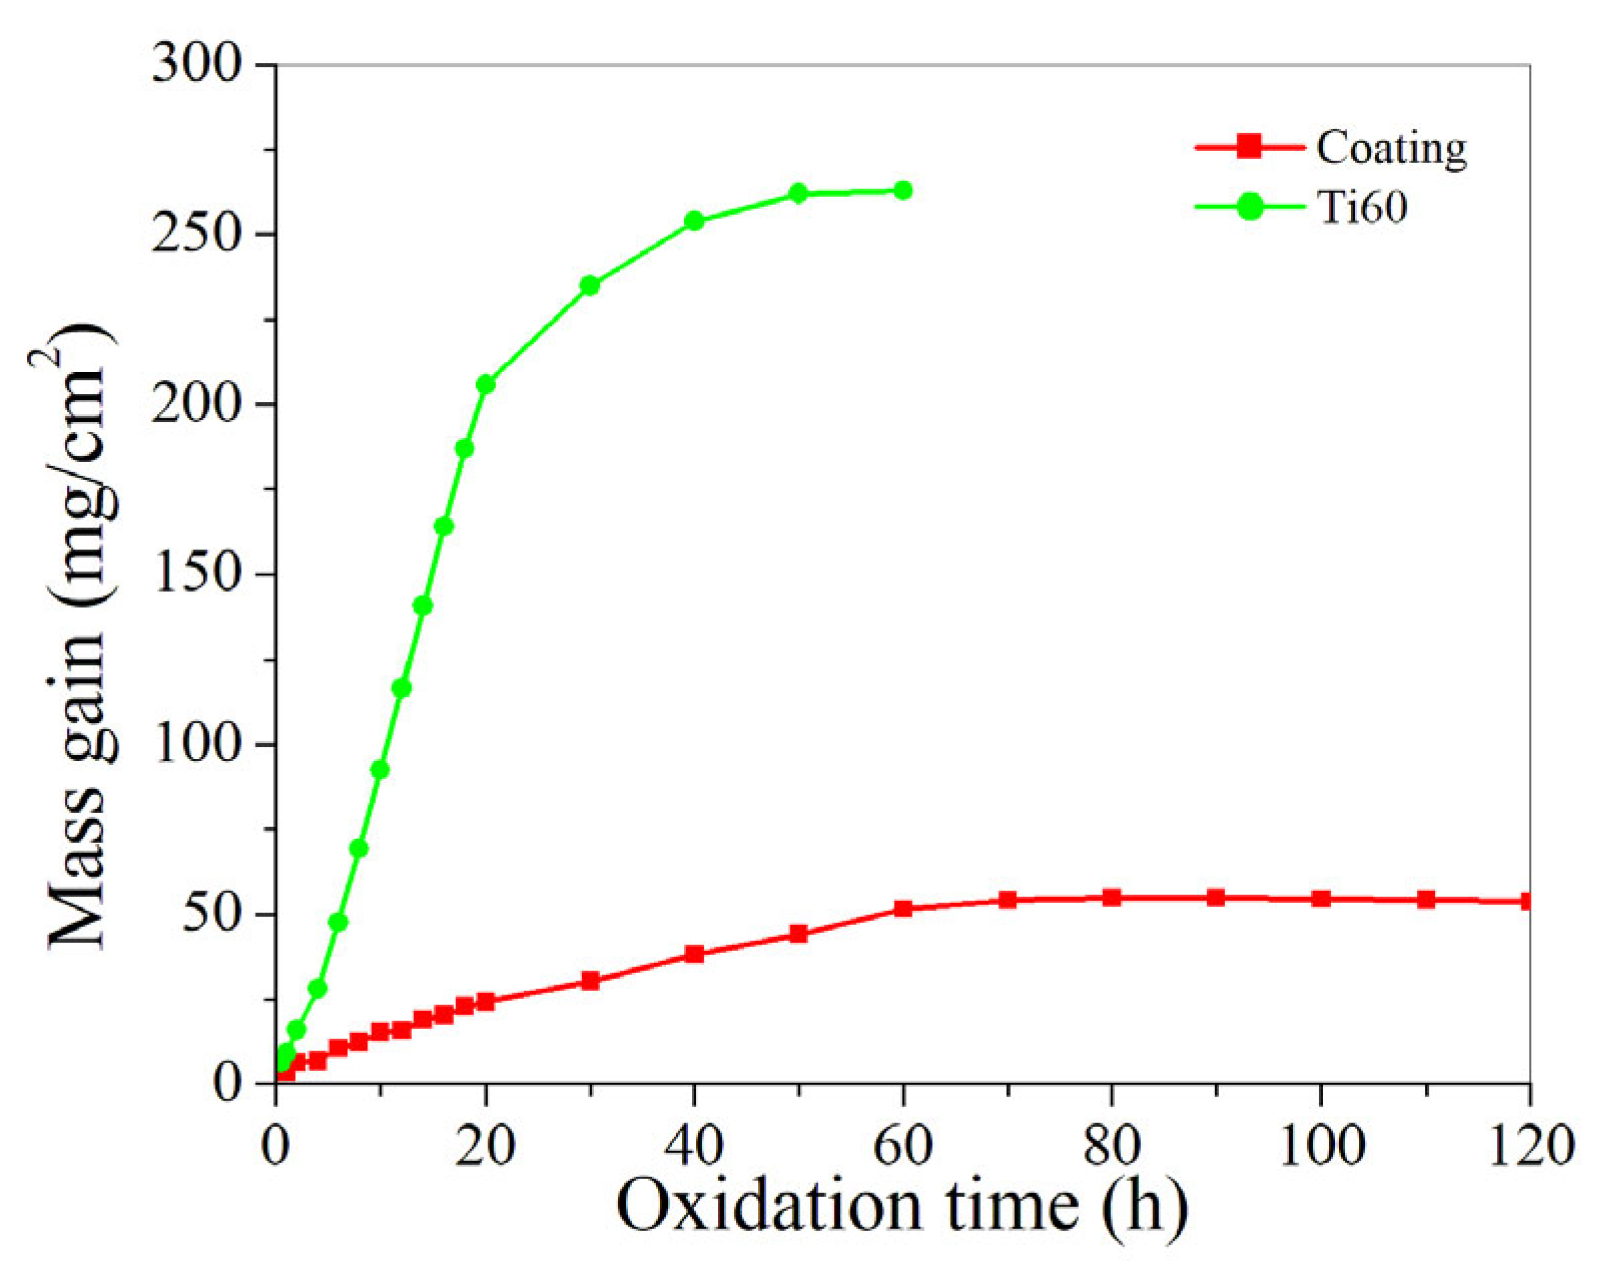
Figure 5 shows the oxidation weight gain curve of the laser cladding coating and Ti60 matrix after different oxidation times in the air at 1100 °C. The figure shows that the oxidation resistance of the laser cladding coating is superior to the Ti60 matrix. The reason may be related to the fact that the coating contained high-temperature oxidation resistance (Ti0.2Hf0.2Mo0.2Ta0.2 Nb0.2)B2, HfB2 and TiB phases (Figure 2); the maximum oxidation gain rates of the laser cladding coating and the Ti60 matrix were 54.79 mg/cm2 and 262.92 mg/cm2, respectively. That is, the high-temperature oxidation resistance of the laser cladding coating was about 4.8 times that of the Ti60 matrix. It should be noted that, although the literature [25] reported that the oxidation weight gain rate of single-phase (Ti0.2Hf0.2Mo0.2Ta0.2 Nb0.2)B2 prepared with SHS-SPS technology was about 2 mg/cm2 at 1200 °C × 5 h in air, and the oxidation weight gain rate was lower than that of the laser cladding coating (8.7 mg/cm2 at 1100 °C × 5 h in air, Figure 5) in this paper, the possible reason is that the content of (Ti0.2Hf0.2Mo0.2Ta0.2 Nb0.2)B2 in the laser cladding coating was only 29.27%, and the content of the oxidation resistance test samples used in the literature [25] was 100%.
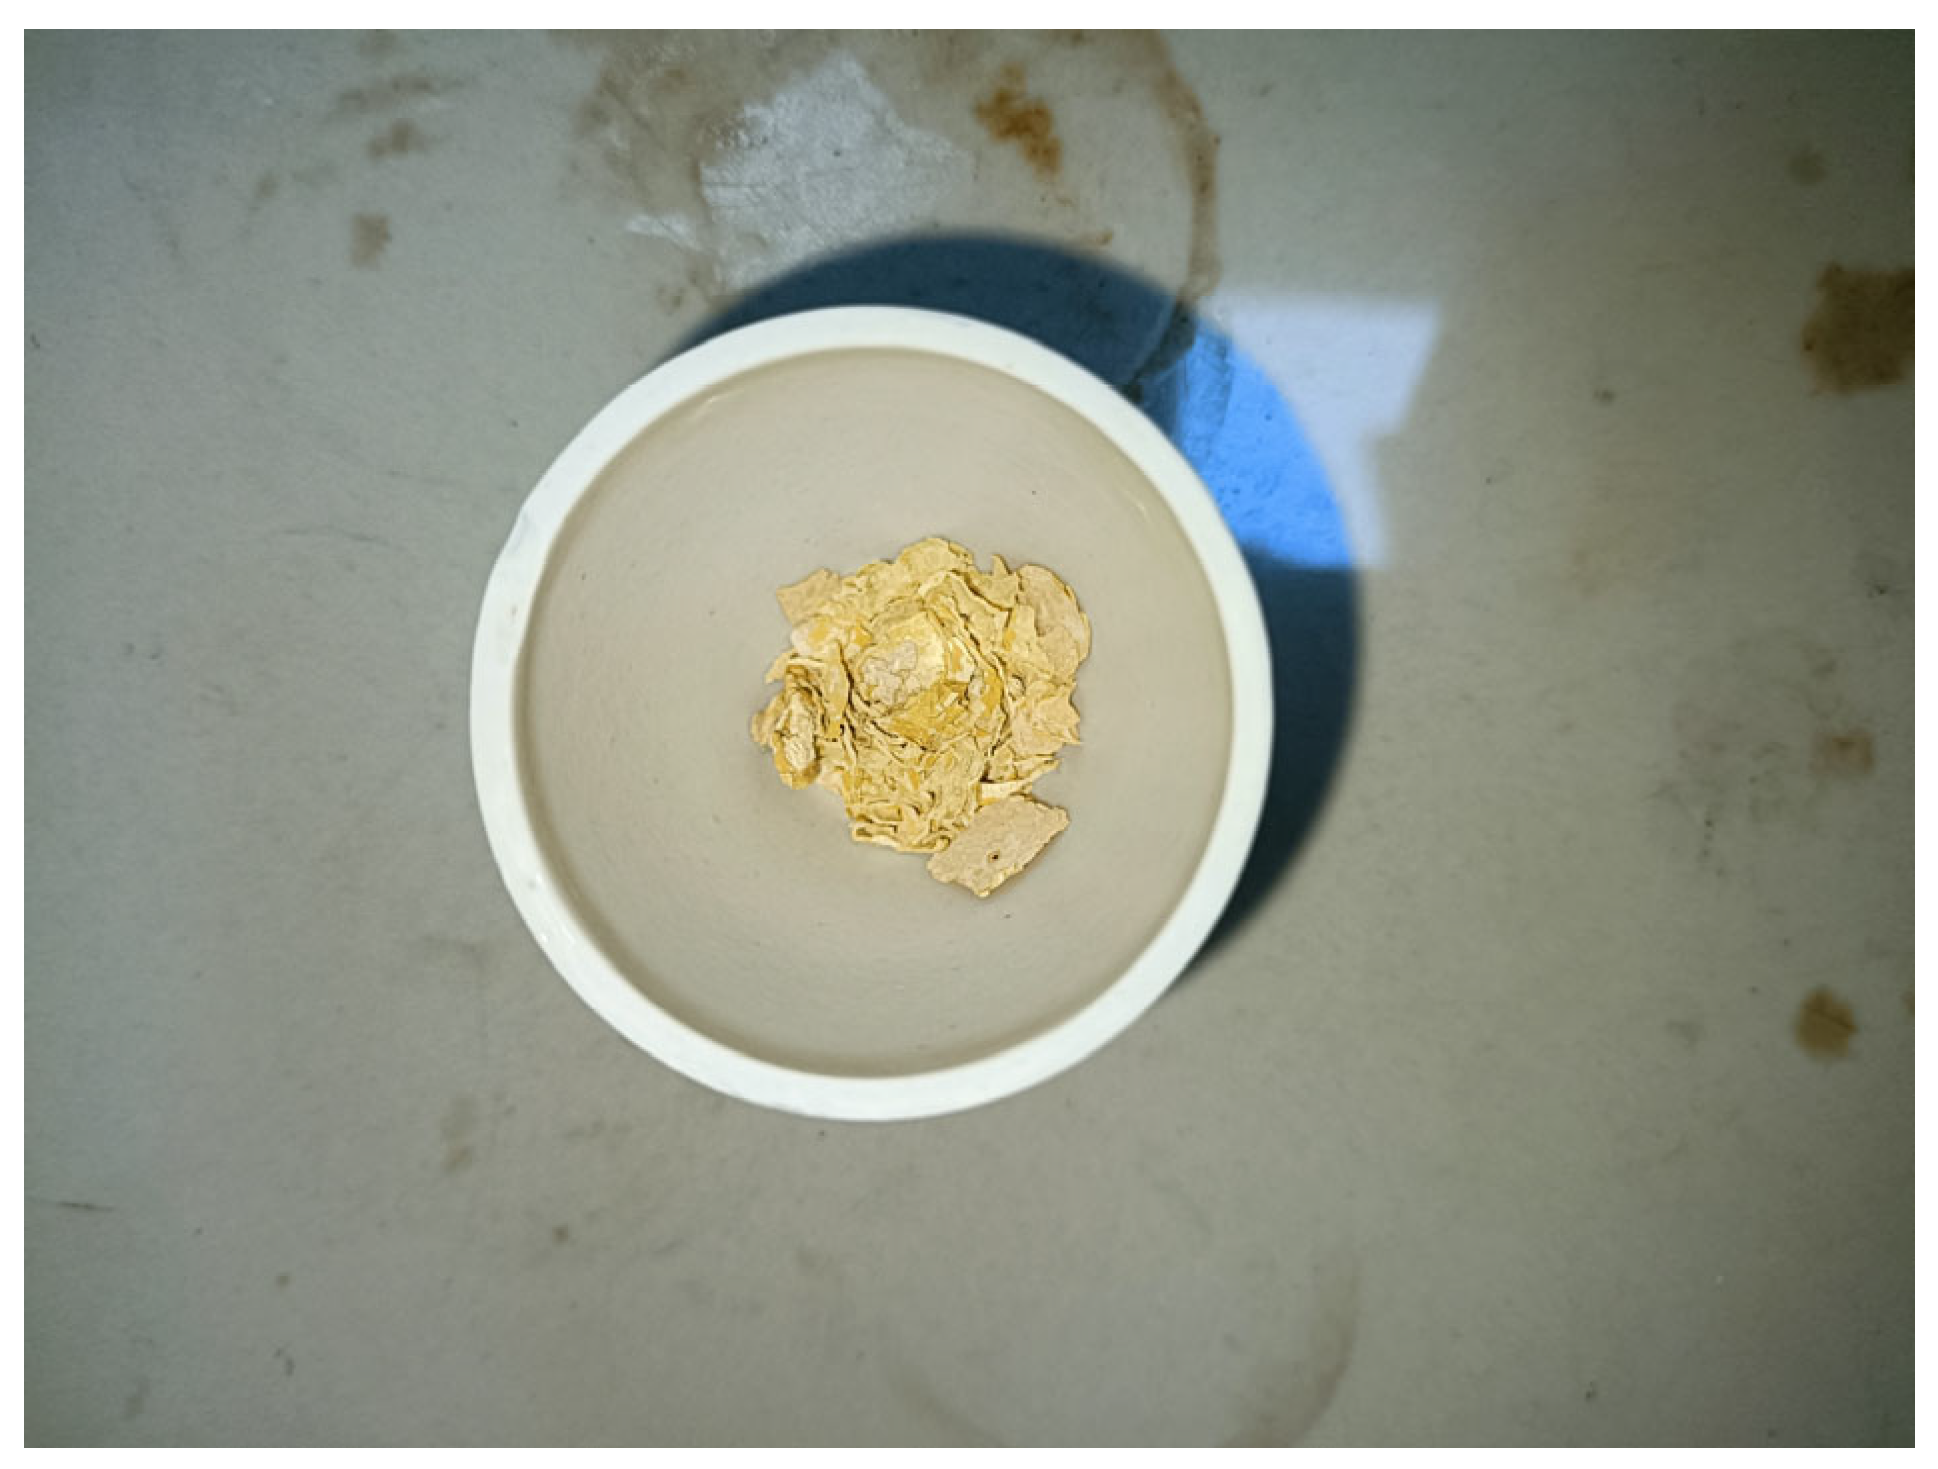
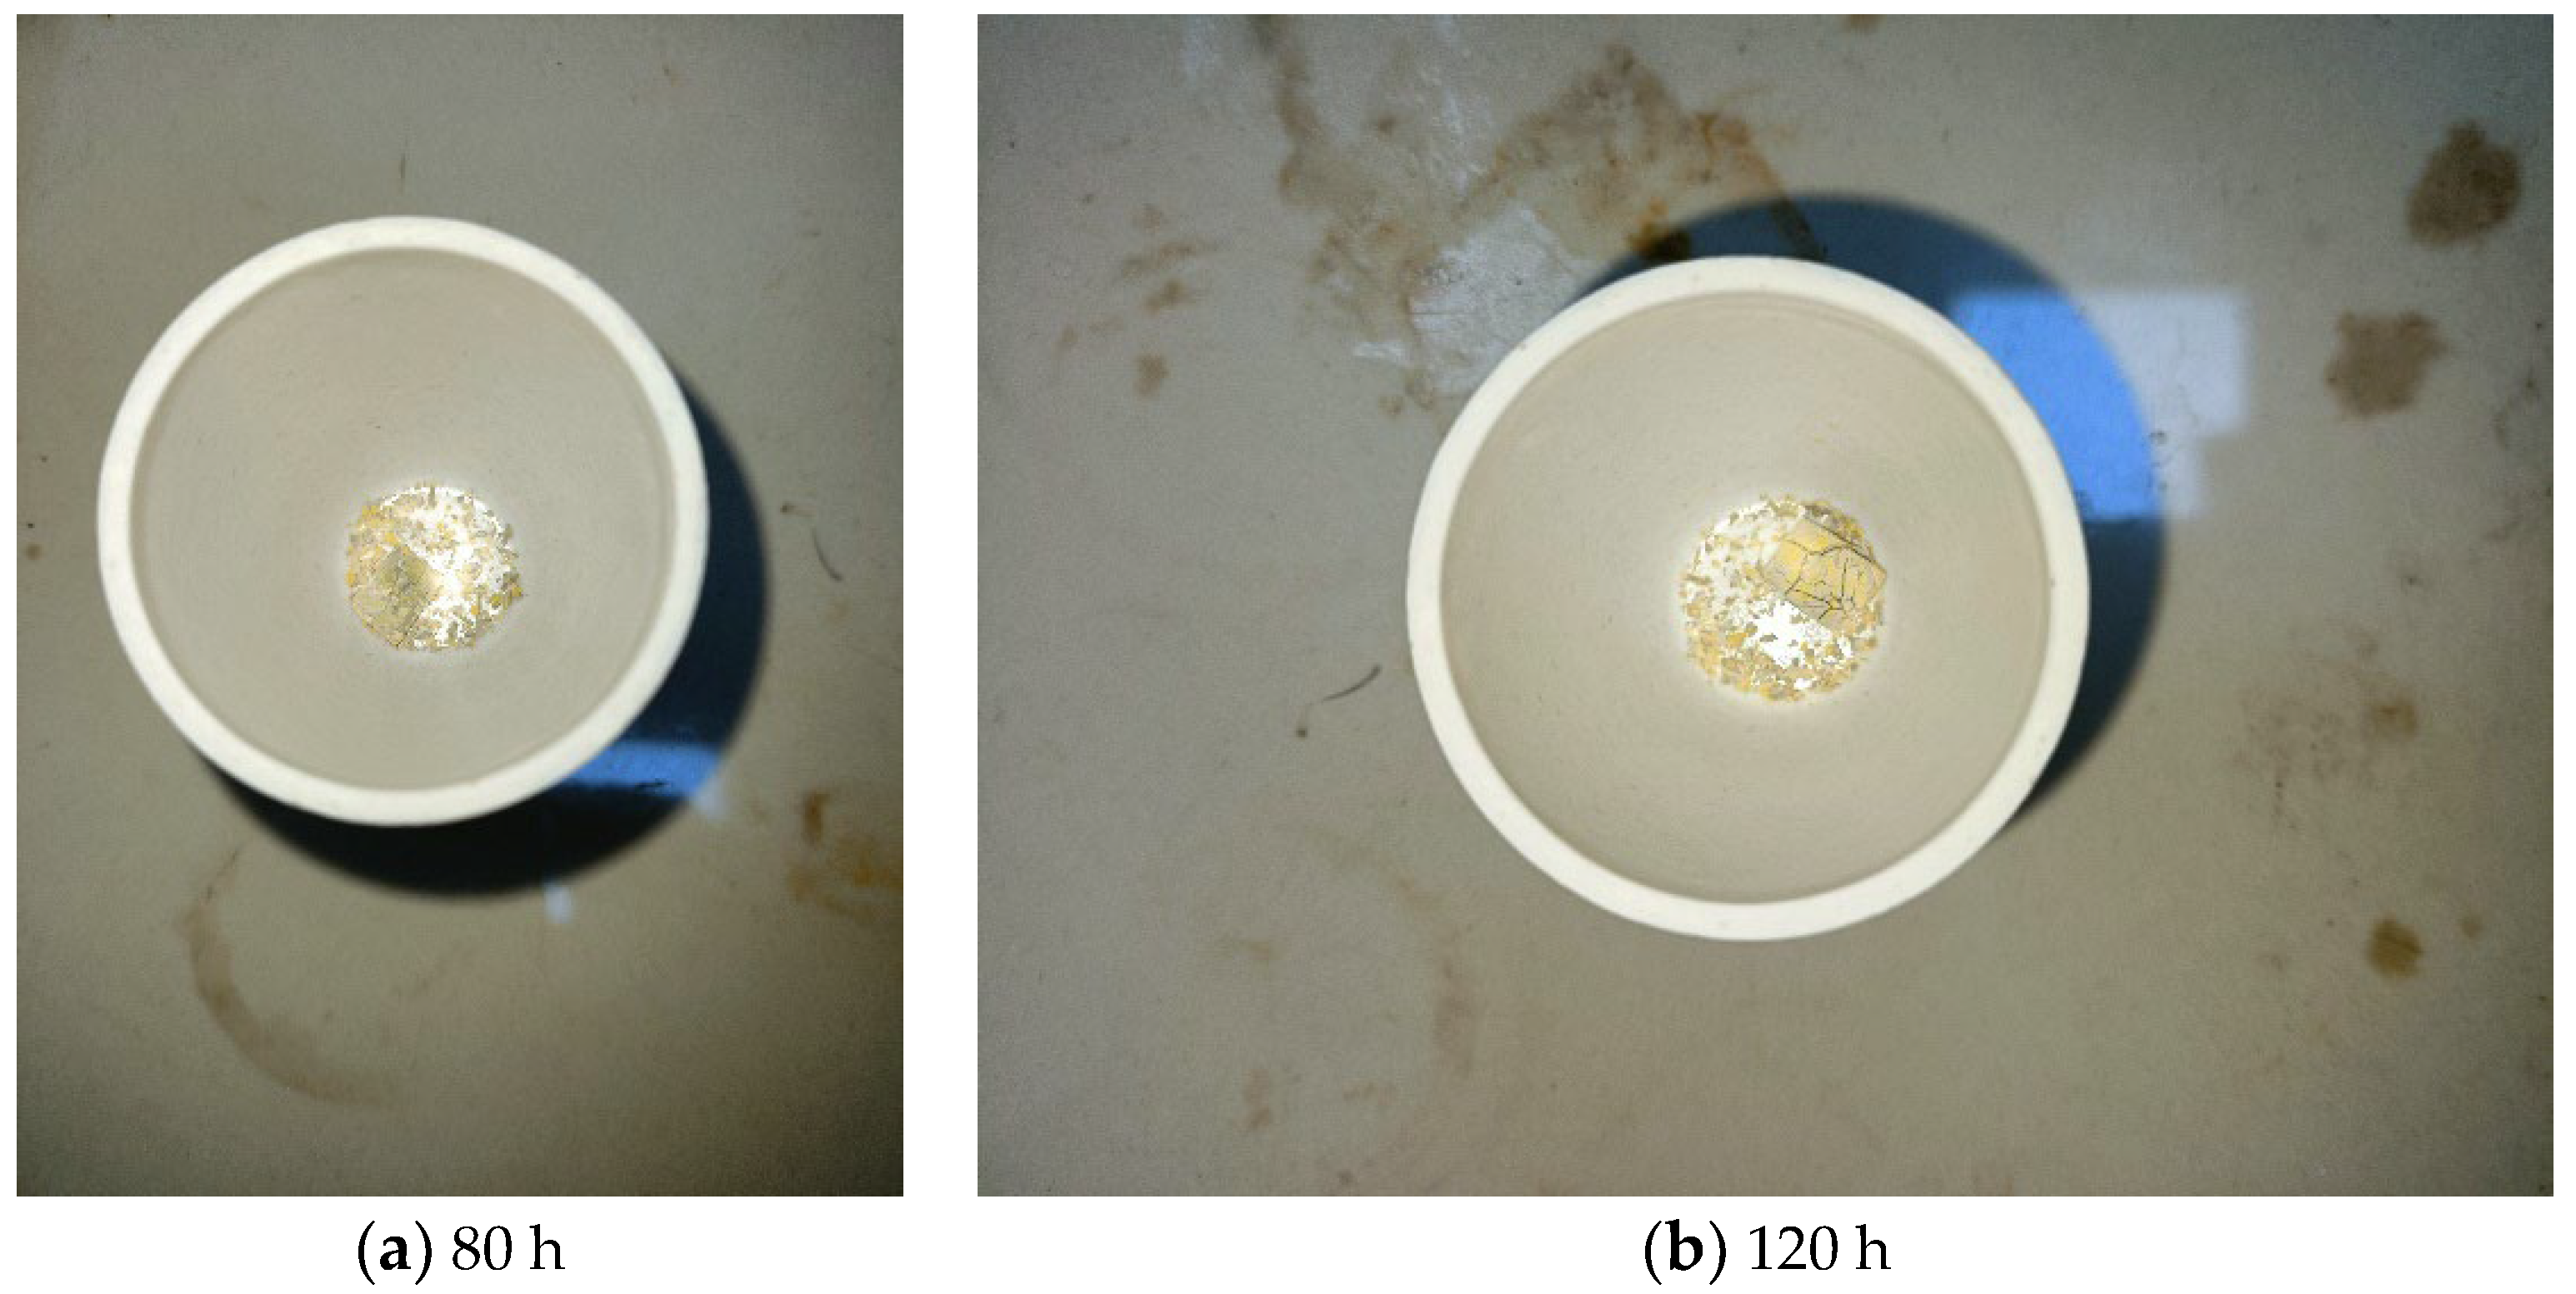
In addition, it can be seen from Figure 5 that the oxidation weight gain of the Ti60 matrix at 1100 °C mainly occurred in the first 50 h. At a high temperature of 1100 °C, Ti in the Ti60 matrix was rapidly oxidized to form loose TiO2 so that oxygen in the air could continue to diffuse into the internal matrix, resulting in continuous oxidation and weight gain of the Ti60 matrix. However, after more than 50 h, the oxidation and weight gain of the Ti60 matrix had stopped, indicating that the Ti60 matrix had been basically completely oxidized. This is evidenced by the fact that there were only thin yellowish sheets in the crucible (Figure 6). The oxidation weight gain of the laser cladding coating at 1100 °C reached the highest value after 80 h, and after more than 80 h, the oxidation weight gain of the laser cladding coating basically stopped, indicating that the oxidation of the laser cladding coating entered a stable equilibrium state but was not completely oxidized, which could be demonstrated by the large pieces of unoxidized coating in the crucible (Figure 7a). Figure 7b is a macroscopic photo of the laser cladding coating oxidized for 120 h. It can be seen that there are still large pieces of unoxidized coating, that is, the laser cladding coating can withstand oxidation at least at 1100 °C × 120 h.
Table 4 shows the oxidation rate constant k and oxidation weight gain index n of the laser cladding coating and Ti60 matrix, respectively, calculated by fitting the modified Wagner Formula (9). As can be seen from Table 4, the oxidation weight gain indexes n of the laser cladding coating and the Ti60 matrix after oxidation at 1100 °C for different times are 0.5833 and 0.8921, respectively, both of which are less than 1 and are power functions of the transverse parabola; that is, the oxidation kinetics curves of both of them follow parabolic law. Among them, the oxidation law of the Ti60 matrix is consistent with the result of the oxidation kinetics curve of Ti60 alloy at 650~750 °C reported by Jia et al. [26]. The oxidation rate constant k (3.9907) of the laser cladding coating is significantly lower than that of the Ti60 matrix (10.585); that is, the laser cladding coating always maintains a low oxidation rate during the whole high-temperature oxidation process.
where Δmt/S is the oxidation gain per unit area, k is the oxidation rate constant, n is the oxidation gain index and t is the oxidation time.
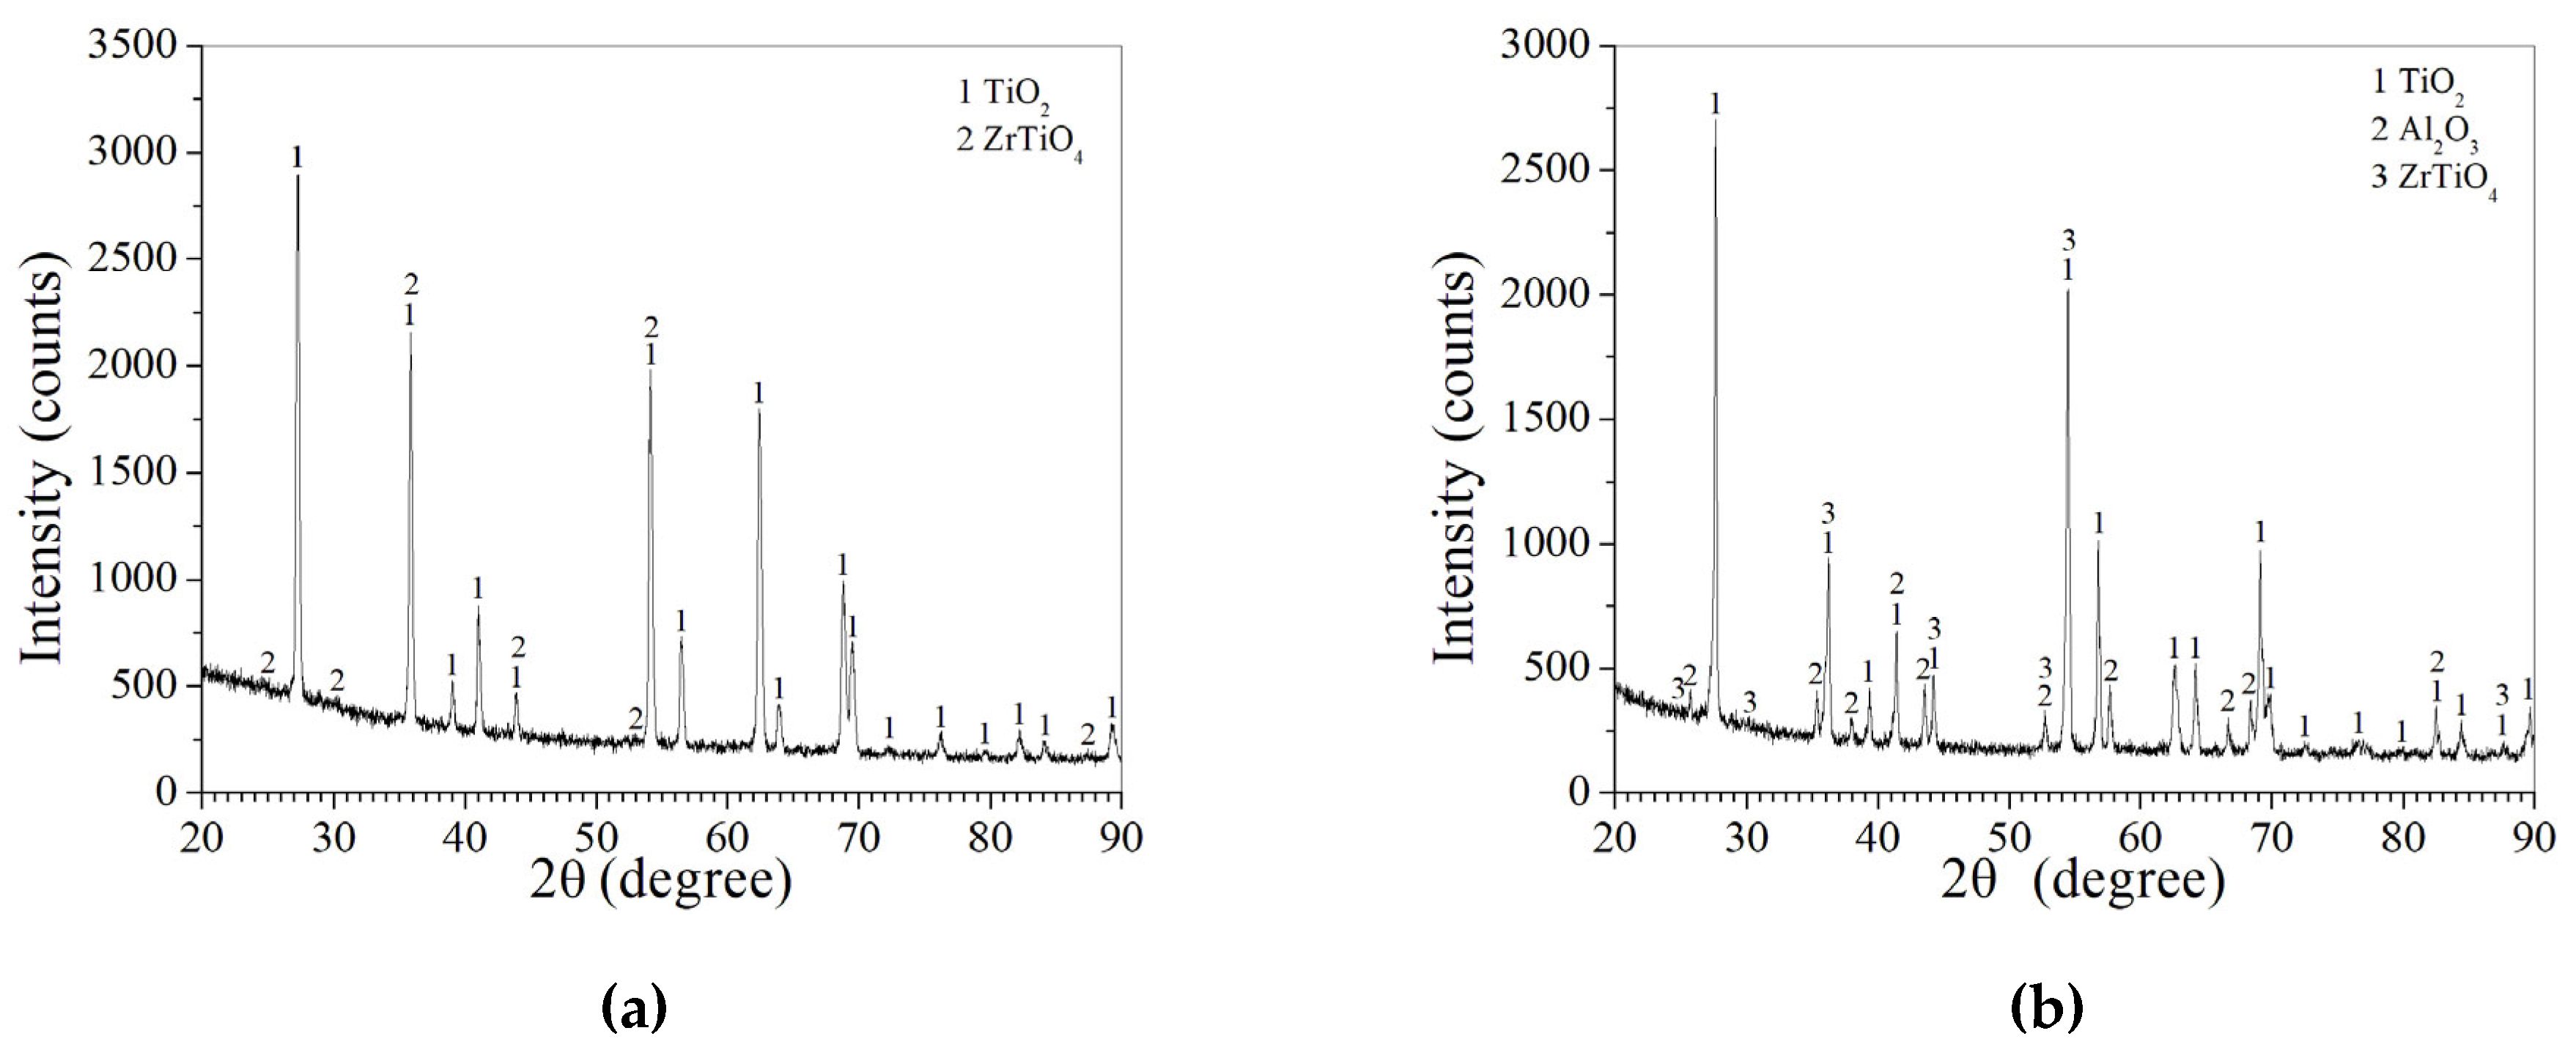
Since the oxide film of the Ti60 matrix is characterized by layer-by-layer peeling during the oxidation process (Figure 6), we tested the XRD pattern of the outer surface and the inner surface of the Ti60 matrix after oxidation at 1100 °C × 60 h (Figure 8). As can be seen from Figure 8, the outer surface of the spalling oxide film layer consists of two phases, TiO2 (PDF 96-153-4782) and srilankite ZrTiO4 (PDF 96-901-0851). The inner surface is three phases of rutile TiO2 (PDF 96-900-9084), ZrTiO4 (PDF 96-901-0851) and Al2O3 (PDF 96-900-9682). According to Formula (8), the mass fractions of the TiO2 and ZrTiO4 phases on the outer surface are 91% and 9%, respectively. The strongest diffraction peaks of TiO2 and ZrTiO4 are (110) and (111), respectively, and the corresponding RIR values are 3.74 and 6.43, respectively. The mass fractions of TiO2, ZrTiO4 and Al2O3 on the inner surface are 61.07%, 4.06% and 34.87%, respectively. During the calculation, the strongest diffraction peaks of TiO2, ZrTiO4 and Al2O3 were (110), (111) and (116), respectively, and the corresponding RIR values were 3.74, 6.43 and 1.05, respectively.
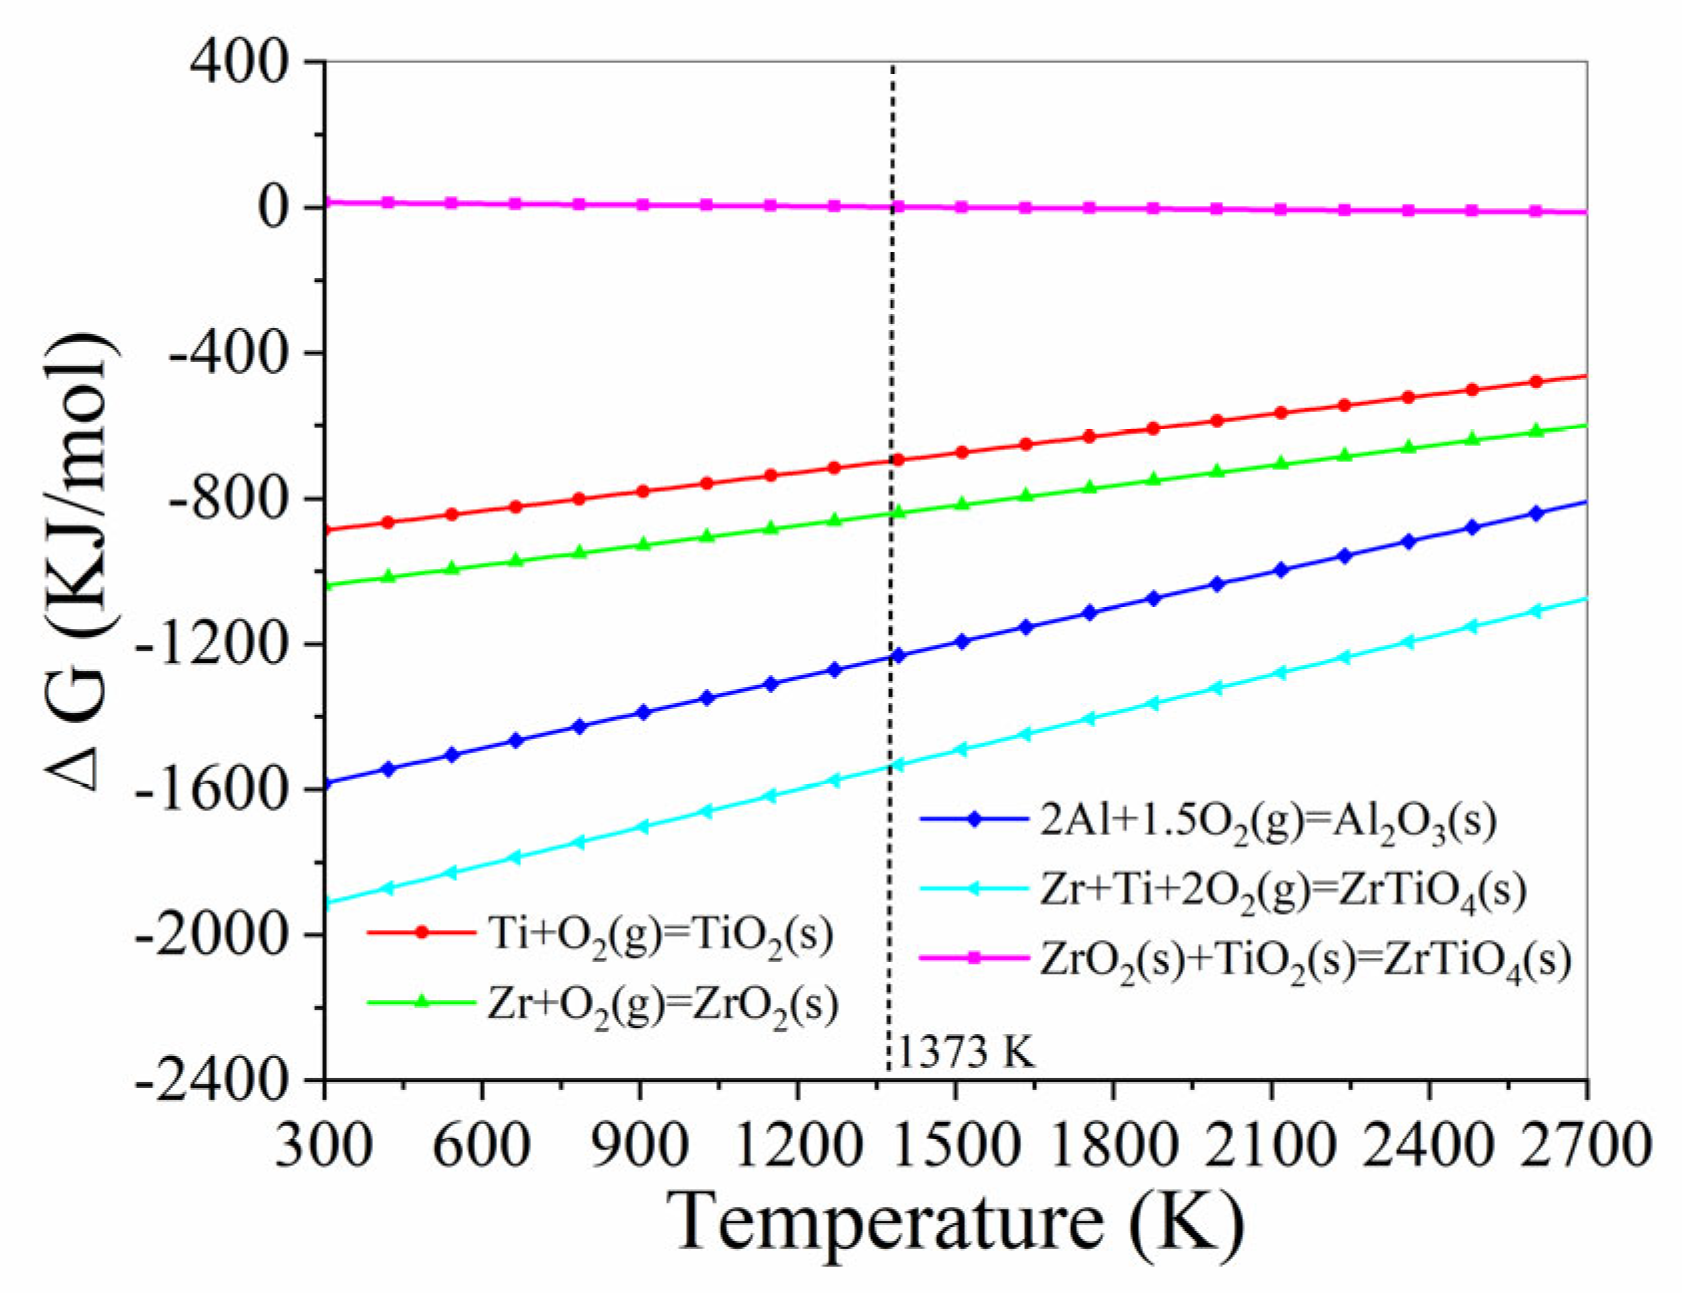
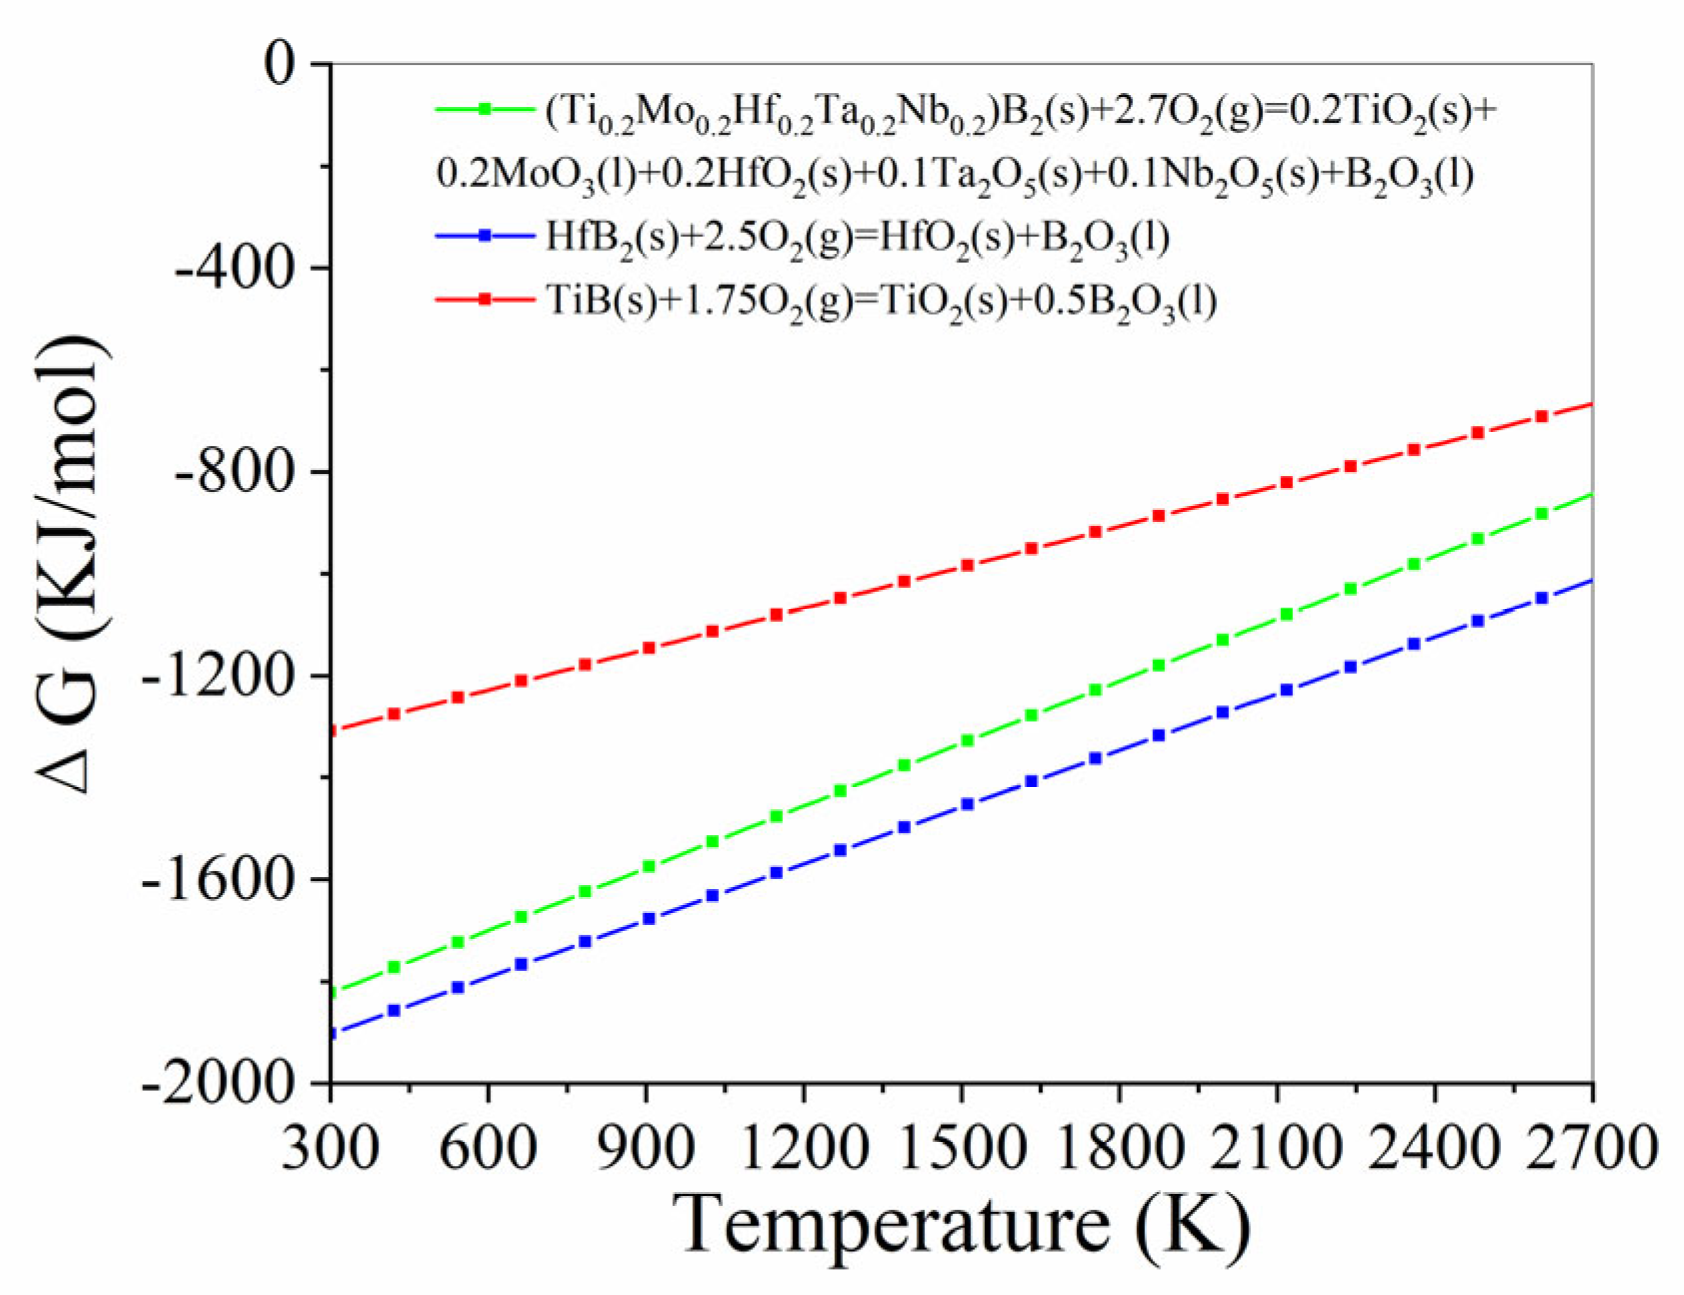
Figure 9 shows the SEM morphology of the outer surface and inner surface of the Ti60 matrix shedding oxide film. As can be seen from Figure 9a, the outer surface of the oxide film is composed of massive large particles + dispersed white small particles. Combined with the results of EDS (Table 5) and XRD (Figure 8a), it can be seen that the massive particles are TiO2, which come from the oxidation of Ti (Table 1) in the Ti60 matrix, that is, Ti + O2 = TiO2. The small white particles are srilankite ZrTiO4, which may be due to the reaction of Zr and Ti in the Ti60 matrix with O2 in the air at 1100 °C, that is, Ti + Zr + 2O2 = ZrTiO4, but the content is less (9%). Instead, Ti and Zr in the Ti60 matrix first react with O2 in the air to produce TiO2 and ZrO2, respectively, and then TiO2 reacts with ZrO2 to produce ZrTiO4 (TiO2 + ZrO2 = ZrTiO4) because the free energy of Ti + Zr + 2O2 = ZrTiO4 is the lowest according to the reaction formula (Figure 10). It is easiest for this reaction to proceed.
It can be seen from Figure 9b–d that the inner surface of the oxide film is massive particles + rock sugar-like particles. Combined with the results of EDS (Table 5) and XRD (Figure 8b), it can be seen that the massive particles are mainly TiO2, which comes from the oxidation of Ti (Table 1) in the Ti60 matrix, that is, Ti + O2 = TiO2. The bulk particles of rock sugar are mainly Al2O3, which comes from the oxidation of Al in the Ti60 matrix (Table 1), that is, 4Al + 3O2 = 2Al2O3. In addition, a small amount of srilankite ZrTiO4 is also produced (4.06%, Table 1).
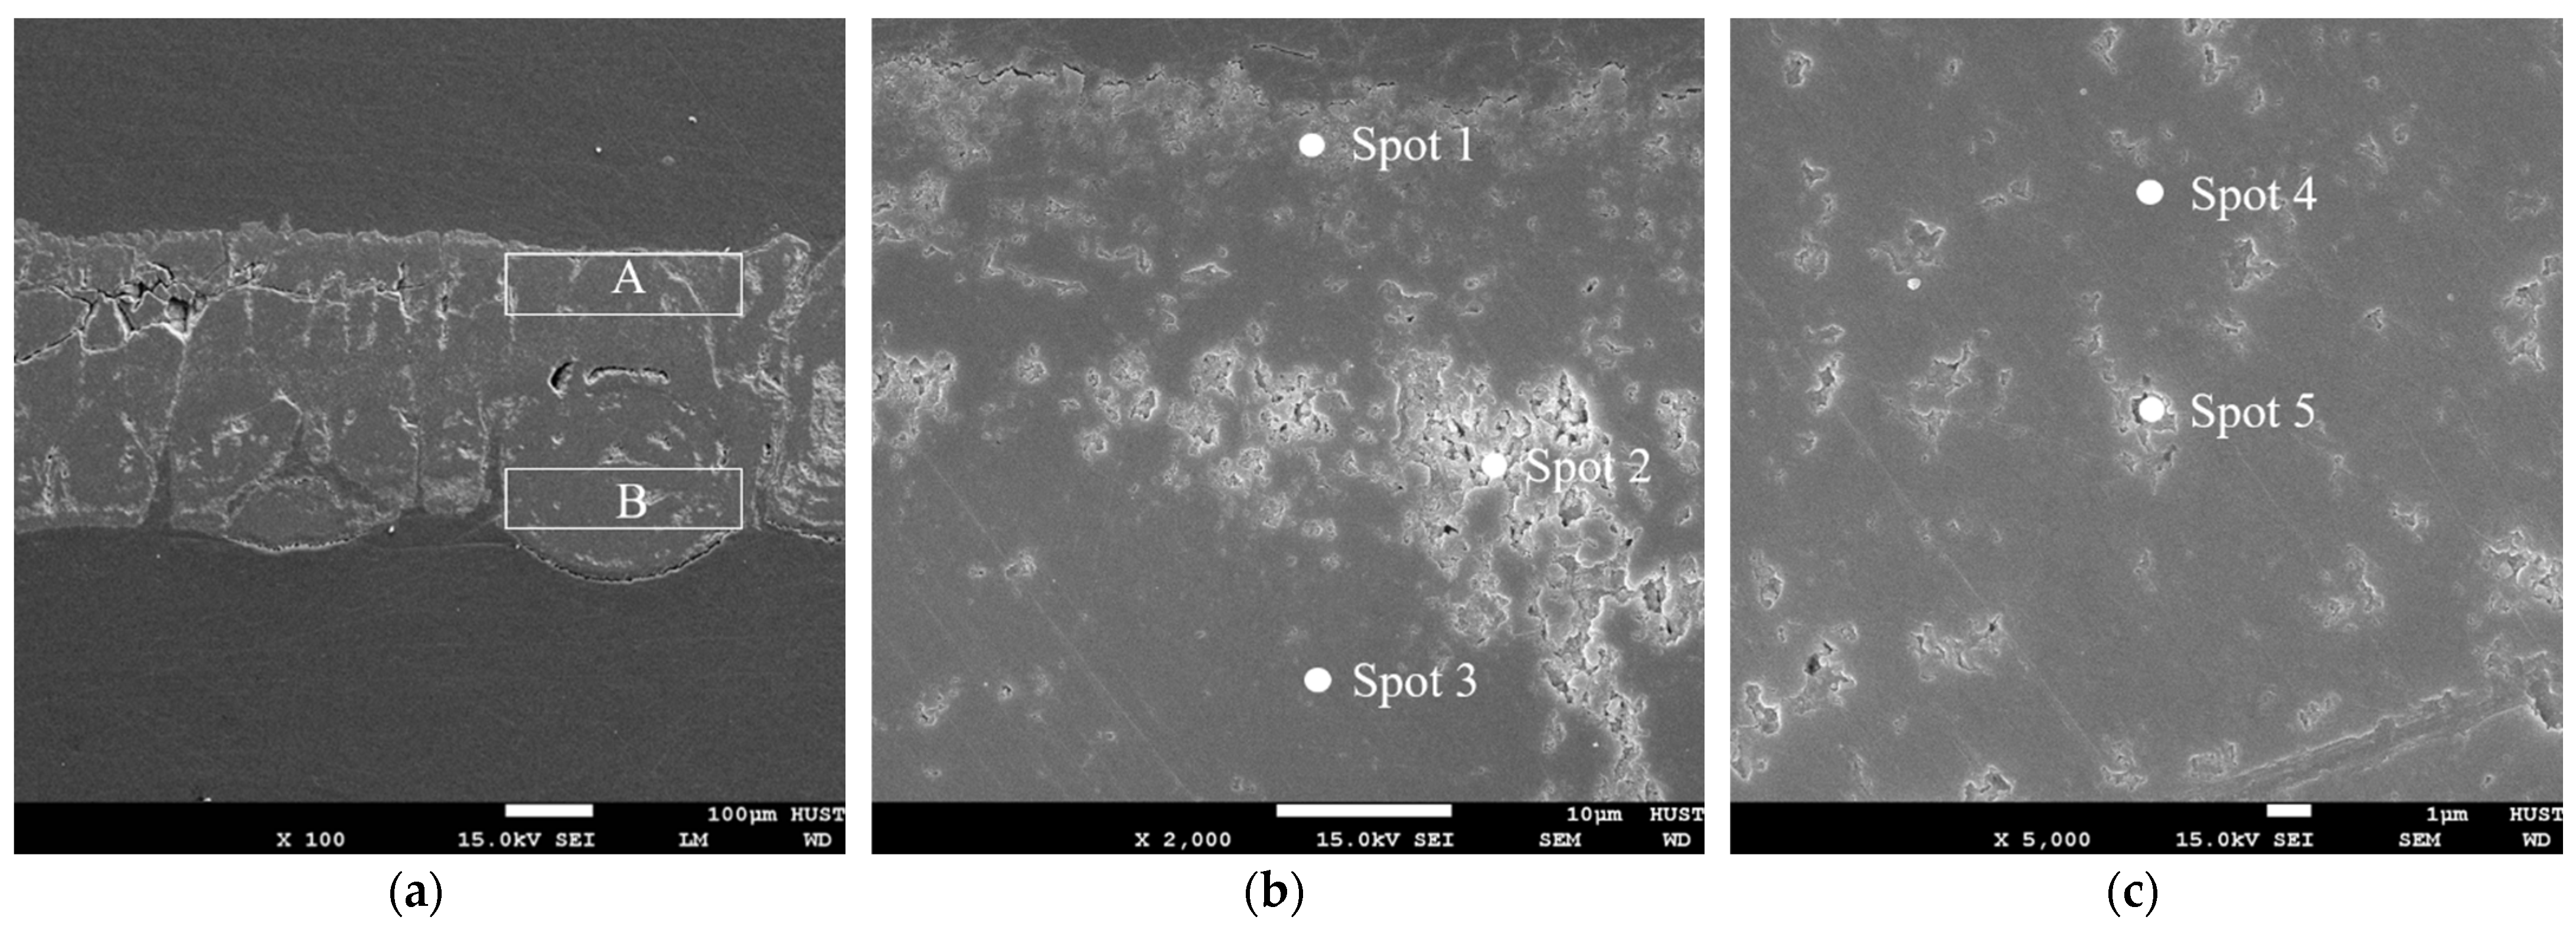
Figure 11 shows the cross-section SEM morphology of the oxide film layer of the Ti60 matrix after oxidation at 1100 °C × 60 h. As can be seen from Figure 11, Table 6 and XRD (Figure 8), the thickness of the shed oxide film is about 320~380 μm. The content of the Al element near the upper (outer) surface of the oxide film is less, while the content of the Al element near the lower (inner) surface of the oxide film is relatively more. There are two phases of TiO2 + ZrTiO4 in the oxide film layer near the upper (outer) surface and three phases of TiO2 + ZrTiO4 + Al2O3 in the oxide film layer near the lower (inner) surface. This oxidation product indicates that the Ti60 matrix follows the selective oxidation theory at 1100 °C; that is, under the condition of high-temperature oxidation, Ti and Zr elements diffuse outward and preferentially form ZrTiO4 and TiO2 (in excess of Ti) on the surface layer. Because their Pilling–Bedworth volume ratios γ are 3.16 and 1.95, respectively, both of which are greater than 1, the oxide films of ZrTiO4 and TiO2 have integrity. However, because the γ value of ZrTiO4 is too large, the internal stress of the films is large, and the films are prone to rupture and lose protection or have poor protection, which can be demonstrated by the numerous cracks in Figure 11. However, the Al element diffused slowly and was enriched at the interface between the ZrTiO4 + TiO2 oxide film and the Ti60 matrix, oxidizing to form Al2O3. As the Pilling–Bedworth volume ratio γ of Al2O3 was 1.28, the Al2O3 film had integrity.
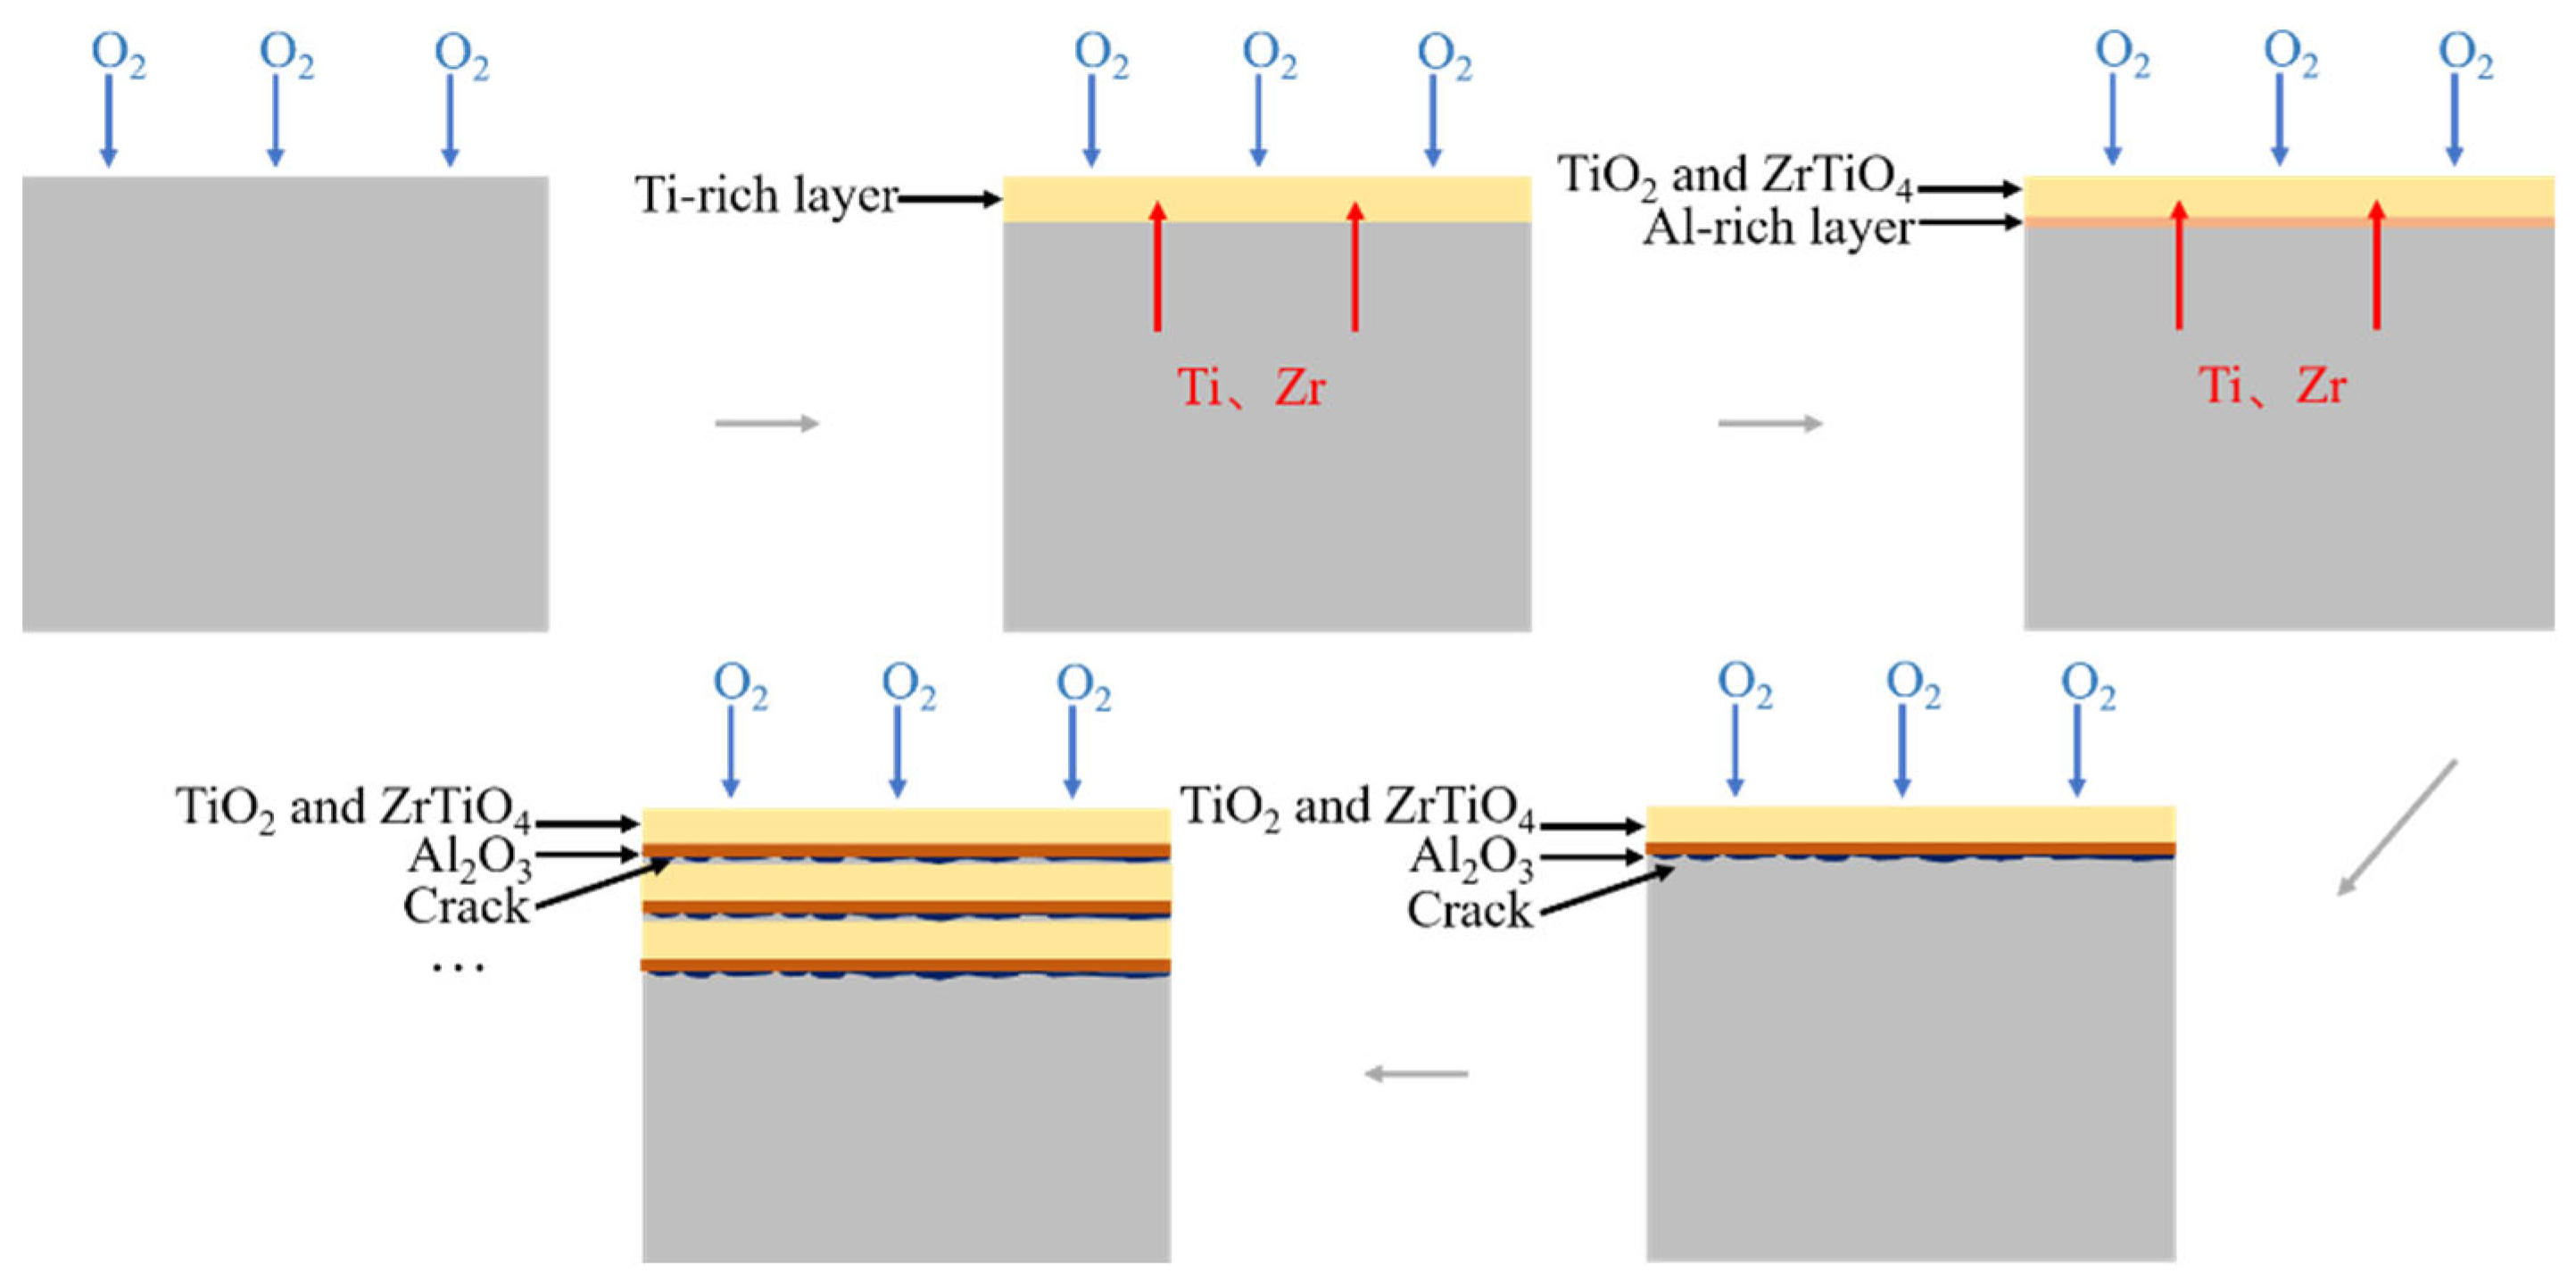
It should be pointed out that the protection of the oxide film depends not only on the integrity of the oxide film, but also on the melting point of the oxide film, the density of the oxide film, the thermodynamic stability of the oxide film, the adhesion of the oxide film, the thermal expansion coefficient of the oxide film, the stress in the oxide film and other factors. Therefore, with the increase in the oxide film thickness, the internal stress of the oxide film increases, and the thermal expansion coefficient of the oxide film is different from that of the matrix, which easily cracks and falls off. Once this happens, the external oxygen can contact the internal unoxidized matrix and selective oxidation occurs again, repeating the above process. Figure 12 shows the schematic diagram of the oxidation process of the Ti60 matrix.
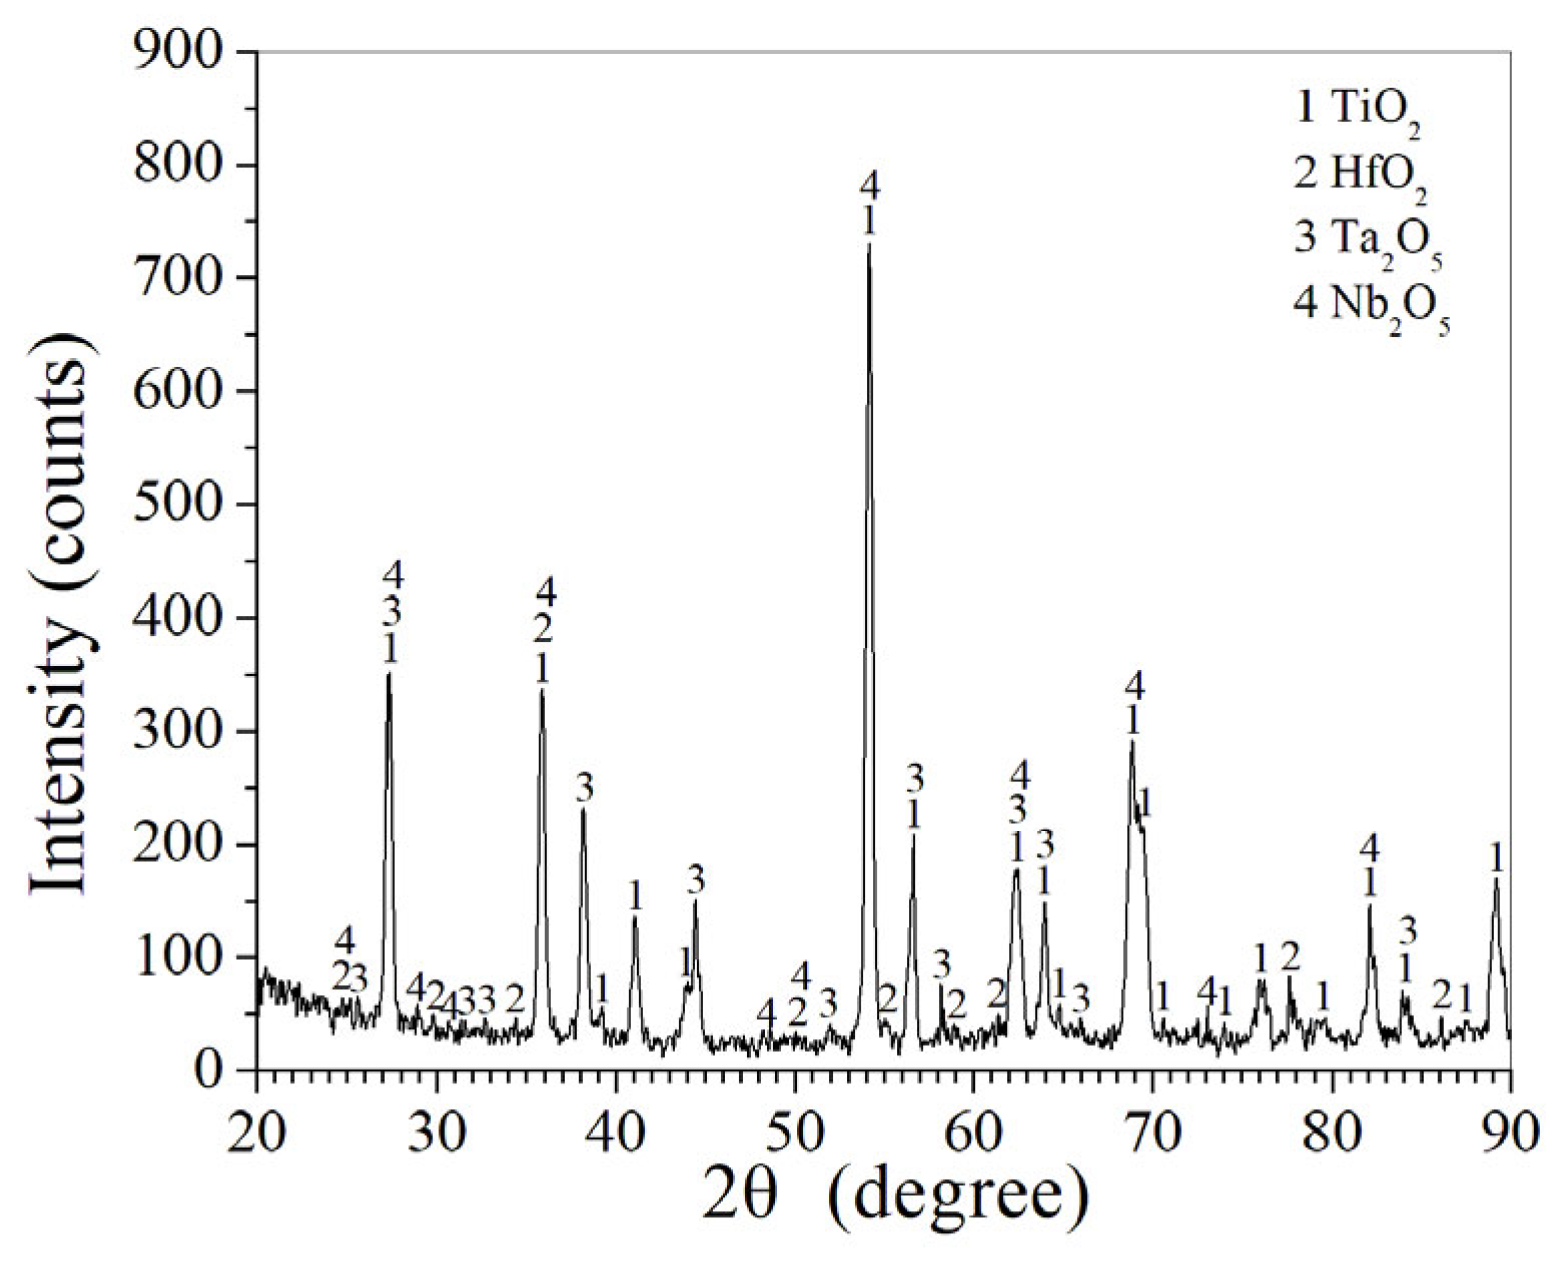
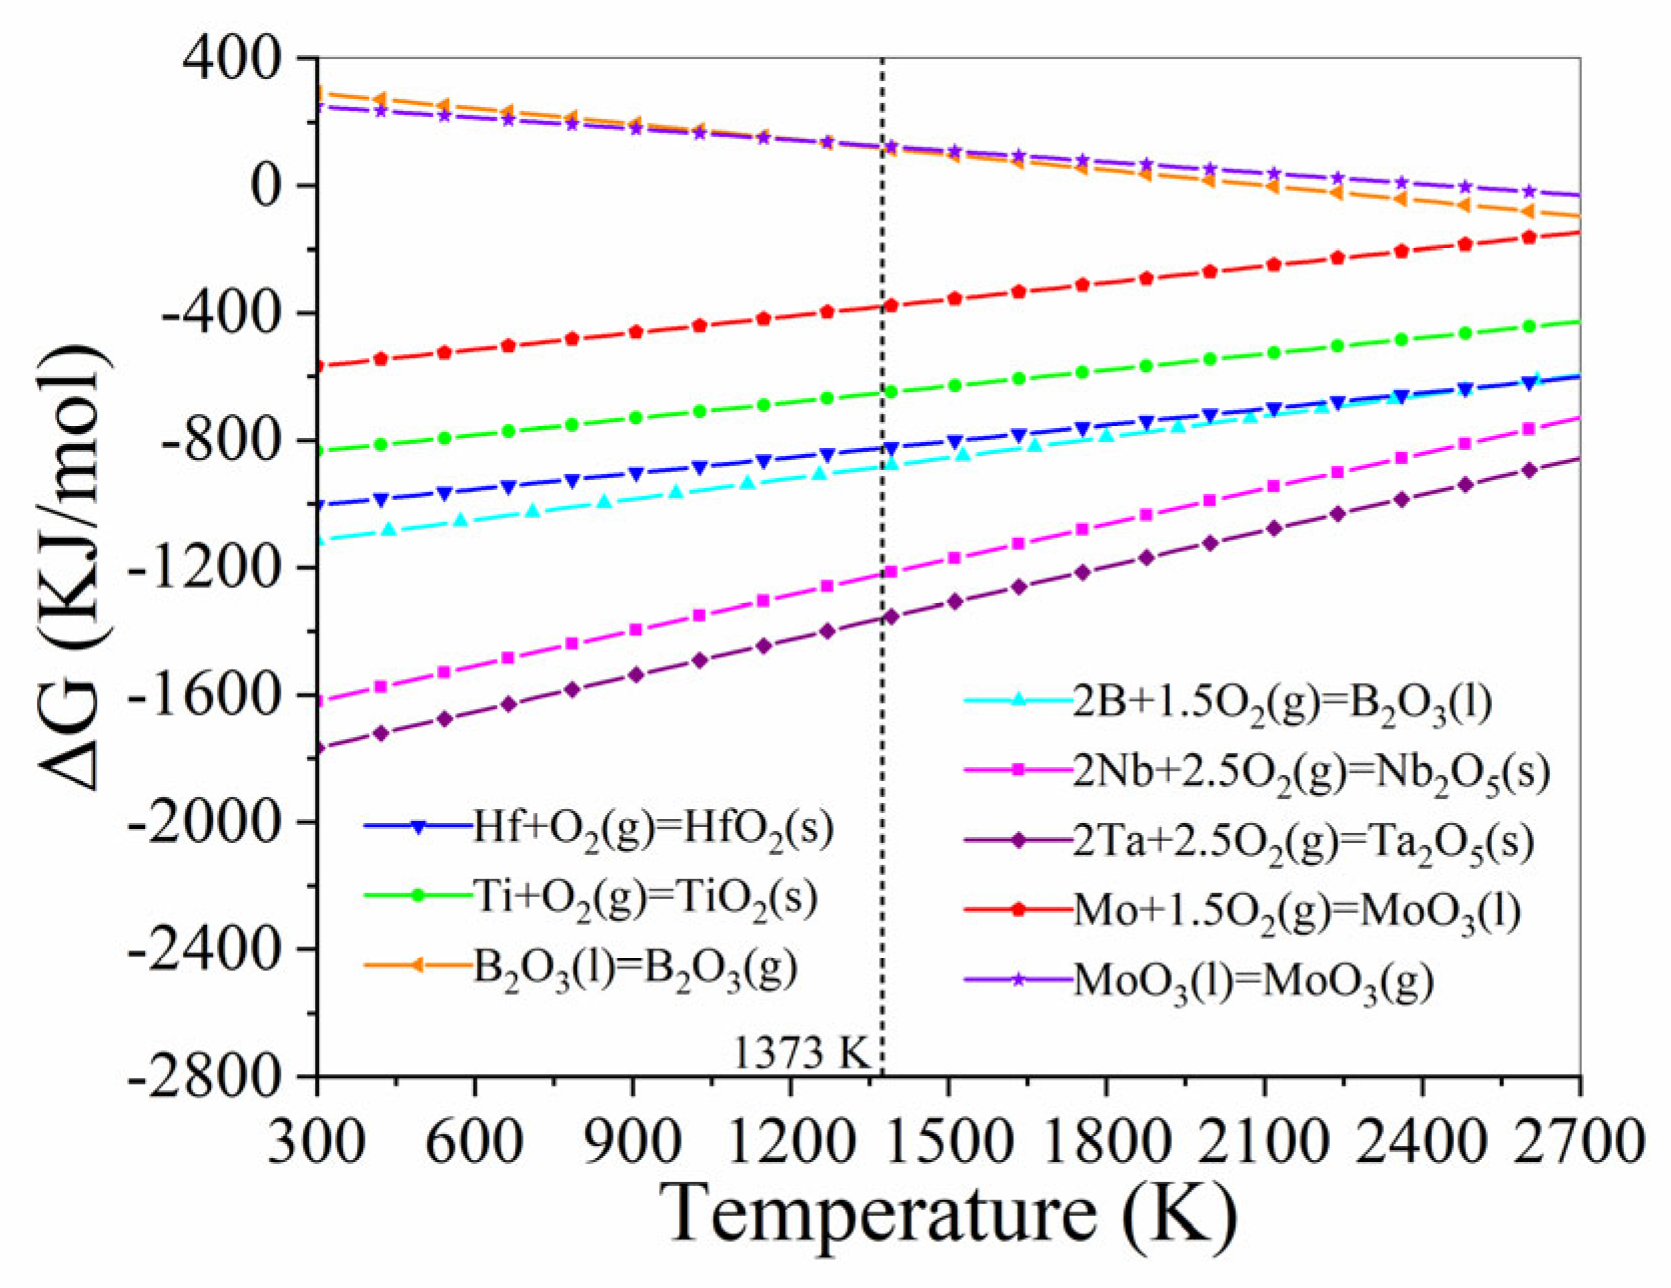
Figure 13 is the XRD pattern of the laser cladding coating after air oxidation at 1100 °C × 120 h. It can be seen from the figure that the laser coating after oxidation is mainly composed of four phases, TiO2 (PDF 96-900-4143), HfO2 (PDF 96-154-5065), Ta2O5 (PDF 96-210-2125) and Nb2O5 (PDF 96-152-8679). This is consistent with what has been reported in the literature [17,27,28]. However, no diffraction peaks of MoO3 and B2O3 were found, which may be due to the evaporation of MoO3 and B2O3 generated during the oxidation process of the laser cladding coating surface because the melting points of MoO3 and B2O3 are 795 °C and 450 °C, respectively, and the boiling points are 2065 °C and 1155 °C, respectively. It can be seen that MoO3 and B2O3 generated during the oxidation process were liquid at the oxidation temperature of 1100 °C but did not reach the boiling point, so there was evaporation. On the other hand, the melting points of TiO2, HfO2, Ta2O5 and Nb2O5 are 1843 °C, 2774 °C, 1785 °C and 1512 °C, respectively, which are all higher than the oxidation temperature of 1100 °C, so they could be retained after oxidation.
The laser cladding coating is mainly composed of seven phases, TiO2, (Ti0.2Hf0.2Mo0.2Ta0.2Nb0.2)B2, HfB2, Hf1.86Mo0.14, TiHf, TiB and Mo4.00B3.40 (Figure 2); therefore, the coating may react as follows during the air oxidation process:
Figure 14 shows the relationship between the free energy and temperature of the partial reaction equations with thermodynamic data. It can be seen from the figure that the free energies of Equations (10), (11) and (14) are all negative at 1100 °C, that is, these reactions can occur.
In addition, the mass fractions of TiO2, HfO2, Ta2O5 and Nb2O5 calculated according to Formula (8) are 55.72%, 1.81%, 32.12% and 10.35%, respectively. The strongest diffraction peaks of TiO2, HfO2, Ta2O5 and Nb2O5 are (110), (111), (11) and (11), and the corresponding RIR values are 3.62, 15.89, 6.28 and 3.43, respectively.
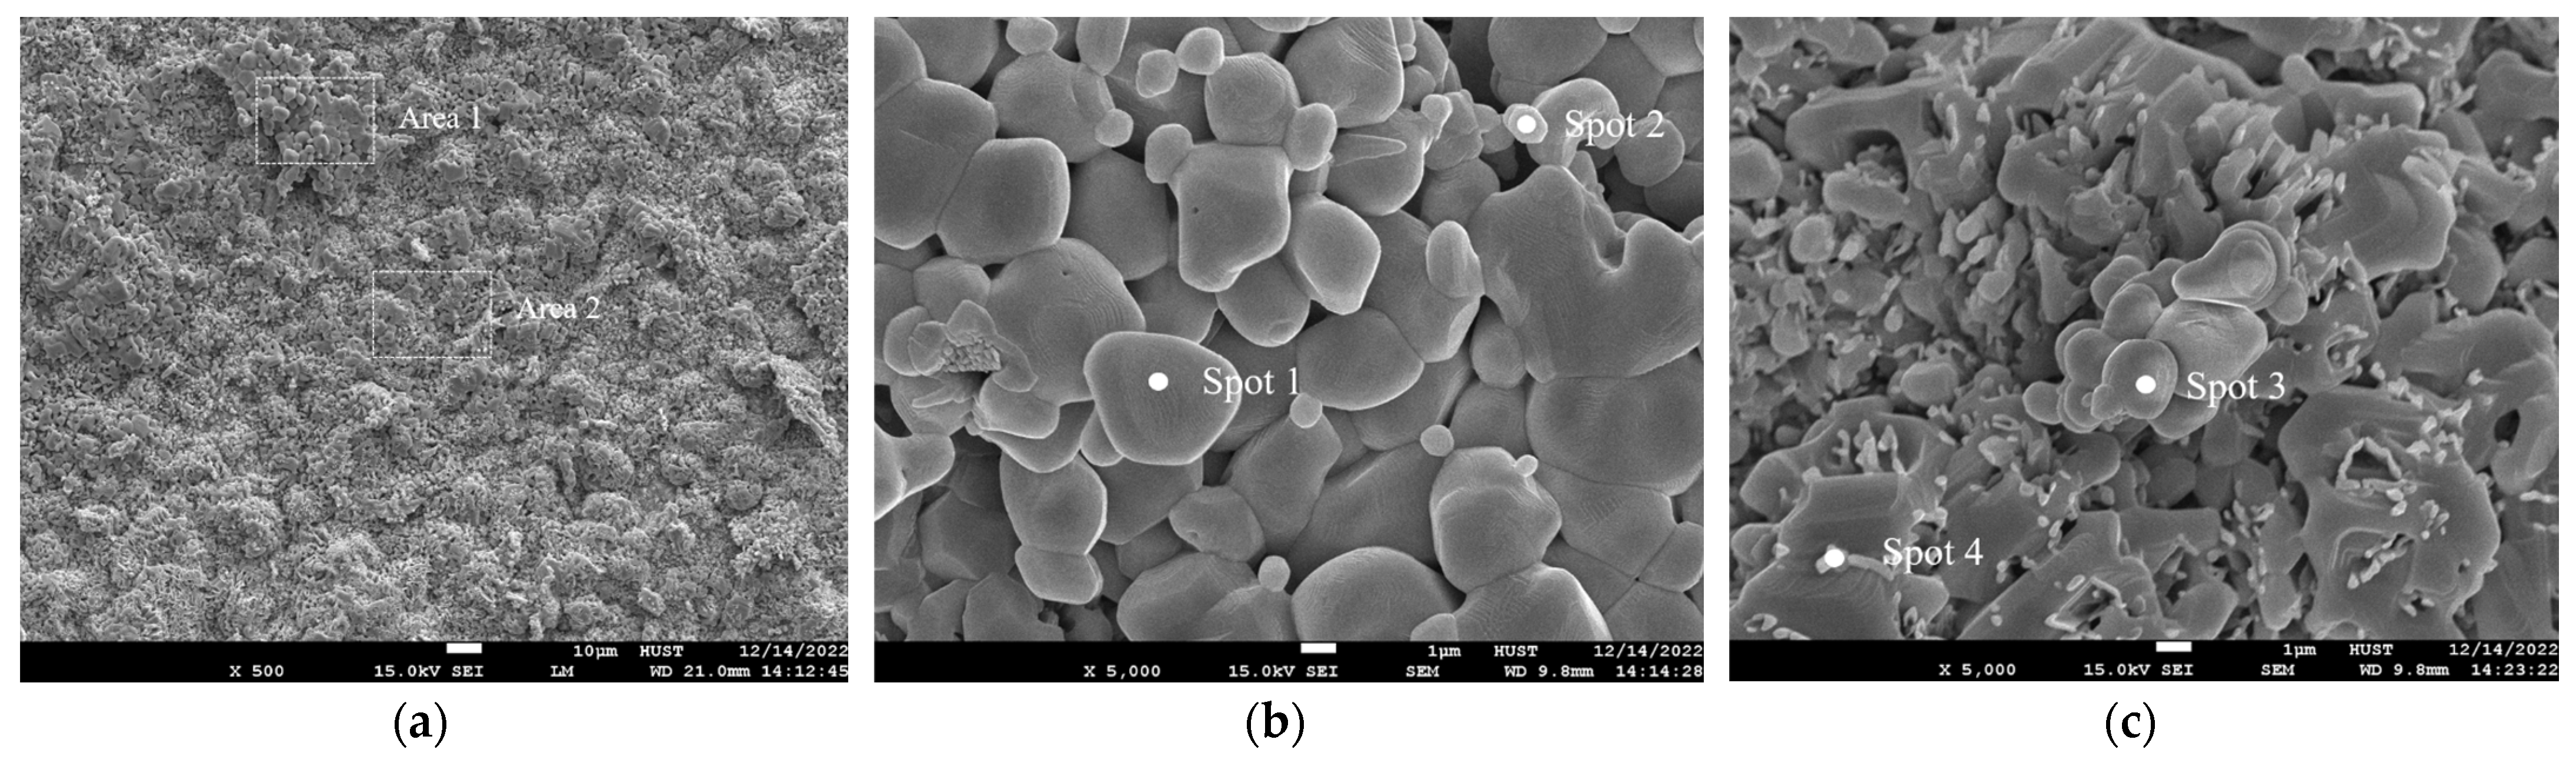
Figure 15 shows the SEM morphology of the surface of the laser cladding coating after air oxidation at 1100 °C × 120 h. It can be seen from the figure that the oxidized surface of the laser cladding coating is formed via the aggregation of dense fine particles (Figure 15a), which is the same as the oxidized surface morphology of high-entropy ceramics reported by Ye [29]. Combined with the results of EDS (Table 7) and XRD (Figure 13), it can be seen that these fine particles are mainly composed of Ti-Hf-Ta-Nb-O polyphase mixed oxides, which have a low oxygen diffusion rate and excellent high-temperature stability. The porosity on the surface of the oxide layer may be due to the low melting point of MoO3 and B2O3 generated through oxidation at 1100 °C.
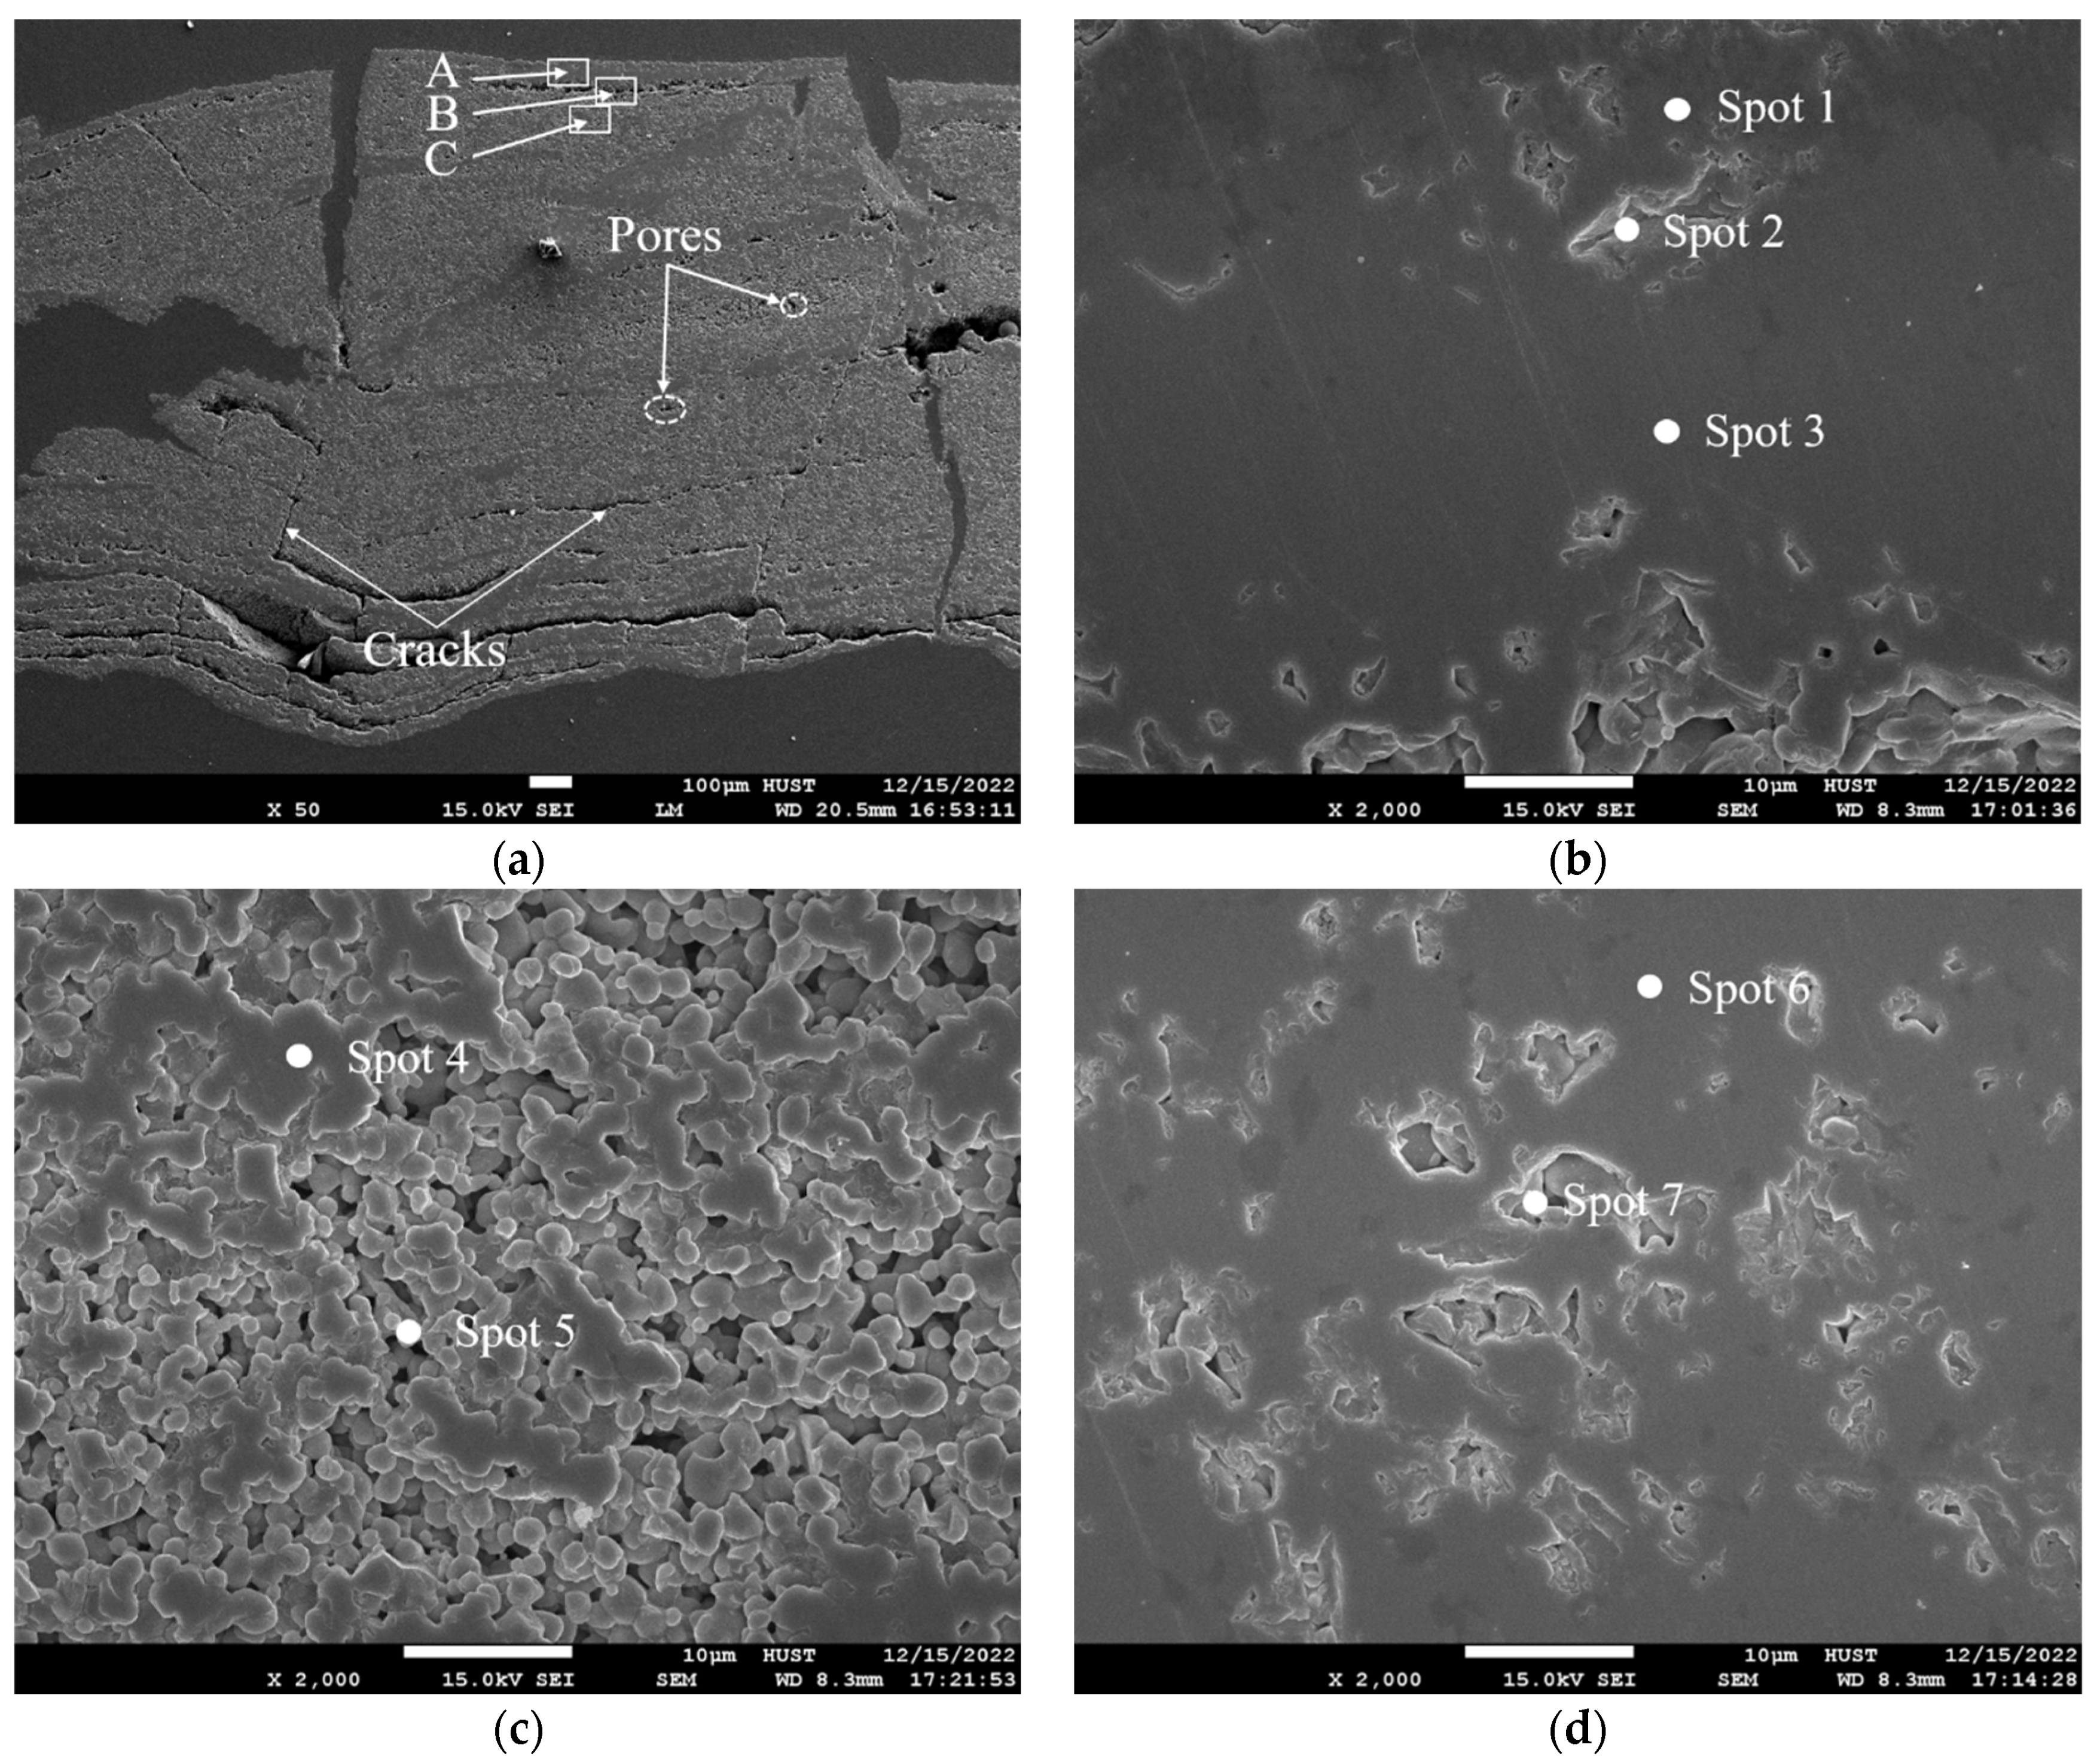
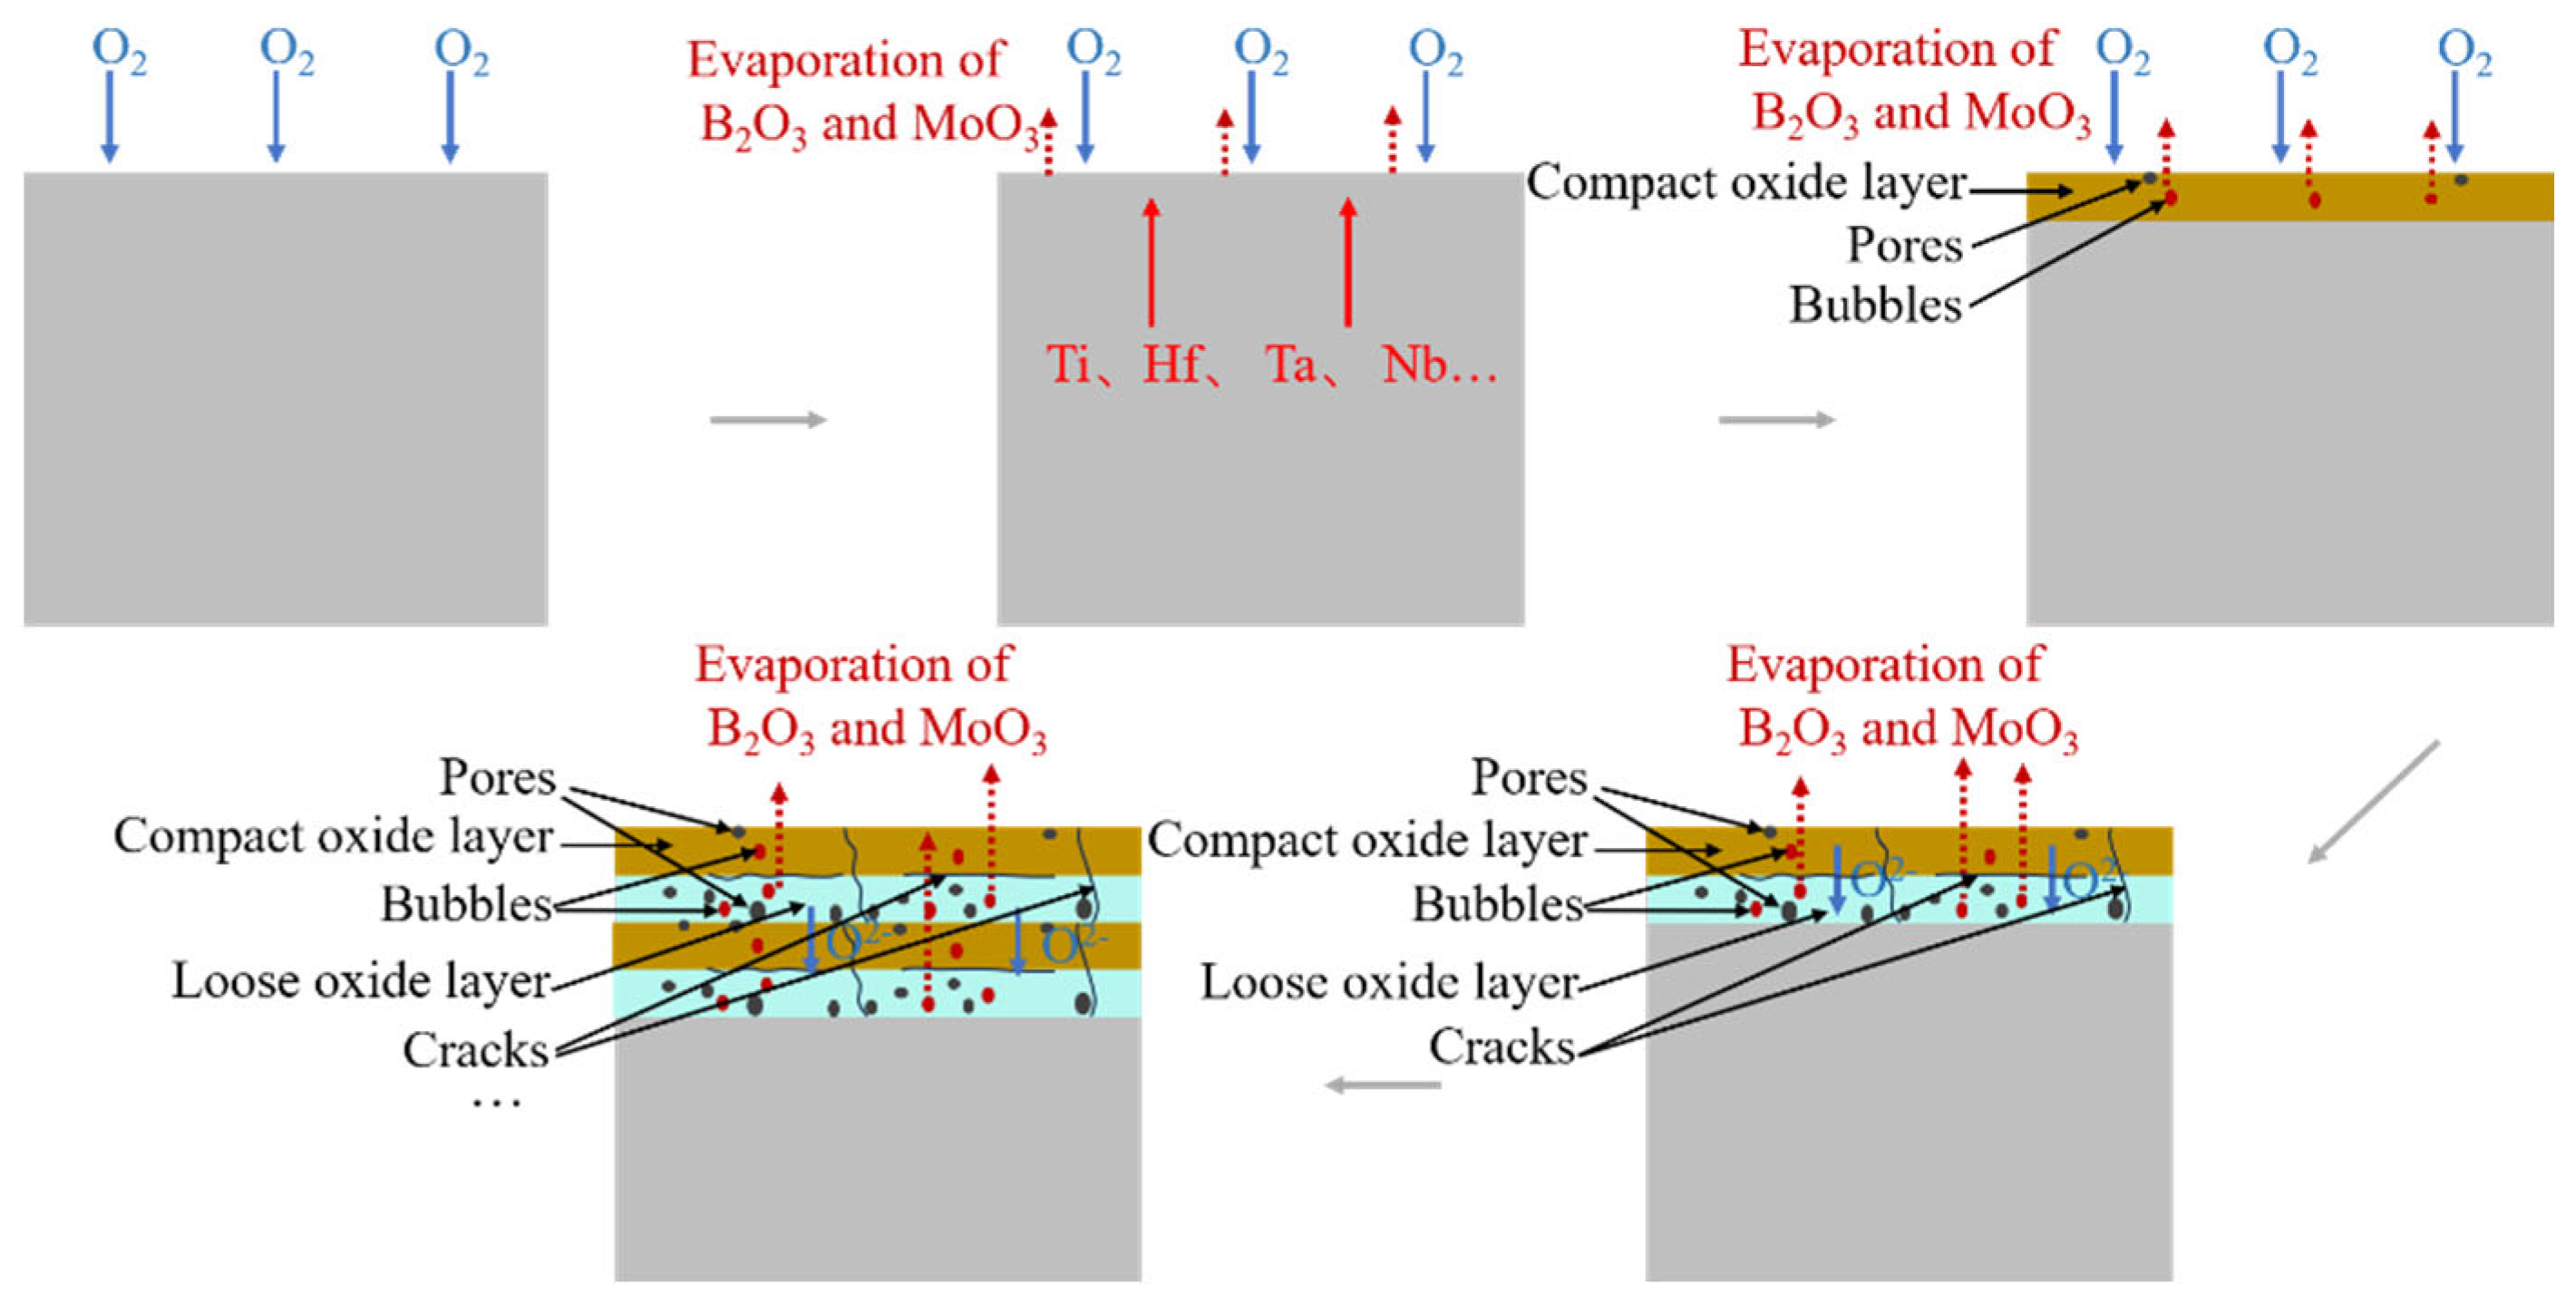
Figure 16 shows the SEM morphology of the laser cladding cross-section coating after air oxidation at 1100 °C × 120 h. It can be seen from Figure 16 and Table 8 that the laser cladding cross-section coating presents an alternating situation of dense oxide layer and loose inner oxide layer, and the loose inner oxide layer has fine particles and no B and Mo elements. Among them, the dense oxide layer may be the reaction between the metal elements in the laser cladding coating and the oxygen diffused inside the coating to produce a dense Ti-Hf-Ta-Nb-Mo-B-O oxide layer, which has an excellent high-temperature protection effect and can effectively reduce the rate of oxygen diffusion to the inside of the coating. However, with the extension of oxidation time, oxygen ions will eventually spread through the dense oxide layer to the interior of the coating. Once the liquid B2O3 and MoO3 phases generated by the oxidation of the internal coating cannot escape, a porous loose oxide layer is formed at the subsurface layer.
As we all know, the oxidation of laser cladding coating is essentially the oxidation of various phases in the coating, and the different elements of phases have a significant impact on the oxidation resistance of the coating [30]. In order to investigate the oxidation possibility of each element in the laser cladding coating at 1100 °C, the free energy of each element in the laser cladding coating reacting with O2 was calculated as ΔG. Figure 17 shows the standard free energy ΔG–temperature T curve of the reaction of each element with O2 in the laser cladding coating. It can be seen from the figure that the ΔG values of Ti, Hf, Mo, Ta, Nb and B in the laser cladding coating are all negative when reacting with O2 at 1100 °C, indicating that they can be oxidized to their respective oxides. Liquid B2O3 and MoO3 cannot become gaseous B2O3 and MoO3 at 1100 °C, indicating that liquid B2O3 and MoO3 run away via evaporation rather than vaporization.
Figure 18 shows the schematic diagram of the oxidation process of the laser cladding coating. In the initial oxidation stage of the laser cladding coating at 1100 °C, O2 adsorbed on the surface of the coating, and the elements of Ti, Hf, Ta, Mo, Nb and B in the coating diffused outward and reacted with the O2 diffused inside the coating to form high thermal stability for TiO2, HfO2, Ta2O5, MoO3, Nb2O5 and B2O3 oxides. It formed a dense Ti-Hf-Ta-Nb-Mo-B-O oxide layer with MoO3 and B2O3 in the coating. With the extension of oxidation time, O2− ions will still spread through the dense oxide layer on the surface to the interior of the coating and form the inner oxide layer. However, the thermal expansion coefficient of different oxides is different from that of the unoxidized phase in the coating, resulting in local cracking. Once this happens, the external oxygen can come into contact with the internal unoxidized coating and the selective oxidation occurs again, repeating the process.
In short, with the continuous increase in the thrust-to-weight ratio of aero engines, the temperature of the compressor outlet continues to rise, and the urgent need for new high-temperature titanium alloys with higher temperature resistance is put forward. For as long as the problem of low ductility and toughness of Ti3Al, Ti2AlNb and TiAl-based alloys resistant to more than 600 °C has not been completely solved, the use of coating technology to improve the service life of existing 600 °C high-temperature titanium alloys such as Ti60 alloy is a solution. In addition, high-entropy borides are a new class of high-temperature and high-entropy materials that can withstand 1500 °C, discovered since 2016 [14]. If this new high-temperature and high-entropy material can be applied to the surface of high-temperature titanium alloy, it will certainly improve its high-temperature oxidation resistance. Based on this idea, a composite coating containing (Ti0.2Hf0.2Mo0.2Ta0.2Nb0.2)B2 high-entropy borides was prepared on the surface of Ti60 alloy by using advanced laser cladding technology. The experimental results also preliminarily confirmed the feasibility of this technical scheme, but the question of how to prepare high-entropy boride coating with a high content of (Ti0.2Hf0.2Mo0.2Ta0.2Nb0.2)B2 needs further research in the future.
4. Conclusions
(1) With Ti, Hf, Mo, Ta and Nb metal powder and B powder as raw materials, a composite coating with 29.27% (Ti0.2Hf0.2Mo0.2 Ta0.2Nb0.2)B2 high-entropy boride was prepared on Ti60 alloys using laser cladding based on 2600 W laser power, 4.5 mm spot diameter, 8 mm/s laser scanning speed, 30% laser spot overlap rate, 99.99% argon purity and 15 L/min pressure gas flow rate. The coating was well combined with the substrate.
(2) The oxidation kinetics curves of both the laser cladding coating and the Ti60 matrix followed parabolic law, but the oxidation resistance of the laser cladding coating at 1100 °C was obviously better than that of the Ti60 matrix, and its oxidation rate was 1/4.8 of that of Ti60 matrix; specifically, the maximum oxidation gain rates of the laser cladding coating and the Ti60 matrix were 54.79 mg/cm2 and 262.92 mg/cm2, respectively.
(3) The surface products of the Ti60 matrix after oxidation at 1100 °C and 60 h were mainly TiO2 and ZrTiO4 phases, whose mass fractions were 91% and 9%, respectively, while the surface products of the laser cladding coating after oxidation at 1100 °C and 120 h were mainly TiO2, HfO2, Ta2O5 and Nb2O5 phases, whose mass fractions were 55.72%, 1.81%, 32.12% and 10.35%, respectively.
(4) The successful preparation of Ti-Hf-Mo-Ta-Nb-B composite coating resistant to 1100 °C will greatly improve the application ratio of Ti60 high-temperature titanium alloy in new advanced aero engines for the purpose of weight reduction and increase in thrust–weight ratio.
Author Contributions
Investigation—K.H. and X.H.; writing—original draft preparation, X.H.; writing—review and editing, K.H. All authors have read and agreed to the published version of the manuscript.
Funding
This work was supported by the Open Project Program of the Key Laboratory of Laser Technology and Optoelectronic Functional Materials of Hainan Province, Hainan Normal University.
Institutional Review Board Statement
Not applicable.
Informed Consent Statement
Not applicable.
Data Availability Statement
The data of this study are available from the corresponding author upon reasonable request.
Acknowledgments
The authors are also grateful to the Analytical and Testing Center of Huazhong University of Science and Technology.
Conflicts of Interest
The authors declare no conflict of interest.
References
- Wei, S.Y.; Shi, W.M.; Wang, D.C.; Wang, Q.J.; Chen, Z.Y.; Liu, J.R. Microstructure and mechanical properties of high temperature titanium alloy Ti60 at 600 °C. Chin. J. Nonferrous Met. 2010, 20, 801–806. [Google Scholar]
- Liu, H.P.; Wang, X.H.; Hao, S.S.; Feng, Z.X.; Hao, M.Y. Oxidation of Ti60 alloy and its protection by NiCrAlY coating. J. Mater. Eng. 1998, 7, 18–20. [Google Scholar]
- Tang, Z.L.; Wang, F.H.; Wang, Q.J.; Wu, W.T.; Li, D. Effect of coatings on oxidation resistance and mechanical properties of Ti60 alloy. Acta Metall. Sin. 1998, 34, 325–331. [Google Scholar]
- Xiong, Y.M.; Zhu, S.L.; Wang, F.H. Effect of ultrafine enamel coating on the oxidation and mechanical property of Ti60 alloy. Acta Metall. Sin. 2004, 40, 768–772. [Google Scholar]
- Li, J.F.; Liao, Y.J.; Li, X.H.; Wang, Z.S.; Li, G.Q. Oxidation resistance enhancement of Ti60 alloy coated with Ni-Co-Cr-Al-Y-Si layer. Chin. J. Vac. Sci. Technol. 2010, 30, 520–523. [Google Scholar]
- Yan, W.; Sun, F.J.; Liu, J.R.; Liu, J. Cycling thermal shock resistance of Ti-Al-Cr coating deposited on Ti60 alloy by arc ion plating. J. Northeast. Univ. 2010, 31, 411–414. [Google Scholar]
- Chen, C. Study on Antioxidative Coating of Titanium Alloy. Master’s Thesis, Dalian Maritime University, Dalian, China, September 2017. [Google Scholar]
- Zhang, Z.; Li, J.N.; Sun, X.G.; Ma, F.K.; Zhang, Z.Z.; Shi, C.W.; Li, Y.J.; Li, C.J.; Zhao, B.; Liu, Z.Y.; et al. Microstructure performance enhancement of Si3N4 reinforced laser clad KF110 base composite coatings. Int. J. Appl. Ceram. Tec. 2022, 19, 409–414. [Google Scholar] [CrossRef]
- Zhang, Z.; Li, J.N.; Ye, Z.Y.; Jing, C.N.; Wang, M.; Li, T.T.; Sun, X.G. Enhancing high-temperature oxidation resistance of titanium alloy with KF110-B4C-Ag through laser technology. Surf. Rev. Lett. 2022, 29, 2250003. [Google Scholar] [CrossRef]
- Hong, S.C.; Li, J.; Zhao, P.; Xu, Y.S.; Li, W.G. Evolution in wear and high-temperature oxidation resistance of laser-clad AlxMoNbTa refractory high-entropy alloys coatings with Al addition content. Coatings 2022, 12, 121. [Google Scholar] [CrossRef]
- Zhang, S.; Qi, W.J.; Zhang, R. Effect of Ti content on wear and high-temperature oxidation resistances of laser-clad CoCrMoNbTix high-entropy alloy coatings. Mater. Lett. 2023, 345, 134490. [Google Scholar] [CrossRef]
- Zhao, H.; Zhao, C.C.; Xie, W.X.; Wu, D.; Du, B.N.; Zhang, X.R.; Wen, M.; Ma, R.; Li, R.; Jiao, J.K.; et al. Research progress of laser cladding on the surface of titanium and its alloys. Materials 2023, 16, 3250. [Google Scholar] [CrossRef] [PubMed]
- Zhao, Y.Q. Study on high temperature titanium alloy. Titan. Ind. Prog. 2001, 1, 33–39. [Google Scholar]
- Gild, J.; Zhang, Y.Y.; Harrington, T.; Jiang, S.C.; Hu, T.; Quinn, M.C.; Mellor, W.M.; Zhou, N.X.; Vecchio, K.; Luo, J. High-entropy metal diborides: A new class of high-entropy materials and a new type of ultrahigh temperature ceramics. Sci. Rep. 2016, 6, 37946. [Google Scholar] [CrossRef] [PubMed]
- Mayrhofer, P.H.; Kirnbauer, A.; Ertelthaler, P.; Koller, C.M. High-entropy ceramic thin films; a case study on transition metal diborides. Scr. Mater. 2018, 149, 93–97. [Google Scholar] [CrossRef]
- Kirnbauer, A.; Wagner, A.; Moraes, V.; Primetzhofer, D.; Hans, M.; Schneider, J.M.; Polcik, P.; Mayrhofer, P.H. Thermal stability and mechanical properties of sputtered (Hf, Ta, V, W, Zr)-diborides. Acta Mater. 2020, 200, 559–569. [Google Scholar] [CrossRef]
- Zhang, P.; Cheng, C.Y.; Liu, B.; Xie, W.; Zhu, X.F.; Zhang, J.P.; Fu, Q.Q. Multicomponent (Hf0.25Zr0.25Ti0.25Cr0.25)B2 ceramic modified SiC-Si composite coatings: In-situ synthesis and high temperature oxidation behavior. Ceram. Int. 2022, 48, 12608–12624. [Google Scholar] [CrossRef]
- Tallarita, G.; Licheri, R.; Garroni, S.; Orrù, R.; Cao, G. Novel processing route for the fabrication of bulk high-entropy metal diborides. Scr. Mater. 2019, 158, 100–104. [Google Scholar] [CrossRef]
- Zheng, Q.; Wang, X.H.; Xing, J.J.; Gu, H.; Zhang, G.J. Quantitative analysis for phase compositions of ZrB2-SiC-ZrC ultra-high temperature ceramic composites. J. Inorg. Mater. 2013, 28, 358–362. [Google Scholar] [CrossRef]
- Li, J.; Yu, Z.S.; Wang, H.P.; Li, M.P. Microstructural evolution of titanium matrix composite coatings reinforced by in situ synthesized TiB and TiC by laser cladding. Int. J. Min. Met. Mater. 2010, 17, 481–488. [Google Scholar] [CrossRef]
- He, B.; Lan, J.J.; Yang, G.; Wei, H. Microstructure and wear-resistant properties of in situ TiB-TiC reinforced titanium matrix composites by laser deposition manufacturing. Rare Metal Mat. Eng. 2017, 46, 3805–3810. [Google Scholar]
- Lu, W.J.; Wu, R.J.; Zhang, D.; Zhang, X.N.; Sakata, T.; Mori, H. Interfacial microstructure of TiB/Ti in a Ti-TiB-TiC in situ composite. Compos. Interface 2002, 9, 41–50. [Google Scholar] [CrossRef]
- Feng, H.B.; Zhou, Y.; Jia, D.C.; Meng, Q.C.; Rao, J.C. Growth mechanism of in situ TiB whiskers in spark plasma sintered TiB/Ti metal matrix composites. Cryst. Growth Des. 2006, 6, 1626–1630. [Google Scholar] [CrossRef]
- Yang, S.; Huang, W.D.; Liu, W.J.; Su, Y.P.; Zhou, Y.H. Research on laser rapid directional solidification with ultra-high temperature gradient. Chin. J. Lasers 2002, 29, 475–479. [Google Scholar]
- Tallarita, G.; Licheri, R.; Garroni, S.; Barbarossa, S.; Orru, R.; Cao, G. High-entropy transition metal diborides by reactive and non-reactive spark plasma sintering: A comparative investigation. J. Eur. Ceram. Soc. 2020, 40, 942–952. [Google Scholar] [CrossRef]
- Jia, X.Y.; Liu, P.Y.; Tao, Y. Oxidation behavior of Ti60 alloy at 650~750 °C. J. Mater. Eng. 2003, 6, 18–22. [Google Scholar]
- Zhang, H.Z.; Akhtar, F. Refractory multicomponent boron-carbide high entropy oxidation-protective coating for carbon-carbon composites. Surf. Coat. Technol. 2021, 425, 127697. [Google Scholar] [CrossRef]
- Wang, Y.C.; Zhang, R.Z.; Zhang, B.H.; Skurikhina, O.; Balaz, P.; Araullo-Peters, V.; Reece, M.J. The role of multi-elements and interlayer on the oxidation behaviour of (Hf-Ta-Zr-Nb)C high entropy ceramics. Corros. Sci. 2020, 176, 109019. [Google Scholar] [CrossRef]
- Ye, B.L. Study of High-Entropy Transition Metal Carbide Ceramics. Master’s Thesis, South China University of Technology, Guangzhou, China, May 2020. [Google Scholar]
- Backman, L.; Opila, E.J. Thermodynamic assessment of the group IV, V and VI oxides for the design of oxidation resistant multi-principal component materials. J. Eur. Ceram. Soc. 2019, 39, 1796–1802. [Google Scholar] [CrossRef]
Figure 1.
Structure schematic diagram of the high-entropy borides.

Figure 2.
XRD pattern of laser cladding coating.

Figure 3.
Overall morphology of laser cladding cross-section coating.

Figure 4.
SEM-amplified morphology of different zones in Figure 3: (a) surface zone A. (b) Middle zone B. (c) Interface zone C.
Figure 4.
SEM-amplified morphology of different zones in Figure 3: (a) surface zone A. (b) Middle zone B. (c) Interface zone C.

Figure 5.
Oxidation weight gain curves of laser cladding coating and Ti60 matrix after oxidation at 1200 °C at different times.
Figure 5.
Oxidation weight gain curves of laser cladding coating and Ti60 matrix after oxidation at 1200 °C at different times.

Figure 6.
Photo of Ti60 matrix oxidized at 1100 °C × 60 h.

Figure 7.
Photo of laser cladding coating oxidized at 1100 °C for different times: (a) 80 h; (b) 120 h.
Figure 7.
Photo of laser cladding coating oxidized at 1100 °C for different times: (a) 80 h; (b) 120 h.

Figure 8.
XRD patterns of the inner and outer surfaces of Ti60 matrix at 1100 °C × 60 h: (a) outer surface, (b) inner surface.
Figure 8.
XRD patterns of the inner and outer surfaces of Ti60 matrix at 1100 °C × 60 h: (a) outer surface, (b) inner surface.

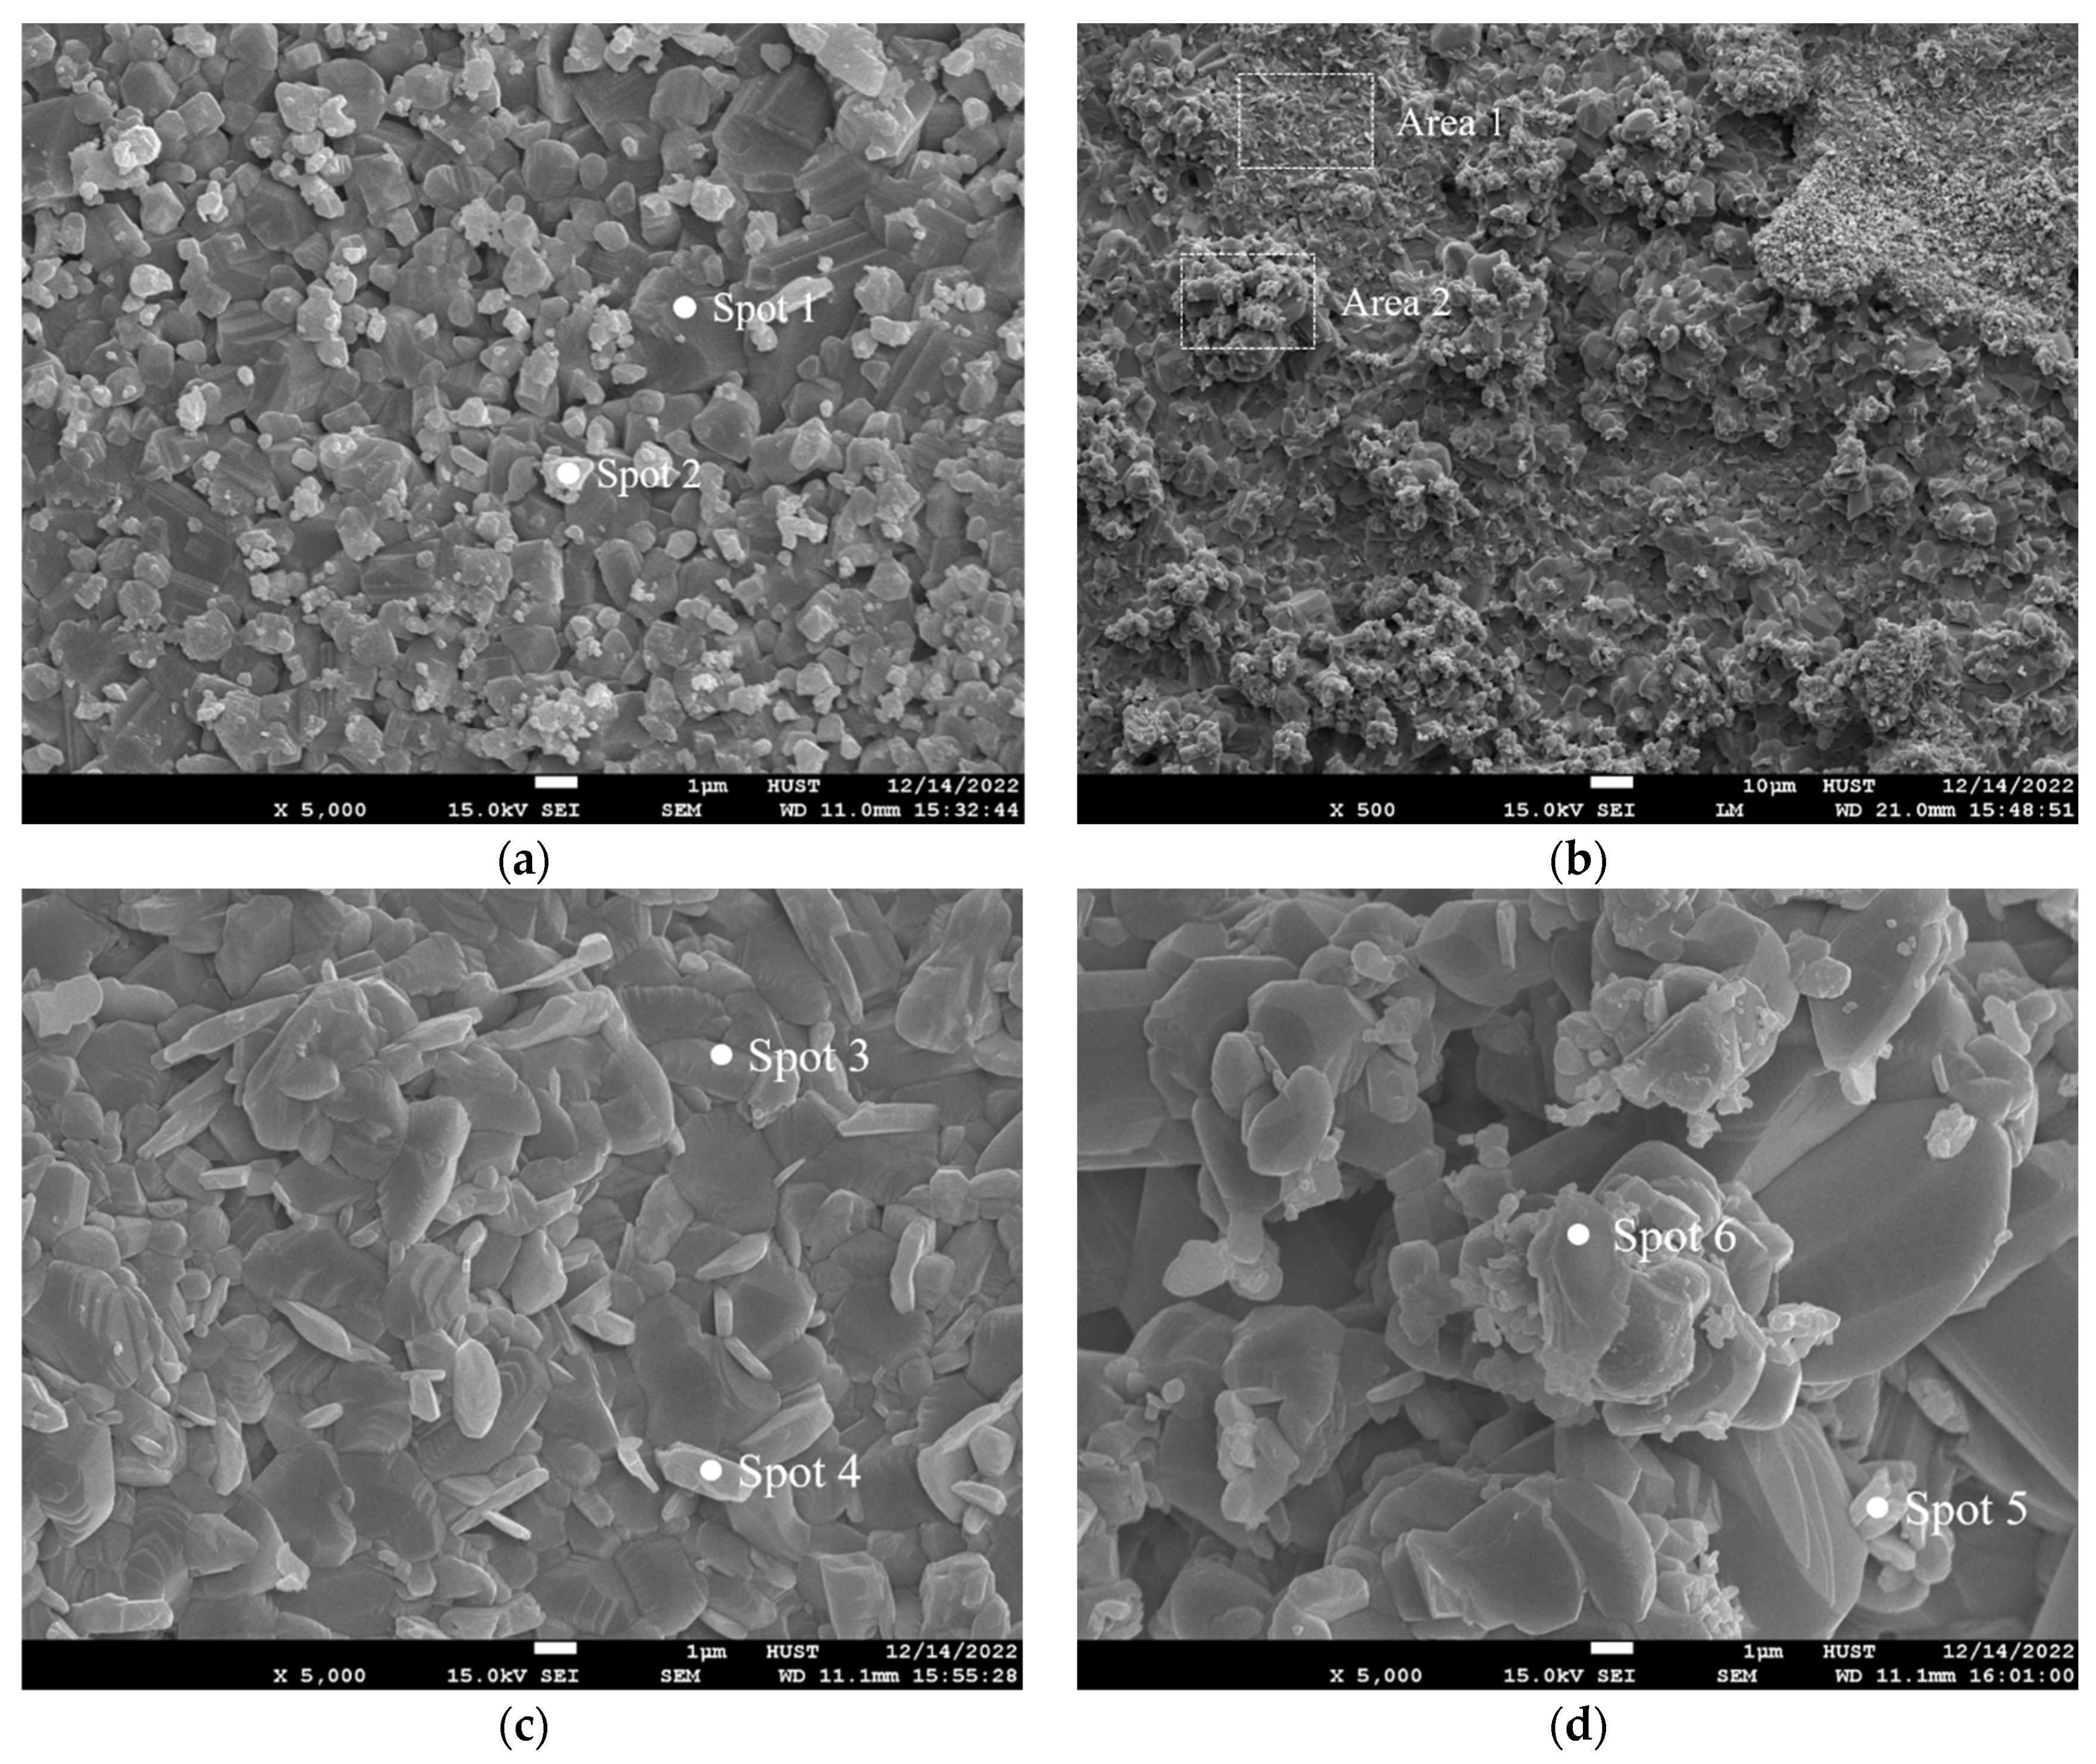
Figure 9.
SEM morphology of the inner and outer surfaces of Ti60 matrix after oxidation at 1100 °C × 60 h: (a) outer surface, (b) inner surface, (c) local magnification of Area 1 in Figure 9b, (d) local magnification of Area 2 in Figure 9b.

Figure 10.
Free energy–temperature curves of different reactions.

Figure 11.
SEM images of the oxide film cross-section layer of Ti60 matrix after oxidation at 1100 °C × 60 h: (a) whole, (b) local amplification of zone A, (c) local amplification of zone B.
Figure 11.
SEM images of the oxide film cross-section layer of Ti60 matrix after oxidation at 1100 °C × 60 h: (a) whole, (b) local amplification of zone A, (c) local amplification of zone B.

Figure 12.
Schematic diagram of oxidation process of Ti60 matrix.

Figure 13.
XRD pattern of laser cladding coating after air oxidation at 1100 °C × 120 h.

Figure 14.
Relationship between the free energy of different reactions and temperature.

Figure 15.
SEM morphology of the surface of laser cladding coating after oxidation at 1100 °C × 120 h: (a) whole, (b) local magnification at Area 1, (c) local magnification at Area 2.
Figure 15.
SEM morphology of the surface of laser cladding coating after oxidation at 1100 °C × 120 h: (a) whole, (b) local magnification at Area 1, (c) local magnification at Area 2.

Figure 16.
SEM morphology of laser cladding cross-section coating after air oxidation at 1100 °C × 120 h: (a) whole, (b) local magnification at zone A, (c) local magnification at zone B, (d) local magnification at zone C.
Figure 16.
SEM morphology of laser cladding cross-section coating after air oxidation at 1100 °C × 120 h: (a) whole, (b) local magnification at zone A, (c) local magnification at zone B, (d) local magnification at zone C.

Figure 17.
Standard free energy ΔG–temperature T curve of the reaction of each element with O2 in the laser cladding coating.
Figure 17.
Standard free energy ΔG–temperature T curve of the reaction of each element with O2 in the laser cladding coating.

Figure 18.
Schematic diagram of oxidation process of laser cladding coating.


Table 1.
Main chemical compositions of Ti60 alloy.
| Element | Al | Sn | Zr | Mo | Nb | Ta | Si | C | Ti |
|---|---|---|---|---|---|---|---|---|---|
| Wt.% | 5.0–6.3 | 3.0–5.0 | 2.5–7.0 | 0.2–1.5 | 0.2–1.0 | 0.2–3.0 | 0.2–0.55 | 0.01–0.09 | Bal. |
Table 2.
Ratio of preset powder layer.
| Element | Ti | Hf | Mo | Ta | Nb | B |
|---|---|---|---|---|---|---|
| Wt.% | 6.80 | 25.36 | 13.57 | 25.71 | 13.20 | 15.36 |
Table 3.
EDS results of different points in Figure 4 (at.%).
Table 3.
EDS results of different points in Figure 4 (at.%).
| Element | Spot 1 | Spot 2 | Spot 3 | Spot 4 | Spot 5 | Spot 6 | Spot 7 | Spot 8 | Spot 9 | Spot 10 |
|---|---|---|---|---|---|---|---|---|---|---|
| Ti | 12.45 | 11.43 | 11.20 | 12.54 | 12.09 | 18.51 | 15.65 | 20.09 | 21.17 | 19.51 |
| Hf | 0.20 | 0.13 | 0.13 | 0.73 | 0.62 | 0.27 | 0.10 | 0.44 | 0.26 | 0.29 |
| Mo | 0.90 | 1.26 | 0.77 | 0.61 | 0.96 | 0.50 | 0.74 | 1.20 | 1.57 | 1.41 |
| Ta | 1.72 | 1.54 | 2.13 | 1.24 | 1.21 | 1.27 | 1.01 | 0.94 | 2.08 | 0.83 |
| Nb | 1.03 | 1.06 | 1.04 | 1.02 | 1.07 | 0.95 | 1.19 | 1.23 | 1.08 | 1.06 |
| B | 83.70 | 84.58 | 84.73 | 83.86 | 84.05 | 78.50 | 81.31 | 76.10 | 73.84 | 76.90 |
| Possible phases | TiB + (Ti0.2Hf0.2Mo0.2Ta0.2Nb0.2)B2 | TiB + (Ti0.2Hf0.2Mo0.2Ta0.2Nb0.2)B2 | TiB + (Ti0.2Hf0.2Mo0.2Ta0.2Nb0.2)B2 | TiB + (Ti0.2Hf0.2Mo0.2Ta0.2Nb0.2)B2 | TiB + (Ti0.2Hf0.2Mo0.2Ta0.2Nb0.2)B2 | TiB + (Ti0.2Hf0.2Mo0.2Ta0.2Nb0.2)B2 | TiB + (Ti0.2Hf0.2Mo0.2Ta0.2Nb0.2)B2 | TiB + (Ti0.2Hf0.2Mo0.2Ta0.2Nb0.2)B2 | TiB + (Ti0.2Hf0.2Mo0.2Ta0.2Nb0.2)B2 | TiB + (Ti0.2Hf0.2Mo0.2Ta0.2Nb0.2)B2 |
Table 4.
Kinetics curve fitting of laser cladding coating and Ti60 matrix at 1100 °C for different oxidation times.
Table 4.
Kinetics curve fitting of laser cladding coating and Ti60 matrix at 1100 °C for different oxidation times.
| Samples | Oxidation Rate Constant (k) | Oxidation Mass Gain Index (n) | Oxidation Time (h) |
|---|---|---|---|
| Ti60 matrix | 10.585 | 0.8921 | 0–60 |
| Coating | 3.9907 | 0.5833 | 0–120 |
Table 5.
EDS results of different points on the inner and outer surfaces of Ti60 oxide film (at.%).
| Element | Spot 1 | Spot 2 | Spot 3 | Spot 4 | Spot 5 | Spot 6 |
|---|---|---|---|---|---|---|
| Ti | 28.59 | 16.30 | 32.23 | 1.24 | 8.04 | 24.20 |
| Zr | 12.70 | 11.44 | 13.40 | 8.81 | 13.70 | 12.52 |
| Mo | 0.54 | 1.04 | 2.00 | 0.99 | 0.78 | 0.92 |
| Sn | 0.12 | 0.29 | 0.13 | - | 0.43 | - |
| Nb | - | - | - | - | 0.16 | - |
| Al | - | - | 2.96 | 21.40 | 16.26 | - |
| O | 58.05 | 70.93 | 49.28 | 67.56 | 60.63 | 62.36 |
| Possible phases | TiO2 + ZrTiO4 | ZrTiO4 | TiO2 + ZrTiO4 | Al2O3 + ZrTiO4 | ZrTiO4 + Al2O3 | TiO2 + ZrTiO4 |
Table 6.
EDS results of Ti60 oxide film at different points (at.%).
| Element | Spot 1 | Spot 2 | Spot 3 | Spot 4 | Spot 5 |
|---|---|---|---|---|---|
| Ti | 25.25 | 21.53 | 40.6 | 33.15 | 25.51 |
| Zr | 20.1 | 15.75 | 16.47 | 18.36 | 16.27 |
| Mo | 1.13 | 1.27 | 0.92 | 2.17 | 1.47 |
| Sn | 0.19 | - | 0.66 | 0.92 | 0.49 |
| Nb | - | - | - | - | 0.69 |
| Al | - | 1.08 | 1.76 | 2.63 | 1.86 |
| O | 53.33 | 60.37 | 39.59 | 42.77 | 53.71 |
| Possible phases | TiO2 + ZrTiO4 | TiO2 + Al2O3 + ZrTiO4 | TiO2 + Al2O3 + ZrTiO4 | TiO2 + Al2O3 + ZrTiO4 | TiO2 + Al2O3 + ZrTiO4 |
Table 7.
EDS results of oxidized surface of laser cladding coating at different points (at.%).
| Element | Spot 1 | Spot 2 | Spot 3 | Spot 4 |
|---|---|---|---|---|
| Ti | 38.89 | 17.43 | 26.84 | 18.60 |
| Hf | 2.07 | 0.62 | 1.34 | 0.22 |
| Mo | - | - | - | - |
| Ta | 2.53 | 1.01 | 1.57 | - |
| Nb | 2.01 | 1.04 | 1.05 | - |
| O | 54.50 | 79.90 | 69.20 | 81.18 |
| Possible phases | TiO2 + Ta2O5 + HfO2 | TiO2 + Ta2O5 + HfO2 | TiO2 + Ta2O5 + HfO2 | TiO2 + HfO2 |
Table 8.
EDS results of laser cladding cross-section coating at different points after oxidation (at.%).
Table 8.
EDS results of laser cladding cross-section coating at different points after oxidation (at.%).
| Element | Spot 1 | Spot 2 | Spot 3 | Spot 4 | Spot 5 | Spot 6 | Spot 7 |
|---|---|---|---|---|---|---|---|
| Ti | 5.37 | 8.63 | 9.94 | 37.21 | 29.78 | 5.81 | 5.18 |
| Hf | 0.33 | 0.08 | 0.27 | 0.97 | 0.83 | 0.18 | 0.12 |
| Mo | 0.62 | 0.43 | 0.60 | - | - | 0.58 | 0.36 |
| Ta | 0.18 | 0.20 | 0.20 | 1.08 | 0.82 | 0.06 | 0.15 |
| Nb | 0.17 | 0.21 | 0.27 | 1.24 | 0.87 | 0.08 | 0.12 |
| B | 80.30 | 74.47 | 76.50 | - | - | 82.80 | 88.19 |
| O | 13.03 | 15.98 | 12.22 | 59.50 | 67.70 | 10.49 | 5.88 |
| Possible phases | TiO2 + Ta2O5 + HfO2 + Nb2O5 + MoO3 + B2O3 | TiO2 + Ta2O5 + HfO2 + Nb2O5 + MoO3 + B2O3 | TiO2 + Ta2O5 + HfO2 + Nb2O5 + MoO3 + B2O3 | TiO2 + Nb2O5 + Ta2O5 + HfO2 | TiO2 + Ta2O5 + HfO2 + Nb2O5 | TiO2 + Ta2O5 + HfO2 + Nb2O5 + MoO3 + B2O3 | TiO2 + Ta2O5 + HfO2 + Nb2O5 + MoO3 + B2O3 |
Disclaimer/Publisher’s Note: The statements, opinions and data contained in all publications are solely those of the individual author(s) and contributor(s) and not of MDPI and/or the editor(s). MDPI and/or the editor(s) disclaim responsibility for any injury to people or property resulting from any ideas, methods, instructions or products referred to in the content. |
© 2023 by the authors. Licensee MDPI, Basel, Switzerland. This article is an open access article distributed under the terms and conditions of the Creative Commons Attribution (CC BY) license (https://creativecommons.org/licenses/by/4.0/).
Share and Cite
MDPI and ACS Style
Huang, K.; Han, X. High-Temperature Oxidation Properties of Ti-Hf-Mo-Ta-Nb-B Composite Coating Deposited on Ti60 Alloy with Laser Cladding. Coatings 2023, 13, 1646. https://0-doi-org.brum.beds.ac.uk/10.3390/coatings13091646
AMA Style
Huang K, Han X. High-Temperature Oxidation Properties of Ti-Hf-Mo-Ta-Nb-B Composite Coating Deposited on Ti60 Alloy with Laser Cladding. Coatings. 2023; 13(9):1646. https://0-doi-org.brum.beds.ac.uk/10.3390/coatings13091646
Chicago/Turabian StyleHuang, Kaijin, and Xianchao Han. 2023. "High-Temperature Oxidation Properties of Ti-Hf-Mo-Ta-Nb-B Composite Coating Deposited on Ti60 Alloy with Laser Cladding" Coatings 13, no. 9: 1646. https://0-doi-org.brum.beds.ac.uk/10.3390/coatings13091646
Note that from the first issue of 2016, this journal uses article numbers instead of page numbers. See further details here.