Article

Effect of Fine-Grained Particles and Sensitivity Analysis of Physical Indexes on Residual Strength of Granite Residual Soils

1
School of Civil Engineering, Yancheng Institute of Technology, Yancheng 224051, China
2
The United Graduate School of Agricultural Science, Gifu University, Gifu 501-1193, Japan
3
Key Laboratory of Earth Fissures Geological Disaster, Ministry of Natural Resources, Geological Survey of Jiangsu Province, Nanjing 210018, China
*
Author to whom correspondence should be addressed.
Submission received: 14 December 2023 / Revised: 4 January 2024 / Accepted: 11 January 2024 / Published: 12 January 2024

Abstract

:
Recently, stability analyses of structures built of granite residual soils, for example, earth dams or other urban structures, particularly when under vibration, are being recognized as much more important than previously imagined. In such analyses, it is emphasized that the residual strength should be utilized considering the seismic effect. Therefore, the residual strength of granite residual soils must be evaluated accurately in order to reduce the damage to structures built on them. This paper presented a laboratory study designed to examine the effect of fine-grained particles (FGPs; particle size ≤ 0.075 mm) on residual strength by the multistage procedure of the Bromhead ring shear test and evaluate the physical indexes forecasting the residual strength of granite residual soils using soil samples composed of fifteen different percentages of FGPs artificially adjusted from a reservoir embankment soil sample. The results showed that the residual strength decreased along with the increase in FGPs and that the residual frictional angle was rarely dependent on the ratio of FGPs when the ratio was over 90%. Even in the residual state, a small amplitude of fluctuation in shear stress still existed and was affected by the coarse-grained particles (CGPs; particle size ≥ 0.075 mm), such as the quartz particles in the granite residual soils. It was also found that the amplitude of fluctuation was smaller when the FGP fraction was greater. In addition, under the same normal stress, the peak strength and residual strength decreased with an increase in the ratio of FGPs. Then, they remained almost the same when the ratios of FGPs were equal to 85% and 90%, respectively, and the post-peak attenuation tended to increase initially with an increase in the FGPs and then remained almost the same. Moreover, based on the sensitivity analysis, the order of influence of physical indexes on the residual frictional angle was also ranked for the granite residual soils.

1. Introduction

The stability of earth dams under vibration has become one of the most serious problems for civil engineers, particularly after the recent experiences of large earthquakes in the world. To analyze such problems, residual strength parameters have attracted much attention in recent decades due to their great significance in stability analyses when evaluating the influence of large earthquakes on foundation settlements [1,2,3] or the stability of slopes that have experienced landslides [4]. On the other hand, landslides are clearly one of the most serious natural disasters on earth; they cause great loss of life and severe destruction of the social economy. With the rapid development of urbanization and transportation in China, granite residual soils are used in many areas, especially in coastal areas [5,6]. However, under the action of earthquakes, a large number of landslides, vibration subsidence, and ground fissures are caused in such granite residual areas. In recent years, with the continuous improvement of scientific and technological innovations, as well as the attention that is being paid to special problems, research on granite residual soils has been increasing. Granite residual soils are the product of a series of physical and chemical weathering of the parent rock granite. Compared with other kinds of soils, granite residual soils belong to one of the special soils due to the following reasons that are different from other soils. In terms of engineering properties, granite residual soils have been clarified as having higher shear strength and bearing capacity and lower compressibility under natural conditions [7]. In terms of mineral composition, granite residual soils are mainly composed of quartz and kaolinite and lesser amounts of soluble salt and organic matter. In terms of particle composition, relatively greater amounts of granite residual soils are larger than 0.5 mm or less than 0.075 mm in size, while fewer amounts are between 0.075 and 0.5 mm in size [8]. However, it should be pointed out that the research on granite residual soils has not formed a complete system, compared with loess or soft soil, due to the delay in starting research on these soils.
The mechanical properties of many kinds of soils have been the object of extensive research for decades. The existing studies on the residual strength of various soils are mainly focused on clay or clayey soil, and a relatively consistent theory has been realized for evaluating the residual strength, like the effect of the shear rate [9,10,11,12,13,14,15,16,17,18], consolidation ratio [14,16], and normal stress [17,
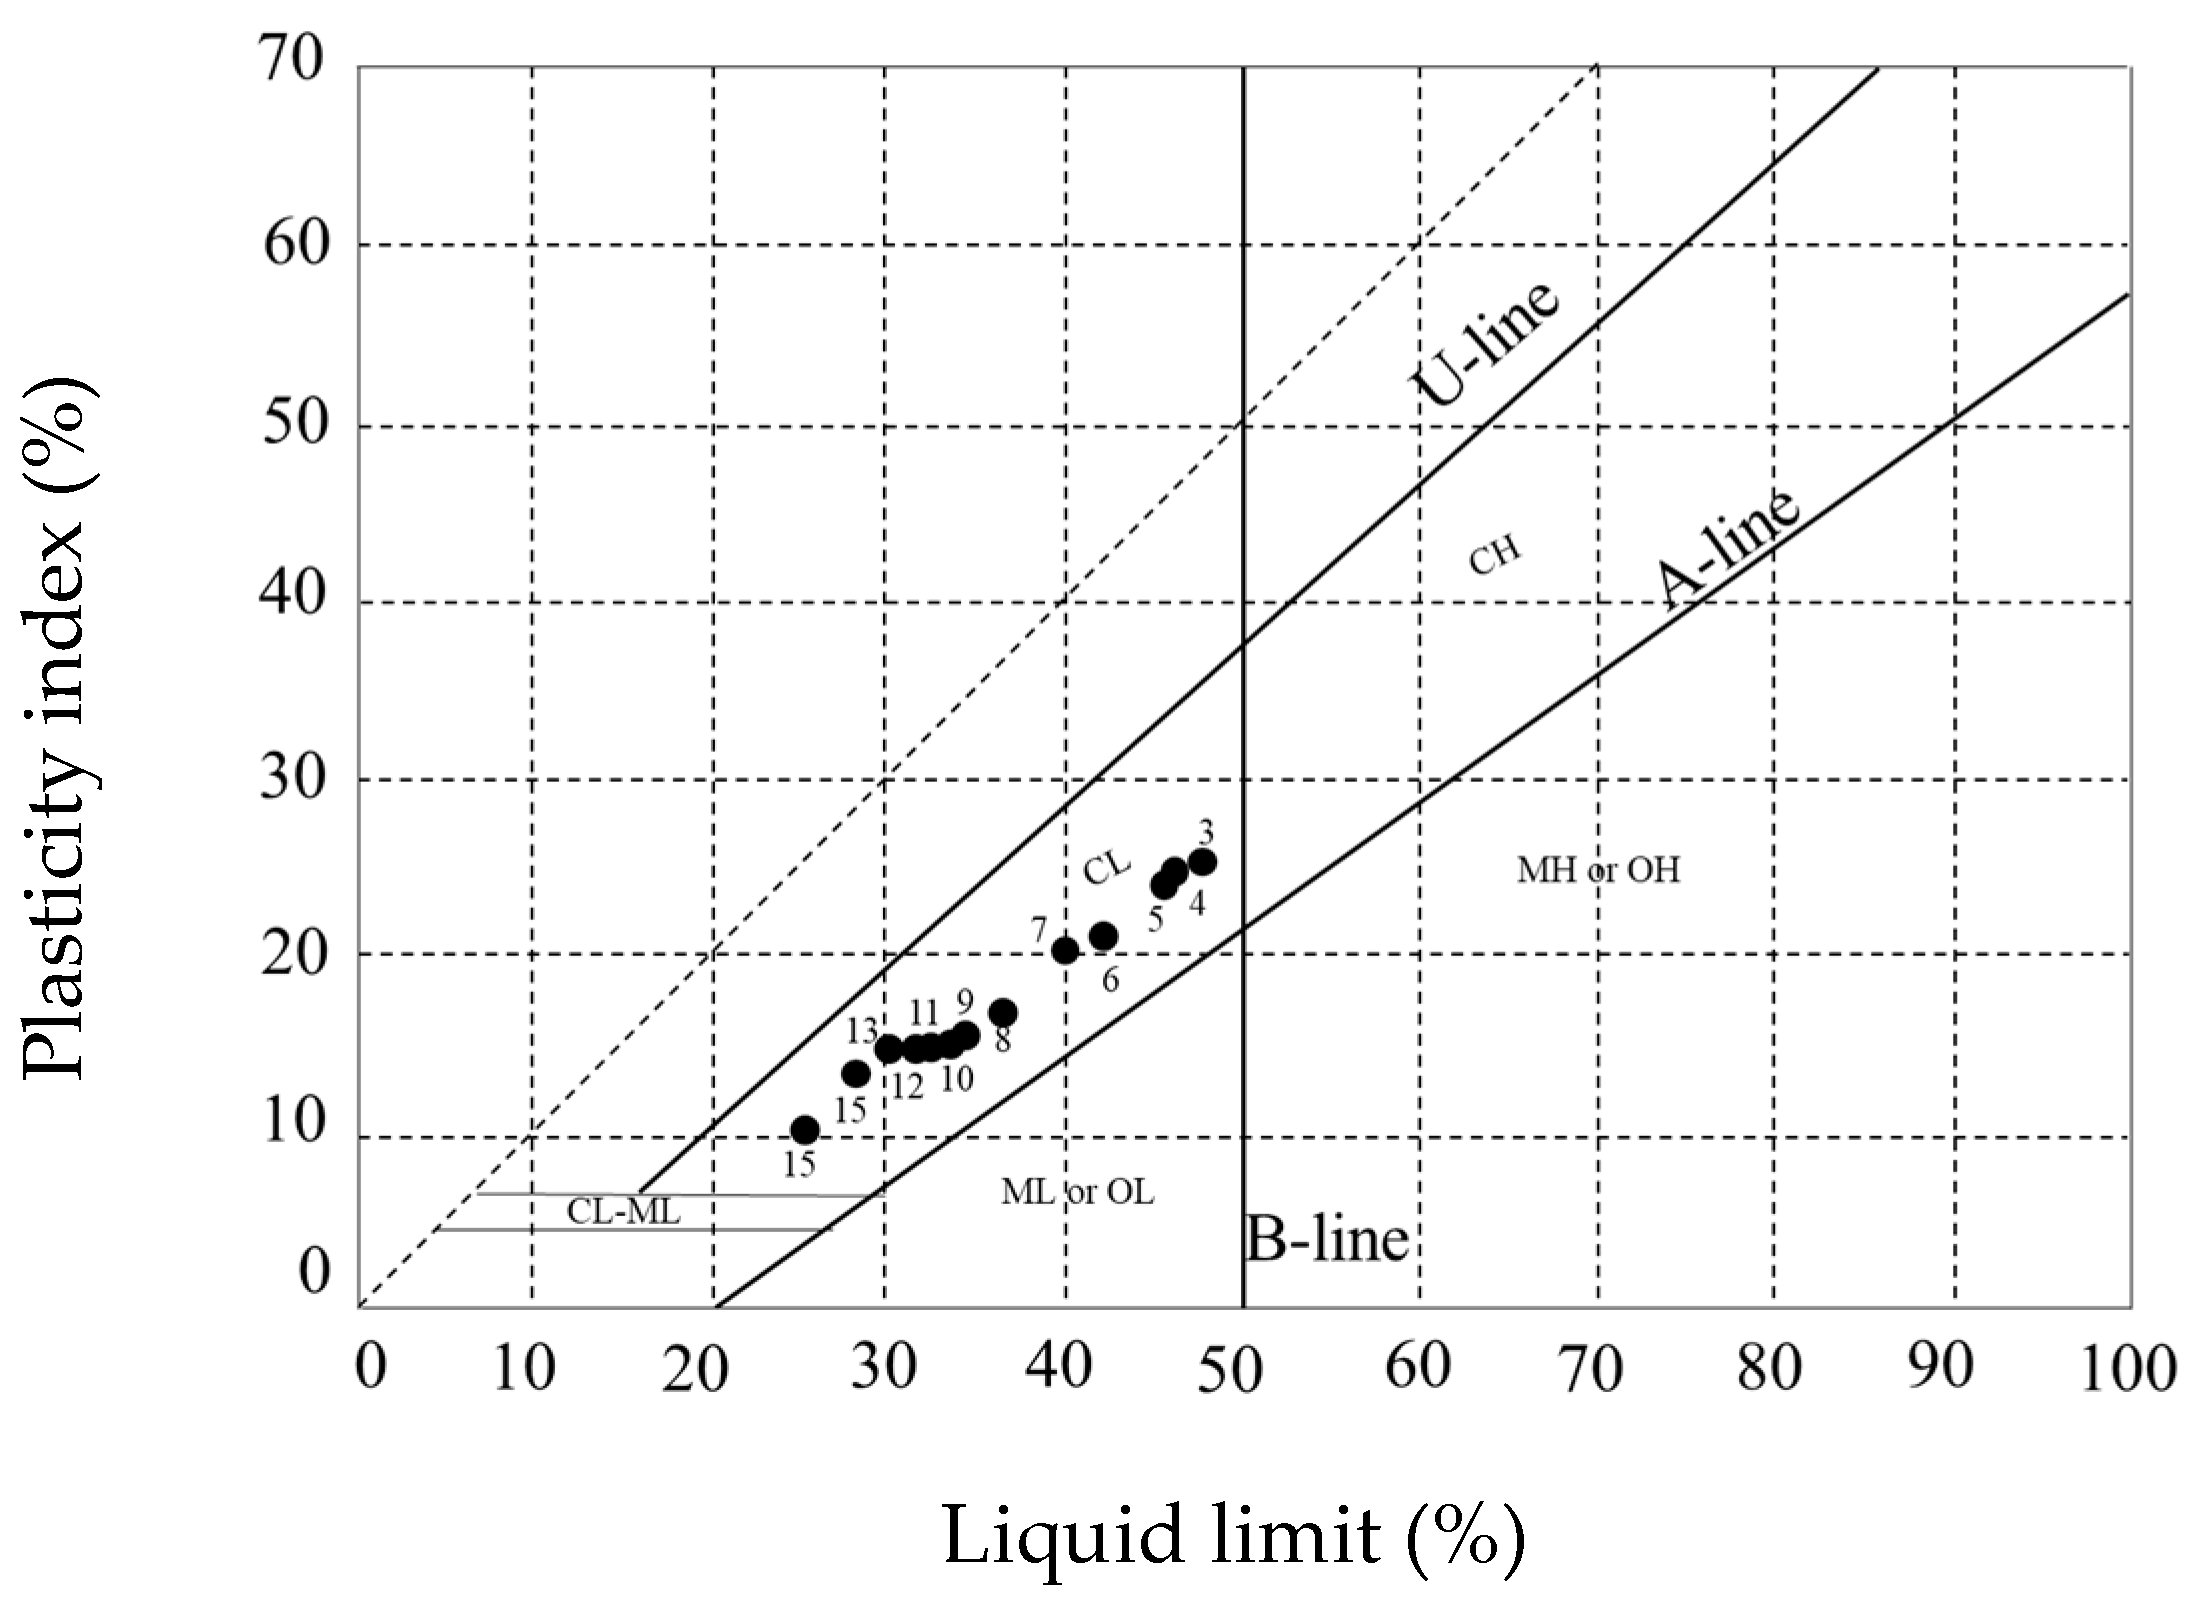
18] on the residual strength of this clay or clayey soil. Normal stress refers to the weight applied to soil samples during shearing. Moreover, the relationships between residual strength and related indexes, such as the plasticity coefficient, FGPs, CGPs, and so on, have also been shown for clayed soil in a lot of the literature. The plasticity coefficient mainly contains liquid limit, plastic limit, and plasticity index, where the liquid limit refers to the boundary moisture content between the plastic and flowing states of cohesive soil, the plastic limit is the boundary moisture content between the plastic and semi-solid states of cohesive soil, and lastly, the plasticity index can be determined by liquid limit minus plastic limit. However, it should be noted that granite residual soils contain a lot of coarse-grained particles (CGPs), which means the present theory on the residual strength may not be suitable for granite residual soils.
Moreover, there is little research using sensitivity analysis for the strength of granite residual soils. The related indexes for predicting the residual strength of clayed soil, liquid limit, plastic limit, plasticity index, FGPs, and CGPs were selected as the specific factors in this sensitivity analysis under consideration in this study. Therefore, it is worth conducting this study to analyze the effects of different kinds of soil indexes on the residual strength parameters of granite residual soils.
The residual strength parameters of many kinds of soils, namely residual frictional angle ϕr and cohesion, can be obtained through laboratory tests. Due to the obvious characteristics of their structure and probable fissures, the cohesion of granite residual soils is neither stable nor credible, and it has been suggested that the residual frictional angle be obtained by indoor geotechnical tests that have high credibility [8]. Thus, this paper is also focused on evaluating the main factors influencing the residual frictional angle by the sensitivity analysis and exploring the possibility of predicting the residual frictional angle by the available indexes for granite residual soils.
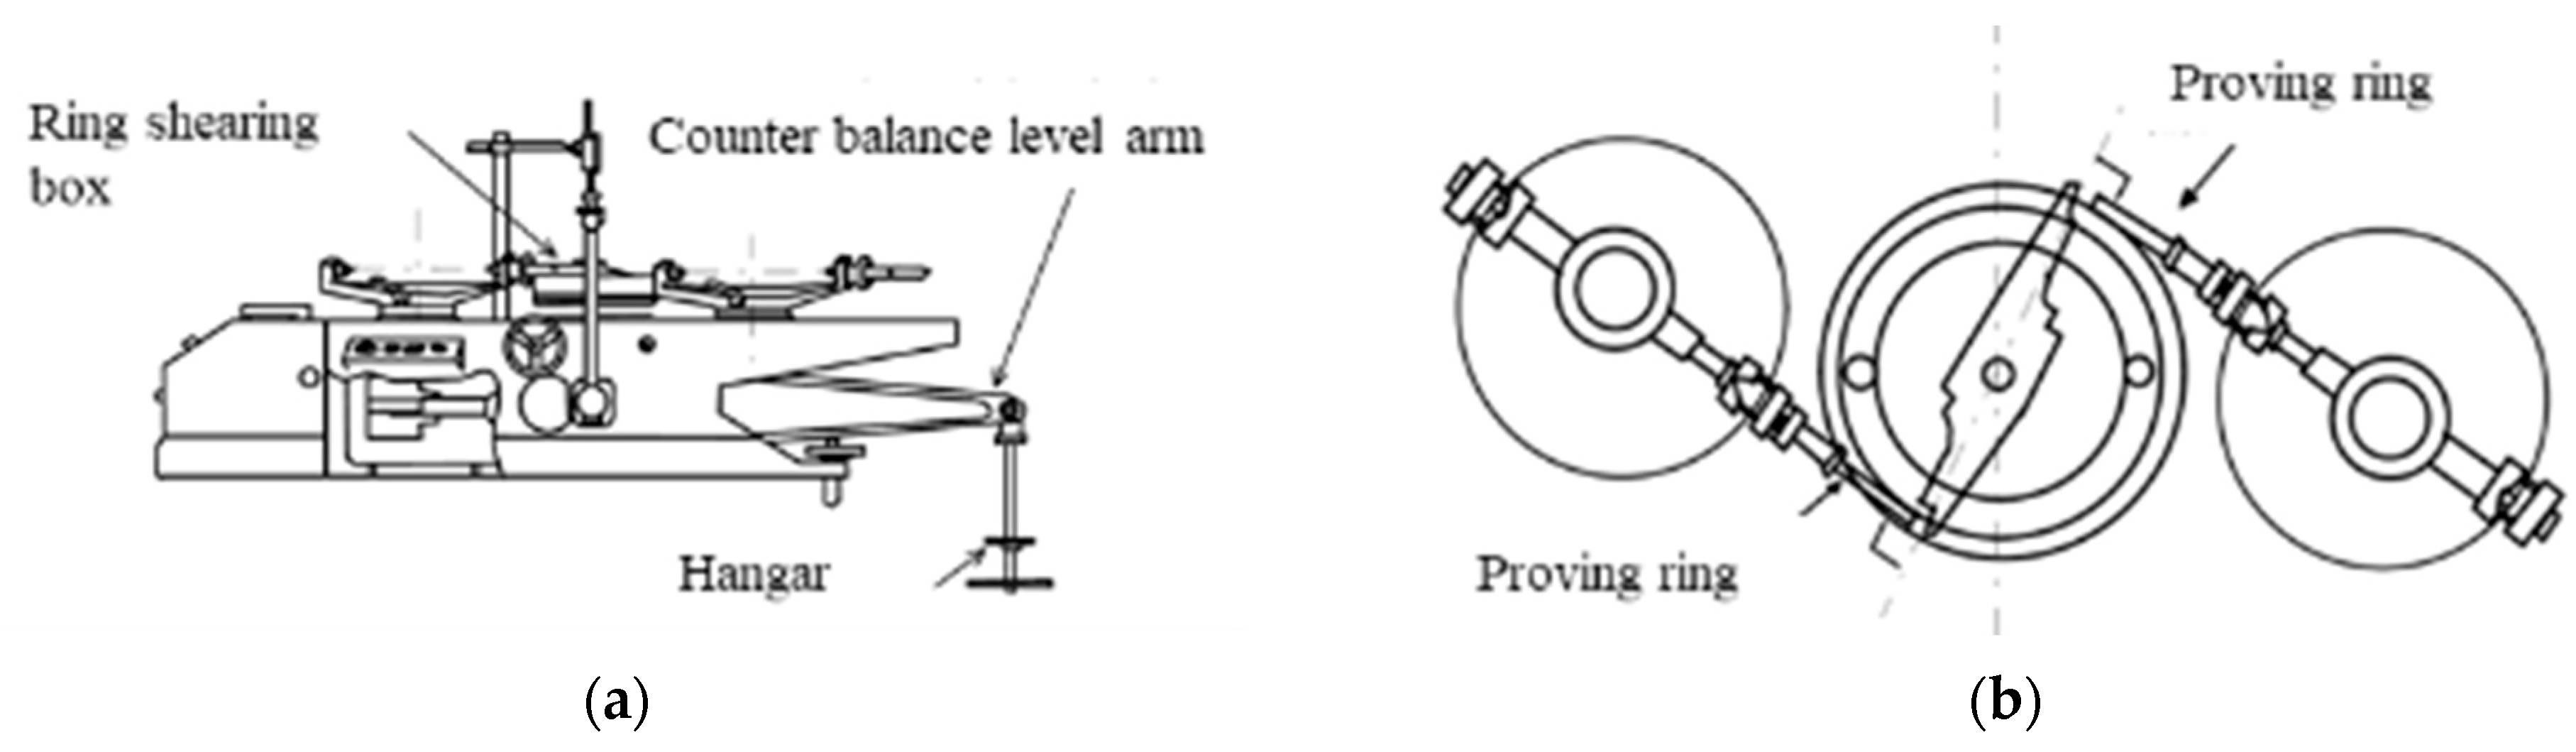
The main objective of this study is to expound the action mechanism of fine-grained particles (FGPs) on the residual strength of granite residual soils. At the same time, the possibility of predicting the residual frictional angle of granite residual soils by means of the available indexes based on the sensitivity analysis, including the Atterberg limits, the fractions of different kinds of particles, and the relative grading parameter, r CGP r FGP , is illustrated, where r FGP and r CGP are the ratio of FGPs and CGPs, respectively. Moreover, the effect of the fraction of FGPs on the residual strength and peak strength under a normal stress of 201 kPa, as well as a comparison with the published prediction models for the residual frictional angle, is also discussed. In this study, ring shear tests and basic physical property tests, namely grain size analyses, liquid limit tests, and plastic limit tests, were conducted on all samples.

2. Materials and Methodologies

2.1. Materials and Sample Treatment

Bishop et al. [19] measured the residual strength of undisturbed and remolded samples of five kinds of soils by a ring shear apparatus and demonstrated that the residual stress was independent of the initial structure of the soil. Thus, remolded soil samples that were remolded from one soil of the study site were suitable for conducting this study to analyze the effect of FGPs on the residual strength relatively precisely. The samples, comprising granite residual soils, were taken from Hojo, Matsuyama, Japan, as a suitable material for reservoir embankments according to the engineers of Ehime Prefecture, Japan. The basic physical indexes and mineral composition of the taken soils in this study were shown in Table 1 and Table 2, respectively, where all physical indexes in Table 1 were obtained based on JIS A 1204 and JIS A 1205 [20], and the mineral composition in Table 2 was determined by X-ray diffraction. In Table 1, the uniformity coefficient is one of the indicators that reflects the distribution of different particle groups of different sizes, and whether the soil particle size distribution is good or not can be determined by this indicator. Normally, if the value of the uniformity coefficient is bigger than 10, we can judge if the soil grading is good. However, if this value is too big, like the sample in this study, we can judge if the soil grading is the gap gradation. The above physical indexes in Table 1 followed the general rule of granite residual soils. A standard for reservoir embankment soils, based on the ratio of FGPs, was proposed by the Japanese Institute of Countryology and Engineering [21]. For this purpose, the soil samples, composed of fifteen different percentages of FGPs, were artificially prepared from the above material by varying the FGPs using a 0.075 mm sieve. Each sample was filtered through a 0.425 mm sieve because a grain size of more than 0.425 mm cannot be used in liquid–plastic limit tests, as specified in the JIS A 1205 test guide [20]. The ratios of FGPs were from 0% to 100%, as shown in Table 3.
The Atterberg limits of all the samples belong to the common clay mineral group on the Casagrande plasticity chart [22], shown in Figure 1. All samples were classified as low clay (CL) according to the Unified Soil Classification System (USCS).

2.2. Methodologies

For the next step, tests to determine the physical properties, including the liquid limit, plastic limit, and plasticity index, were conducted based on the standard of JIS A 1205 [20].
Three test methods are commonly used to measure the shear strength, namely the direct shear box test, the triaxial shear test, and the ring shear test, among which the triaxial shear test is the most popular, as it is able to regulate the drainage conditions and to gauge the pore water pressure. However, it has been demonstrated that the triaxial shear test is not suitable for obtaining the residual strength of soil for two reasons. Firstly, the strain exerted on a specimen is limited, especially for sliding zone soils with a great amount of CGPs [23]. Secondly, the strength along the sliding surface is difficult to determine. It is worth noting, however, that this type of test has a great advantage in obtaining the residual strength of soil with the ring shear apparatus; that is, the ring shear apparatus can continuously shear the soil in the desired direction of displacement without changing the cross-sectional area of the sample. This allows the orientations of the particles to be completely parallel to the shearing direction and the residual strength of the soil to be determined in a more convenient way [24]. Therefore, it is worth suggesting that the ring shear test be utilized to obtain the residual strength of the soil. In this study, the Bromhead ring shear apparatus, shown in Figure 2, was used to determine the residual strength of granite residual soils. It has the advantages of simple operation, reasonable cost, and strong practicability. Proving rings are used for obtaining the shear stress by the strain of the rings. There are four main test procedures for determining the residual frictional angle of soil with the Bromhead ring shear apparatus: the single stage, pre-shearing stage, multistage, and proposed “flush” stage procedures. Full descriptions of these procedures can be found in Stark and Vettel [24] and Anderson and Hammoud [25]. Compared with the other procedures for Bromhead ring shear tests, the multistage procedure can save quite a lot of time.
In this study, the drained ring shear tests were organized into two main steps, namely consolidation and shearing. As explained in the section on the material preparation, the soil samples that passed through a 0.425 mm sieve were packed into a shear box with inner and outer diameters of 60 mm and 100 mm, respectively. Skempton [26] showed that the residual strength values obtained from laboratory tests were almost the same under normal consolidation or overconsolidation conditions, but the time required by normal consolidation to obtain the residual strength was much longer than by overconsolidation. Based on this finding, the condition of overconsolidation was applied in the present study for preparation the samples before shearing. The value of the pre-consolidation pressure was calculated by the weight of a 10 m high embankment, equal to nearly 200 kPa. Thus, considering the situation of the weight that was applied to normal stress in the ring shear apparatus, the stress of 270 kPa was used as the overconsolidation for the pre-consolidation pressure. So and Okada [14] and Li et al. [15] showed that the effect of the overconsolidation ratio on the residual strength was unworthy of being mentioned, which implies that the 270 kPa of pressure used for overconsolidation in this research is appropriate. After consolidation for more than 2 days, the soil samples were sheared slowly at a shear rate of 0.05 mm/min to ensure that no pore water pressure would occur [16]. Scaringi and Di Maio [27] also pointed out that the effect of the shear rate on the residual strength could be ignored as long as the shear rate was less than 0.1 mm/min.
Shear stress τ and horizontal displacement D were calculated based on Equations (1) and (2), respectively, according to previous studies [28,29]. The maximum data acquisition rate of the Bromhead ring shear apparatus could be 1000 readings per second. In this study, the data were obtained every 10 s due to the simplicity of data processing and the storage of used SIM cards, but the stress–displacement curve can be obtained as planned.
τ = 3 F 1 + F 2 4 π R 2 3 R 1 3
D = R 1 + R 2 π ω t 360
where F1 and F2 are the measured torsion forces, R1 is the inside sample radius, equal to 3 cm, R2 is the outside sample radius, equal to 5 cm, ω is the rate of displacement (deg/min), and t is the time in minutes.
For the sensitivity analysis, a single-factor analysis and multiple regression analysis were both used to illustrate the effect of physical indexes on the residual frictional angle. In the single-factor analysis, the determination coefficient (R2), which ranges from 0 to 1, was selected to evaluate the sensitivity of related indexes to the residual frictional angle. The closer to 1 the determination coefficient is, the more sensitive to the residual strength of the granite residual soil the index is. In the multiple regression analysis, adjusted R2, which also ranges from 0 to 1, was selected to show the degree of fitting of regression lines to observed values. Detailed information about the sensitivity index can be found in [30,31].

3. Results and Discussion

3.1. Effect of FGP Content on the Strength of Granite Residual Soils

The residual stress levels of fifteen soil samples were determined through the multistage procedure, as shown in Figure 3. The shear stresses at the peak and residual states are referred to as the peak strength and the residual strength, respectively. It was evident that it took a great deal of time to reach the residual strength, whereas it took a short amount of time to reach the peak strength. The distance to the peak strength was less than 0.5 cm. Based on different studies [9,24], as well as this study, it is difficult to say exactly when the residual strength will be reached with different types of soils. However, both the peak strength and the residual strength decreased with the increasing fraction of FGPs under the same normal stress.
Meanwhile, another phenomenon that should be noted in the shear tests is the fluctuation of shear stress in the residual state. Some representative examples under a normal stress of 201 kPa were picked and shown in Figure 4. It is widely recognized that even in the residual state, a small amplitude of fluctuation still existed and remained stable when the phenomenon of particle orientation occurred [27,32]. In Figure 4, it is seen that even after a long horizontal displacement in the shearing process, a small amplitude of fluctuation still existed and was relatively regular. The shape of the shear band is not an ideal flat layer, which we can understand easily because CGPs, like quartz and kaolinite particles, existed in the sample. During shearing, complex interactions resulting from bigger contact surfaces led to the fluctuation of shear stress. Moreover, it is evident that as the fraction of FGPs increased, the amplitude of such fluctuations under the same normal stress decreased.
The residual frictional angles, which can be determined from the data in Figure 3, are summarized in Table 4, along with the soil properties. In this table, the ratio of FGP ( r FGP ) and index of the CGP to FGP contents ( r CGP r FGP ) can be obtained by the grain size distribution curve. The liquid limit ( w L ) and plastic limit ( w P ) can be determined by the liquid limit test and the plastic limit test, respectively, and the plasticity index ( I P ) is equal to the liquid limit minus the plastic limit. Notably, it is found that the residual frictional angles of the samples vary considerably, from 13.9° to 32.9°. It is also evident that the liquid limit, plastic limit, and plasticity index increase with an increase in FGPs, whereas the residual frictional angle is inversely proportional to the liquid limit, plastic limit, plasticity index, and ratio of FGPs.
The peak strength and residual strength versus the ratio of FGPs under a normal stress of 201 kPa are shown in Figure 5. The peak strength is seen to first decrease with an increase in the FGP content and then remain almost the same when the ratio of FGPs is more than 85%. Similarly, the residual strength is seen to first decrease with an increase in the FGPs and then remain almost the same when the ratio of FGPs is equal to around 90%. From both peak strength and residual strength against the FGP fractions, we can find that the decrease value in strength is big when the ratio of FGPs increased from 0 to 100%. We can understand that compared to FGPs, the peak strength and residual strength are highly affected by CGPs, which can be attributed to the complex interactions between particles, as observed by Wen et al. [33]. The greater the CGPs, the higher the peak strength and residual strength. Moreover, Skempton [4] also proved that the residual strength is affected almost entirely by the minerals of soil when the clay fraction exceeds 50%, and any further increase in clay content will not affect the residual strength. The results obtained in the present study are considered to be appropriate. Moreover, in Figure 5, it is evident that the difference in value equaled the peak strength minus the residual strength, which is called the post-peak attenuation, and this value increased with the increasing FGPs. This means that the greater the FGP fraction, the stronger the post-peak intensity attenuation, which could provide instructions for slope protection in the aspect of controlling the FGP fraction in the slope.

3.2. Sensitivity Analysis of Available Indexes on the Residual Frictional Angle of Granite Residual Soils

The available indexes were selected, including the ratio of FGPs, the relative grading parameter, the liquid limit, the plastic limit, and the plasticity index. The correlations between the residual frictional angle and all the available indexes are given in Figure 6. The determination coefficient (R2) was introduced to show the relationship between the residual frictional angle and the available indexes. It was found that all the values for R2 were greater than 0.87. These values showed that the compatibility of the fitting line to the determined values was high. Based on the results of the sensitivity analysis, the order of impact is r FGP > w L > w p > I P > r CGP r CGP . Additionally, a multiple regression analysis was also conducted to illustrate the correlation between the residual frictional angle and available physical indexes, as shown in Table 5. The prediction model can be shown as ϕr = −0.0413 × r FGP + 3.0793 × r CGP r FGP − 0.5188 × w p − 0.2945 × I P + 35.8379. A high adjusted R2 that was equal to 0.8482 implied that the degree of fitting of the regression lines to observed values was good.
Based on the above experimental results and analysis, it is evident that the sensitivity analysis can provide a simple and effective approach to optimizing the effects of related physical indexes on the residual frictional angle of granite residual soils. The analysis method can not only provide a possible prediction of the residual frictional angle based on easily available indexes but it can also rank the effect of their influences. This can provide researchers and engineers with useful tools for evaluating and predicting the effects of related indexes on residual strength. However, as has been pointed out from the correlations of the residual frictional angle versus the plastic limit and the plasticity index, respectively, some nonlinear relationships seemed to exist, which may be due to the soil mechanism. A more comprehensive study should be performed in the near future.
After a full comparison, it was seen that the ratio of the FGPs to the total soil, including the FGP and CGP contents, was mostly related to the residual frictional angle according to the highest value of the coefficient of determination, as shown in Figure 6. In addition, it could be evidently found that the residual frictional angle remained almost the same when this ratio of FGPs was more than 90%, which was due to the fact that contact between the CGPs and other grained particles hardly ever occurred.
The determination coefficients of the linear correlations among the parameters are shown in Table 6. It is evident that as a fundamental index, the ratio of FGPs seems to be a good tool for estimating the residual frictional angle, liquid limit, and plastic limit for granite residual soil. However, it should be pointed out that the correlations between the residual frictional angles and the available indexes are shown for just one type of soil. Future work, focusing on different types of embankment soils and pointing out a more precise formula for predicting the residual strength, should also be performed.

3.3. Discussion of the Different Prediction Models for Residual Frictional Angles by Representative Indexes

In geotechnical engineering, a lot of studies have been conducted to predict the geotechnical parameters using the index and physical properties of soils, and several reliable models are available to predict the mechanical behavior of different types of soils. The latest techniques, such as machine learning techniques, are available to develop the predicting models for kinds of indexes of soil [34,35,36,37]. However, due to the particularity of granite residual soil that was stressed above in terms of engineering properties, mineral composition, and particle composition, the attempts to use machine learning techniques to predict the strength of granite residual soil were few. Moreover, a lot of the literature [38,39,40,41,42] has shown the correlations between the residual frictional angle and the available indexes, but most studies have focused on clay or clayey soil. That is to say that previous prediction models may not be suitable for granite residual soils that have certain structural features and/or fissures. Thus, a discussion on the comparisons between the previous prediction models and the models built in this paper for the residual frictional angles by the available indexes was necessary. Figure 7 shows comparisons between the observed and the predicted values of the residual frictional angles for granite residual soils. The prediction models were from Wen et al. [33], where ϕr = 18,345 × r FGP 1.7458 is the index of the ratio of FGP, ϕr = 22.097 × r CGP r CGP + 7.7491 is the index of the CGP to FGP contents, and ϕr = 455.85 × w L 1.0384 is the index of the liquid limit. It is easy to see in Figure 7 that the observed and predicted values of the residual frictional angles were greatly different for granite residual soils by the representative indexes selected here. The differences in values, which were calculated by the absolute value of the observed value minus the predicted value, respectively, were even more than 20. Thus, the predictions of the residual frictional angles were different for different kinds of soils, and the reason should be largely related to the differences in the origins and source materials of soils, as well as the differences in mineral compositions, and their interactions within the slip zones. However, the models pointed out in this study could provide a reference for determining the residual frictional angle of granite residual soil. Additionally, more comprehensive and complex indexes for predicting the residual strength of kinds of soils should be found in the near future.
From the above results, it can be pointed out that previous prediction models for clay or clayey soil were not suitable for predicting the residual frictional angle of granite residual soils. However, at the same time, it is worth noting that the difference seen in Figure 7b is very small, especially when the relative grading parameter, r CGP r FGP , is less than 1. That is to say, when the content of CGPs is less than the content of FGPs, the proposed prediction model for clay or clayed soil based on r CGP r CGP seems to be also suitable for granite residual soil.

4. Conclusions

Drained ring shear tests, grain size analyses, liquid limit tests, and plastic limit tests were carried out on granite residual soils to clarify the effect of FGPs on the residual strength of granite residual soils. Then, the correlations between the residual frictional angle of granite residual soils and the available indexes, which could be obtained in a short time, were proposed and compared. The results presented have led to the following general conclusions.
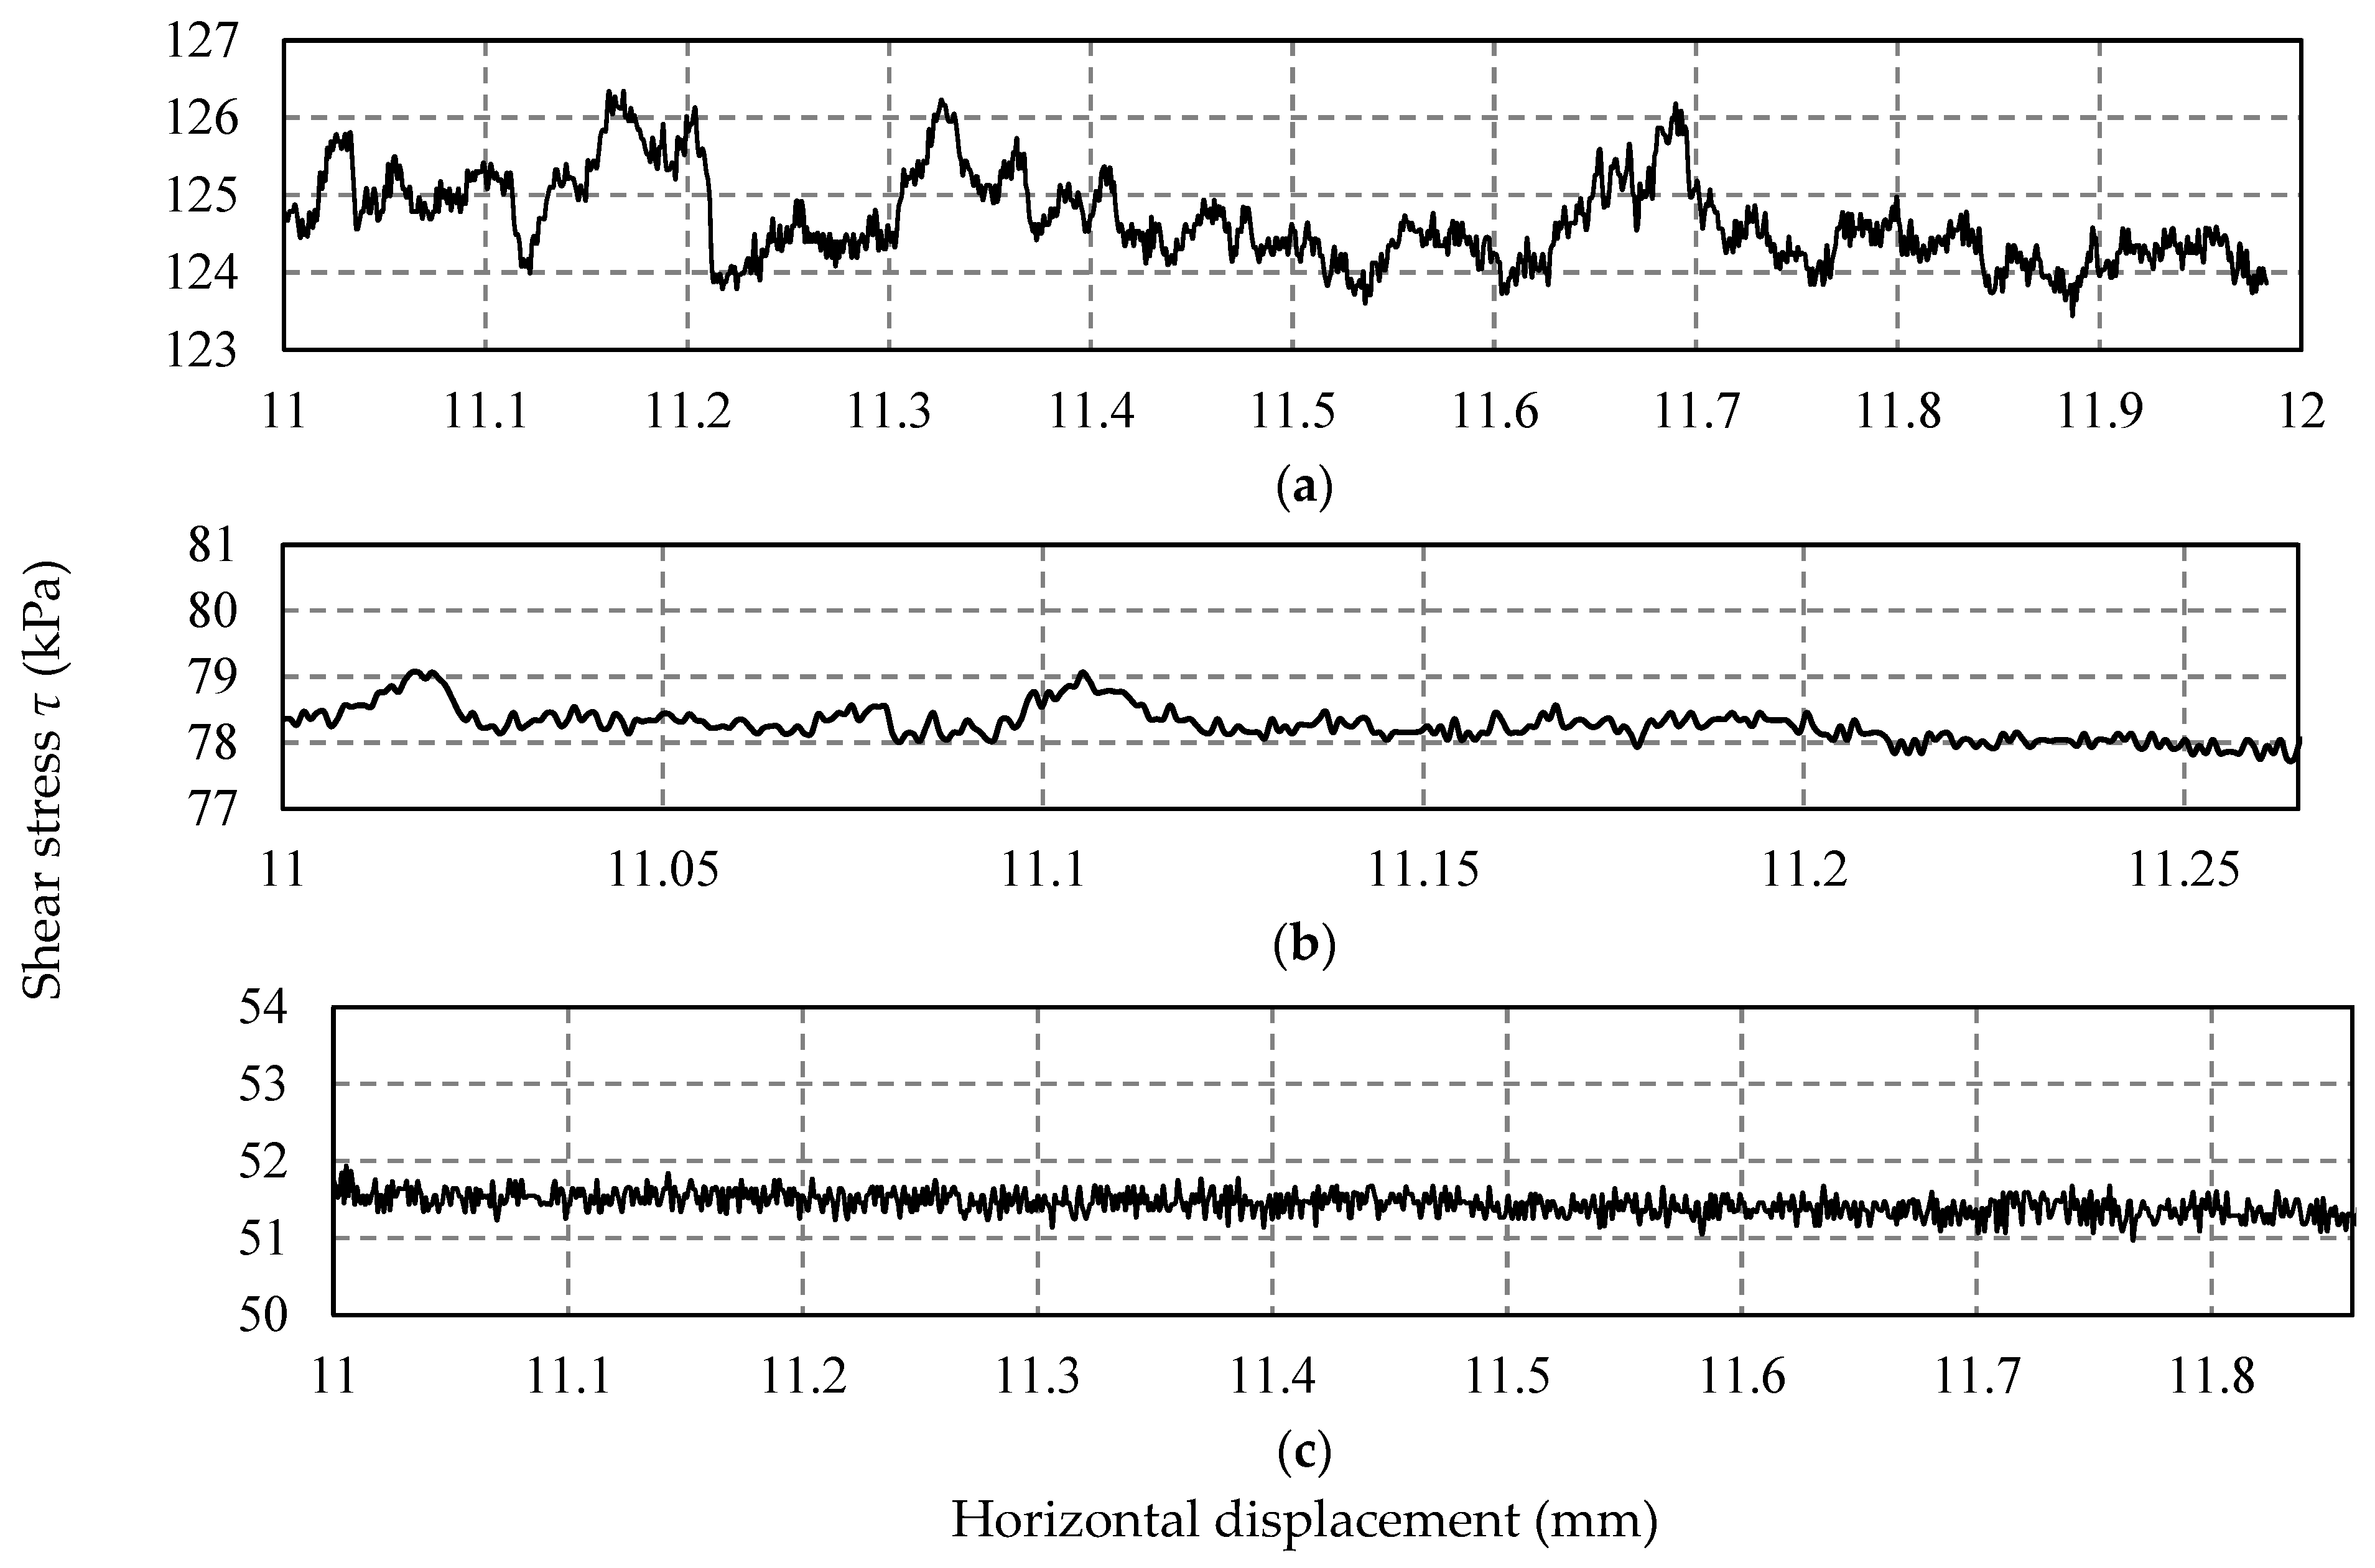
The residual state of granite residual soils was able to be determined in a long horizontal displacement when the orientation of the particles occurred and was then kept stable. However, a small amplitude of fluctuation in shear stress still existed and was relatively regular in the residual state. The shape of the shear band was not an ideal flat layer, which was caused by the CGPs, such as the quartz particles. It was seen that the lower the FGP fraction was, the greater the amplitude of the fluctuation would be.
Under the same normal stress, the peak strength and residual strength decreased with an increase in the ratio of FGPs and then remained almost the same when the ratios of FGPs were equal to 85% and 90%, respectively. In addition, the post-peak attenuation tended to increase with the increasing FGPs.
The residual frictional angle is rarely dependent on the ratio of FGPs when the ratio of FGPs is around 90%, which was possibly due to the fact that contact between CGPs and other grained particles hardly ever occurred.
Though predictions of the residual frictional angles seem to be possible for granite residual soils, we have to note that the models proposed in this study are not suitable for different kinds of soils. However, the residual frictional angle of granite residual soils was seen to be closely related to the available indexes used in this study, and it is evident that the influences of kinds of available indexes on the residual frictional angle can be ranked in order of r FGP > w L > w p > I P > r CGP r CGP .

Author Contributions

Methodology, C.F.; Software, C.G.; Formal analysis, C.F.; Writing—original draft, C.F.; Writing—review & editing, Y.L. and B.X.; Visualization, C.G.; Supervision, Y.L. and B.X. All authors have read and agreed to the published version of the manuscript.

Funding

This research was supported by the Jiangsu Provincial Department of Housing and Urban Rural Development (grant No. 2021ZD07) and the school-level research projects of the Yancheng Institute of Technology (grant No. xjr2021008).

Data Availability Statement

Data are contained within the article.

Acknowledgments

The authors would like to gratefully acknowledge Akira Kawahara, formerly of the Chugoku-Shikoku Regional Agricultural Administration Office, and Yoshifumi Watanabe, of the Ehime Prefectural Government Office, for providing the soil materials that were suitable for the investigations.

Conflicts of Interest

The authors declare no conflicts of interest.

References

  1. Newmark, N.M. Effects of earthquakes on dams and embankments. Geotechnique 1965, 15, 137–160. [Google Scholar] [CrossRef]
  2. Insley, A.E.; Chatterji, P.K.; Smith, L.B. Use of residual strength for stability analyses of embankment foundations containing preexisting failure surfaces. Can. Geotech. J. 1977, 14, 408–428. [Google Scholar] [CrossRef]
  3. Marcuson, W.F.; Hynes, M.E.; Franklin, A.G. Evaluation and Use of Residual Strength in Seismic Safety Analysis of Embankments. Earthq. Spectra 1990, 6, 529–572. [Google Scholar] [CrossRef]
  4. Skempton, A.W. Residual strength of clays in landslides, folded strata and the laboratory. Geotechnique 1985, 35, 3–18. [Google Scholar] [CrossRef]
  5. Zhao, Y.R.; Yang, H.Q.; Huang, L.P.; Chen, R.; Chen, X.S.; Liu, S.Y. Mechanical behavior of intact completely decomposed granite soils along multi-stage loading–unloading path. Eng. Geol. 2019, 260, 105242. [Google Scholar] [CrossRef]
  6. Meng, F.Y.; Chen, R.; Wu, H.N.; Xie, S.W.; Liu, Y. Observed behaviors of a long and deep excavation and collinear underlying tunnels in Shenzhen granite residual soil. Tunn. Undergr. Space Technol. 2020, 103, 103504. [Google Scholar] [CrossRef]
  7. Lin, P.; Zhang, J.J.; Huang, H.; Huang, Y.X.; Wang, Y.Q.; Garg, A. Strength of Unsaturated Granite Residual Soil of Shantou Coastal Region Considering Effects of Seepage Using Modified Direct Shear Test. Indian Geotech. J. 2021, 51, 719–731. [Google Scholar] [CrossRef]
  8. Wu, N.S. A Study on Characteristics and Some Engineering Problems of Granite Residual Soil with Structural Nature. Ph.D. Thesis, Nanjing Forestry University, Jiangsu, China, 2005. (In Chinese). [Google Scholar]
  9. Saito, R.; Fukuoka, H.; Sassa, K. Experimental Study on the Rate Effect on the Shear Strength. Disaster Mitig. Debris Flows Slope Fail. Landslides 2006, 421–427. [Google Scholar]
  10. Suzuki, M.; Hai, N.V.; Yamamoto, T. Ring shear characteristics of discontinuous plane. Soils Found. 2017, 57, 1–22. [Google Scholar] [CrossRef]
  11. Duong, N.T.; Suzuki, M.; Hai, N.V. Rate and acceleration effects on residual strength of Kaolin and kaolin-bentonite mixtures in ring shearing. Soils Found. 2018, 58, 1153–1172. [Google Scholar] [CrossRef]
  12. Wang, Y.C.; Cong, L. Effects of water content shearing rate on residual shear stress Arab. J. Sci. Eng. 2019, 44, 8915–8929. [Google Scholar] [CrossRef]
  13. LaGatta, D.P. Residual Strength of Clay and Clay-Shales by Rotation Shear Tests. Ph.D. Thesis, Harvard University, Cambridge, MA, USA, 1970. [Google Scholar]
  14. So, E.K.; Okada, F. Some factors influencing the residual strength of remoulded clays. Soils Found. 1978, 18, 107–118. [Google Scholar] [CrossRef]
  15. Li, D.; Yin, K.; Glade, T.; Leo, C. Effect of over-consolidation and shear rate on the residual strength of soils of silty sand in the three gorges reservoir. Sci. Rep. 2017, 7, 5503. [Google Scholar] [CrossRef] [PubMed]
  16. Yuan, W.N.; Fan, W.; Jiang, C.C.; Peng, X.L. Experimental study on the shear behavior of loess and paleosol based on ring shear tests. Eng. Geol. 2019, 250, 11–20. [Google Scholar] [CrossRef]
  17. Gibo, S.; Egashira, K.; Ohtsubo, M. Residual strength of smectite-dominated soils from the Kamenose landslide in Japan. Can. Geotech. J. 1987, 24, 456–462. [Google Scholar] [CrossRef]
  18. Eid, H.T.; Rabie, K.H.; Wijewickreme, D. Drained residual shear strength at effective normal stresses relevant to soil slope stability analyses. Eng. Geol. 2016, 204, 94–107. [Google Scholar] [CrossRef]
  19. Bishop, A.W.; Green, G.E.; Garga, V.K.; Andresen, A.; Brown, J.D. A new ring shear apparatus and its application to measurement of residual strength. Geotechnique 1971, 21, 273–328. [Google Scholar] [CrossRef]
  20. JSCE. A Guide to Soil Testing; Japan Society of Civil Engineers: Tokyo, Japan, 2003. (In Japanese) [Google Scholar]
  21. JICE River Earthworks Design. In: River Earthworks Manual, April 2009. Available online: https://www.jice.or.jp/tech/material/detail/11 (accessed on 13 December 2023). (In Japanese).
  22. Holtz, R.D.; Kovacs, W.D. An Introduction to Geotechnical Engineering; Editor Skrable, K., Ed.; University of Michigan: Ann Arbor, MI, USA, 1981; pp. 88–89. [Google Scholar]
  23. Chen, X.P.; Liu, D. Residual strength of slip zone soils. Landslides 2014, 11, 305–314. [Google Scholar] [CrossRef]
  24. Stark, T.D.; Vettel, J.J. Bromhead ring shear test procedure. Geotech. Test. J. 1992, 15, 24–32. [Google Scholar] [CrossRef]
  25. Anderson, W.F.; Hammoud, F. Effect of testing procedure in ring shear tests. ASTM Geotech. Test. J. 1988, 11, 204–207. [Google Scholar] [CrossRef]
  26. Skempton, A.W. Long-term stability of clay slopes. Geotechnique 1964, 14, 77–102. [Google Scholar] [CrossRef]
  27. Scaringi, G.; Di Maio, C. Influence of displacement rate on residual shear strength of clays. Procedia Earth Planet. Sci. 2016, 16, 137–145. [Google Scholar] [CrossRef]
  28. Bromhead, E.N. A simple ring shear apparatus. Ground Eng. 1979, 12, 40–44. [Google Scholar]
  29. Fang, C.; Shimizu, H.; Nishimura, S.; Hiramatsu, K.; Onishi, T.; Nishiyama, T. Seismic risk evaluation of irrigat-ion tanks: A case study in Ibigawa-Cho, Gifu Prefecture, Japan. Int. J. GEOMATE 2018, 14, 1–6. [Google Scholar] [CrossRef]
  30. Mishra, S.; Deeds, N.; Ruskauff, G. Global sensitivity analysis techniques for probabilistic ground water modeling. Ground Water 2009, 47, 727–744. [Google Scholar] [CrossRef] [PubMed]
  31. Erdal, D.; Xiao, S.N.; Nowak, W.; Cirpka, O. Sampling behavioral model parameters for ensemble-based sensitivity analysis using Gaussian process emulation and active subspaces. Stoch. Environ. Res. Act. Subsp. 2020, 34, 1813–1830. [Google Scholar] [CrossRef]
  32. De, P.K.; Furdas, B. Discussion –Correlation between Atterberg plasticity limits and residual shear strength of natural soils. Geotechnique 1973, 23, 600–601. [Google Scholar] [CrossRef]
  33. Wen, B.P.; Aydin, A.; Duzgoren-Aydin, N.S.; Li, Y.R.; Chen, Y.R.; Xiao, S.D. Residual strength of slip zones of large landslides in the Three Gorges area, China. Eng. Geol. 2007, 93, 82–98. [Google Scholar] [CrossRef]
  34. Rehman, Z.U.; Khalid, U.; Ijaz, N.; Mujtaba, H.; Haider, A.; Farooq, K.; Ijaz, Z. Machine learning-based intelligent modeling of hydraulic conductivity of sandy soils considering a wide range of grain sizes. Eng. Geol. 2022, 311, 106899. [Google Scholar] [CrossRef]
  35. Farooq, F.; Rehman, Z.U.; Shahzadi, M.; Mujtaba, H.; Khalid, U. Optimization of Sand-Bentonite Mixture for the Stable Engineered Barriers using Desirability Optimization Methodology: A Macro-Micro-Evaluation. KSCE J. Civil. Eng. 2022, 27, 40–52. [Google Scholar] [CrossRef]
  36. Khalid, U.; Rehman, Z.U.; Mujtaba, H.; Farooq, K. 3D response surface modeling based in-situ assessment of physico-mechanical characteristics of alluvial soils using dynamic cone penetrometer. Trans. Geot. 2022, 36, 100781. [Google Scholar] [CrossRef]
  37. Mujtaba, H.; Shimobe, S.; Farooq, K.; ur Rehman, Z.; Khalid, U. Relating gradational parameters with hydraulic conductivity of sandy soils: A renewed attempt. Arabian J. Geosci. 2021, 14, 1920. [Google Scholar] [CrossRef]
  38. Seyeek, J. Residual shear strength of soils. Bull. Int. Assoc. Eng. Geol. 1978, 17, 73–75. [Google Scholar] [CrossRef]
  39. Stark, T.D.; Choi, H.; McCone, S. Drained shear strength parameters for analysis of landslides. J. Geotech. Geoenviron Eng. 2005, 131, 575–588. [Google Scholar] [CrossRef]
  40. Lupini, J.F.; Skinner, A.E.; Vaughan, P.R. The drained residual strength of cohesive soils. Geotechnique 1981, 31, 181–213. [Google Scholar] [CrossRef]
  41. Yamashita, E.; Cikmit, A.A.; Tsuchida, T.; Hashimoto, R. Strength estimation of cement-treated marine clay with wide ranges of sand and initial water contents. Soils Found. 2020, 60, 1065–1083. [Google Scholar] [CrossRef]
  42. Hossien, R.M.; Mahsa, G.; Bahram, G.; Seyed, M.S. A predictive equation for residual strength using a hybrid of subset selection of maximum dissimilarity method with Pareto optimal multi-gene genetic programming. Geosci. Front. 2021, 12, 101222. [Google Scholar] [CrossRef]
Figure 1. The plasticity of soil samples is plotted on the plasticity chart.
Coatings 14 00105 g001
Figure 2. Schematic diagrams of the Bromhead ring shear apparatus: (a) side view of the apparatus and (b) aerial view of the specimen container ready for shearing.
Coatings 14 00105 g002
Figure 3. Shear stress versus horizontal displacement for all samples.
Coatings 14 00105 g003
Figure 4. Fluctuations in the residual state of soil samples under a normal stress of 201 kPa for different ratios of FGPs: (a) 29.41%, (b) 71.42%, and (c) 97.12%.
Coatings 14 00105 g004
Figure 5. Peak strength and residual strength versus the ratios of FGPs under a normal stress of 201 kPa.
Coatings 14 00105 g005
Figure 6. Residual frictional angle versus available indexes of granite residual soil: (a) ratio of FGPs, (b) relative grading parameter, (c) liquid limit, (d) plastic limit, and (e) plasticity index.
Coatings 14 00105 g006
Figure 7. Comparison between observed and predicted values of residual frictional angles for granite residual soils by different indexes: (a) ratio of FGPs, (b) relative grading parameter, and (c) liquid limit.
Coatings 14 00105 g007
Table 1. Physical indexes of granite residual soil taken from the study site.
Water Content (%)Void Ratio, eAverage Particle Size, d50 (mm)Uniformity Coefficient, CuCurvature Radius, CcSpecific Gravity, GsGravel Content (%)Sand Content (%)Silt and Clay Content (%)
>2 mm0.075–2 mm<0.075 mm
26.260.840.3285.650.3718.3026.0034.1039.90
Table 2. Mineral composition of granite residual soil taken from the study site.
QuartzKaoliniteIlliteHematite
62.331.93.72.1
Table 3. Ratios of CGPs and FGPs, r CGP and r FGP , respectively, in samples used in drained ring shear tests.
No.Sample CharactersRatios of CGPs and FGPs in Each Sample Used in Drained Ring Shear Tests (%)
CGPs: 0.075–0.425 mmFGPs: 0–0.075 mm
1HM11000
2HM270.5929.41
3HM360.0139.99
4HM451.6248.38
5HM544.4655.54
6HM638.3861.62
7HM732.4267.58
8HM828.5871.42
9HM924.5975.41
10HM1021.4078.60
11HM1115.0984.91
12HM1210.2689.74
13HM136.2593.75
14HM142.8897.12
15HM150100
Table 4. Soil properties and residual frictional angle of each granite residual soil sample.
Sample Character r FGP (%) r CGP r FGP w L (%) w P (%) I P (%)ϕr (°)
HM10××××32.94
HM229.412.4024.65××30.85
HM339.991.5025.1014.6810.4227.81
HM448.381.0628.4315.0813.3525.75
HM555.540.8030.8715.5815.2923.69
HM661.620.6231.5016.0015.5021.66
HM767.580.4732.7416.9615.7821.47
HM871.420.4033.8218.3615.4620.41
HM975.410.3234.4518.9715.4819.90
HM1078.600.2736.6419.4917.1518.01
HM1184.910.1740.1619.9620.215.98
HM1289.740.1142.0120.4221.5914.15
HM1393.750.0645.1920.8124.3813.90
HM1497.120.0346.2721.1825.0913.87
HM15100047.0321.6925.3413.97
× means that the value could not be obtained.
Table 5. Multiple regression analysis results for the residual frictional angle.
FactorIntercept r FGP (%) r CGP r FGP w L (%) w p (%) I P (%)
Coefficient35.8379−0.04133.07930−0.5188−0.2945
Multiple R0.9910
R20.9821
Adjusted R2 0.8482
Table 6. Determination coefficients (R2) of linear correlations among parameters.
Indexϕr (°) w L (%) w p (%) I P (%) r FGP (%)
ϕr (°)0.940.940.900.96
w L (%)0.940.910.970.95
w p (%)0.940.910.820.96
I P (%)0.900.970.820.89
r FGP (%)0.960.950.960.89
Disclaimer/Publisher’s Note: The statements, opinions and data contained in all publications are solely those of the individual author(s) and contributor(s) and not of MDPI and/or the editor(s). MDPI and/or the editor(s) disclaim responsibility for any injury to people or property resulting from any ideas, methods, instructions or products referred to in the content.

