Evaluation of the Factors Affecting the Wear Resistance of Calcined Bauxite Aggregates

1
School of Highway, Chang’an University, Xi’an 710064, China
2
Shanxi Transportation Technology Research & Development Co. Ltd, Taiyuan 030006, China
*
Authors to whom correspondence should be addressed.
Coatings 2019, 9(11), 761; https://0-doi-org.brum.beds.ac.uk/10.3390/coatings9110761
Submission received: 16 October 2019
/
Revised: 6 November 2019
/
Accepted: 11 November 2019
/
Published: 15 November 2019
Abstract
:The continuous use of load-bearing road surfaces often results in degradation over time, particularly if they are constructed from cement or aggregates that were poorly polished. Surfaces prepared from calcined bauxite exhibit good skid resistance properties, and this work describes a comparison of the wear resistance of six different kinds of calcined bauxite with the aim of identifying the best material for road construction. Our results suggest that wear resistance of calcined bauxite is not only related to its hardness, but also dependent on the hardness dispersion throughout the aggregate and its elastic modulus. These data provide important information to enable the correct grade of bauxite clinker to be chosen for constructing high-friction road surfaces with good wear and skid resistance properties.
1. Introduction
The anti-skid performance of asphalt pavements, especially cement surfaces, can degrade quickly over their service periods, resulting in a decline in both their road service capacity and their safety. Although, cementitious aggregates were shown to display comparable aggregate properties [1], these artificial aggregates still produce inferior wear resistance to calcined bauxite results when used for road construction [2]. Calcined bauxite is an aggregate that provides a high level of skid resistance to road surfaces over a long period of time [3].
Bauxite clinker is one of the main raw materials used to produce traditional refractory materials. It is formed by crushing, sieving, and calcination in a kiln, followed by pulverization into particles with different sizes used in road pavement [4]. The HFS (high-friction surfacing) industry in the United Kingdom, the United States, and Ireland uses refractory grade calcined bauxite mostly imported from China. It is estimated that China produces 95% of the global refract Bauxite for various industries [2,3,5]. Shanxi Province accounts for 42% of the total national savings. Bauxite clinker has excellent wear resistance and skid resistance, which is determined by its own characteristics. The types of bauxite, the calcination process, and the processing of the bauxite ore have an important influence on the structure and performance of the bauxite clinker [6]. The bauxite distributed in Shanxi province is mainly of the dawsonite–kaolinite type (D–K type). D–K type bauxite is a basic type of bauxite mineral with a good texture, which is suitable for manufacturing various refractory materials [7,8]. At present, there are mainly two kinds of firing equipment for Shanxi bauxite mines: a vertical kiln and a rotary kiln. Rotary kilns have a large production capacity, a high degree of automation, and a stable and uniform product quality. Therefore, there are more than 60 rotary kilns in the Shanxi province. Due to the heterogeneity of bauxite, calcined bauxite clinkers also have certain differences. At present, bauxite clinkers are mainly divided into six grades according to the Al2O3 content, whereby higher Al2O3 contents define a higher grade [7].
Based on the different grades of bauxite clinker, there is certain blindness in the selection of bauxite clinker in application. In addition, the reason for bauxite clinker having excellent wear resistance and skid resistance is unknown. This paper mainly provides a reference for the selection of pavement anti-skid aggregates by solving these problems.
The influence of aggregates on skid resistance of road surfaces was investigated by a number of researchers, with Wang reporting that the long-term anti-skid performance of road surfaces was dependent on the anti-polishing effect and polished stone value content of their aggregates [9]. Aggregates with polished stone values greater than 50 are normally used to construct road surfaces used by heavy and medium traffic, Aggregates with a polished aggregate value of less than 44 should be applied for low-grade highways [10]. Wang et al. used Wehner–Schulze tests to evaluate the polishing resistance of coarse and fine aggregates, and found that the polishing resistance of the fine aggregates was greater [9]. The physical properties of the different aggregate grades determine their anti-skid properties. Wasilewska et al. reported that the good anti-polishing properties of thick basalt were due to the presence of particles with diameters lower than 0.02 mm, conferring them with a cryptocrystalline texture [10]. Rezaei et al. proposed a model to predict the skid resistance of asphalt pavements based on the grade of aggregate used [11,12]. The intervals between the aggregates also had an important effect on the skid resistance of asphalt pavements [13]. However, despite substantial research carried out on the anti-sliding performance of aggregates, investigations into their wear resistance performance were less well explored.
Several methods were proposed for measuring aggregate polishing resistance, including the most widely used polishing stone value (PSV) test that uses the British Pendulum Tester method [14] to evaluate skid resistance, and the Penn State reciprocating polishing machine method [15]. In recent years, the Wehner–Schulze test for measuring the polishing resistance of coarse aggregate also became more established [16], whilst Xie carried out polishing resistance measurements using an accelerated polishing machine using real tires for testing [17]. However, there is currently still no standard evaluation method that is universally recognized as a standard method for determining the skid and wear resistance of aggregate minerals.
Although the physical properties of aggregates clearly determine their overall performance as road surface materials, little is known about how these properties affect their wear resistance. Therefore, we decided to investigate the wear resistance of six different types of calcined bauxite. We determined the effect of the aggregate hardness of the calcined bauxites on their wear resistance as a function of time, using the phase proportion, the pore structure, Young’s modulus, and the nano-hardness and friction wear tests.
2. Experimental Materials and Methods
2.1. Performance Testing of Raw Materials
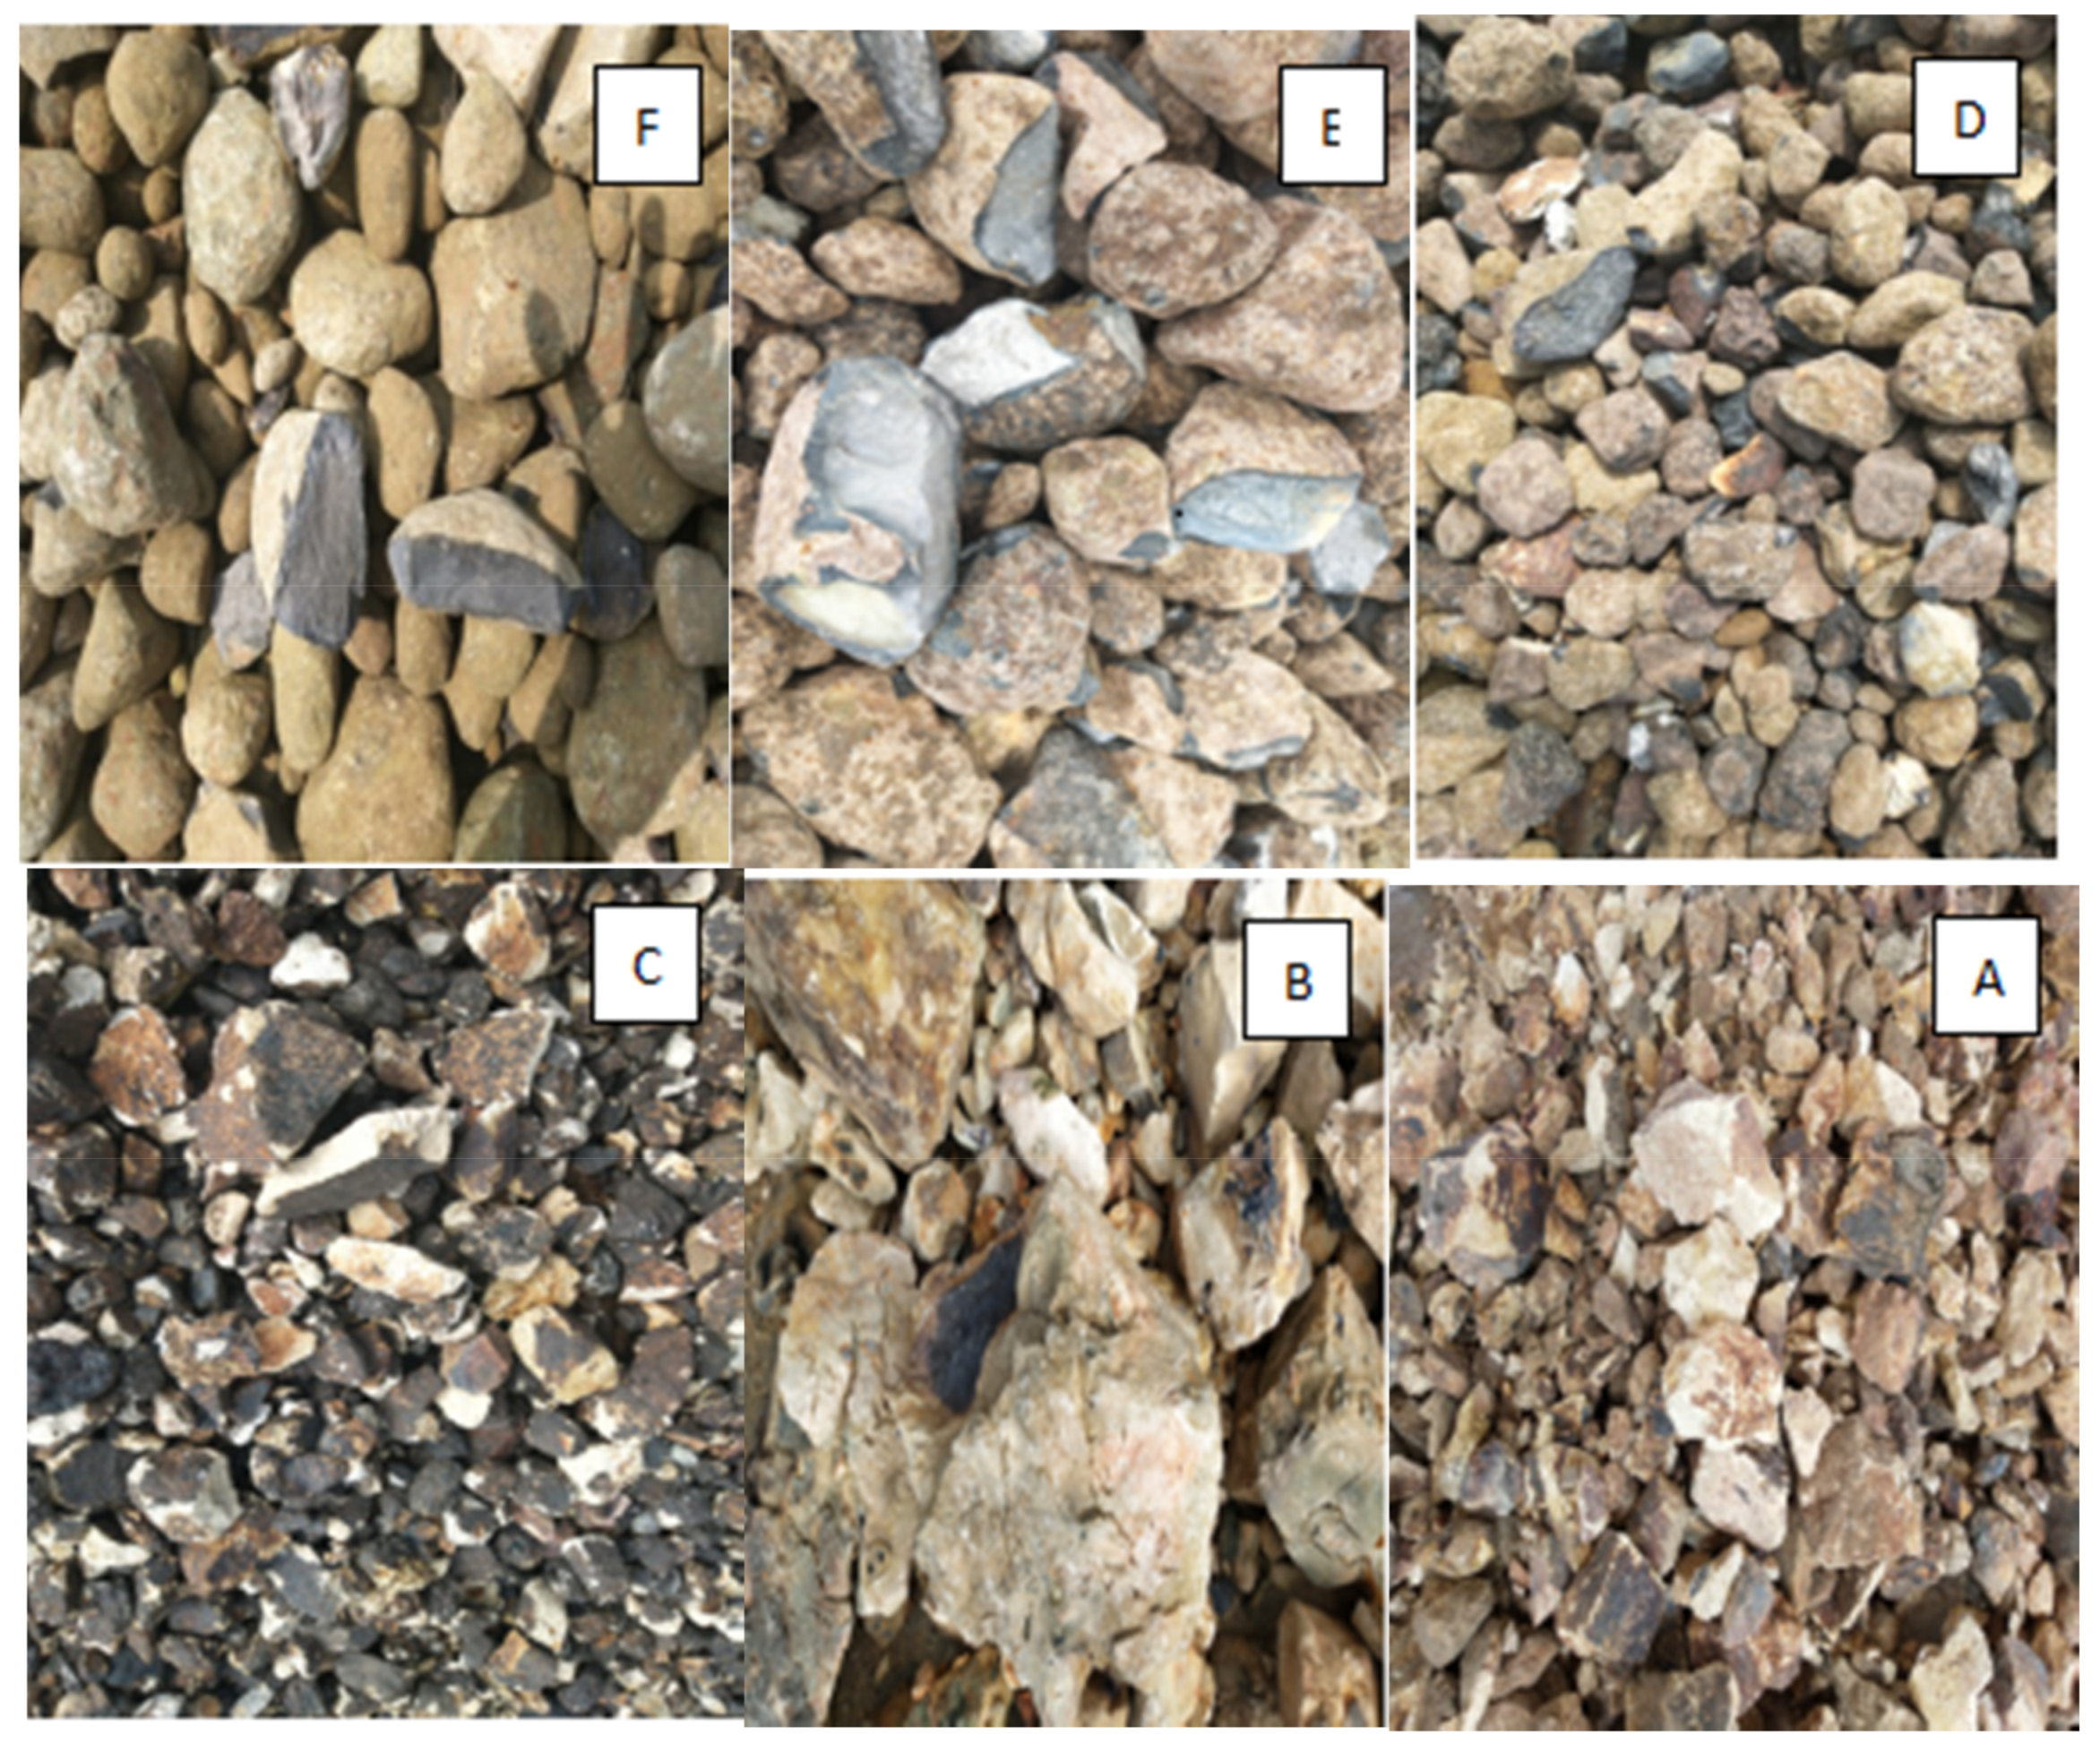
This study selected six types of bauxite clinker from Yangquan City, Shanxi Province, China. They were classified as A, B, C, D, E, and F according to their Al2O3 content. The different grades of calcined materials are shown in Figure 1. In total, 50 g of bauxite clinker was selected for each grade. Six types of calcined bauxite aggregate were washed with distilled water and vacuum-dried at 105 °C for 8 h. Before use, aggregates were ground into powder with particle sizes of around 40 μm. X-ray diffraction (XRD) was then used to determine the structures and phase proportions (mass percentage) of the calcined bauxite (Table 1).
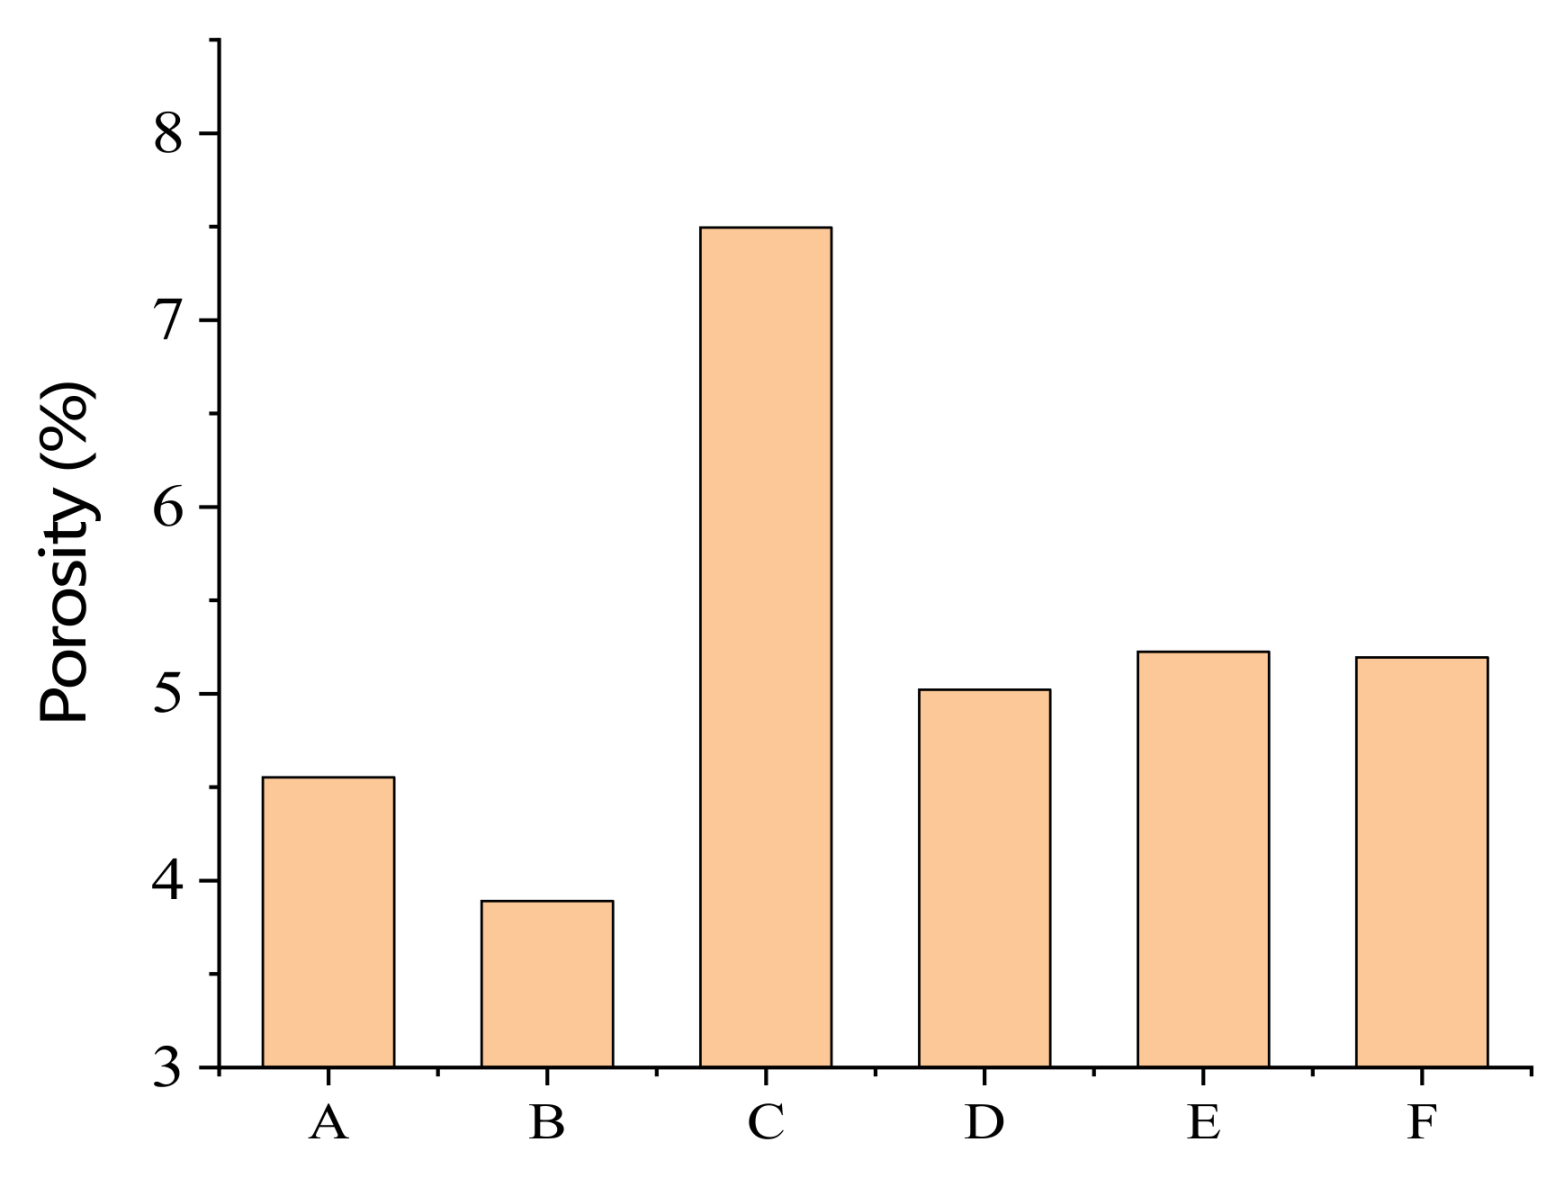
Six different calcined bauxite samples with an aggregate size of 4.75 mm were selected. Then, the samples were washed with distilled water and vacuum-dried at 105 °C for 8 h. Mercury injection tests were conducted using an AutoPore IV 9500V1.09 apparatus (Micromeritics Company of the United States, Lanzhou, China), and the results of the porosity tests are shown in Figure 2.
2.2. Friction-Wear Testing Results
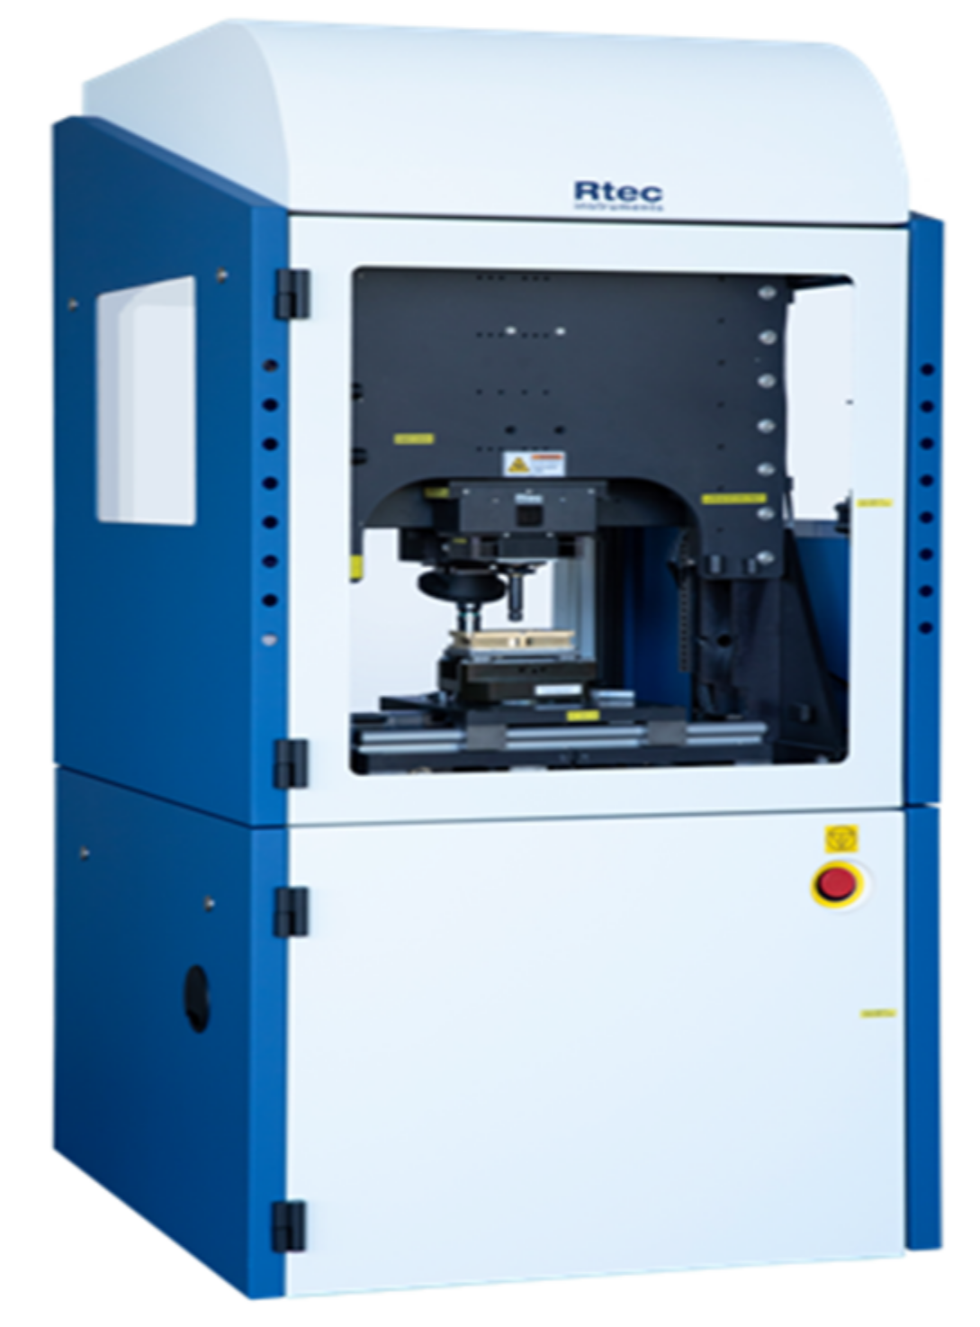
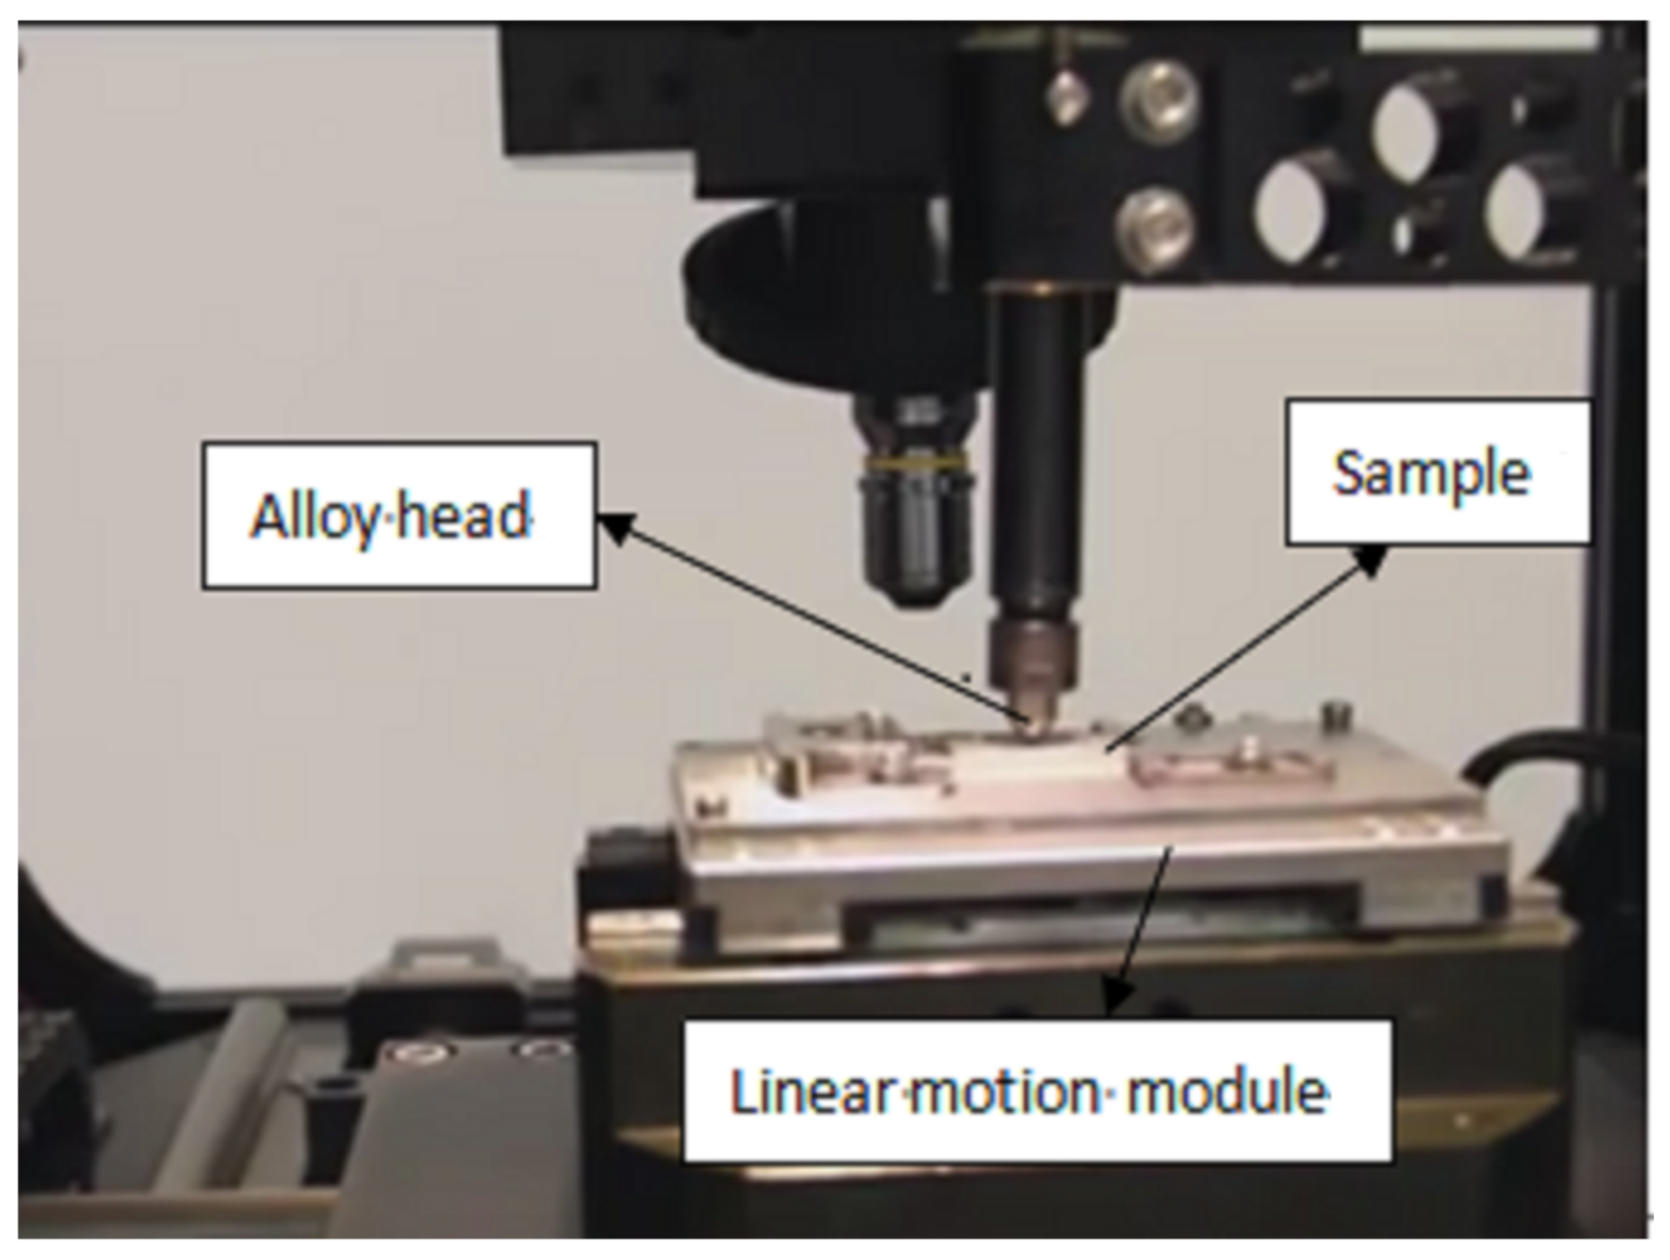
An friction-wear testing machine was used to measure the friction coefficient and wear rate of the six types of calcined bauxite (see Figure 3) using the loading mode shown in Figure 4. The hardware configuration used for these tests comprised an electronic balance, a loading force sensor of 500 N, a friction force sensor of 100 N, a reciprocating motion module, and a confocal microscope.
2.2.1. Sample Preparation
Each of the six types of calcined bauxite was cut into small cuboid pieces with a length of 30 mm, a width of 20 mm, and a height of 7 mm, with duplicate small cuboid pieces, before being dried and stored before analysis. Three samples were prepared for each bauxite clinker and the average value of the samples was used as the final test result.
2.2.2. Test Procedures
(1) Weighing
All samples were weighed before and after testing using an electronic balance, with duplicate samples of each bauxite grade measured in all cases, and their average values determined.
(2) Specimen analysis
The upper sample chamber of the wear testing machine contained WC (Wolfram Carbide) hard alloy balls with a diameter of 9.6 mm, with the lower sample chamber containing the calcined bauxite samples.
(3) Friction test
Identical friction test conditions were used to analyze the samples (see Table 2). The WC (Wolfram Carbide) hard alloy ball was attached to a ball fixture throughout the test. The lower specimen was fixed to the reciprocating drive platform by the lower plate clamp, with the upper ball samples remaining stationary and the lower calcined bauxite specimens undergoing reciprocating motion. Friction forces, loads, and friction coefficients were recorded in real time for an acquisition frequency of 1000 Hz.
(4) Morphology testing
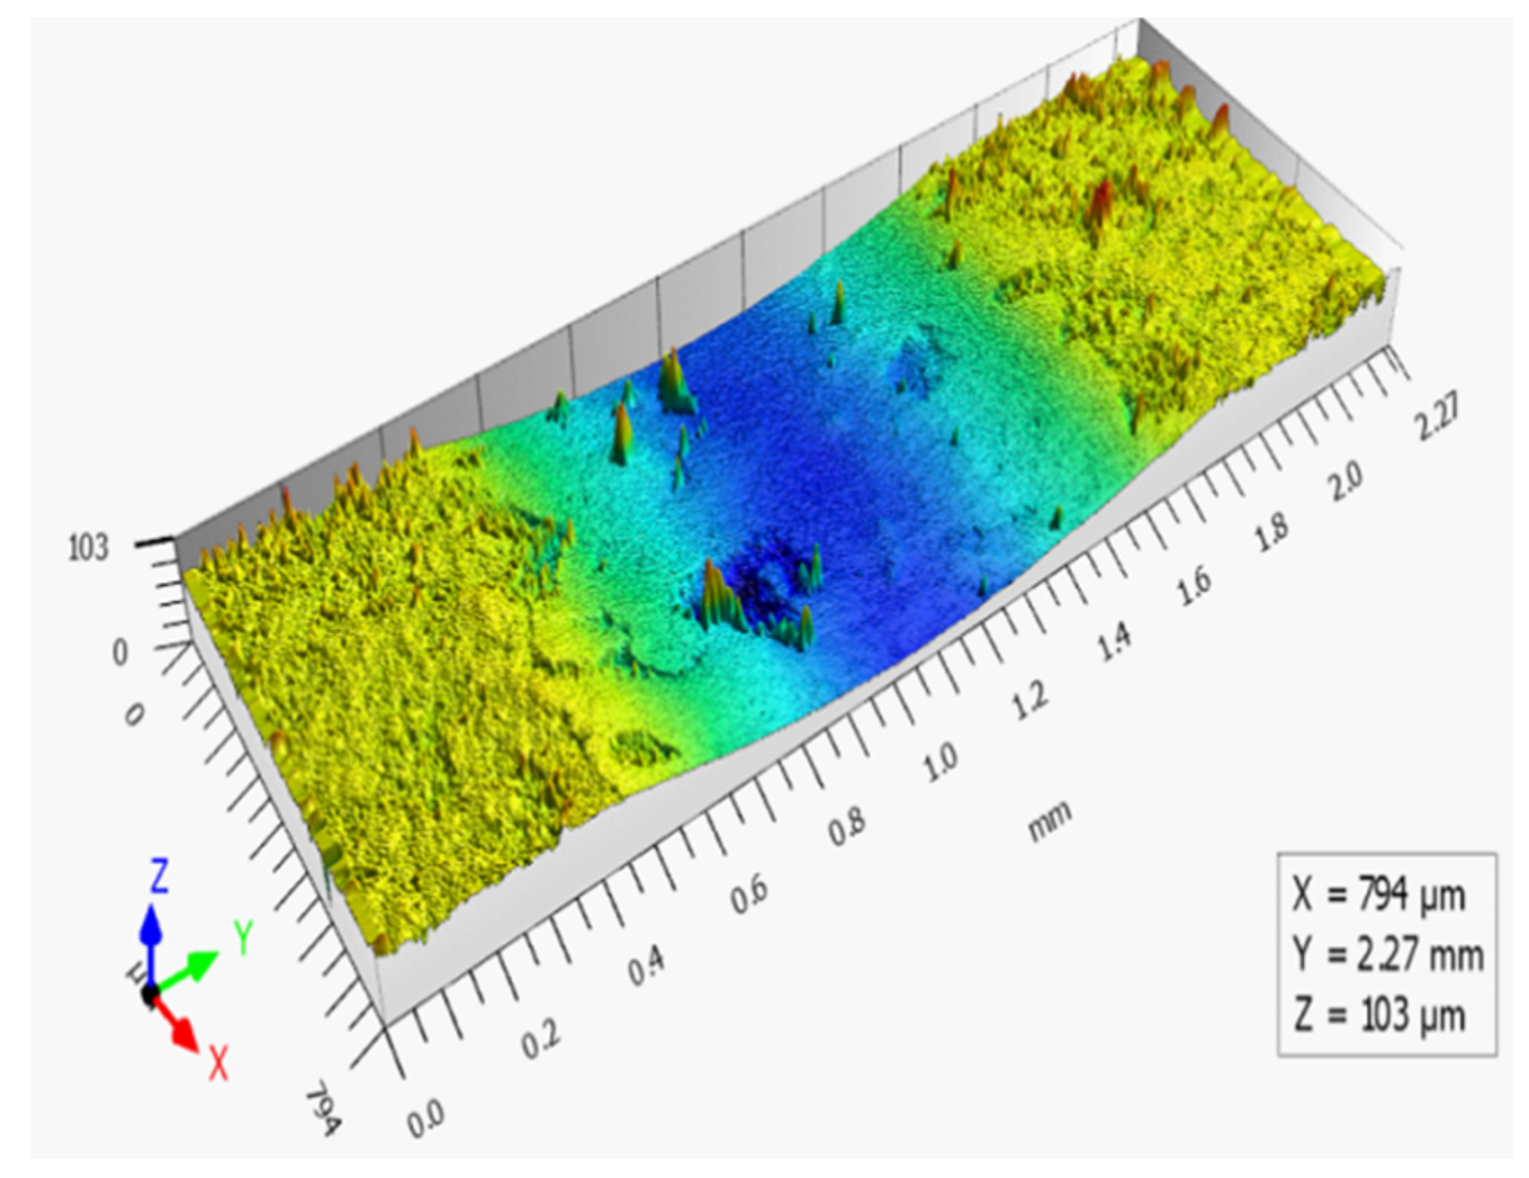
Confocal microscopy was used to analyze the surface morphology of the calcined bauxite samples for wear marks after the friction test was carried out (see Figure 5).
(5) Evaluation of wear resistance
A weight-loss method was used to quantitatively evaluate the wear resistance of the calcined bauxite aggregates tested, with Equation (1) used to calculate their wear resistance [18].
where ε is the wear resistance of material, and W is the wear rate of the material as a function of unit time (or unit movement distance).
2.3. Determination of Young’s Modulus and Nano-Hardness Testing
The nano-hardness of the calcined bauxite samples was determined using a nano-indentation system employing a Hystrion Ti-950 nanomechanics test system. A Vickers indentation head with a load range of 70 nN–10 mN was used for analysis, with a maximum pressure displacement of 5 μm and a maximum force of 10 mN.
Nano-hardness values (H) were calculated using Equation (2) [19].
where Pmax is the maximum load, and A is the contact area.
2.3.1. Specimen Preparation
The height of the specimens used in the friction tests ranged from 3 to 10 mm, with their up and down planes having a parallel orientation. The surfaces of all specimens were polished using a polishing machine for around 8 h using an Al2O3 polishing solution and a horizontal vibration drive speed of 7200 r/s, with samples then subjected to secondary polishing using a vibration polishing machine (BUEMLER). Microscopic analysis was used to determine the smoothness of the samples with surface fluctuation amplitudes of <100 nm being observed in all cases.
2.3.2. Test Procedures
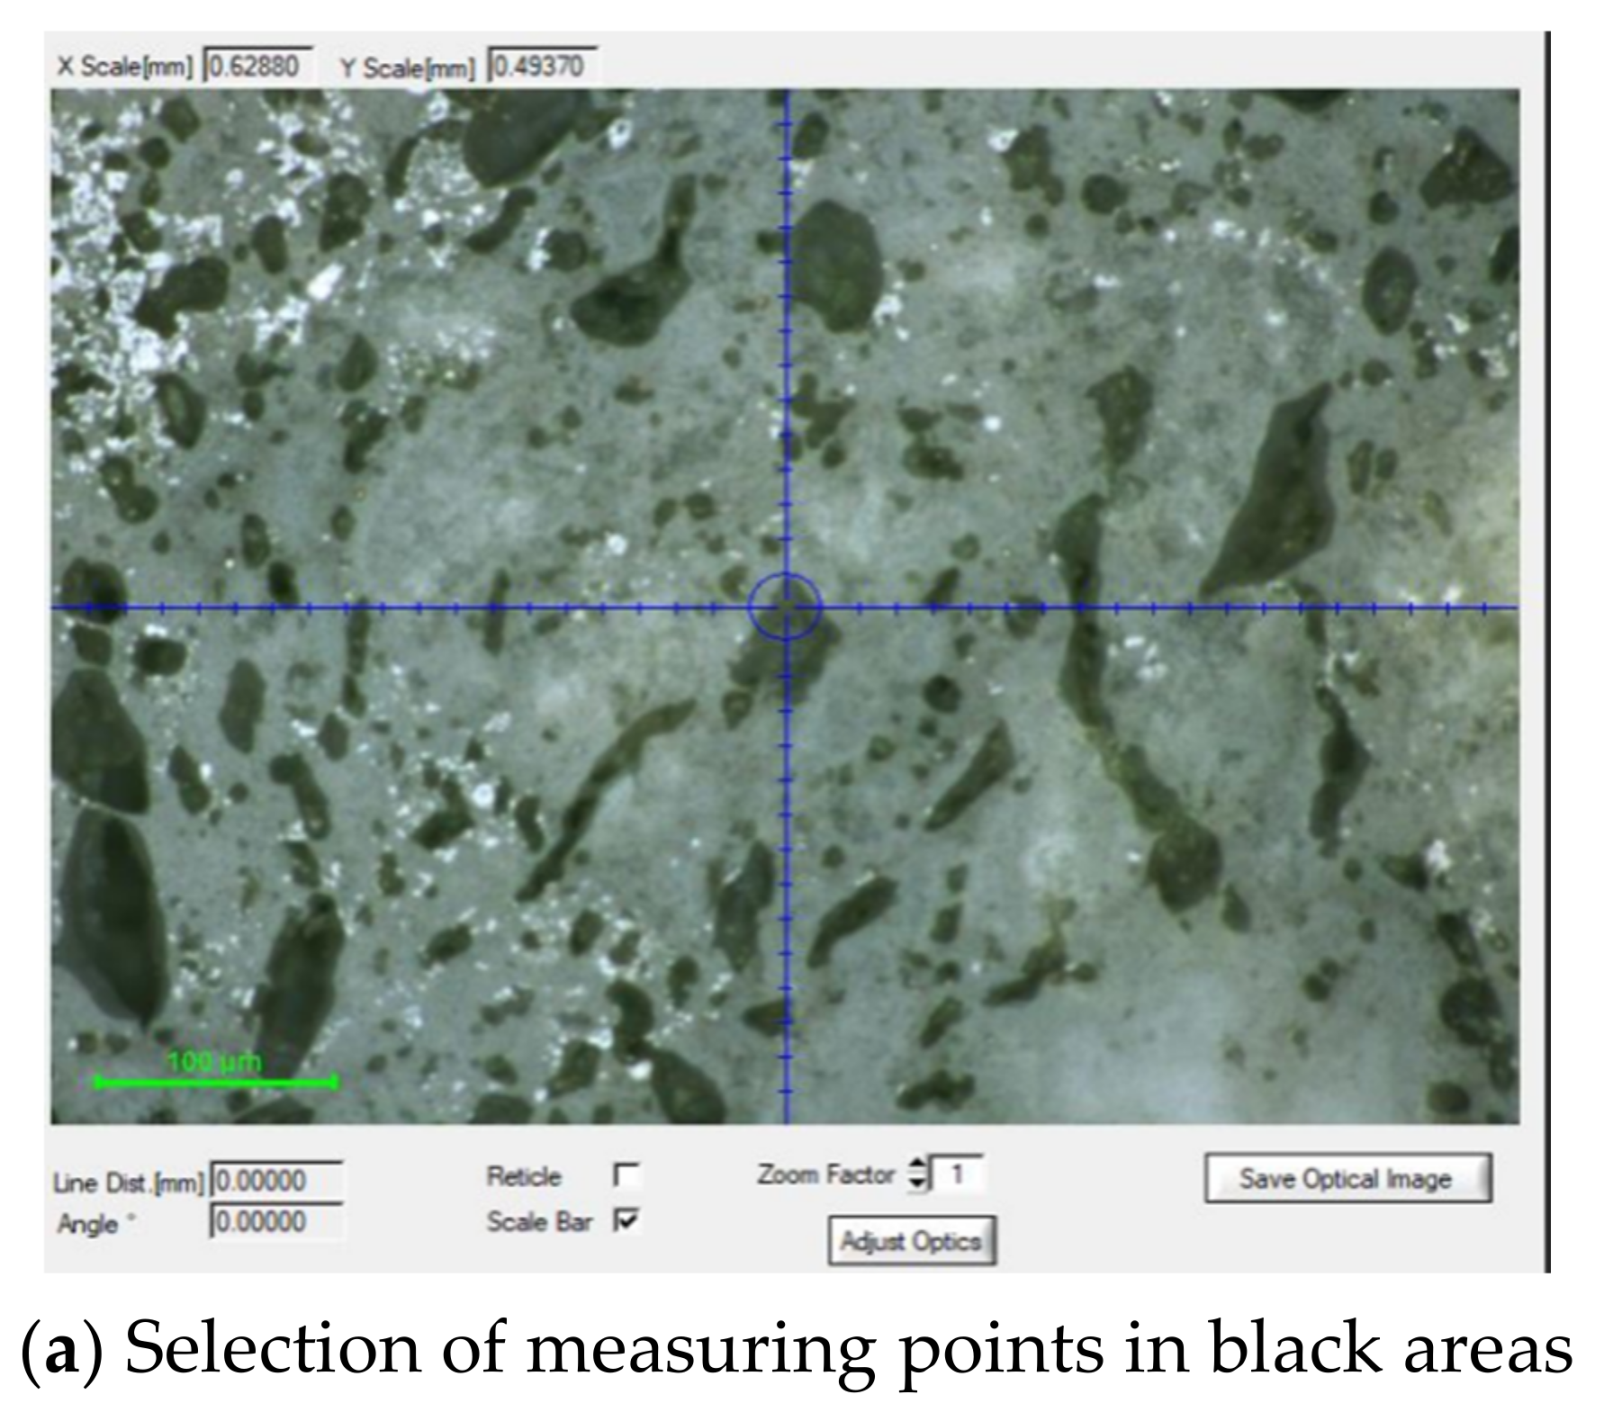
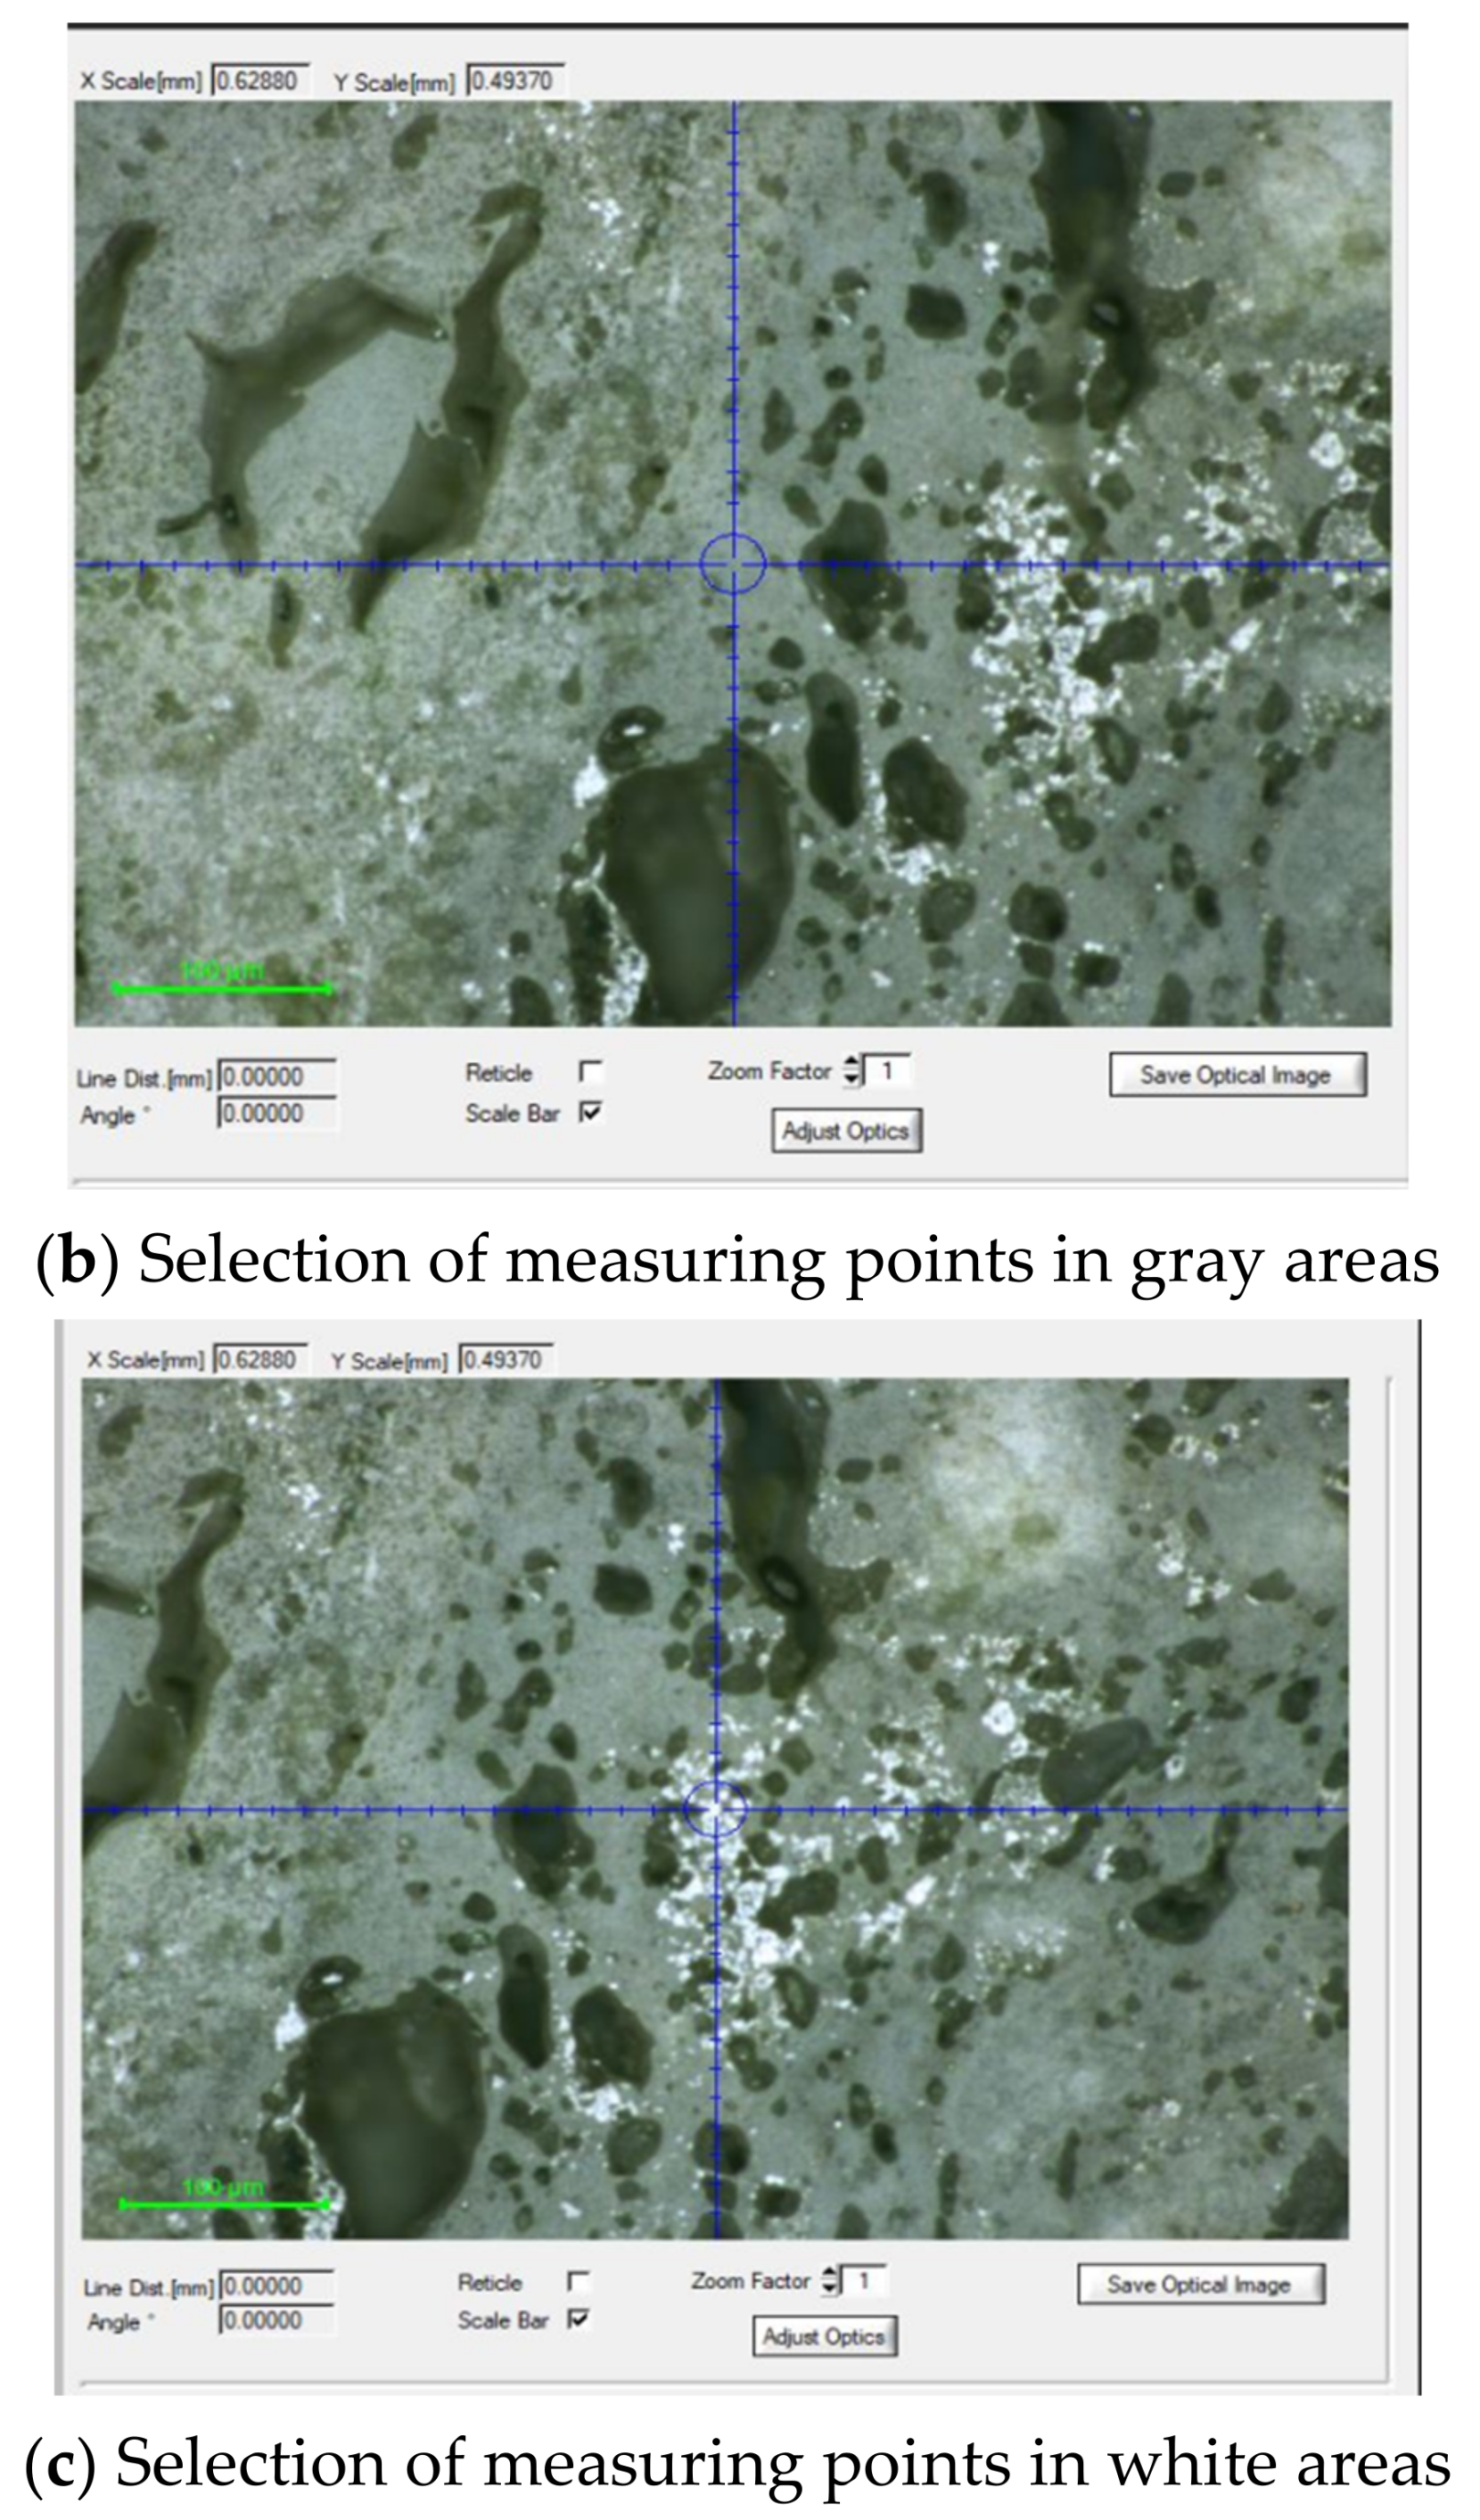
The testing instrument adopted a nano-mechanical testing system. Specimens were mounted for microscopic analysis, with different phases in each bauxite sample appearing as different colors under the microscope and three measuring points for each different colored area used to determine the nano-hardness and Young’s modulus values of each phase (see Figure 6). Each sample was subjected to three parallel tests in areas with the same color.
3. Results and Discussion
3.1. Friction-Wear Test Results
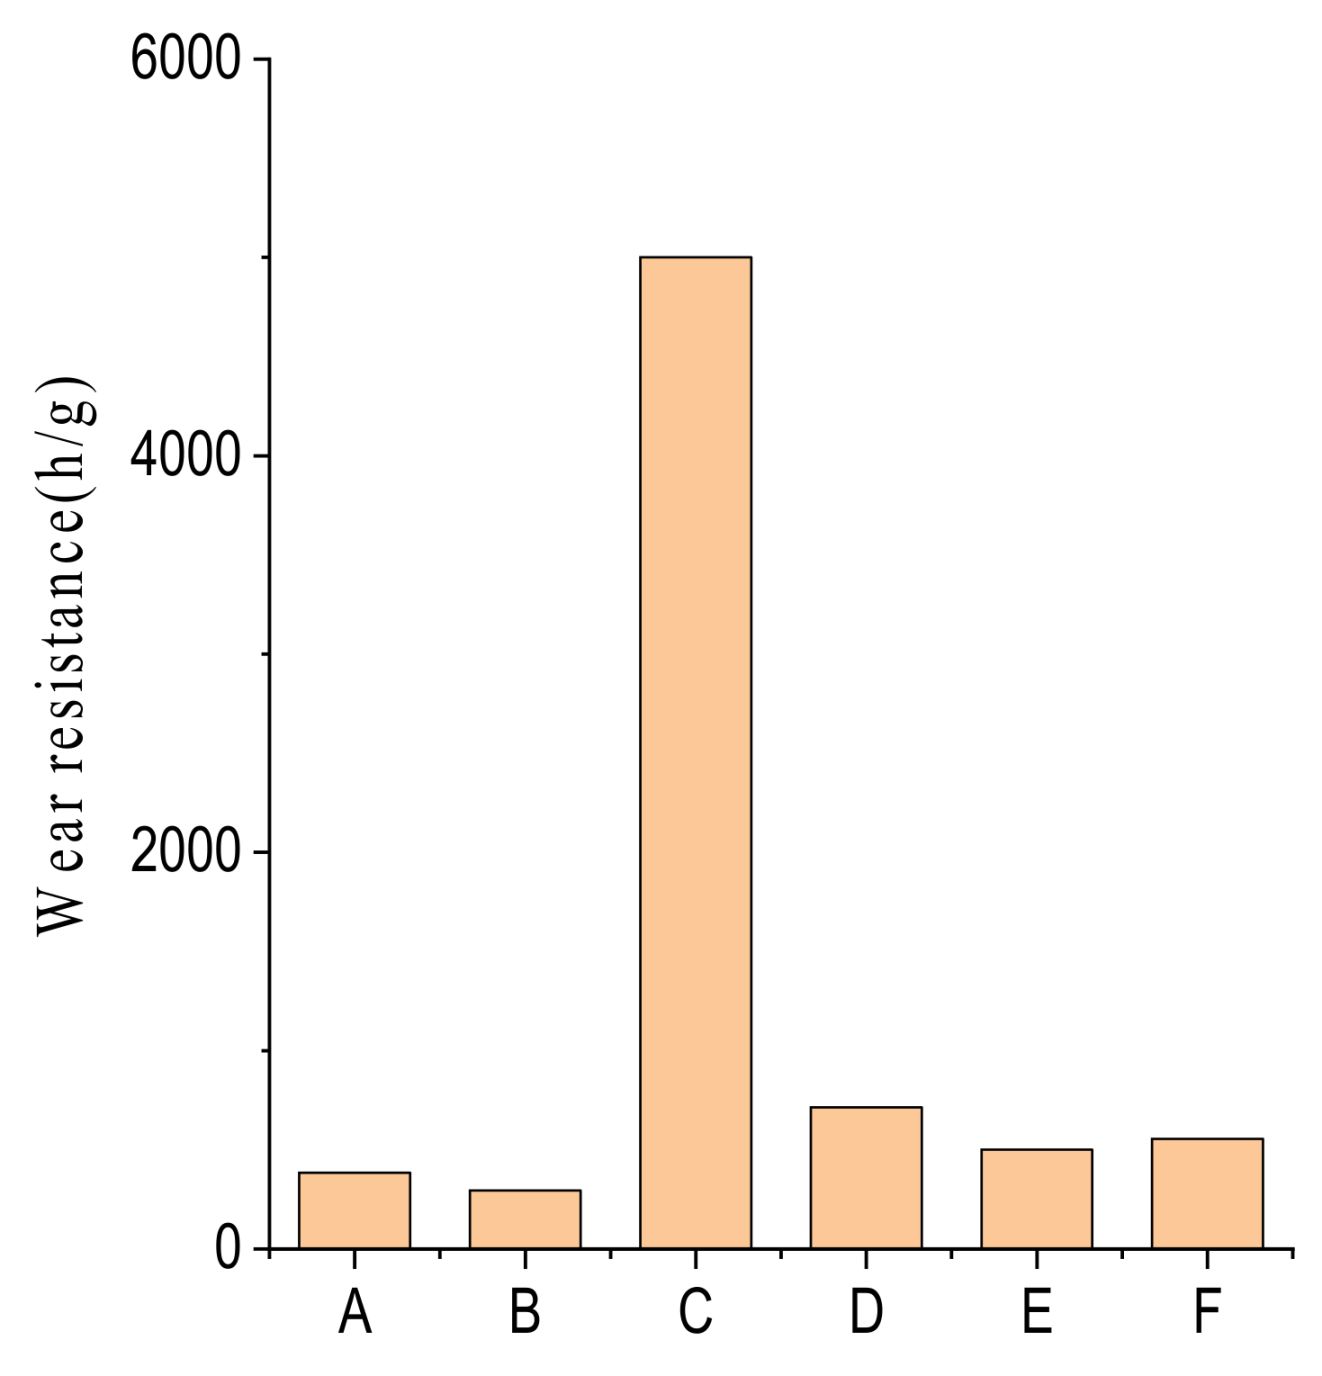
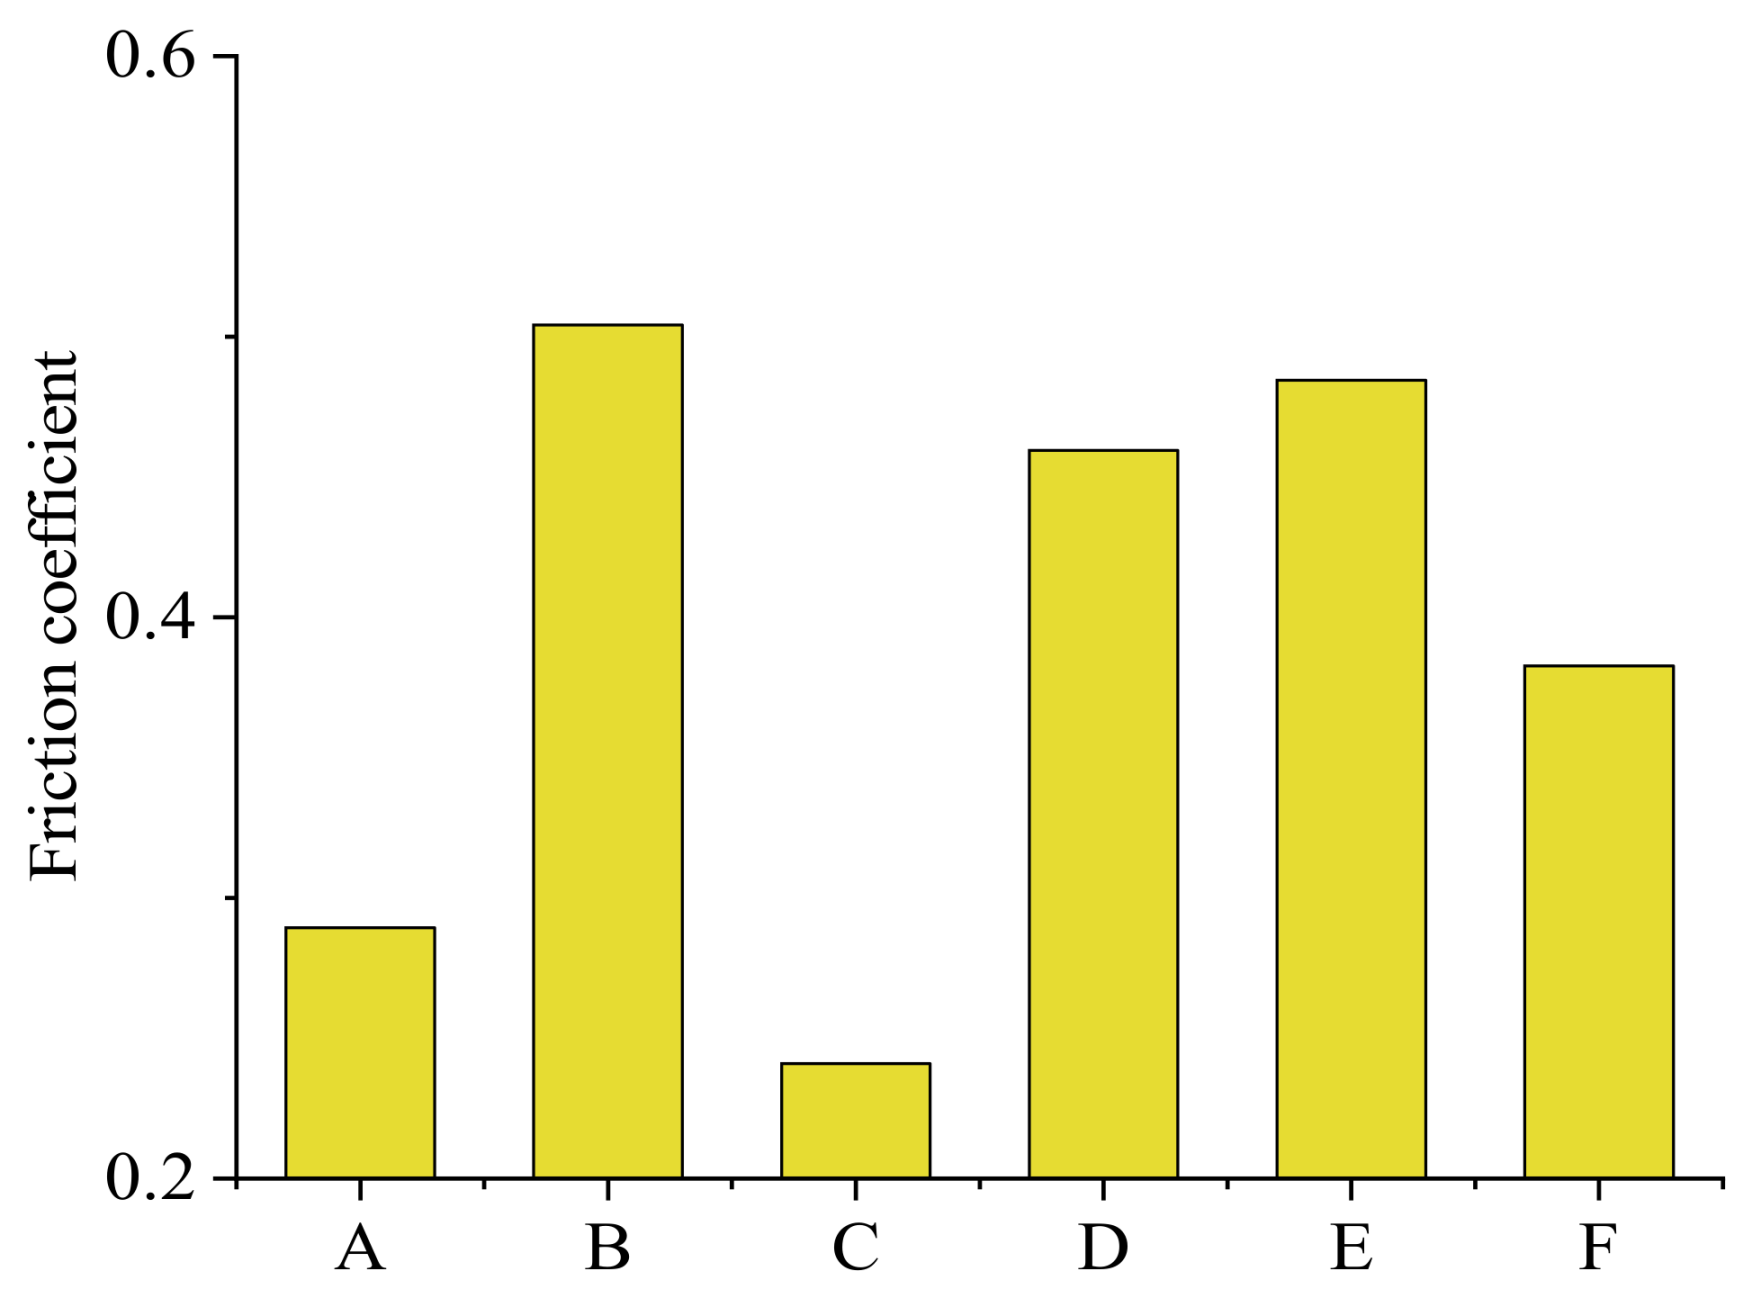
The friction coefficient and wear rates of the six kinds of calcined bauxite were obtained using a friction-wear testing machine; then, the abrasion resistance was calculated using Equation (1). The calculation results showed that the abrasion resistance of bauxite clinker decreased from high to low in the order C > D > F > E > A > B (see Figure 7), and their respective friction coefficients ranged from small to large in the order C < F < D < E < B (see Figure 8). Therefore, these results revealed that there was no direct correlation between an aggregate’s friction coefficient and its wear rate. The friction coefficient describes the lubrication effect of the material, while the wear rate reflects its rate of erosion, which ultimately determines its overall service life. Ideally, anti-skid materials used to prepare road surfaces should exhibit high friction coefficients and good wear resistance, with the values obtained for our aggregates tested indicating that samples D, E, and F were the most appropriate calcined bauxite materials for road surface applications.
3.2. Nano-Hardness Test Results
3.2.1. Determination of Average Hardness
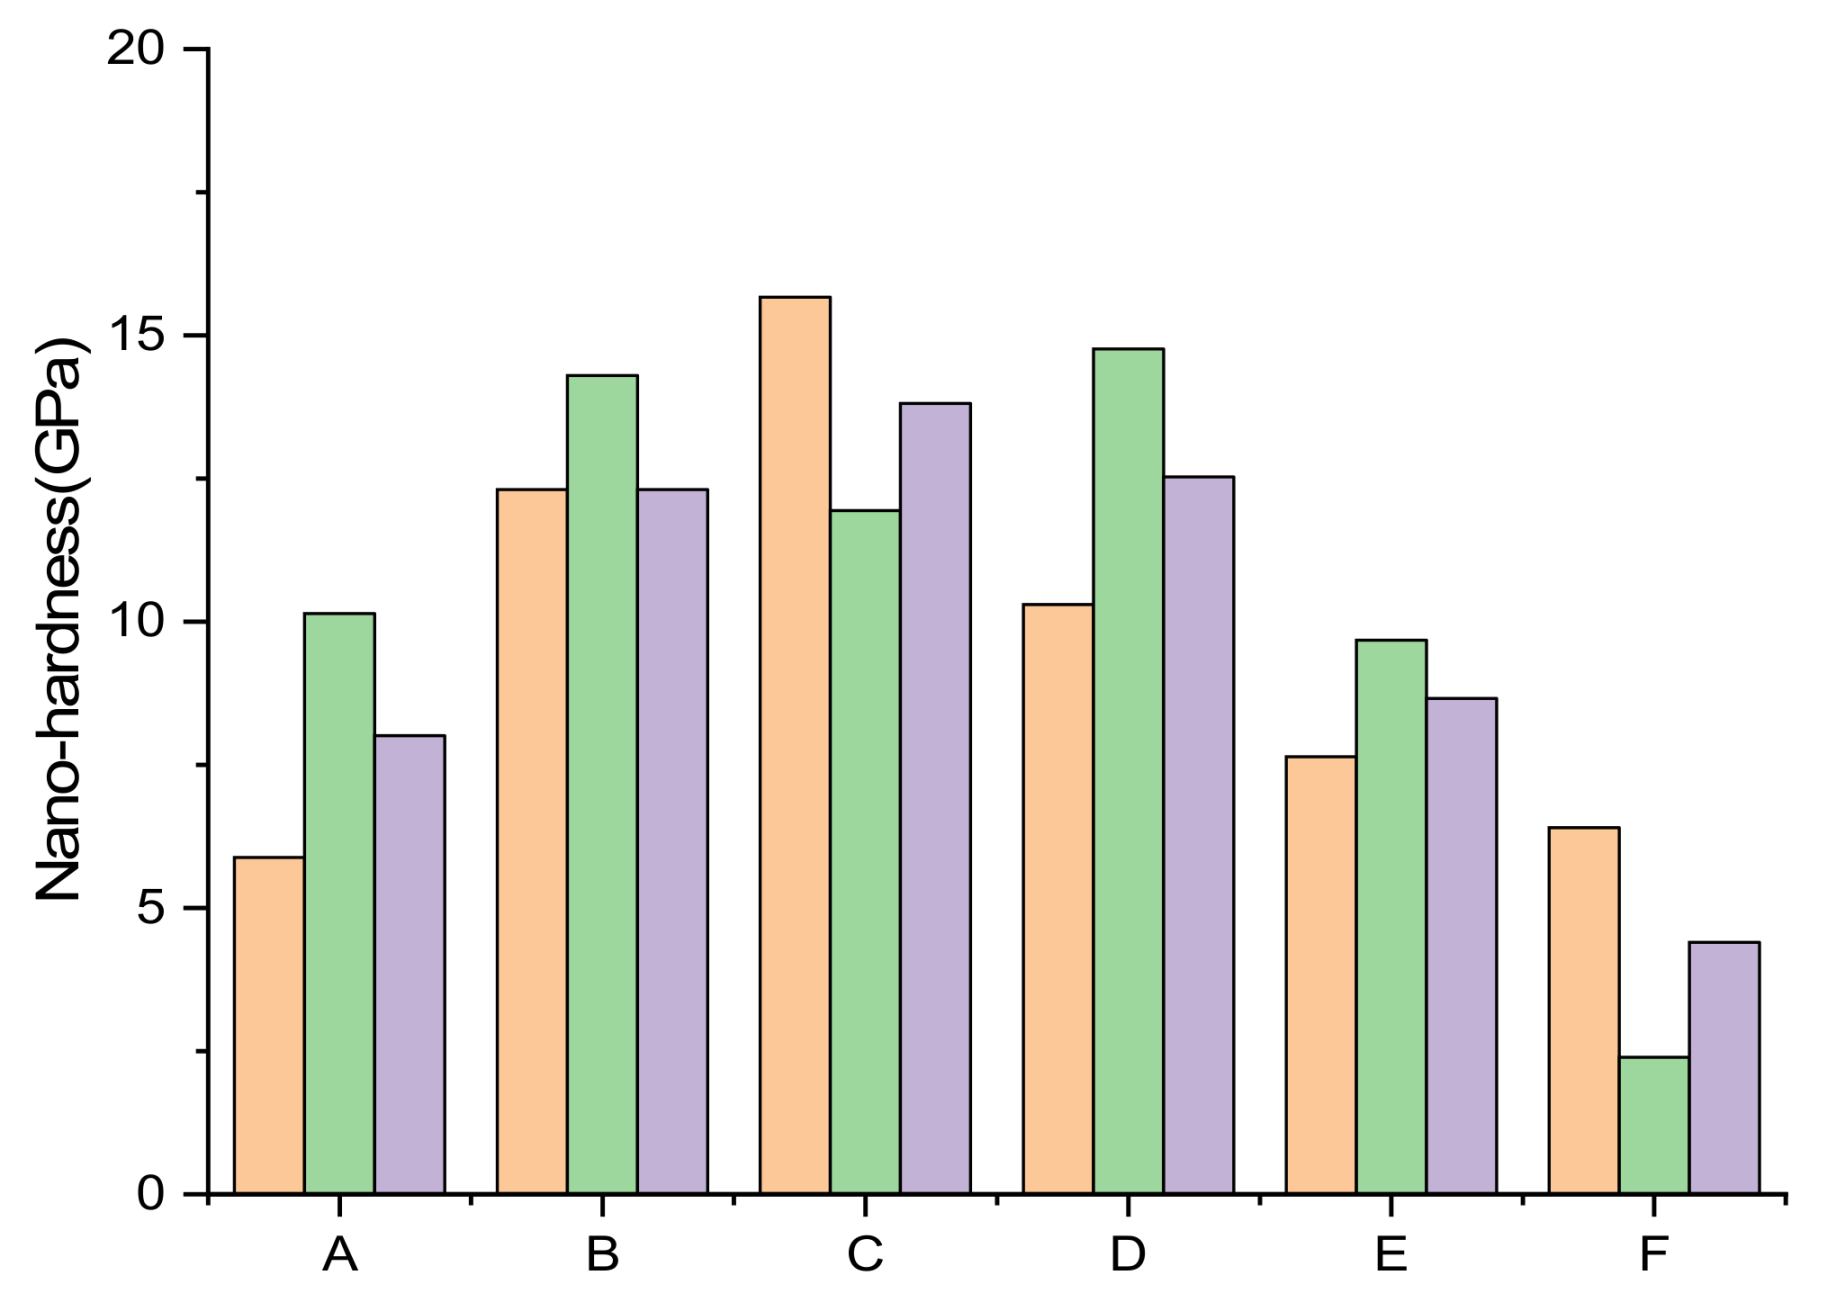
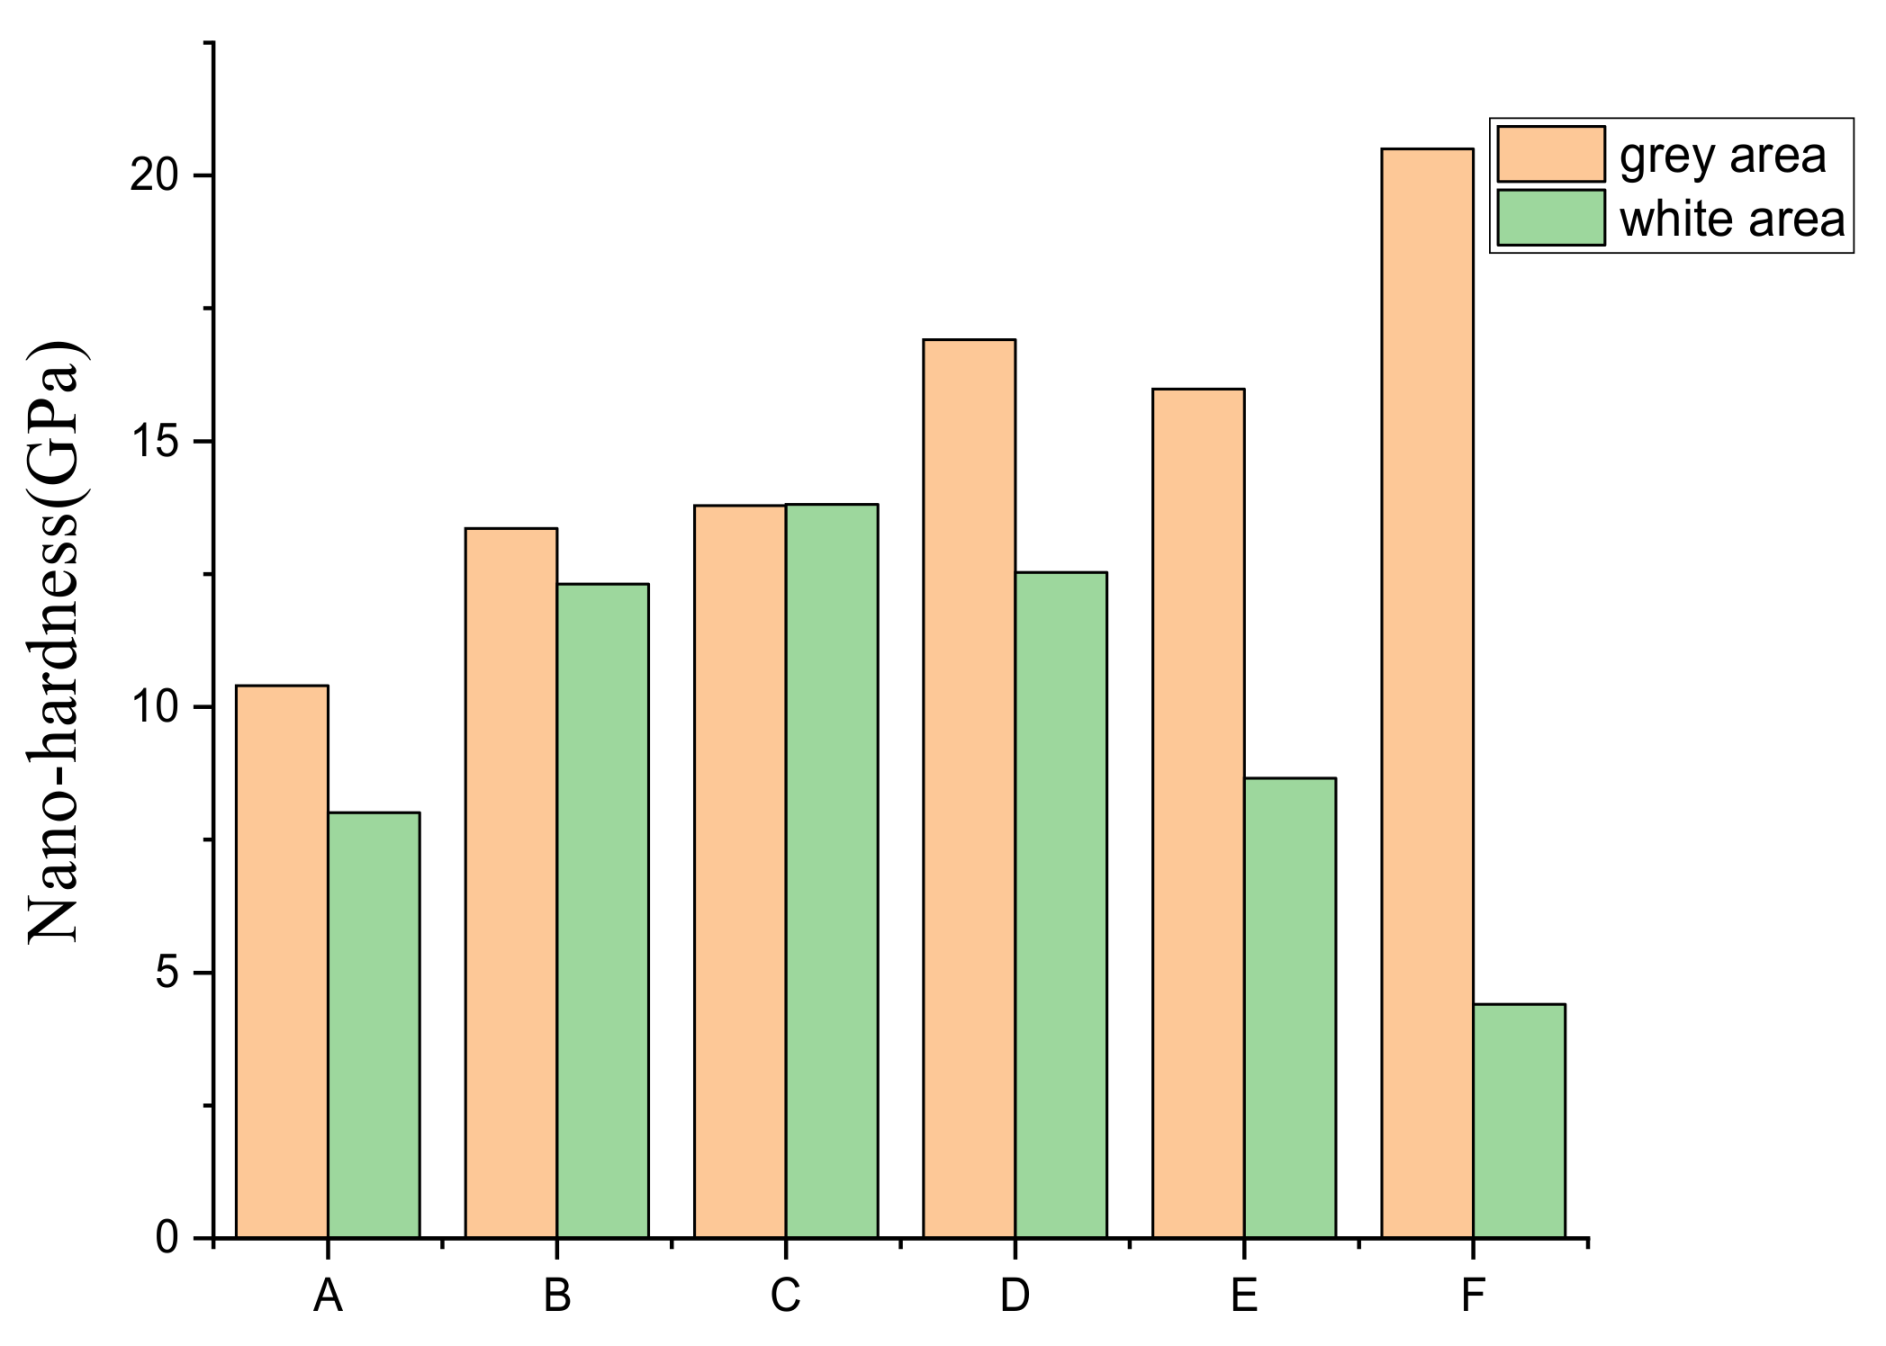
Because the hardness in the black areas was sufficient to produce discrete test results, so the slopes of the curves and the hardness values could not be obtained in these regions. However, the load–displacement curves in the gray and bright-white areas showed a significant regularity.Three test points were selected for each gray area and bright area. The distribution of the measured values is shown in Figure 9 and Figure 10. In the gray area, the hardness of bauxite type A was 10.40 ± 1 GPa, that of type B was 13.36 ± 0.3 GPa, that of type C was 13.79 ± 1 GPa, that of type D was 16.91 ± 1 GPa, and that of type E was 15.98 ± 0.4 GPa. Type F bauxite had a hardness of 20.50 ± 0.6 GPa. In the bright-white areas, the hardness of bauxite type A was 8.01 ± 2 GPa, that of type B was 12.31 ± 3 GPa, that of type C was 13.81 ± 2 GPa, that of type D was 12.53 ± 2.5 GPa, that of type E was 8.66 ± 1 GPa, and that of type F was 4.4 ± 2 GPa. The gray area had a relatively small hardness variation, whereas the hardness in the bright-white area varied much more. The difference in hardness between these two areas was higher for types D, E, and F. This indicates that higher bauxite clinker grades have a greater hardness difference between different areas.
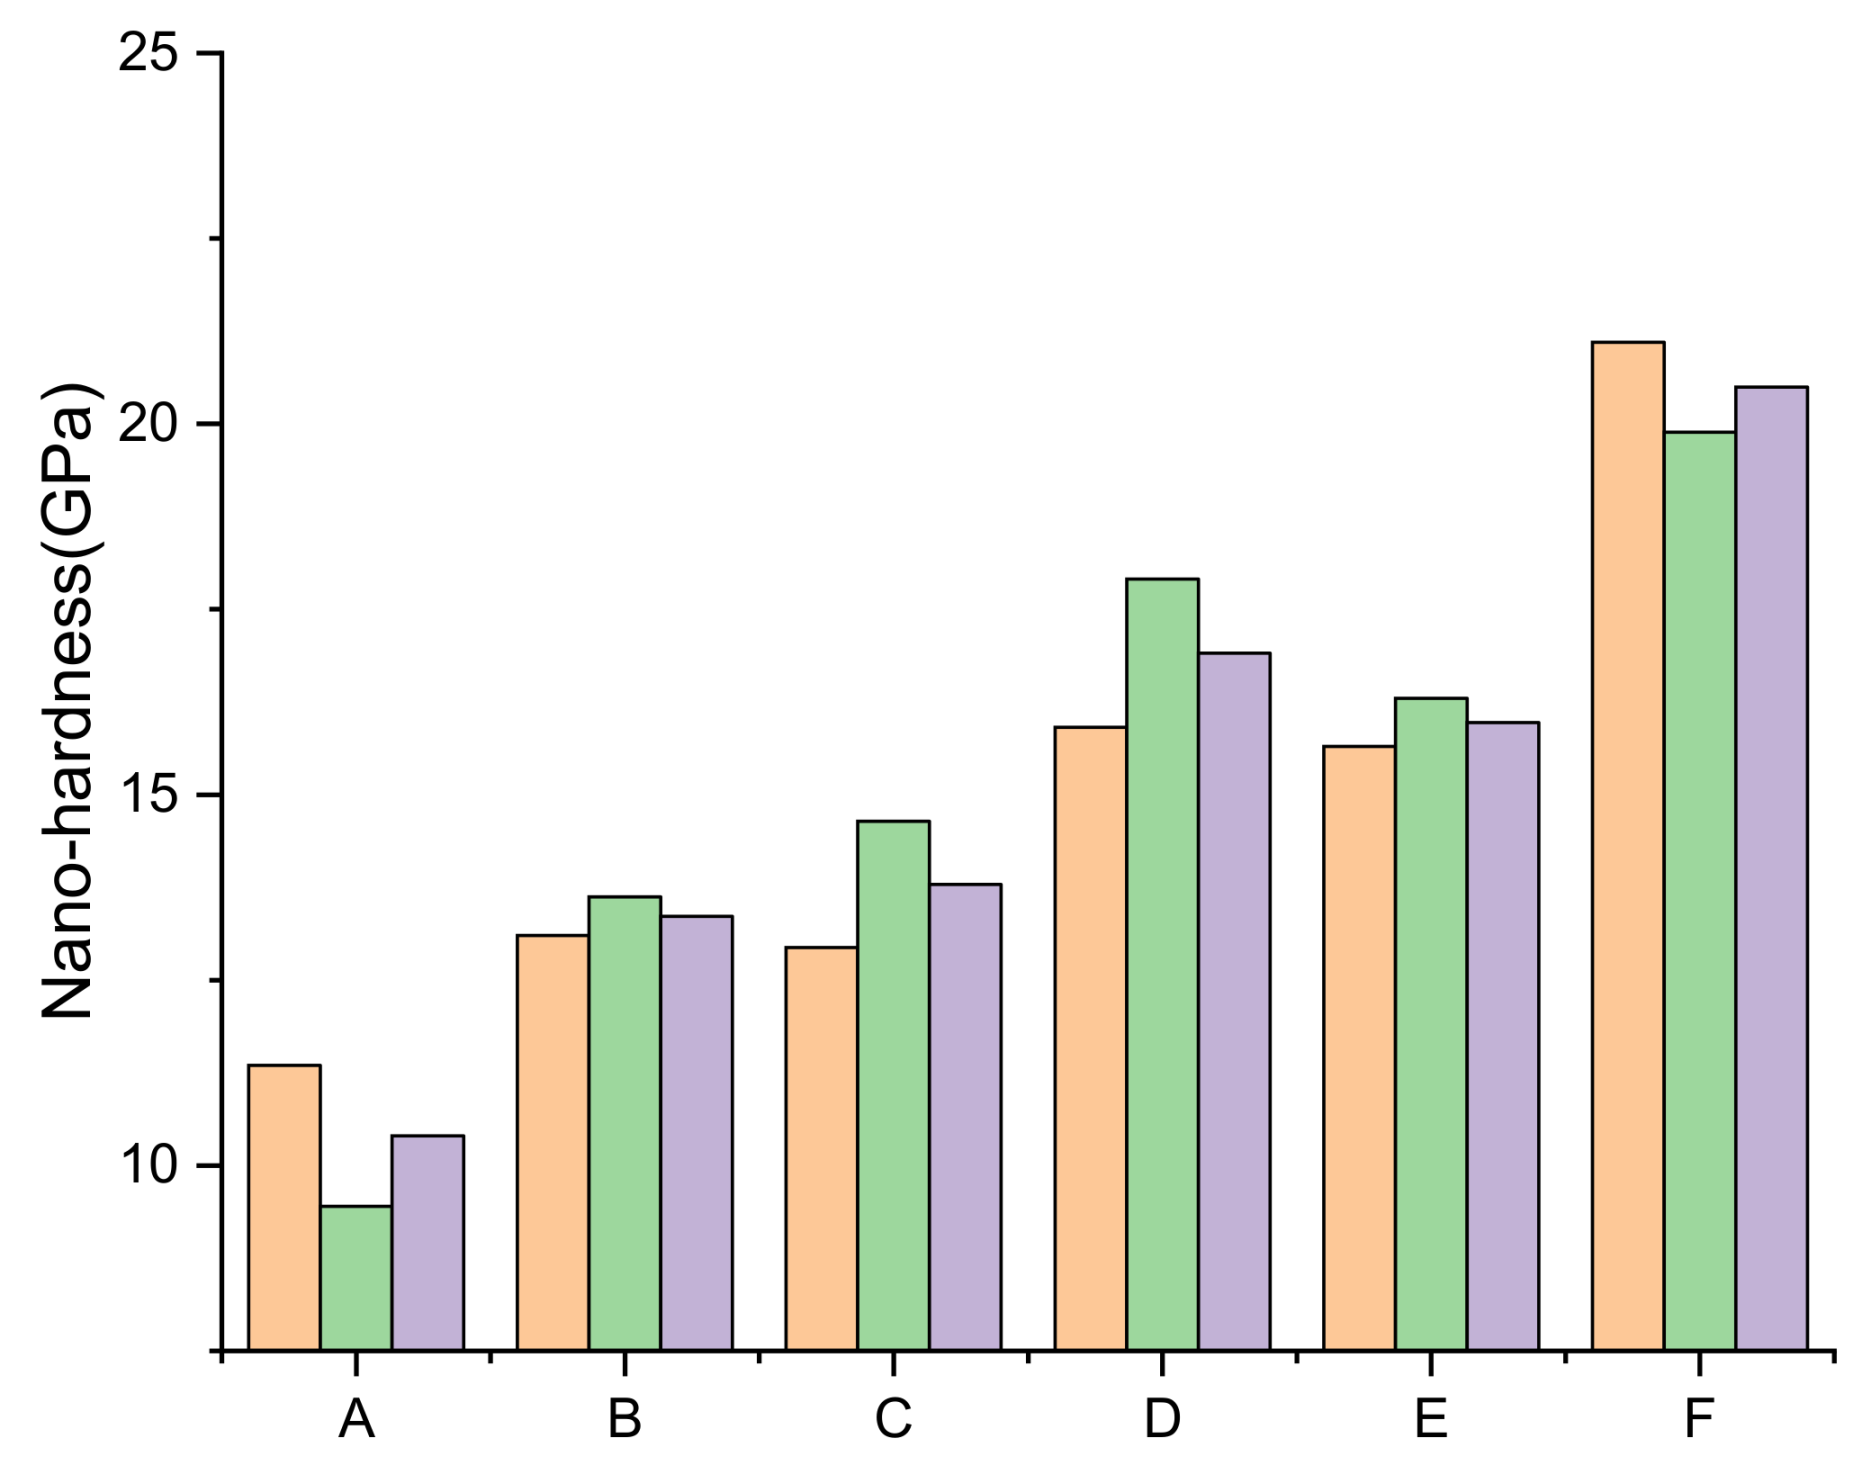
The test data close to the average values were selected as the final result for this area (Figure 11).
Analysis of the phase composition data revealed that the black areas were mainly composed of corundum, the gray areas were mainly composed of fine-grained alumina and mullite, and the small bright-white areas were mainly composed of quartz and aluminum titanate. Each of the calcined bauxites contained different phase proportions, with the hardness test results only reflecting the hardness value of a certain phase, and not representative of the overall hardness of the calcined bauxite sample. Therefore, an average hardness value (Hnm) was used to describe the overall hardness of the calcined bauxites, the values of which were calculated using Equation (3) [20].
where Hnm is the average hardness, hi is the hardness value of a certain phase i, and pi is the mass percentage of phase i in the phase composition.
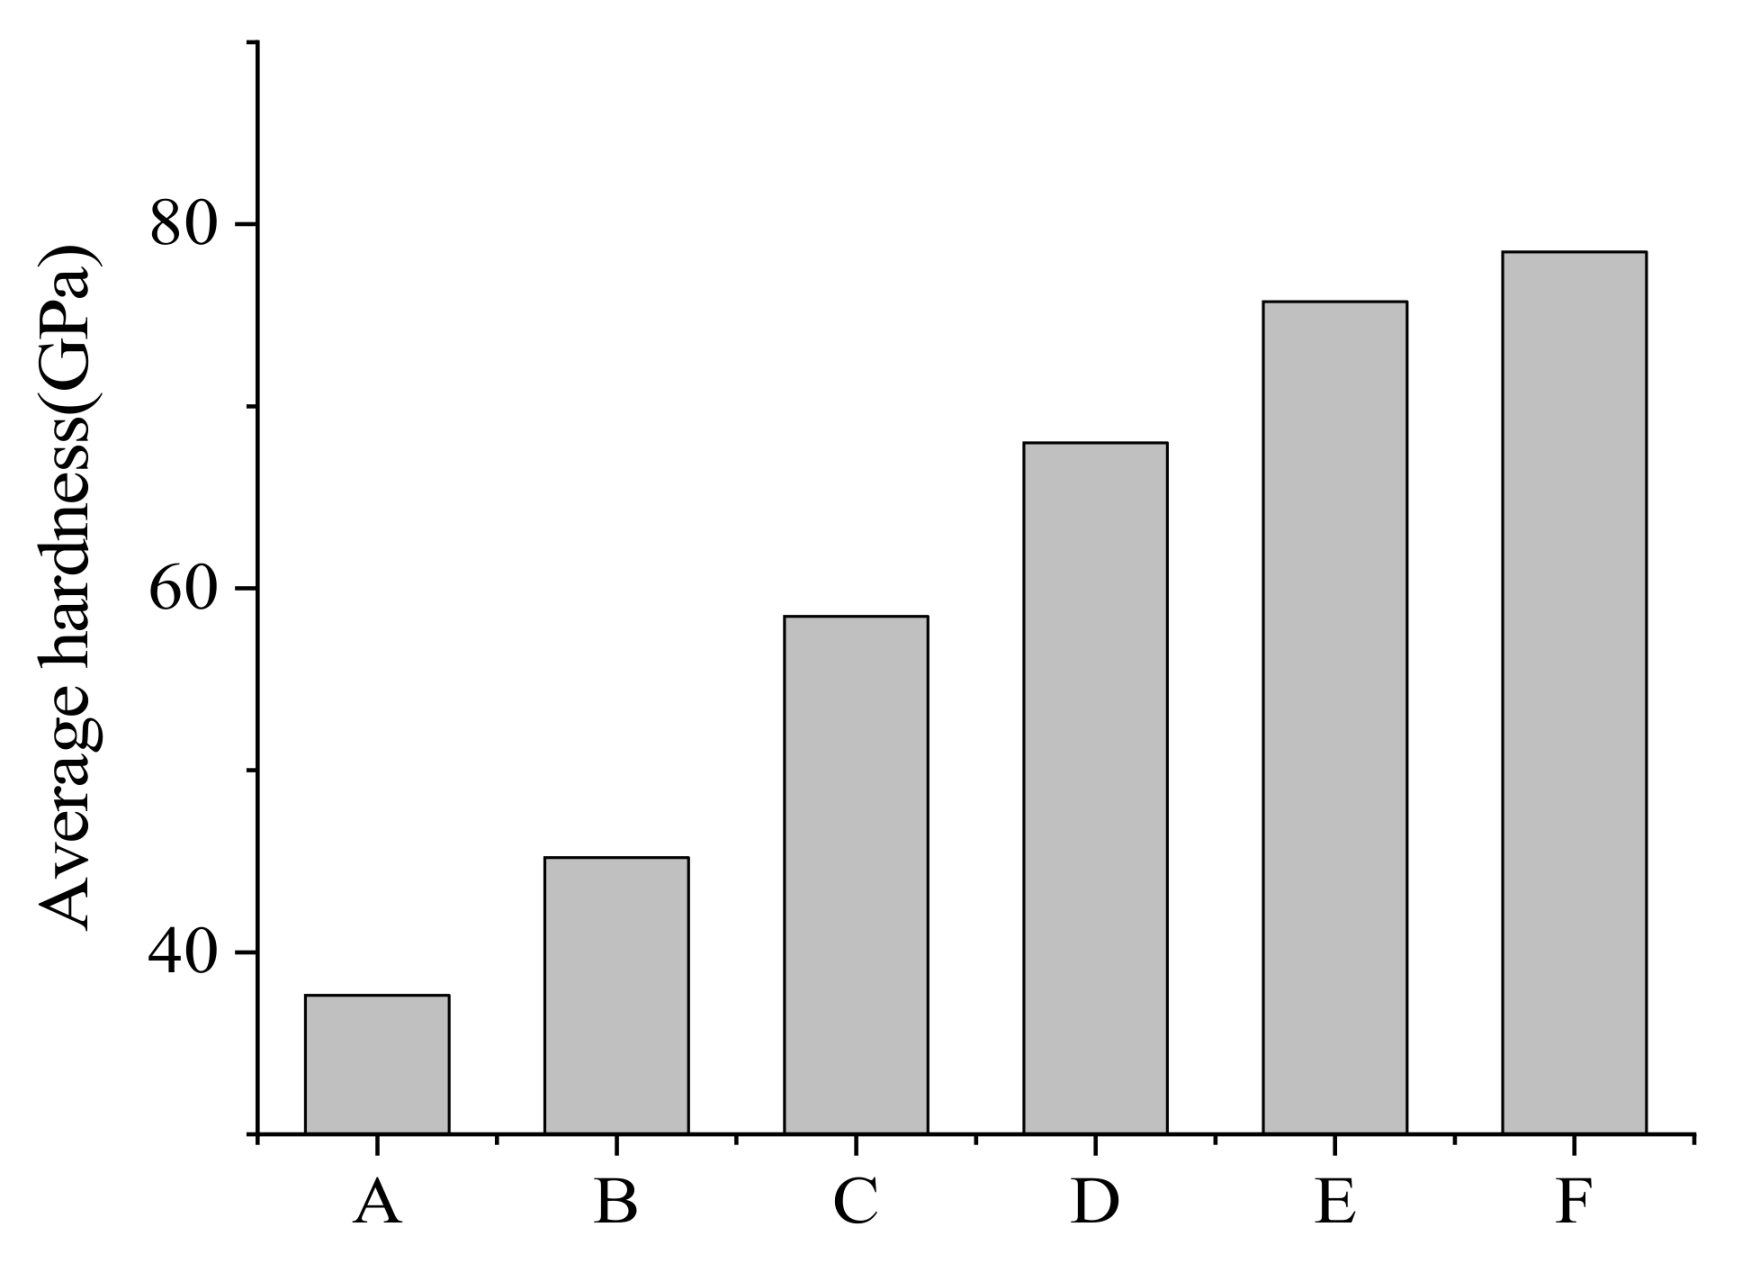
Because the hardness in the black area was too large and the test results were relatively discrete, the nano-hardness value of the black area was assumed to be 100 GPa [21], with calculated average hardness values of the calcined bauxite samples then determined according to the proportion of each phase present (see Figure 12).
According to these test results, the hardness of the six types of calcined bauxite could be classified as F > E > D > C > B > A.
3.2.2. Determination of Hardness Dispersion Values
The hardness dispersion value reflects the degree of hardness dispersion, i.e., the hardness uniformity of mineral rock and the adaptability of processing technology [19]. The different phase compositions of calcined bauxite result in large differences in hardness uniformity throughout the calcined bauxite; thus, it is necessary to consider each sample’s hardness dispersion when considering the influence of hardness on their wear resistance performance, the values of which can be calculated using Equation (4).
where Snm is the dispersion of nano-hardness in GPa, Hnm is the average nano-hardness, Hnmi is the nano-hardness of phase i, and pi is the overall mass percentage of a certain phase i in the phase composition.
The hardness dispersion results of the calcined bauxite samples that were calculated using Equation (4) are shown in Table 3.
3.3. Determination of Young’s Modulus
3.3.1. Young’s Modulus of the Different Phases
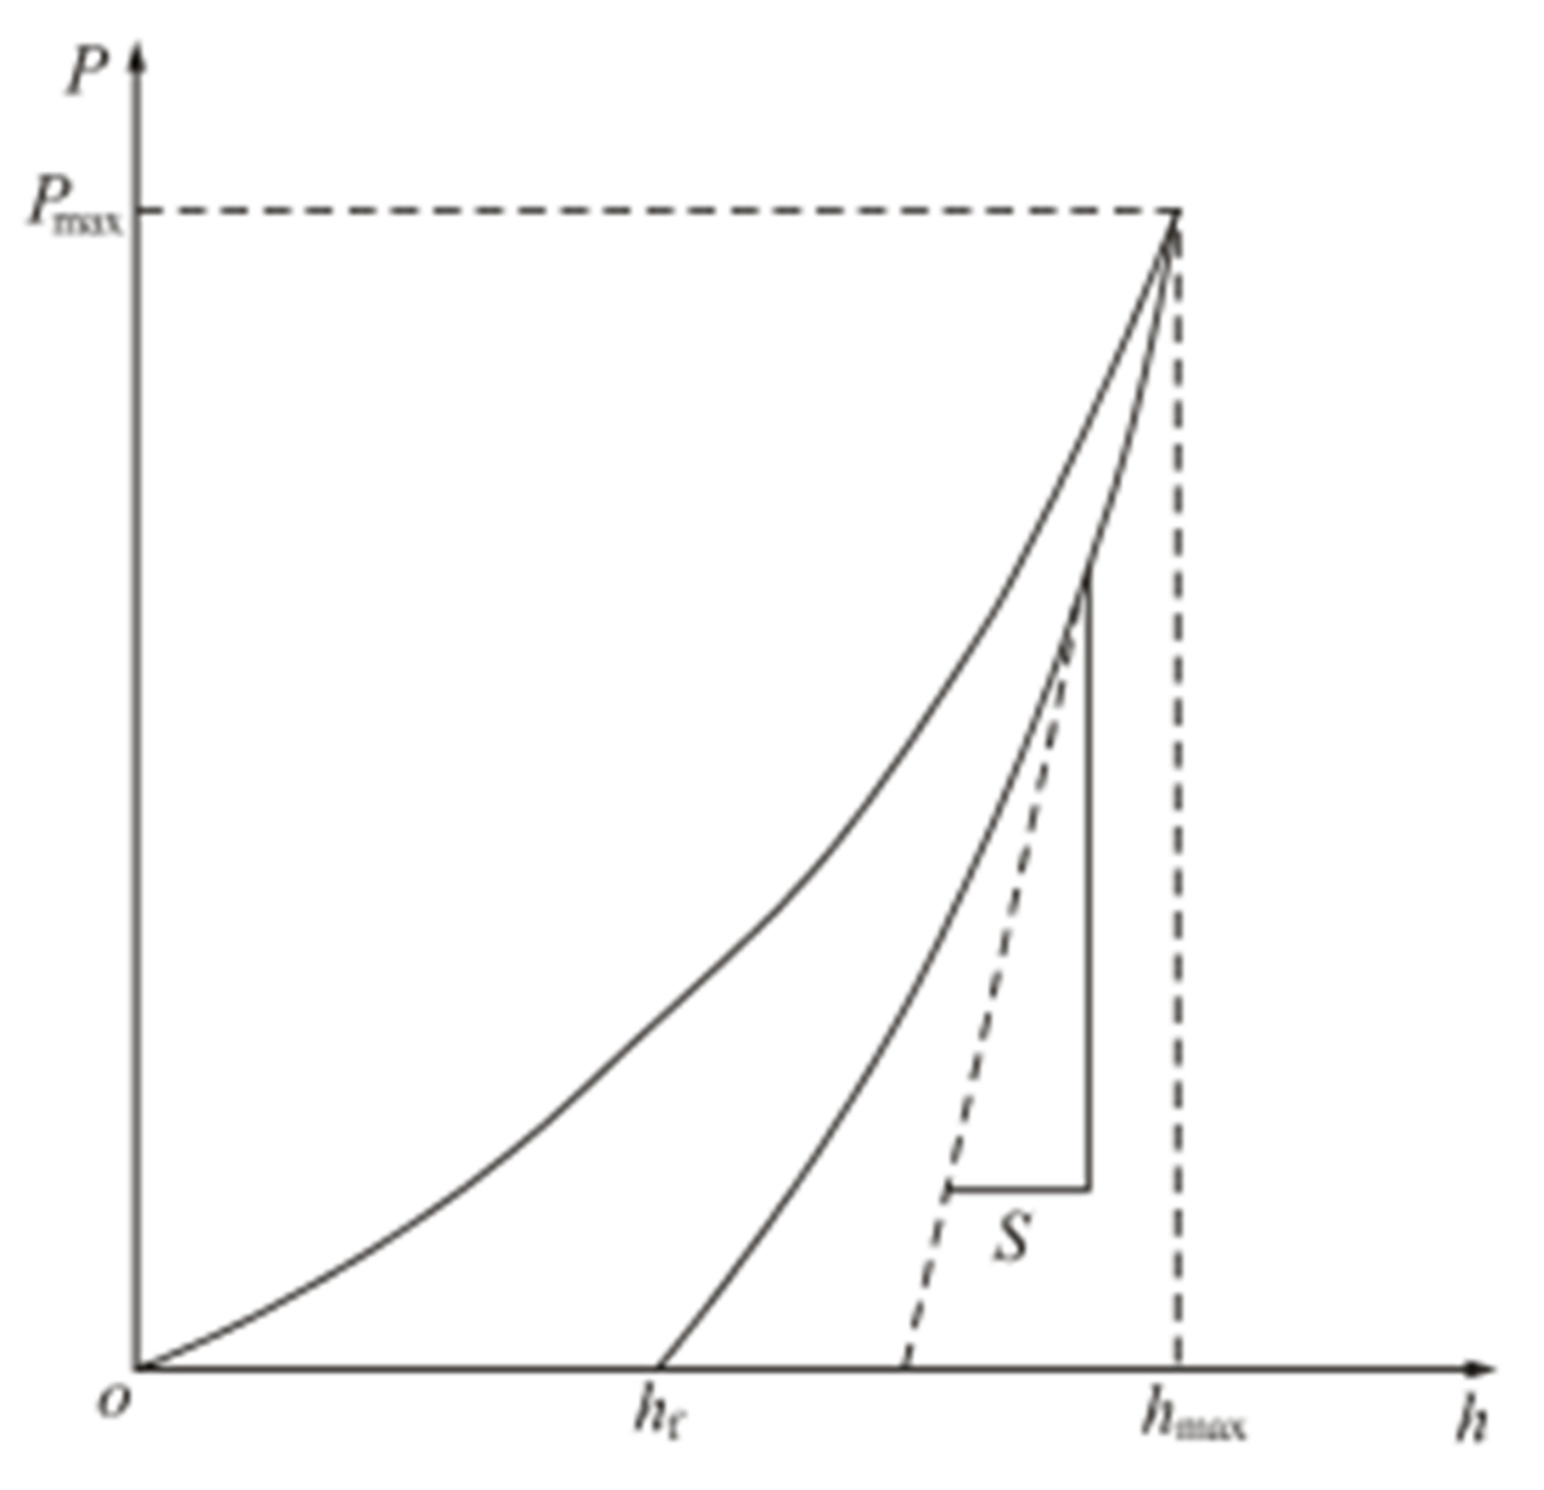
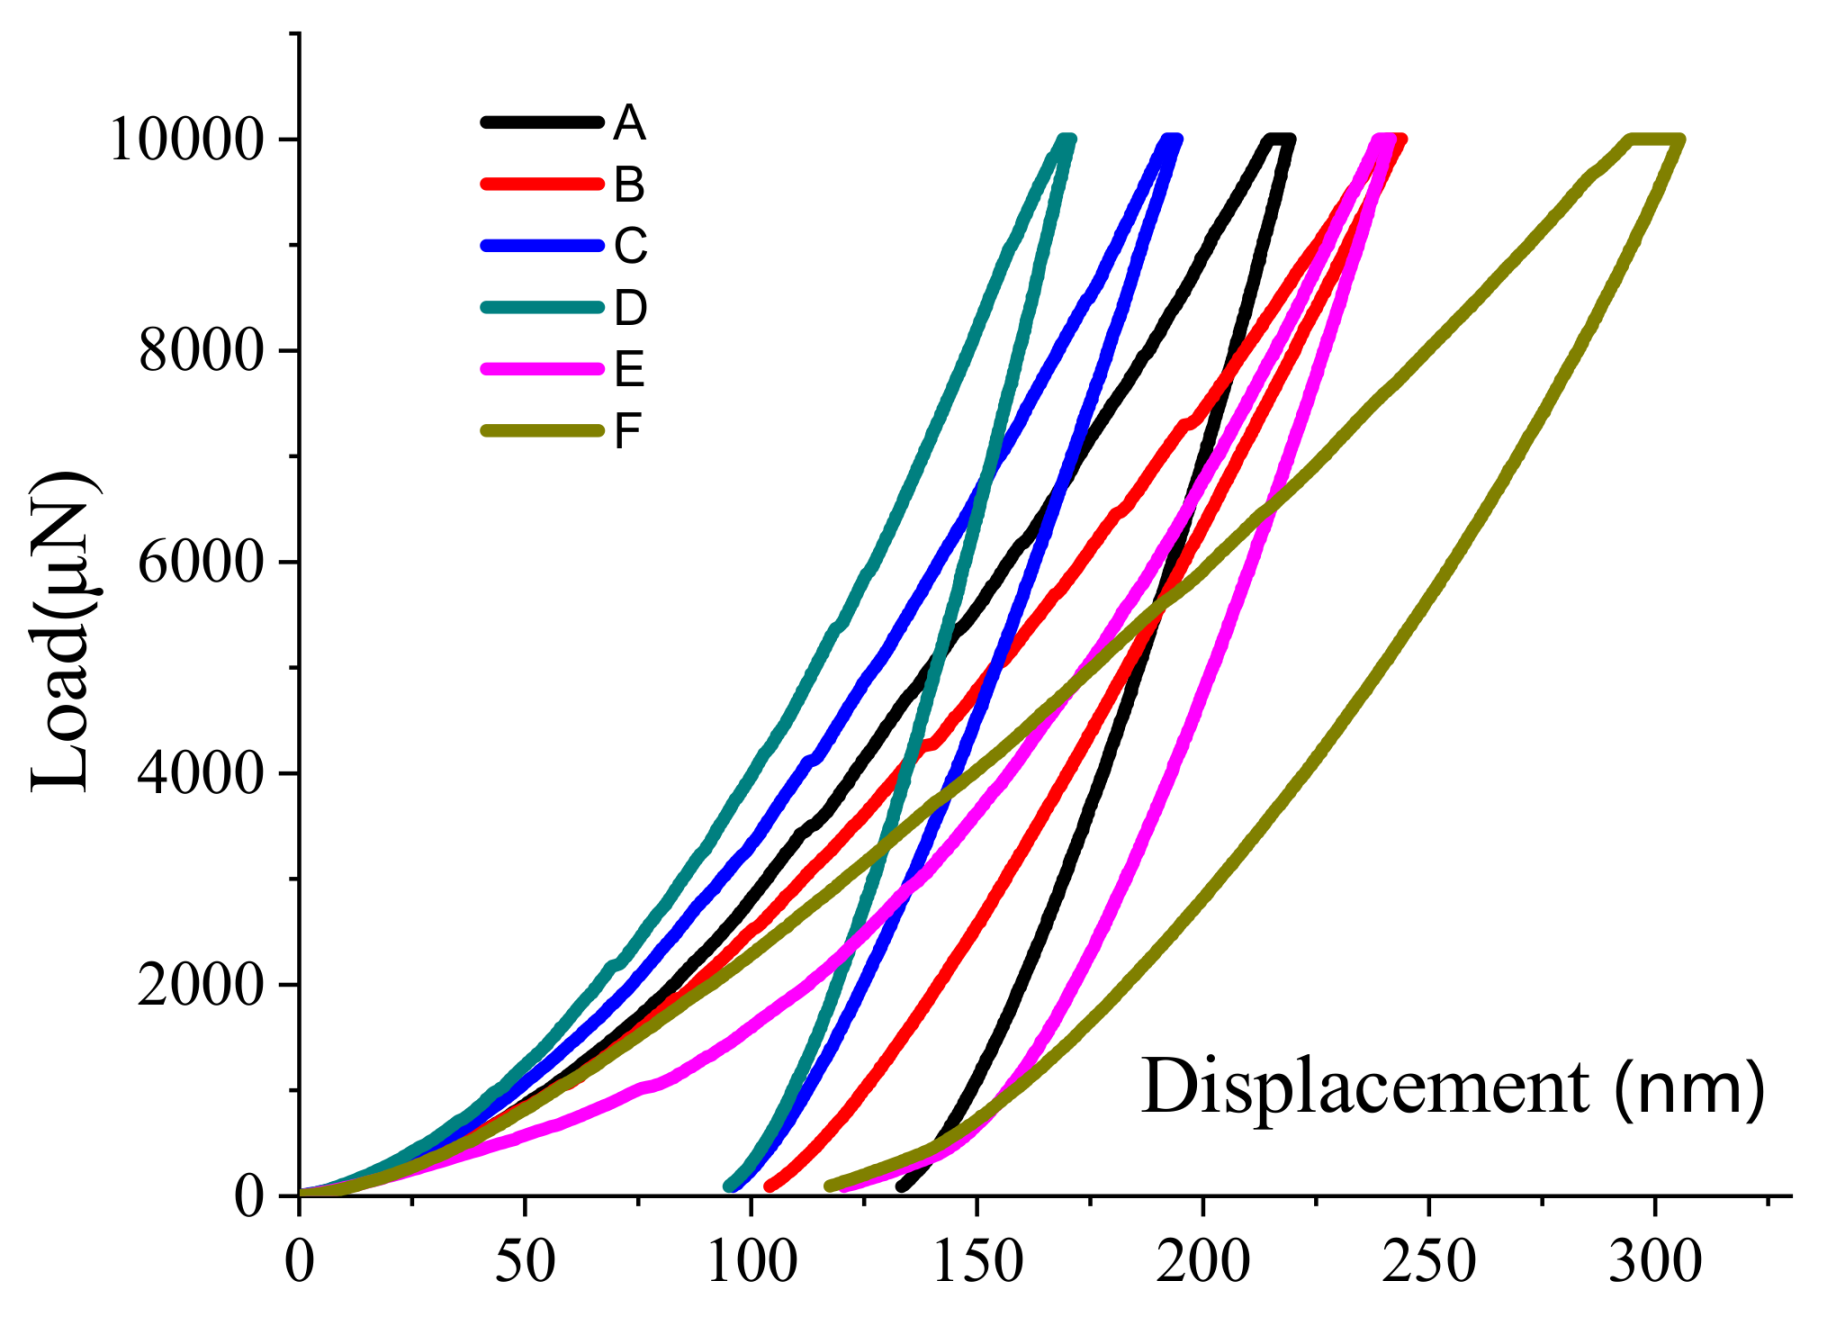
Young’s modulus values describe the tendency of an object to deform along an axis when opposing forces are applied along that axis, with this term used as an indicator of the deformation resistance of a material. Figure 13 shows the load–displacement curve. The Young’s modulus value (Er) of a material is the ratio of positive tensile stress to tensile strain, which can be calculated using Equation (5) [22,23].
where S is the slope at the top of the unloading curve, A is the contact area, Er is the reduced elastic modulus, and β is a coefficient related to the head geometry.
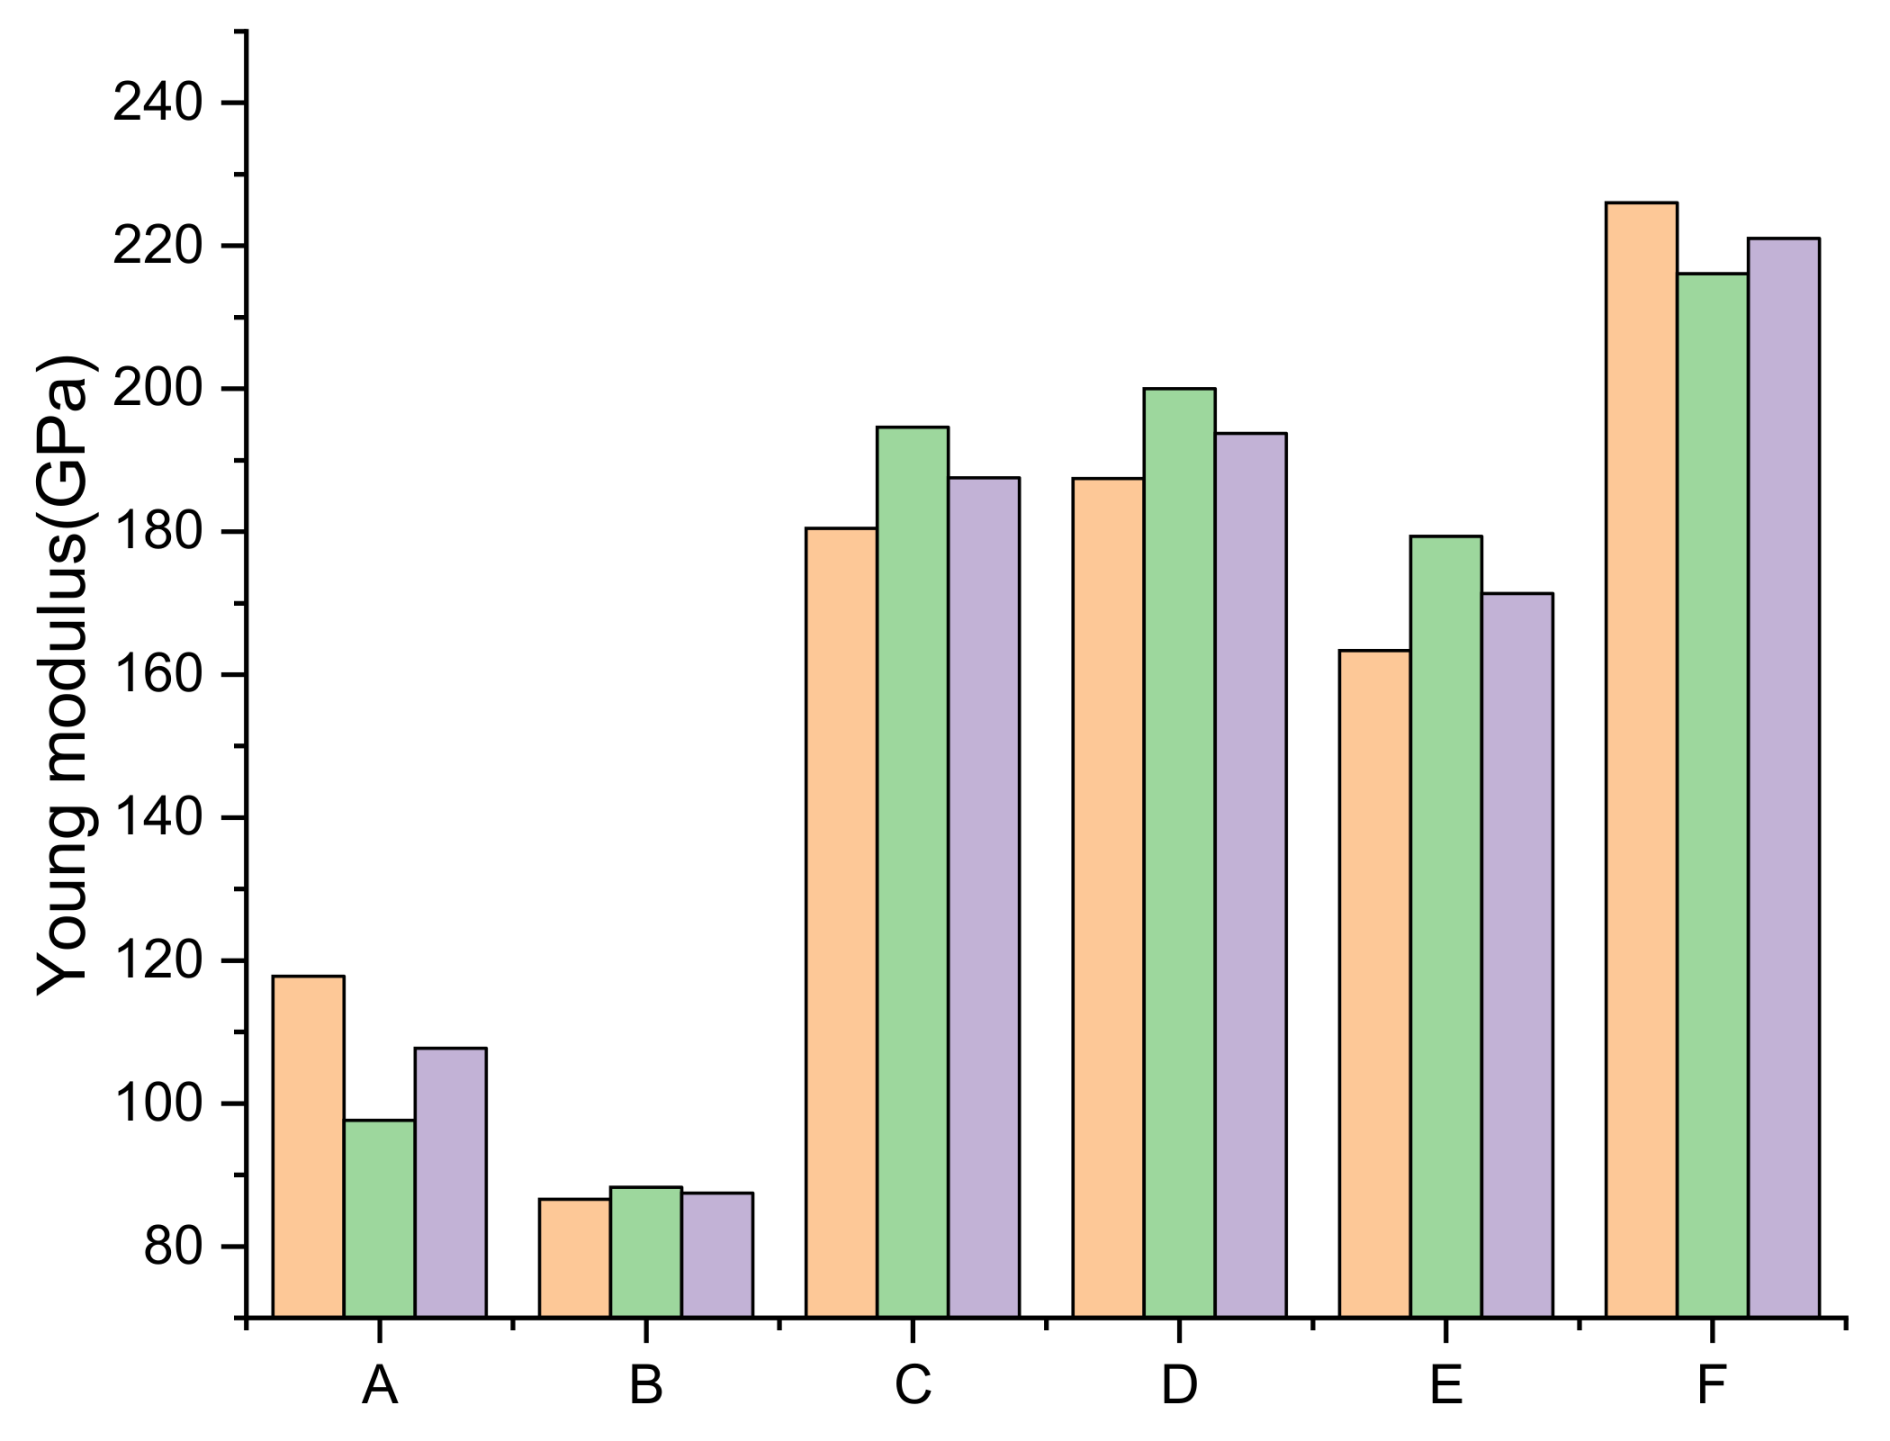
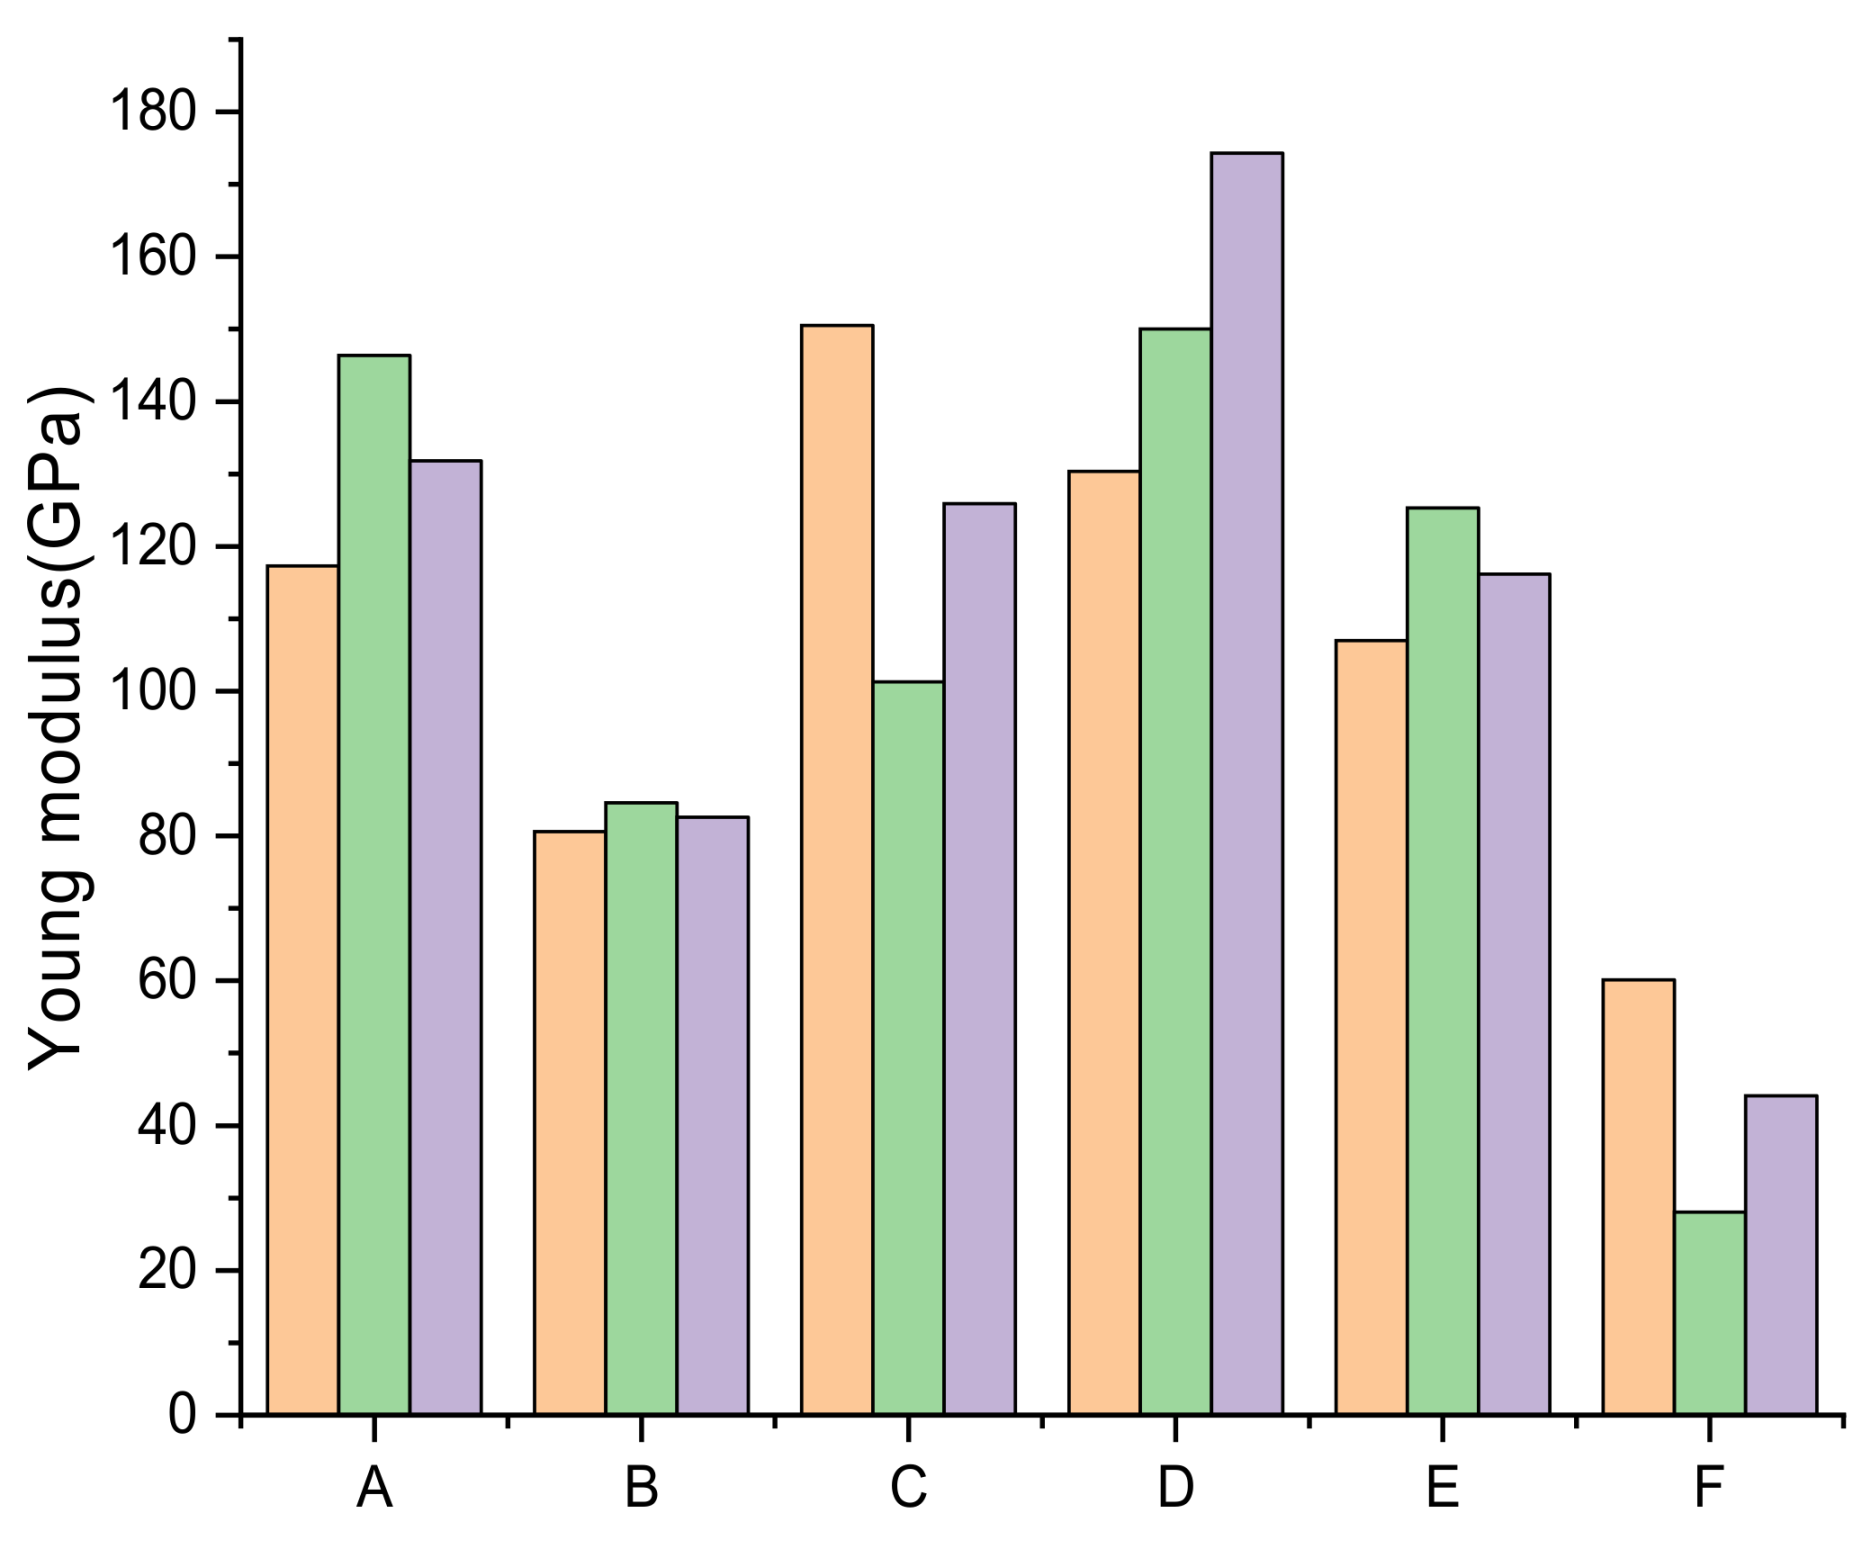
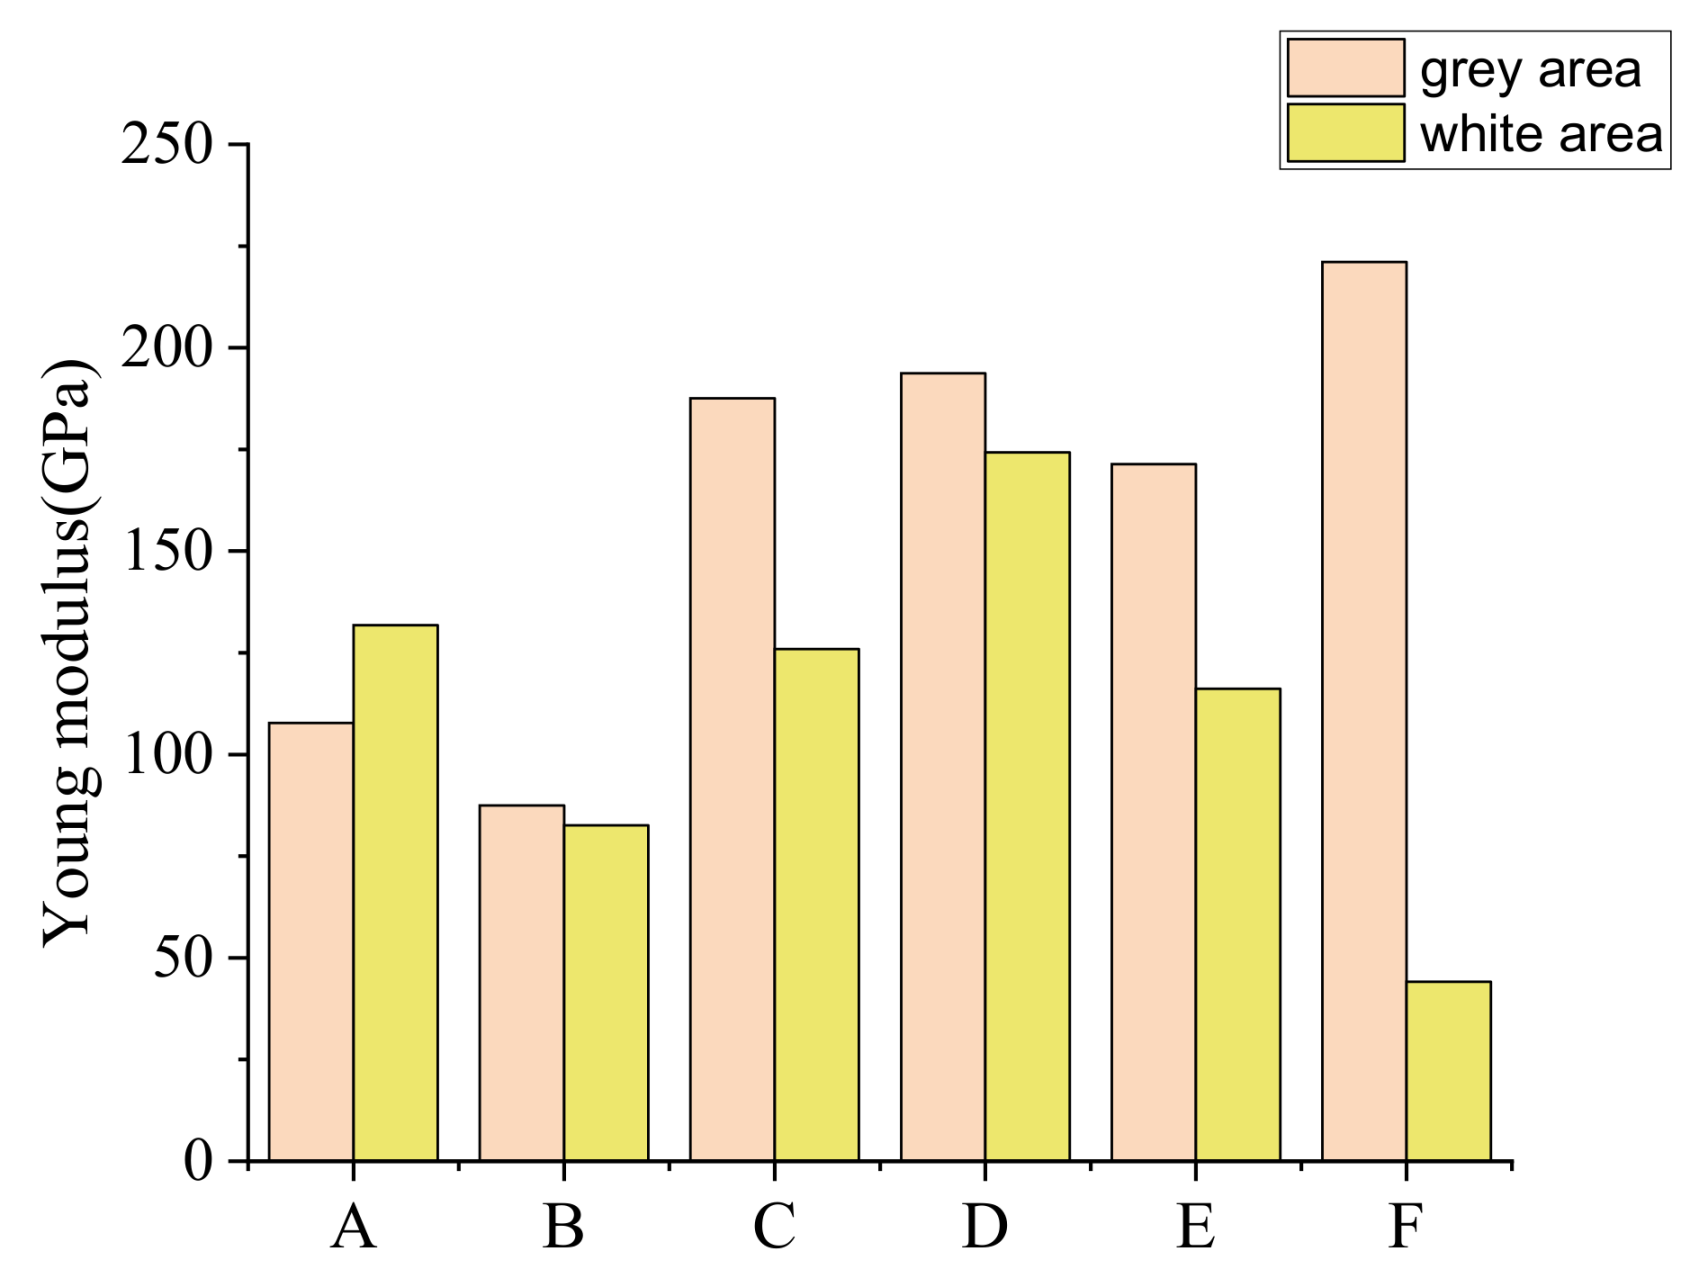
Three test points were selected for each gray area and bright area. The distribution of the measured values is shown in Figure 14 and Figure 15. In the gray area, the Young’s modulus of bauxite type A was 107.72 ± 10 GPa, that of type B was 87.46 ± 1 GPa, that of type C was 187.54 ± 7 GPa, that of type D was 193.73± 6 GPa, and that of type E was 171.35 ± 8GPa. Type F bauxite had a Young’s modulus of 221.06 ± 5 GPa. In the bright-white areas, the Young’s modulus of bauxite type A was 131.82± 15 GPa, that of type B was 82.6 ± 2 GPa, that of type C was 125.9± 25 GPa, that of type D was 174.3± 40 GPa, that of type E was 116.15± 10 GPa, and that of type F was 44.11 ± 16 GPa. The gray area had a relatively small Young’s modulus variation, whereas the Young’s modulus in the bright-white area varied much more. The difference in Young’s modulus between these two areas was higher for types D, E, and F. This indicates that higher bauxite clinker grades have a greater Young’s modulus difference between different areas.
The test data close to the average values were selected as the final result for this area (Figure 16).
The Young’s modulus value of a material describes its elastic deformation properties, whilst hardness values describe the material’s ability to undergo plastic deformation, with both values important in describing its overall mechanical properties when subjected to strain. Application of a small force to a material will result in a linear force–deformation relationship, the slope of which is determined by its Young’s modulus. However, larger forces result in non-linear stress deformation that can result in irreversible plastic deformation of the material. The hardness value of any material is a good indicator of its ability to resist plastic deformation, with a harder material less likely to undergo plastic deformation. The Young’s modulus and hardness in the gray areas were relatively large, with the corresponding values in the bright-white areas relatively small, meaning that the mechanical properties of the gray areas were more optimal than those of the bright white areas.
3.3.2. Homogenization Model for Equivalent Young’s Modulus
Huang [24] and coworkers evaluated the effect of the presence of pores on the physical properties of inorganic materials using a two-step homogenization method, with their approach applied herein to analyze the properties of the aggregates. Calcined bauxite can be considered to comprise a mixture of corundum, molystone, and mixed quartz phases containing medium-sized pores [24,25]. A two-step homogenization method was used to model the micromechanical properties of each of the components, thus enabling a macro-mechanical model of the whole system to be constructed. The first step of the transformation process was to homogenize the quartz phase and its associated pore structure into a uniform quartz pore medium. The second step was to homogenize the corundum, mullite, and quartz pore medium into a homogeneous material whose physical properties accurately reflected those of calcined bauxite. This homogenization approach enabled the macro-mechanical properties of the different calcined bauxites to be calculated using Equations (6)–(14).
The first calculation steps of the homogenization process were as follows:
where Ehom is the equivalent Young’s modulus, νhom is the equivalent Poisson’s ratio, fr (r = 0, 1) indicates the volume fraction of corundum and mullite in calcined bauxite, kr and μr are bulk modulus and shear modulus terms, respectively, and ks and μs are the bulk modulus and shear modulus of the quartz phase, respectively, with values calculated by Equations (12) and (13), respectively. Additionally, fs is the volume fraction of quartz, is porosity, and the porosity values for quartz were substituted by the porosities of calcined bauxite of different grades in these analyses. and are, respectively, the homogenized bulk modulus and shear modulus.
The test results based on the modulus of the corundum phase proved to be inaccurate; thus, a literature value for the Young’s modulus of the corundum phase of 480 GPa was substituted [26]. The Young’s modulus of mullite was determined as 161 GPa based on the average value of the tested modulus in the gray area. The Young’s modulus of the remaining phase was selected as 112 GPa according to the average value of the tested modulus in the bright-white area.
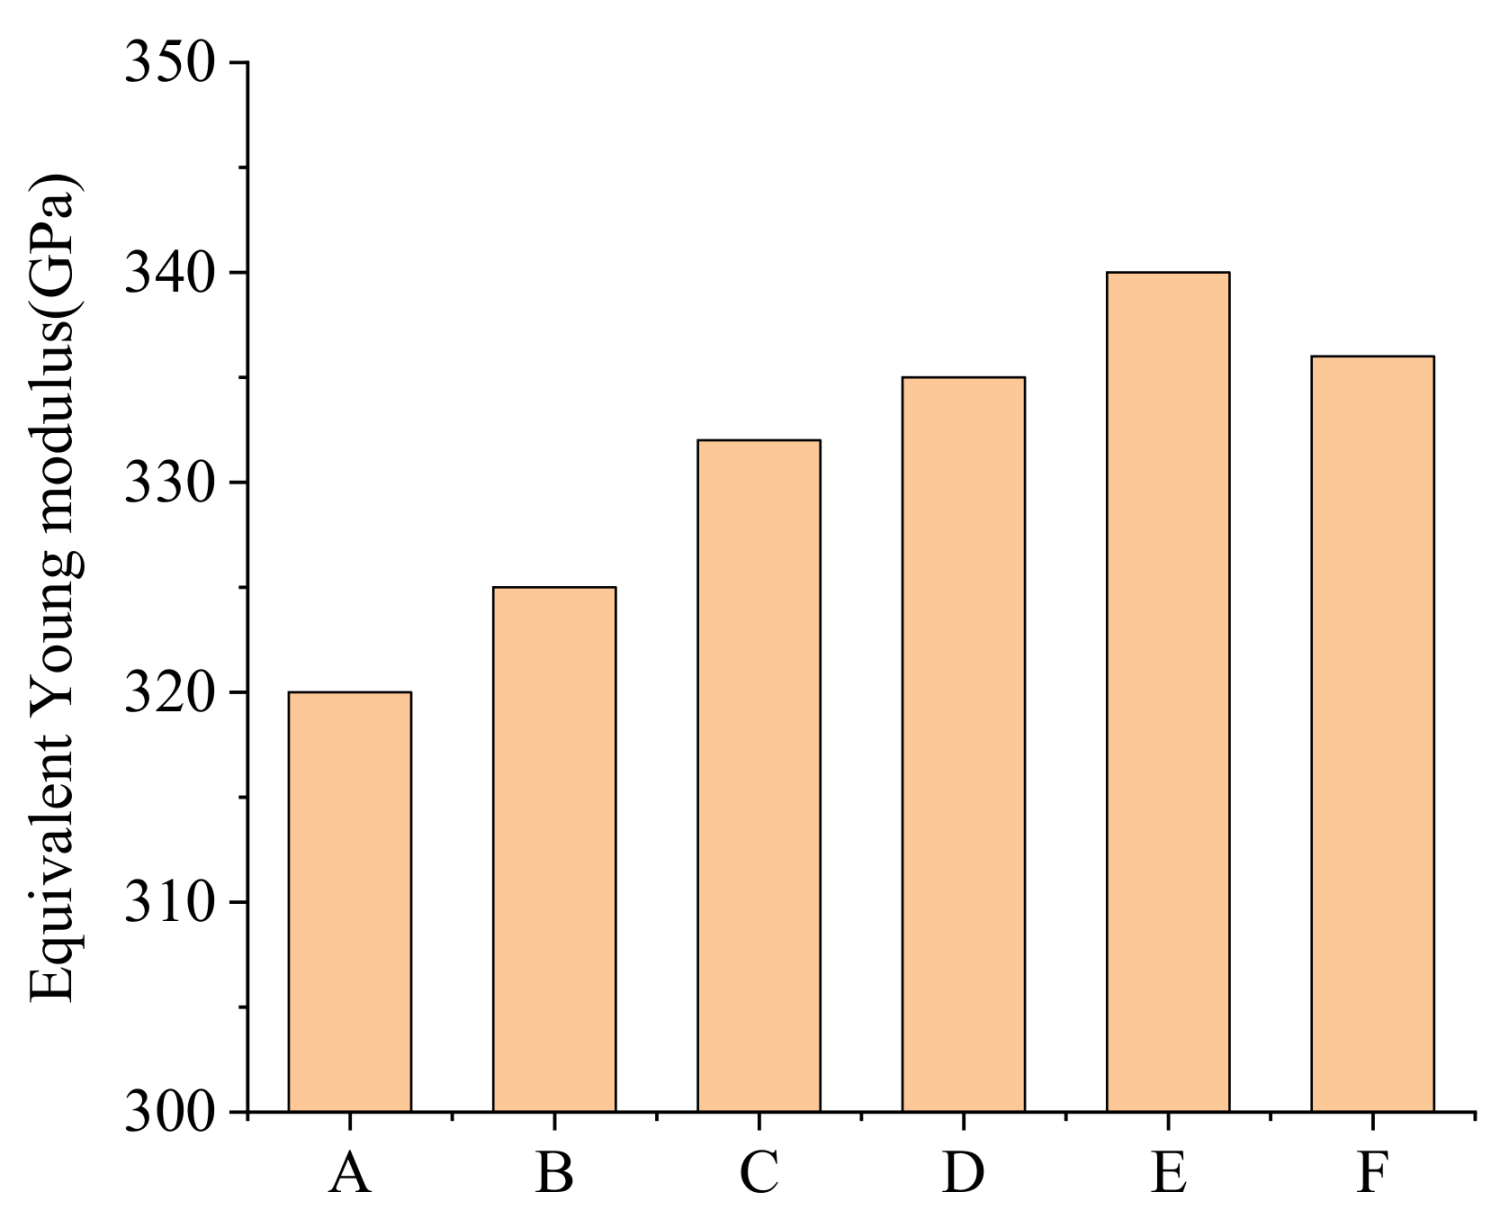
The kr and μr parameters were calculated according to the measured Young’s modulus of Figure 16. The ks and μs parameters for quartz were calculated according to Equations (12) and (13), and the porosity is shown in Figure 2. The fr parameter for r = 0, 1 was the volume fraction of corundum and mullite in the calcined bauxite, and the Poisson ratio was 0.2. Then, we calculated the equivalent Young’s modulus of the six bauxite clinkers. The results are shown in Figure 17. The values firstly increased from A to E, then decreased for the higher grade F because the higher titanium content decreased the Young’s modulus compared to E.
3.3.3. Mechanical Analysis of Nano-Indentation Properties
Indentation curves of the calcined bauxite samples were analyzed and compared, enabling a series of load–displacement curves to be obtained that were used to qualitatively determine their mechanical properties.
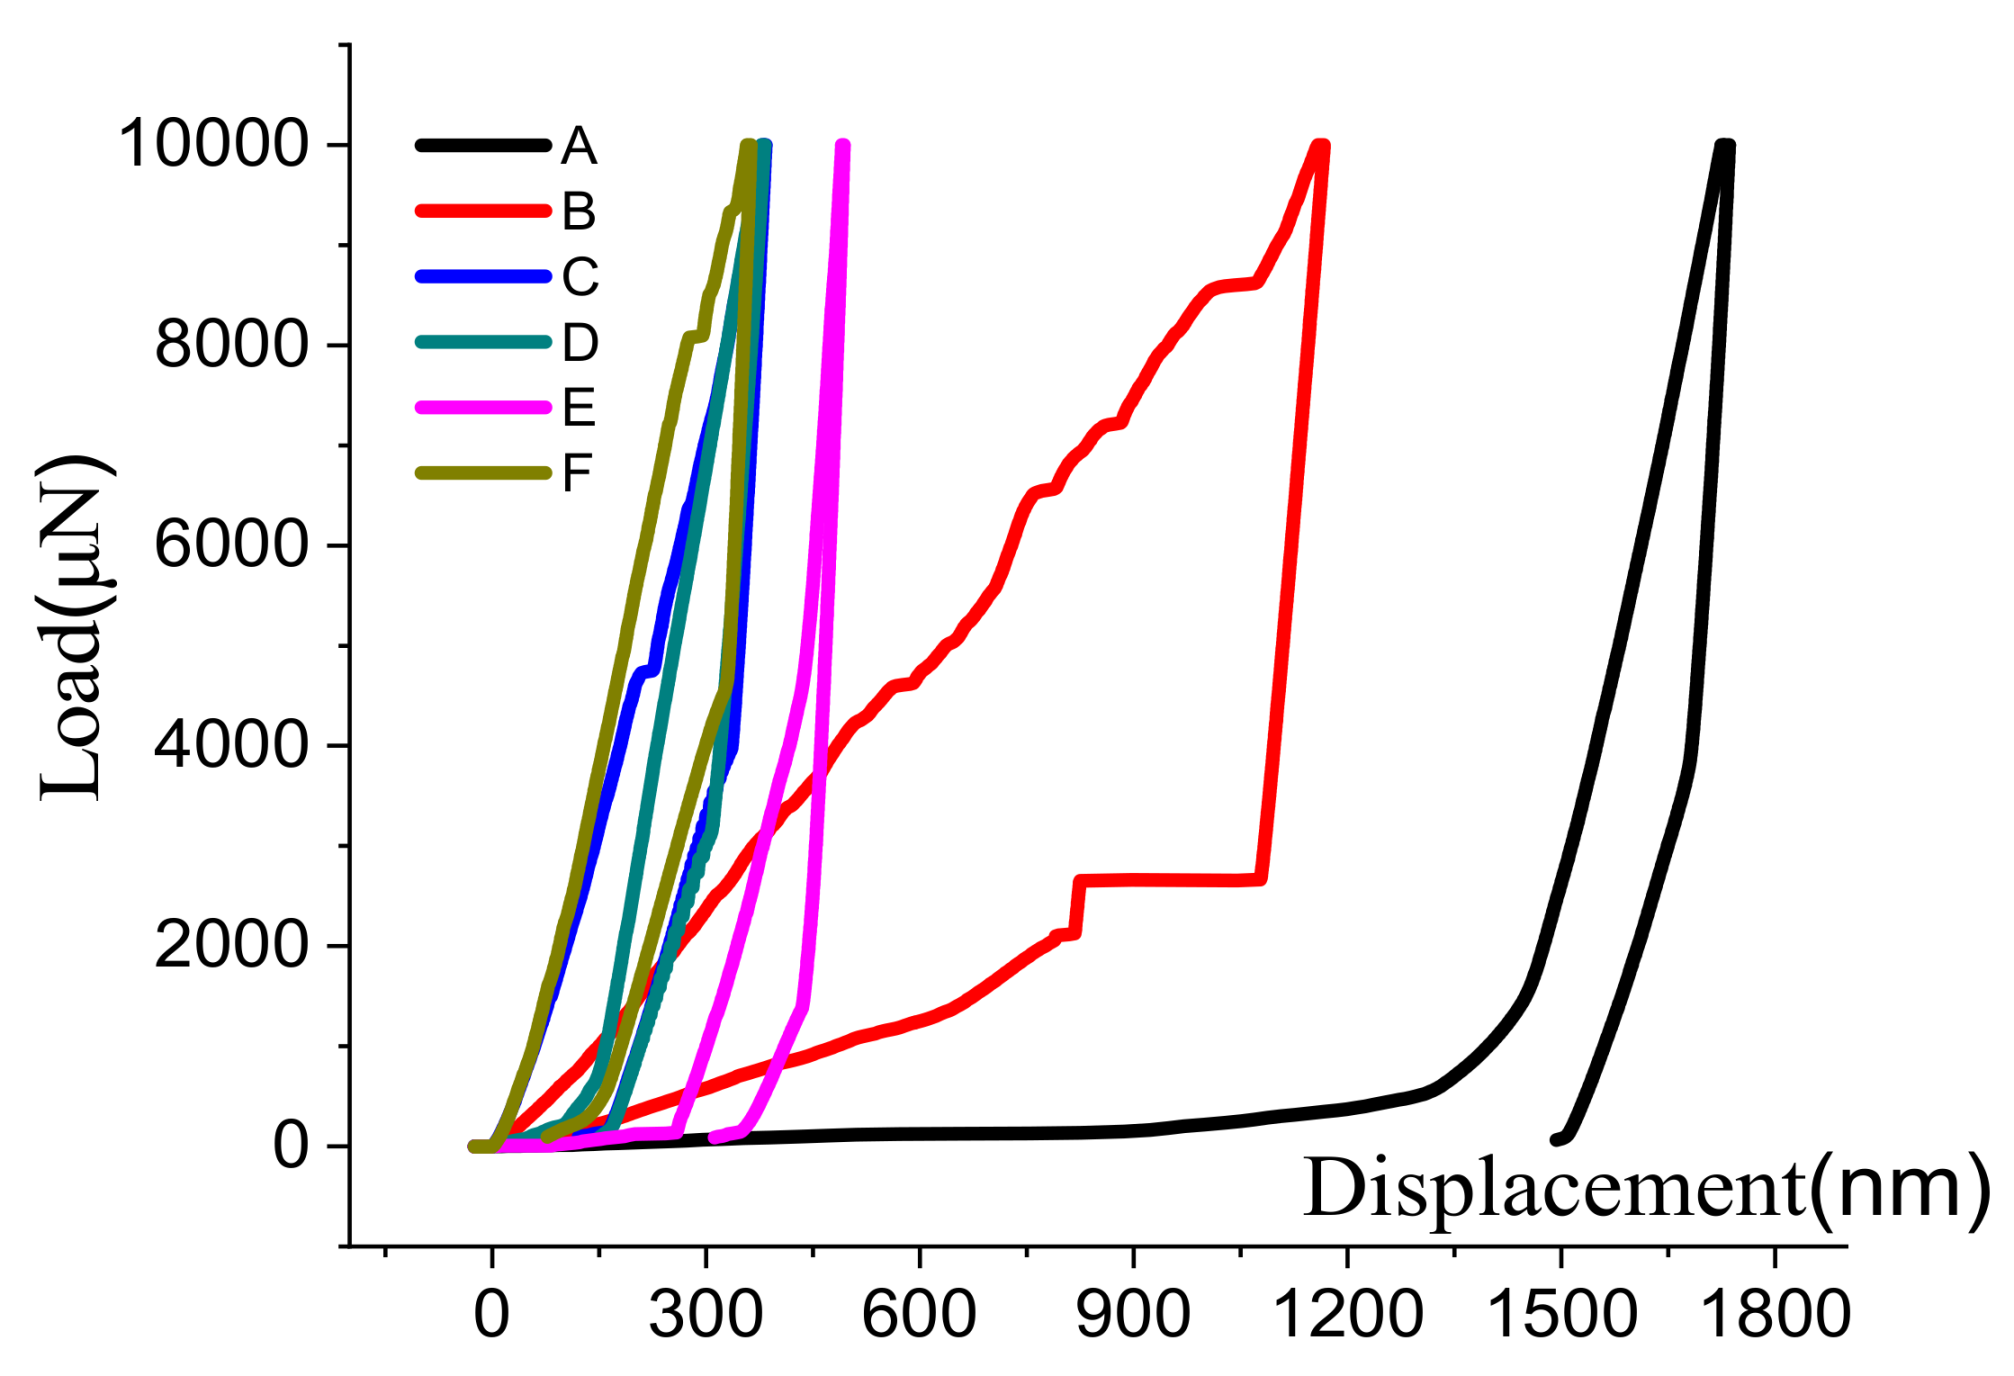
Figure 18, Figure 19 and Figure 20 show that the load–displacement curves of the main phase components of calcined bauxite had the same shape, with their loading processes roughly divided into a compression phase, a linear Young’s modulus stage, and an unloading stage. The load–displacement curves for the gray and bright-white areas were relatively smooth, whilst the load–displacement curves in the black area were more discrete. In addition, although test points were collected for the same colored areas, large variations between these results indicated that the phase composition at different sites of the same color might not be uniform.
The testing results presented in Figure 19 are significantly different because micro-cracks occurred in the test samples, whilst phases were often discontinuous due to the depth of the head probe being increased as greater loads were applied. This is because the hardness of the material in these areas was too high, leading to the pressure head becoming deformed. The load–displacement curves reveal that higher grades of calcined bauxite result in the indentation depth being lower at the moment of initial yield in the loading curves. As the grade of calcined bauxite increases, so does its corundum composition, with greater black areas corresponding to greater hardness.
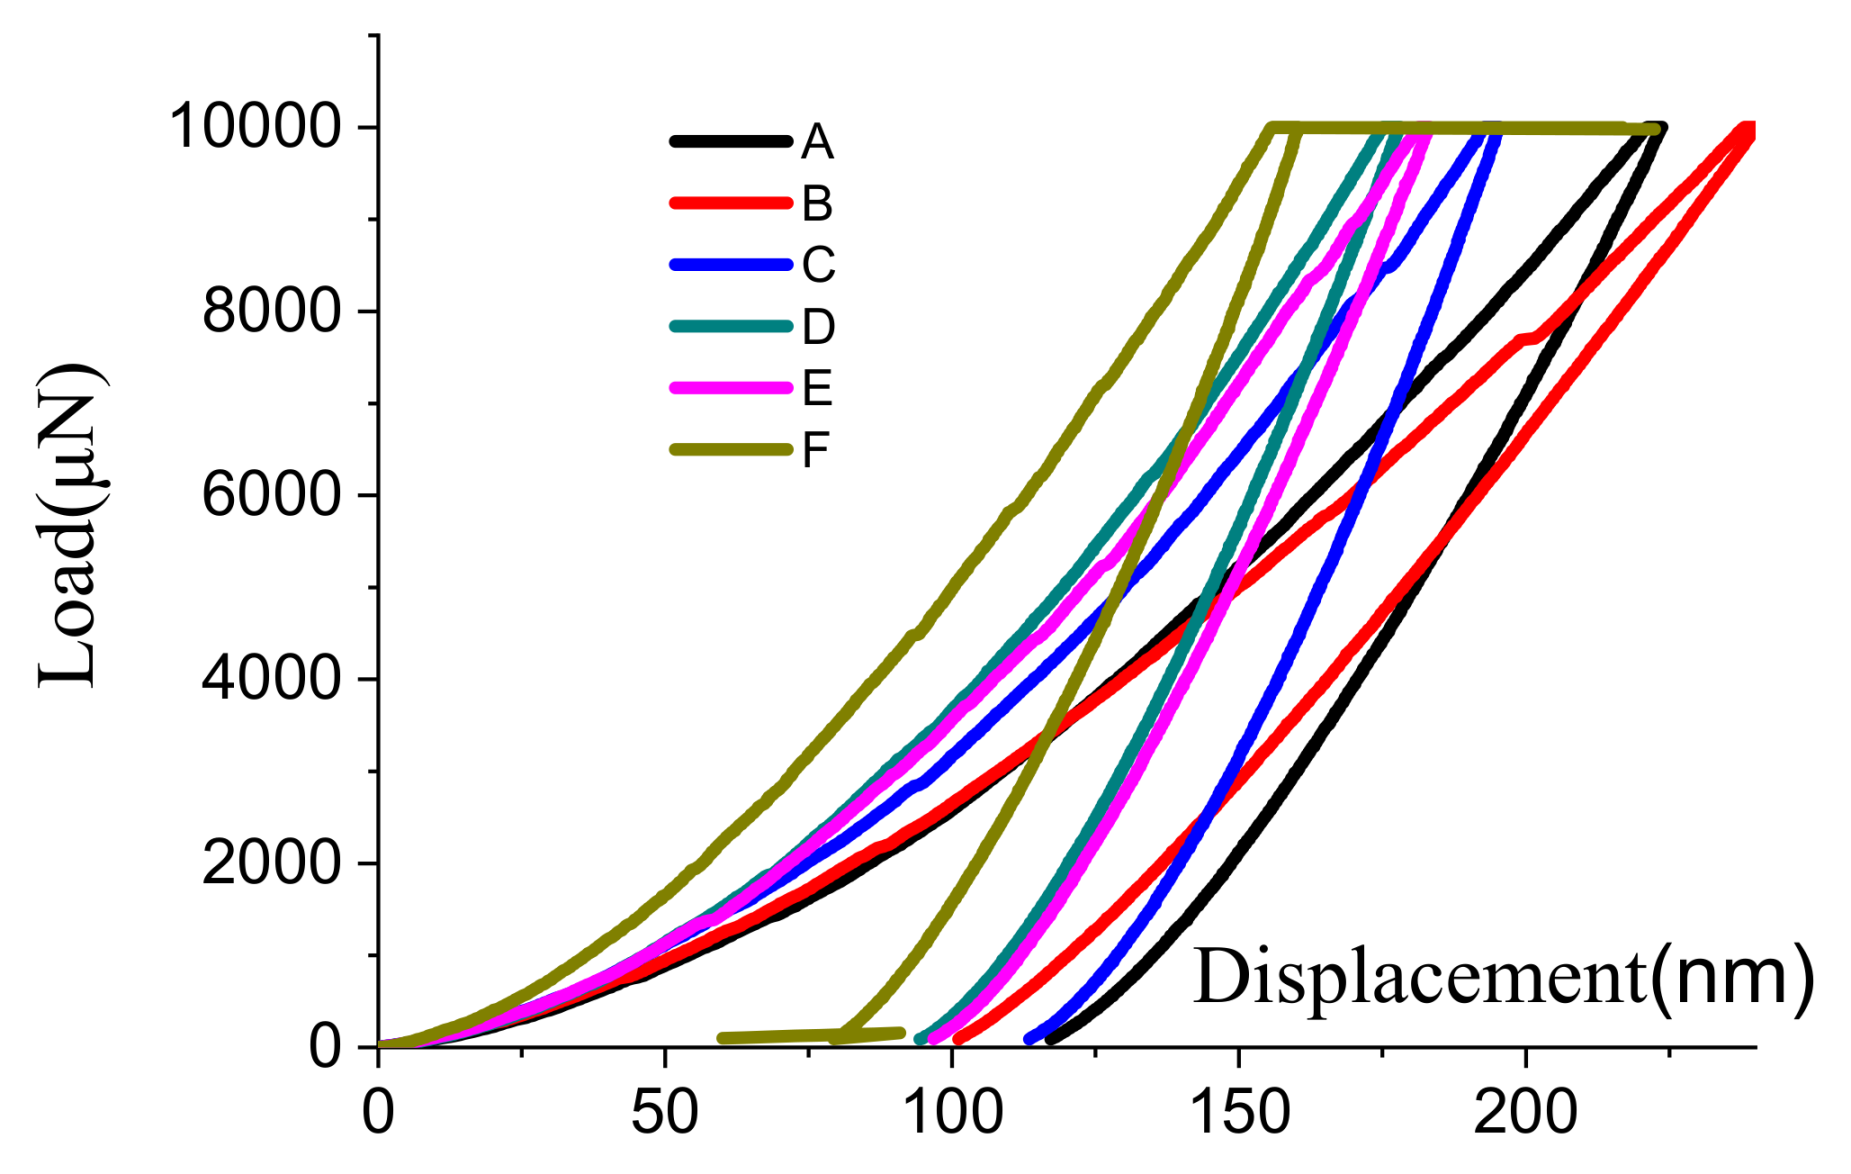
Figure 19 reveals that the smooth load–displacement curves in the gray area were more uniform. However, the indentation point of material B generated micro-cracks, which resulted in a non-continuous phase producing a step-shaped line. The phase ratios and compositions of material in the gray area of different kinds of calcined bauxite also exhibited large differences, resulting in varying load–displacement curves. High-grade calcined bauxite had a larger Young’s modulus and experienced smaller plastic deformation, whilst the phase uniformity of lower-grade calcined bauxite was poor, resulting in a smaller Young’s modulus and larger plastic deformation.
Figure 20 reveals the smooth load–displacement curves of phases in the bright-white areas, and, although the phase composition of the material in this area was more uniform, there was no obvious regularity of the load–displacement curves in this area. The mass percentage of all phases in this area was between 2.4% and 8.7% (see Table 1), which had little impact on the overall performance of the material.
3.4. Relationship between Wear Resistance and Different Properties
(1) Influence of average hardness and hardness dispersion on wear resistance
The hardness dispersion of the six kinds of calcined bauxite was calculated using Equation (4), with correlations among the wear performance, average hardness, and hardness dispersion established by combining their wear resistance test results (see Figure 5).
After converting the calculated values of hardness discretion, average hardness, and wear resistance into logarithm values, binary nonlinear regression analysis was used for data fitting to establish their functional relationships using Equation (15).
where Snm is the logarithm of the hardness discretion, Hnm is the logarithm of the average nano-hardness, and ε is the logarithm of the wear resistance parameter.
Wear resistance values of the aggregates were shown to have a direct proportional relationship to their nano-hardness and hardness discretion values, meaning that the calcined bauxite possesses better wear resistance when its nano-hardness is high and its hardness discretion is large, with the hardness discretion value having the greatest influence on wear resistance values.
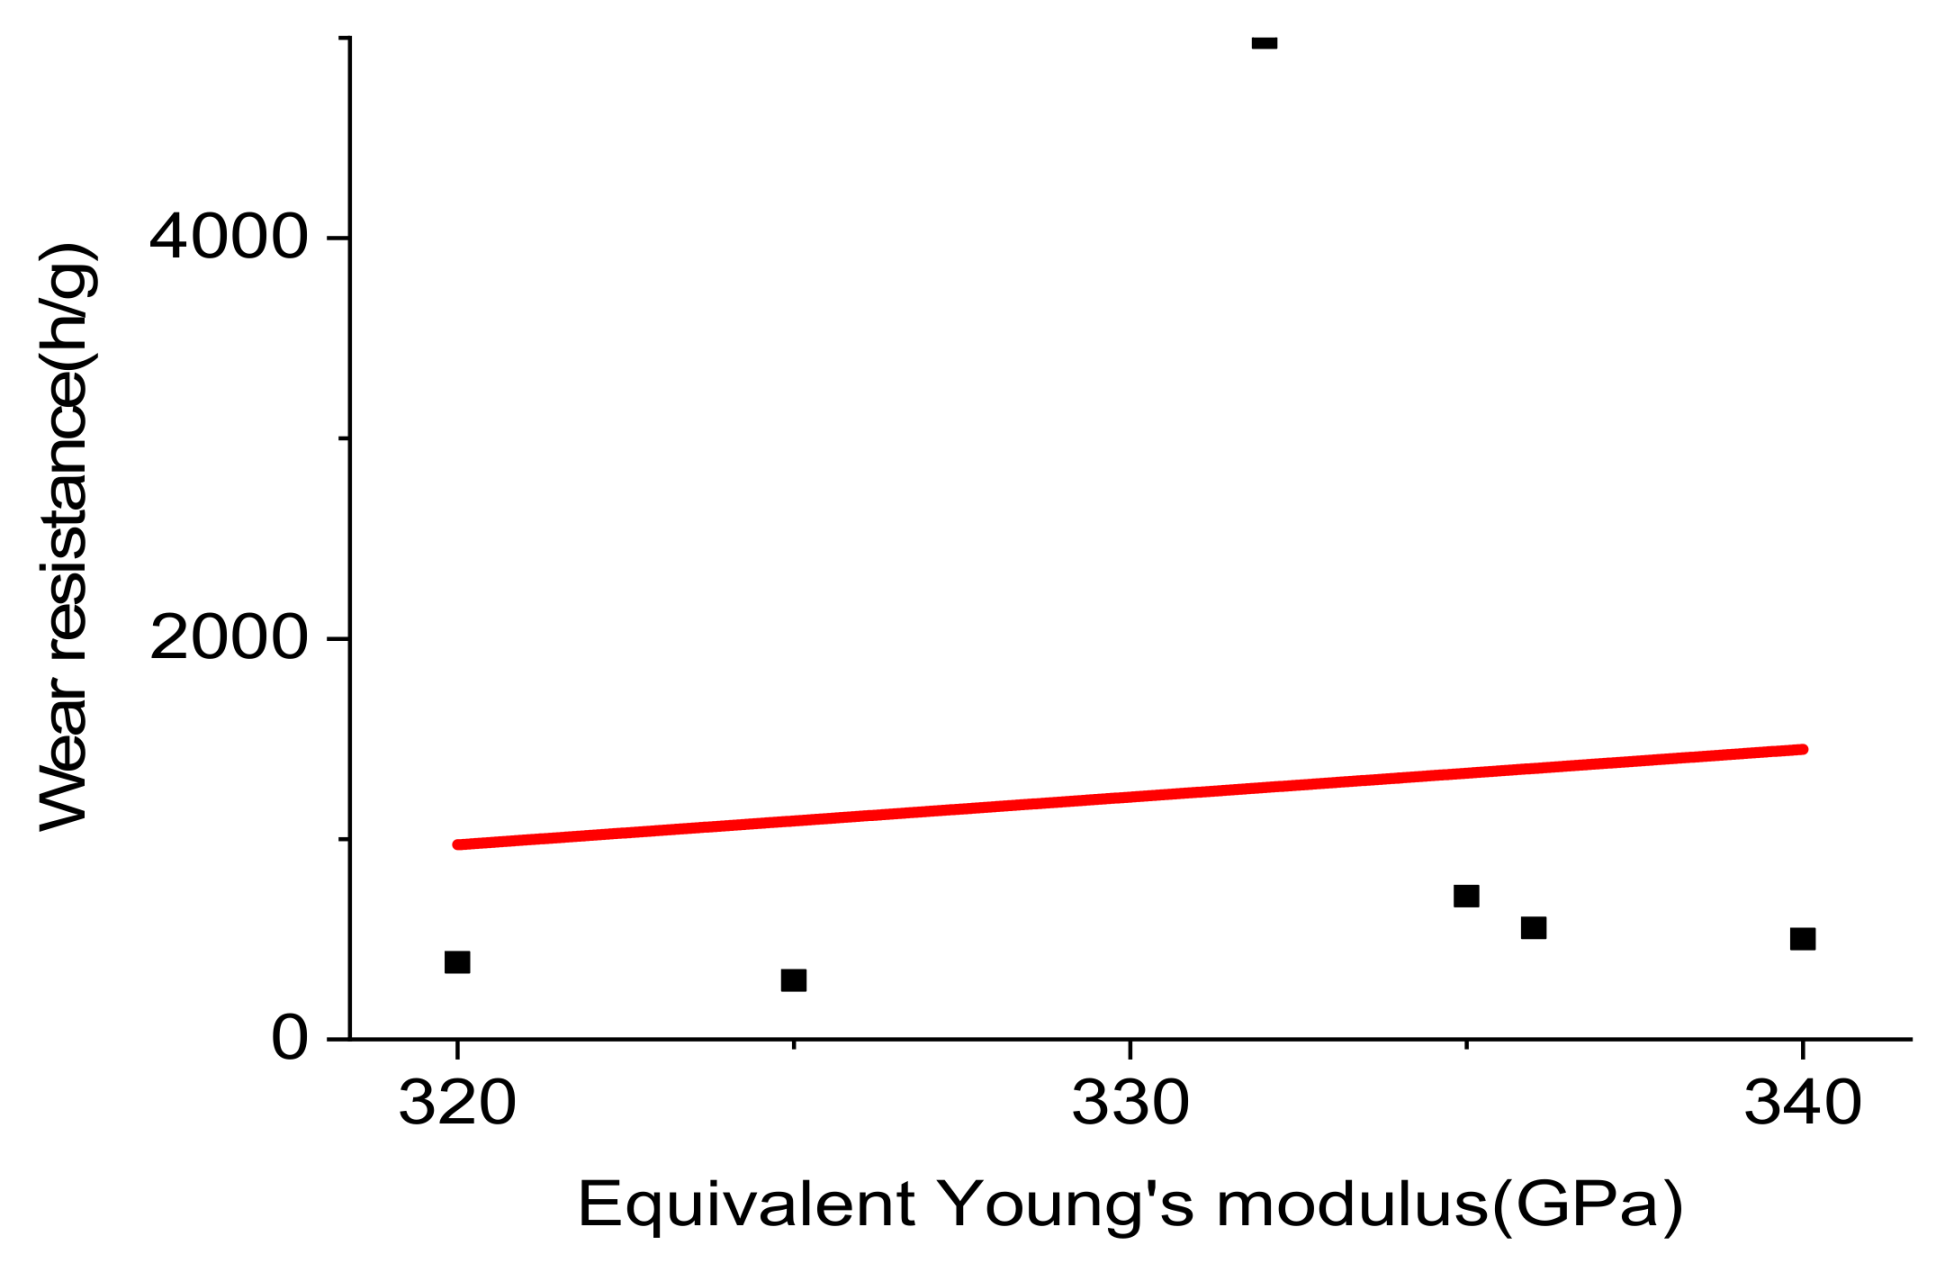
(2) Influence of modulus on wear resistance
Young’s modulus can be regarded as an index that measures the difficulty of elastic deformation of a material. Figure 21 shows that the equivalent Young’s modulus is not directly related to wear resistance.
(3) Influence of resistance mechanical properties on wear
Figure 18 shows that the load–displacement curves in the black area were more discrete, and Table 1 shows that the mass percentage of all phases in the white area was between 2.4% and 8.7%, which had little impact on the overall performance of the material. Figure 19 shows that high-grade calcined bauxite had a larger Young’s modulus and experienced smaller plastic deformation, whilst the phase uniformity of lower-grade calcined bauxite was poor, resulting in a smaller Young’s modulus and larger plastic deformation.
4. Conclusions
The main objective of the study was to evaluate the wear resistance of six kinds of calcined bauxite and analyze factors influencing wear resistance, with the results of this study enabling the following conclusions to be drawn:
(1) Aggregates D, E, and F are the most appropriate calcined bauxite materials for road surface applications because they exhibit high friction coefficients and good wear resistance.
(2) Vickers hardness and nano-hardness values were found to increase for higher calcined bauxite grades, with a correlation formula developed that accurately describes their average hardness, hardness dispersion, and wear resistance.
(3) The equivalent Young’s modulus values of the six types of calcined bauxite were calculated using a two-step homogenization method. High-grade calcined bauxite had a larger Young’s modulus and experienced smaller plastic deformation, whilst the phase uniformity of lower-grade calcined bauxite was poor, resulting in a smaller Young’s modulus and larger plastic deformation.
These results suggest that calcined bauxite aggregates with greater hardness, larger hardness dispersion values, and higher elastic modulus exhibited are best suited as materials for preparing road surfaces with good anti-sliding properties. Although calcined bauxite is a relatively expensive aggregate, its use on steep slopes, sharp turns, and other demanding road sections has great potential for reducing vehicle accidents. Furthermore, the excellent wear properties of calcined bauxite may potentially lead to extended road surface lifetimes that mitigate the initial costs of construction and are beneficial from a life-cycle perspective. China currently produces 95% of the globe’s refractory bauxite, with global demand for this hard-wearing mineral from various industries likely to grow in the future [27].
In addition, we presented an in-depth analysis of the factors influencing the abrasion resistance of different grades of bauxite clinker. Our results can provide a reference for the selection of aggregates in road pavements. The correct selection of the anti-slide aggregate is of great significance to improve the anti-slide durability of the pavement and to reduce the occurrence of accidents, ensuring the safety of road users.
Author Contributions
Conceptualization, X.W. and N.Z.; methodology, X.W.; software, F.K.; validation, X.W., N.Z., and F.K.; formal analysis, X.W.; investigation, X.W.; resources, N.Z. and F.K.; data curation, X.W.; writing—original draft preparation, X.W.; writing—review and editing, X.W. and N.Z.; visualization, X.W.; supervision, N.Z.; project administration, F.K.; funding acquisition, F.K.
Funding
This research was carried out under research project No.18-JKKJ-39 funded by the Traffic holding group of China.
Acknowledgments
The authors would like to thank the anonymous reviewers for their constructive comments and suggestions.
Conflicts of Interest
The authors declare no conflicts of interest.
References
- de Larrard, F.; Martinez-Castillo, R.; Sedran, T.; Hauza, P.; Poirier, J.E. Cementitious artificial aggregate particles for high-skid resistance pavements. Road Mater. Pavement Des. 2012, 13, 376–384. [Google Scholar] [CrossRef]
- Woodward, D.; Friel, S. Predicting the wear of high friction surfacing aggregate. Coatings 2017, 7, 71. [Google Scholar] [CrossRef]
- Friel, S.; Woodward, D. High friction surfacing systems using blends of natural aggregate and calcined bauxite. Coatings 2019, 9, 177. [Google Scholar]
- Chen, J.H.; Wang, Y.; Li, Y.; Xue, W.D.; Sun, J.L. Study on properties and application of dense homogenized bauxite. Rare Metal Mat. Eng. 2011, 40, 170–173. [Google Scholar]
- Liu, W.; Cai, G.; Wang, W.; Chou, Z. Production and application of Al-Si homogeneous sintering synthetic raw materials. Refractories 2013, 47, 323–327. [Google Scholar]
- Xue, Q.H.; Xu, W.Z. Refractory Science; Metallurgica Industry Press: Beijing, China, 2009; pp. 10–50. (In Chinese) [Google Scholar]
- Luo, Q.; Han, B.; Li, N. Analysis of difference between homogeneous alumina and high bauxite clinker. Refractories 2015, 49, 629–631. [Google Scholar]
- Li, H. Refractory Manual; Metallurgical Industry Press: Beijing, China, 2009; pp. 103–107. (In Chinese) [Google Scholar]
- Song, X. Refractory Technology; Chemical Industry Press: Beijing, China, 2008; pp. 161–188. (In Chinese) [Google Scholar]
- Wasilewska, M.; Gardziejczyk, W.; Gierasimiuk, P. Effect of aggregate graining compositions on skid resistance of Exposed Aggregate Concrete pavement. In Proceedings of the IOP Conference Series: Materials Science and Engineering, Resilient and Safe Road Infrastructure, Kielce, Poland, 8–9 May 2018; Volume 1, p. 012001. [Google Scholar]
- Rezaei, A.; Masad, E.; Chowdhury, A.; Harris, P. Predicting asphalt mixture skid resistance by aggregate characteristics and gradation. Transp. Res. Rec. 2009, 2104, 24–33. [Google Scholar] [CrossRef]
- Rezaei, A.; Masad, E.; Chowdhury, A. Development of a model for asphalt pavement skid resistance based on aggregate characteristics and gradation. J. Transp. Eng. 2011, 137, 863–873. [Google Scholar] [CrossRef]
- Fwa, T.F.; Choo, Y.S.; Liu, Y. Effect of aggregate spacing on skid resistance of asphalt pavement. J. Transp. Eng. 2003, 129, 420–426. [Google Scholar] [CrossRef]
- Mahmoud, E.; Masad, E. Experimental methods for the evaluation of aggregate resistance to polishing, abrasion, and breakage. J. Mater. Civ. Eng. 2007, 19, 977–985. [Google Scholar] [CrossRef]
- Wang, D.; Liu, P.; Xu, H.; Kollmann, J.; Oeser, M. Evaluation of the polishing resistance characteristics of fine and coarse aggregate for asphalt pavement using Wehner/Schulze test. Constr. Build. Mater. 2018, 163, 742–750. [Google Scholar] [CrossRef]
- Chen, X.H.; Wang, D.W. Fractal and spectral analysis of aggregate surface profile in polishing process. Wear 2011, 271, 2746–2750. [Google Scholar] [CrossRef]
- Xie, X.; Wang, C.; Wang, D.; Fan, Q.; Oeser, M. Evaluation of polishing behavior of fine aggregates using an accelerated polishing machine with real tires. J. Transp. Eng. B Pavements 2019, 145, 04019015. [Google Scholar] [CrossRef]
- Liu, J.J. Material Wear Principle and Wear Resistance; Tsinghua University Press: Beijing, China, 1993; pp. 243–244. (In Chinese) [Google Scholar]
- Zhou, C.M.; Shao, G.Y. Granite weighted Vichers hardness and grindability. Stone 1997, 1, 18–21. (In Chinese) [Google Scholar]
- Wang, D.; Liu, P.; Wang, H.; Ueckermann, A.; Oeser, M. Modeling and testing of road surface aggregate wearing behaviour. Constr. Build. Mater. 2017, 131, 129–137. [Google Scholar] [CrossRef]
- Zhong, F.H. Study on The Surface Hardening Mechanism of Superhard Diamond and its Nano-hardness Evaluation Technology. Master’s Thesis, Harbin Institute of Technology, Harbin, China, 2018. (In Chinese). [Google Scholar]
- Li, M.; Wen, S.Z. Theoretical methods on nanoindentation. Chin. J. Mech. Eng. 2003, 39, 142–145. (In Chinese) [Google Scholar] [CrossRef]
- Zhao, H.W.; Zhao, H.J.; Yao, J.J.; Huang, H. Nanoindentation test and analysis of a kind of soda lime silica glass. Nanotechnol. Prec. Eng. 2009, 7, 205–210. (In Chinese) [Google Scholar]
- Huang, Y.; Shen, W.Q.; Shao, J.F.; Guéry, A.A.; Jia, Y. Multi-scale modeling of time-dependent behavior of claystones with a viscoplastic compressible porous matrix. Mech. Mater. 2014, 79, 25–34. [Google Scholar] [CrossRef]
- Zhang, F.; Guo, H.Q.; Zhao, J.J.; Hu, D.W.; Sheng, Q.; Shao, J.F. Experimental study of micro-mechanical properties of granite. J. Rock Mech. Eng. 2017, 26. (In Chinese) [Google Scholar]
- Li, N.; Gu, H.Z.; Zhao, H.Z. Refractory Science; Metallurgica Industry Press: Beijing, China, 2012; pp. 148–149. (In Chinese) [Google Scholar]
- O’Driscoll, M. The new world of China’s refractory mineral supply. In Proceedings of the 61st International Colloquium on Refractories, Aachen, Germany, 26–27 September 2018; pp. 26–27. [Google Scholar]
Figure 1.
Types of calcined bauxite. (A) Bauxite-A; (B) Bauxite-B; (C) Bauxite-C; (D) Bauxite-D; (E) Bauxite-E; (F) Bauxite-F. The bauxite clinker with higher grade is denser and harder, while the bauxite clinker with lower grade has a looser surface, more fractured surfaces and larger pores.
Figure 1.
Types of calcined bauxite. (A) Bauxite-A; (B) Bauxite-B; (C) Bauxite-C; (D) Bauxite-D; (E) Bauxite-E; (F) Bauxite-F. The bauxite clinker with higher grade is denser and harder, while the bauxite clinker with lower grade has a looser surface, more fractured surfaces and larger pores.

Figure 2.
Porosity of calcined bauxite.

Figure 3.
Friction-wear testing machine.

Figure 4.
Linear reciprocating loading mode.

Figure 5.
Topographic map of wear marks.

Figure 6.
Selection of test points for different phases.


Figure 7.
Abrasion resistance values for calcined bauxites.

Figure 8.
Average friction coefficients for calcined bauxites.

Figure 9.
Distribution range of hardness test values in gray area.

Figure 10.
Distribution range of hardness test values in bright-white area.

Figure 11.
Nano-hardness of calcined bauxite samples (GPa).

Figure 12.
Average hardness of calcined bauxite (GPa).

Figure 13.
A quasi-static nano-indentation load–displacement curve

Figure 14.
Distribution range of Young’s modulus value in gray area.

Figure 15.
Distribution range of Young’s modulus value in in bright-white area.

Figure 16.
Young’s modulus test results.

Figure 17.
Equivalent Young’s modulus of calcined bauxite (GPa).

Figure 18.
Load–displacement curves in black areas.

Figure 19.
Load–displacement curves in gray areas.

Figure 20.
Load–displacement curves in bright-white areas.

Figure 21.
Influence of modulus on wear resistance.


Table 1.
Phase proportion of calcined bauxites.
| Types | Corundum (%) | Mullite (%) | Cristobalite (%) | Calcium Silicide (%) | Aluminum Titanate (%) |
|---|---|---|---|---|---|
| A | 30.5 | 65.9 | — | 3.5 | — |
| B | 36.8 | 60.1 | — | 3.1 | — |
| C | 51.9 | 44.4 | 3.7 | — | — |
| D | 62.2 | 32.0 | 2.1 | 3.7 | — |
| E | 71.3 | 26.2 | — | 2.4 | — |
| F | 75.0 | 16.3 | — | 1.8 | 6.9 |
Note: The six grades of calcined bauxite were labeled A, B, C, D, E, and F, with increasing Al2O3 content.
Table 2.
Test parameters used in the friction test.
| Travel | Frequency | Loading Force | Testing Time |
|---|---|---|---|
| 8 mm | 1 Hz | 100 N | 30 min |
Table 3.
Hardness dispersion of calcined bauxite (GPa).
| Calcined Bauxite Sample | F | E | D | C | B | A |
|---|---|---|---|---|---|---|
| Hardness dispersion value | 370 | 382 | 406 | 430 | 418 | 413 |
© 2019 by the authors. Licensee MDPI, Basel, Switzerland. This article is an open access article distributed under the terms and conditions of the Creative Commons Attribution (CC BY) license (http://creativecommons.org/licenses/by/4.0/).
Share and Cite
MDPI and ACS Style
Wu, X.; Zhen, N.; Kong, F. Evaluation of the Factors Affecting the Wear Resistance of Calcined Bauxite Aggregates. Coatings 2019, 9, 761. https://0-doi-org.brum.beds.ac.uk/10.3390/coatings9110761
AMA Style
Wu X, Zhen N, Kong F. Evaluation of the Factors Affecting the Wear Resistance of Calcined Bauxite Aggregates. Coatings. 2019; 9(11):761. https://0-doi-org.brum.beds.ac.uk/10.3390/coatings9110761
Chicago/Turabian StyleWu, Xirong, Nanxiang Zhen, and Fansheng Kong. 2019. "Evaluation of the Factors Affecting the Wear Resistance of Calcined Bauxite Aggregates" Coatings 9, no. 11: 761. https://0-doi-org.brum.beds.ac.uk/10.3390/coatings9110761
Note that from the first issue of 2016, this journal uses article numbers instead of page numbers. See further details here.