Article

Corrosion Resistance Test of Electroplated Gold and Palladium Using Fast Electrochemical Analysis

by
Walter Giurlani
1,*,
Patrick Marcantelli
1,
Francesco Benelli
1,
Daniele Bottacci
2,
Filippo Gambinossi
1,
Maurizio Passaponti
1,
Antonio De Luca
1,
Emanuele Salvietti
1 and
Massimo Innocenti
1
1
Dipartimento di Chimica, Università degli Studi di Firenze, via della Lastruccia 3, 50019 Sesto Fiorentino, Italy
2
Metrohm, Ionenstrasse, 9100 Herisau, Switzerland
*
Author to whom correspondence should be addressed.
Submission received: 16 May 2019 / Revised: 14 June 2019 / Accepted: 19 June 2019 / Published: 21 June 2019

Abstract

:
Noble metal coatings are commonly employed to improve corrosion resistance of metals in the electronic and jewellery industry. The corrosion resistance of electroplated goods is currently determinate with long, destructive and almost subjective interpretation corrosion tests in artificial atmosphere. In this study we present the application of electrochemical analysis to obtain fast and numerical information of the antiaging coating. We performed open circuit potential (OCP) and corrosion current measurement; we employed also the electrochemical impedance spectroscopy (EIS), commonly applied to organic or passivated metal with high-impedance, to find the best option for noble low-impedance coating analysis. For comparison, traditional standardized tests (damp heat ISO 17228, salt spray ISO 9227 and sulphur dioxide ISO 4524) were also performed.

1. Introduction

Metals are normally exposed to corrosion in atmospheric and aqueous environments. In many industrial applications metallic corrosion is a well-known issue and for this reason protective coatings are often applied to the bare metal. There are many typologies of coatings: Insulating-like plastics, paints and passivated metals or conductive-like galvanic protection or noble element deposition. The uses of noble coating like Au, Pt, Rh and Pd range from fashion accessories, used in jewellery, bags, belts but also in electronic devices for electric contacts and pins. For these reasons the development of new alloys and coatings is a fundamental aspect for the prevention of corrosion, which is important due to the negative implications of corrosion from both an aesthetic, as well as technological performance point of view. In order to avoid these problems, it is important to check the corrosion status and protection of the materials. While there exist many electrochemical studies and regulations for insulating coatings [1,2,3], the assessment of corrosion on noble metal films is carried out through long and destructive tests in a controlled atmosphere such as: The 24 h synthetic sweat test [4], the corrosion test with thioacetamide [5] with a duration of 48 h, the 24 h sulphur dioxide test [6], the 24 h damp heat test [7] and the 48 h salt spray test [8]. After the test, the corrosion assessment of the metallic coatings is carried out by a visual comparison. Even if the standardized procedures provide some guide lines for the interpretation of the results, the personal sensibility of the analysis technician results in subjective evaluations. Moreover, this kind of analysis could lead only to a qualitative estimation but not a quantitative one, since there is no tool to express the results with a numerical value to identify if the metallic coating has undergone corrosion.
In theory, a noble coating should not undergo corrosion because the metal does not oxidise by definition. In reality this is not true mainly for two reasons: (i) The grade of the precious alloy may decrease over time due to metal migration from the substrate (like the case of gold coating deposited on copper alloys) making the coating more attackable from the environments; (ii) moreover, since these coatings are very expensive, the producers tend to deposit the lowest amount possible but the galvanic deposition is not compact and uniform like a solid metal and these could lead to some leakage, mechanical stress, cracks or even uncoated parts exposing the underlying metal. In these points the object is very weak because a galvanic pair is created with the noblest metal leading to a fast corrosion.
The electrochemical impedance spectroscopy (EIS) is a versatile procedure for the accelerated evaluation of the anti-corrosion performance of coatings and generally it is a non-destructive method. EIS works by applying an electrical sinusoidal perturbation with a fixed frequency and measuring electrical impedance Z of the sample. Measuring impedance at different frequencies and analysing the data, it is possible to postulate the structure of an equivalent circuit and extract corrosion resistance data. This approach is commonly used for high-impedance coatings like organic layers [9] and uncoated passivated metals (Ti, Ni, Al, Zn) [10,11,12,13] but no study has been carried out on noble metallic coatings. For this reason, we use methodology that combined the studies on insulating coatings and uncoated metals [14,15,16,17,18,19,20], to obtain a faster, alternative, non-visually destructive, quantitative and modulable method for the evaluation of corrosion of metallic coatings, compared to the current methods used in the galvanic industries. In this study we explore EIS as well as the open circuit potential (OCP) and the corrosion current measurement under an applied stress potential to find the best option for the corrosion strength analysis of noble galvanic coatings. In the end there may be applications both in industry and in scientific research in the case of conductive film studies [21,22,23,24,25,26,27,28]. For comparison we performed also the most common traditional tests: damp heat, salt spray and sulphur dioxide.
The aim of this study is to asses if the electrochemical techniques could help to give results as reliable as other more diffuse and traditional destructive corrosion testing techniques with a numerical objective result and in a lower amount of time.

2. Materials and Methods

The samples were prepared on brass (copper-zinc 67:33 alloy) plates of 3.75 mm × 5 mm, 0.25 mm thick. We used commercial electrodeposition solution of copper, white bronze, palladium and gold. The sequence of the layers and their thickness is shown in Table 1. We used typical galvanic bath used in jewellery industry with the same ranges of thicknesses and layer sequences [29]. To have a simple system we used only a single non-precious metal layer and one precious layer, since gold is not stable if electroplated directly on copper. Due to the solubility of the two metals, one in the other, and the consequent diffusion over time, gold was electroplated on bronze and palladium on copper. The characteristics of the single layers are the following: Copper tends to suffer corrosion, bronze tends to passivation as well as palladium (even if palladium is nobler), and finally gold should be not attacked by corrosion.
Atomic force microscopy (AFM) (PicoSPM, Molecular Imaging, Tempe, AZ, USA) was used evaluate the roughness of the samples. The measurements were performed in contact mode with a non-conductive Si3N4 triangular cantilever (NP-S10, Veeco, Plainview, NY, USA), the cantilever depth was in the 0.4–0.7 μm range and with a force consent of 0.12 N/m, 0.5 V force set point and a speed of 1.2 l/s.
X-ray fluorescence spectroscopy (XRF) measurements were performed with a Bowman B Series XRF spectrometer (Schaumburg, IL, USA) using an acquisition time of 60 s, 50 kV tube voltage, 0.8 mA tube current, a focal distance of 12 mm, and with a collimator of 0.305 mm in diameter.
The electrochemical measurements were performed with a Metrohm Autolab (Utrecht, The Netherlands) PGSTAT204 potentiostat controlled by the NOVA 2.1.4 software. The electrochemical cell consists in a polymethylmethacrylate cylinder, 5 cm in diameter and 1 cm long, with a hole of 11.3 mm in diameter along its axis to contain 1 mL of solution. Measurements were performed with the three electrodes setup. The working electrode (our samples) and the counter electrode (Pt foil) were disposed on the two sides of the cylinder and screw sealed with poly(methyl methacrylate) (PMMA) plug. Through a small lateral hole, the Ag/AgCl/sat. KCl reference electrode was immersed in the solution. The solution chosen was similar to that used for the salt spray test to compare the results and contains 3.5 wt.% NaCl (Sigma Aldrich, Saint Louis, MO, USA; ≥99%) and is buffered at pH 7 with 0.1 M NaH2PO4/Na2HPO4.
The classical corrosion tests performed was 24 h damp heat ISO 17228:2015 [7], 48 h salt spray ISO 9227:2017 [8] and 24 h sulphur dioxide ISO 4524:2000 [6].

3. Results

The thickness of the coatings were measured using the XRF, the results are shown in Table 1. The samples are named with the element of the final coating, followed by a sequential numeration. Six sample of each type were prepared to perform all the planned experiments; the distribution of the thicknesses for each sample is reported in Table 1 as well.
In addition to the primary samples, two more were prepared, by simply removing the sample before the noble metal deposition, to study the roughness of the substrate with AFM. The top layer of the first one was bronze, the substrate of the gold samples, while the other was copper, used as a substrate for the palladium samples. We performed the AFM analysis of the substrates (Figure 1) to calculate the RMS of the heights. The roughness, 10.0 nm for Cu and 10.3 nm for bronze, was much lower than the lowest deposit in the gold and the palladium samples, confirming that we can consider the deposit as homogeneous and with complete coverage.

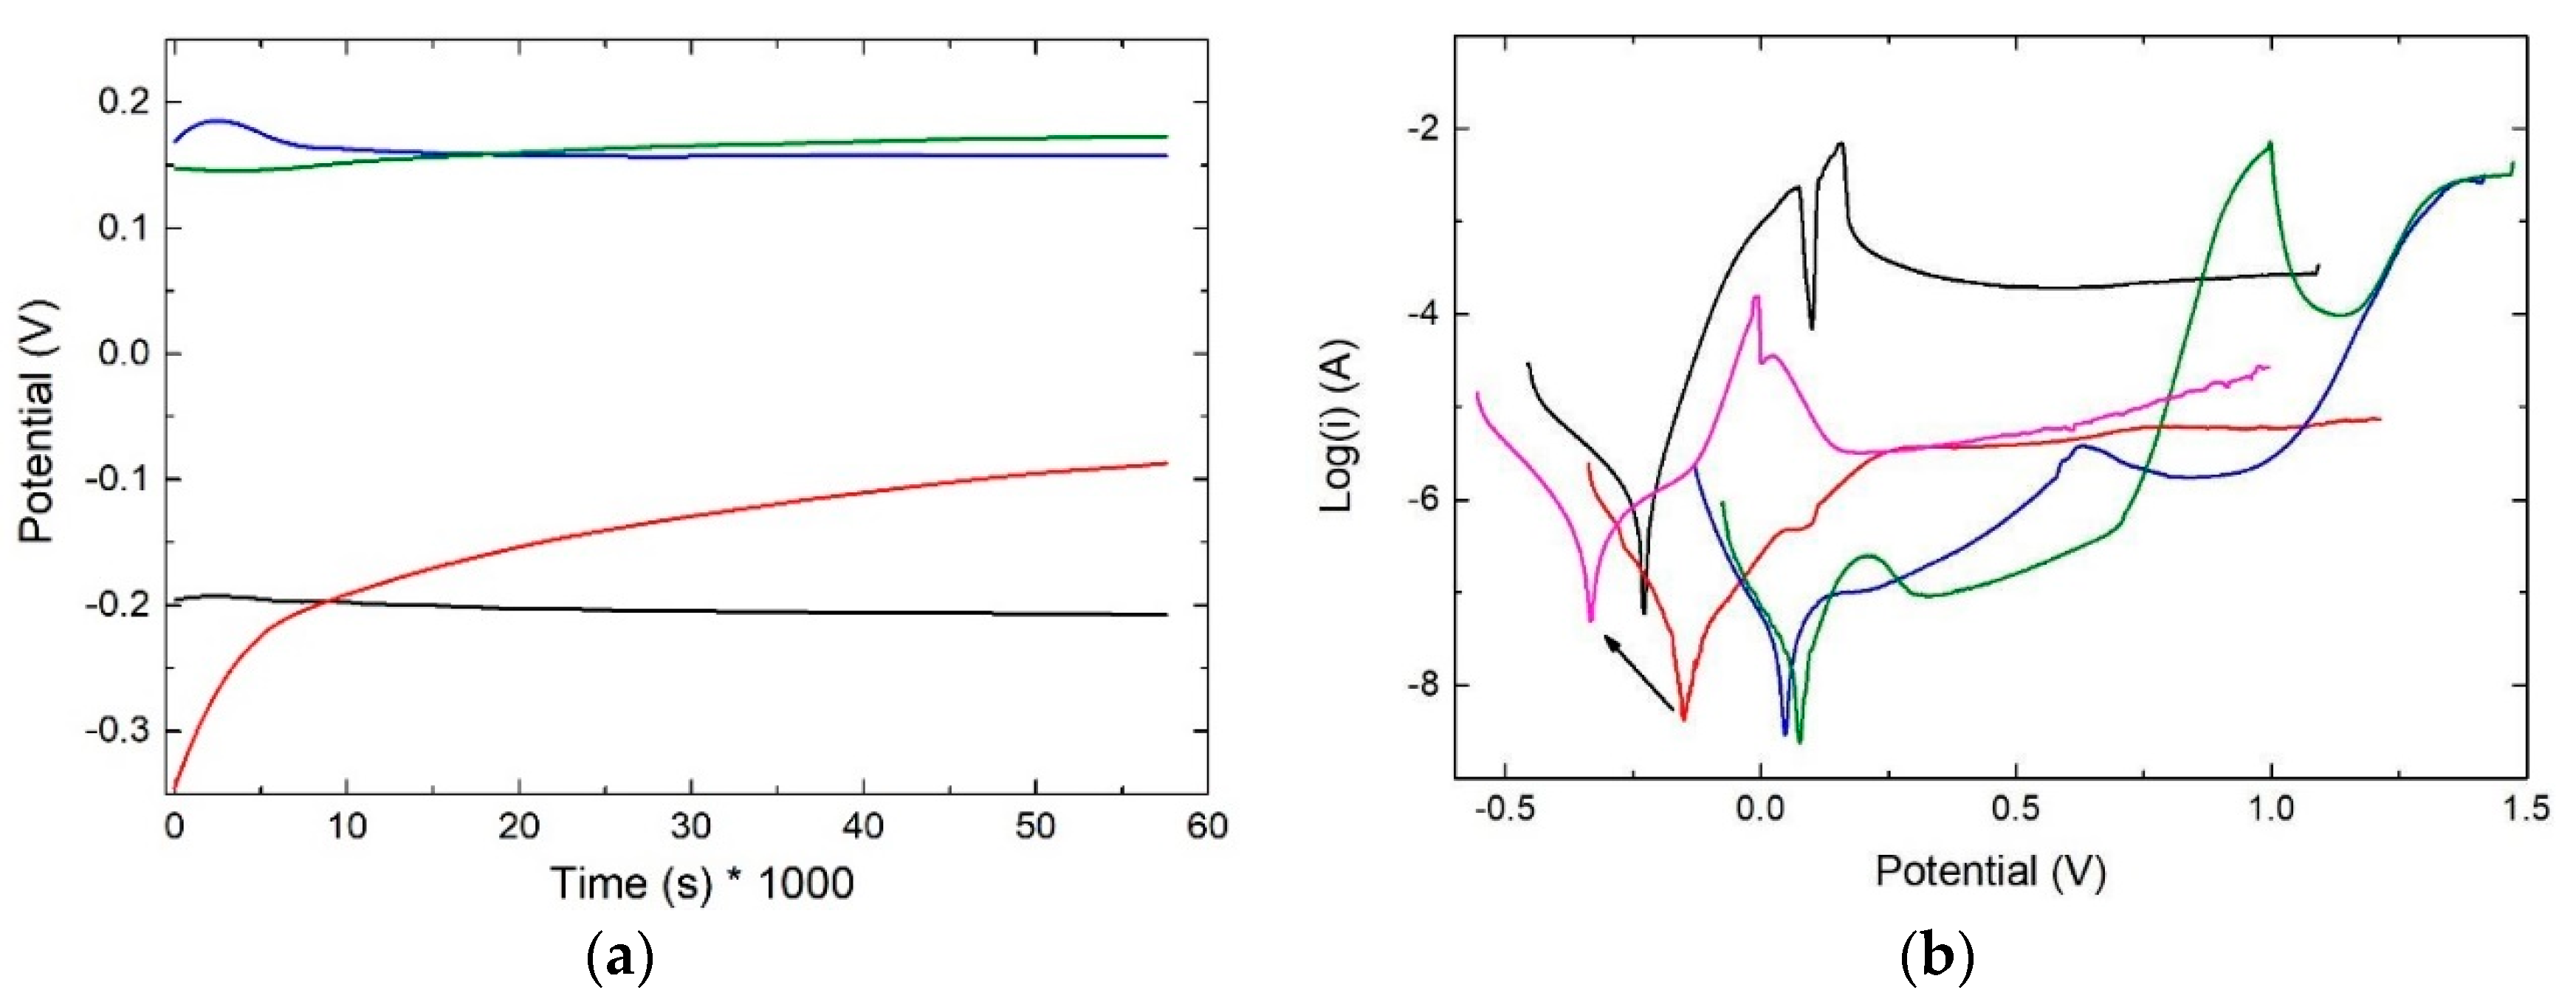
3.1. Polarization Plots

The first electrochemical characterization of the samples was made performing a long time OCP measurement and a subsequent polarization curve. The OCP was recorded for 16 h on the two substrates (copper and brass) and on the Au(3) and Pd(3) samples, to observe the time needed to obtain a stable reading and also to observe if there was any drifting. The samples with the higher thickness were chosen for this measurement as we desired to isolate the contribution of the top layer alone. The results show (Figure 2a) little fluctuations only in the early stages of the measurement and a very light drift for almost all the samples except for the bronze which keeps increasing its OCP even after 16 h. In fact bronze starts at −0.35 V and stops over −0.10 V, crossing the Cu value at −0.2 V after 2.5 h. This is due to the formation of an oxide layer on the surface of the bronze. There is also a cross between Au1.0 and Pd1.0 samples, but the variation over the total time is almost negligible.
The polarization curve was performed from −0.25 V to +1.3 V respect to the OCP (the average of the last 50 points was considered) with a scan speed of 0.4 mV/s. The results are shown in Figure 2b: Copper reaches a high current passive-like zone after the corrosion peak above 0.25 V; Also bronze has a passive zone after the same potential but with much lower currents; Palladium has a corrosion peak at 0.6 V and over 1 V the current rises probably due to the oxidation of water; gold has a small corrosion peak near the corrosion potential (Ecorr, the potential where the current is zero by definition) and another one much more intense at 0.9 V, then the water oxidation takes place. Since the bronze suffers a drifting during the OCP measurement, for comparison, another polarization curve was measured for it after an OCP of 1 h. In this case the Ecorr occurs at much more negative potentials, as expected, but there is also a corrosion peak, at 0.0 V that was not present the previous measurement.

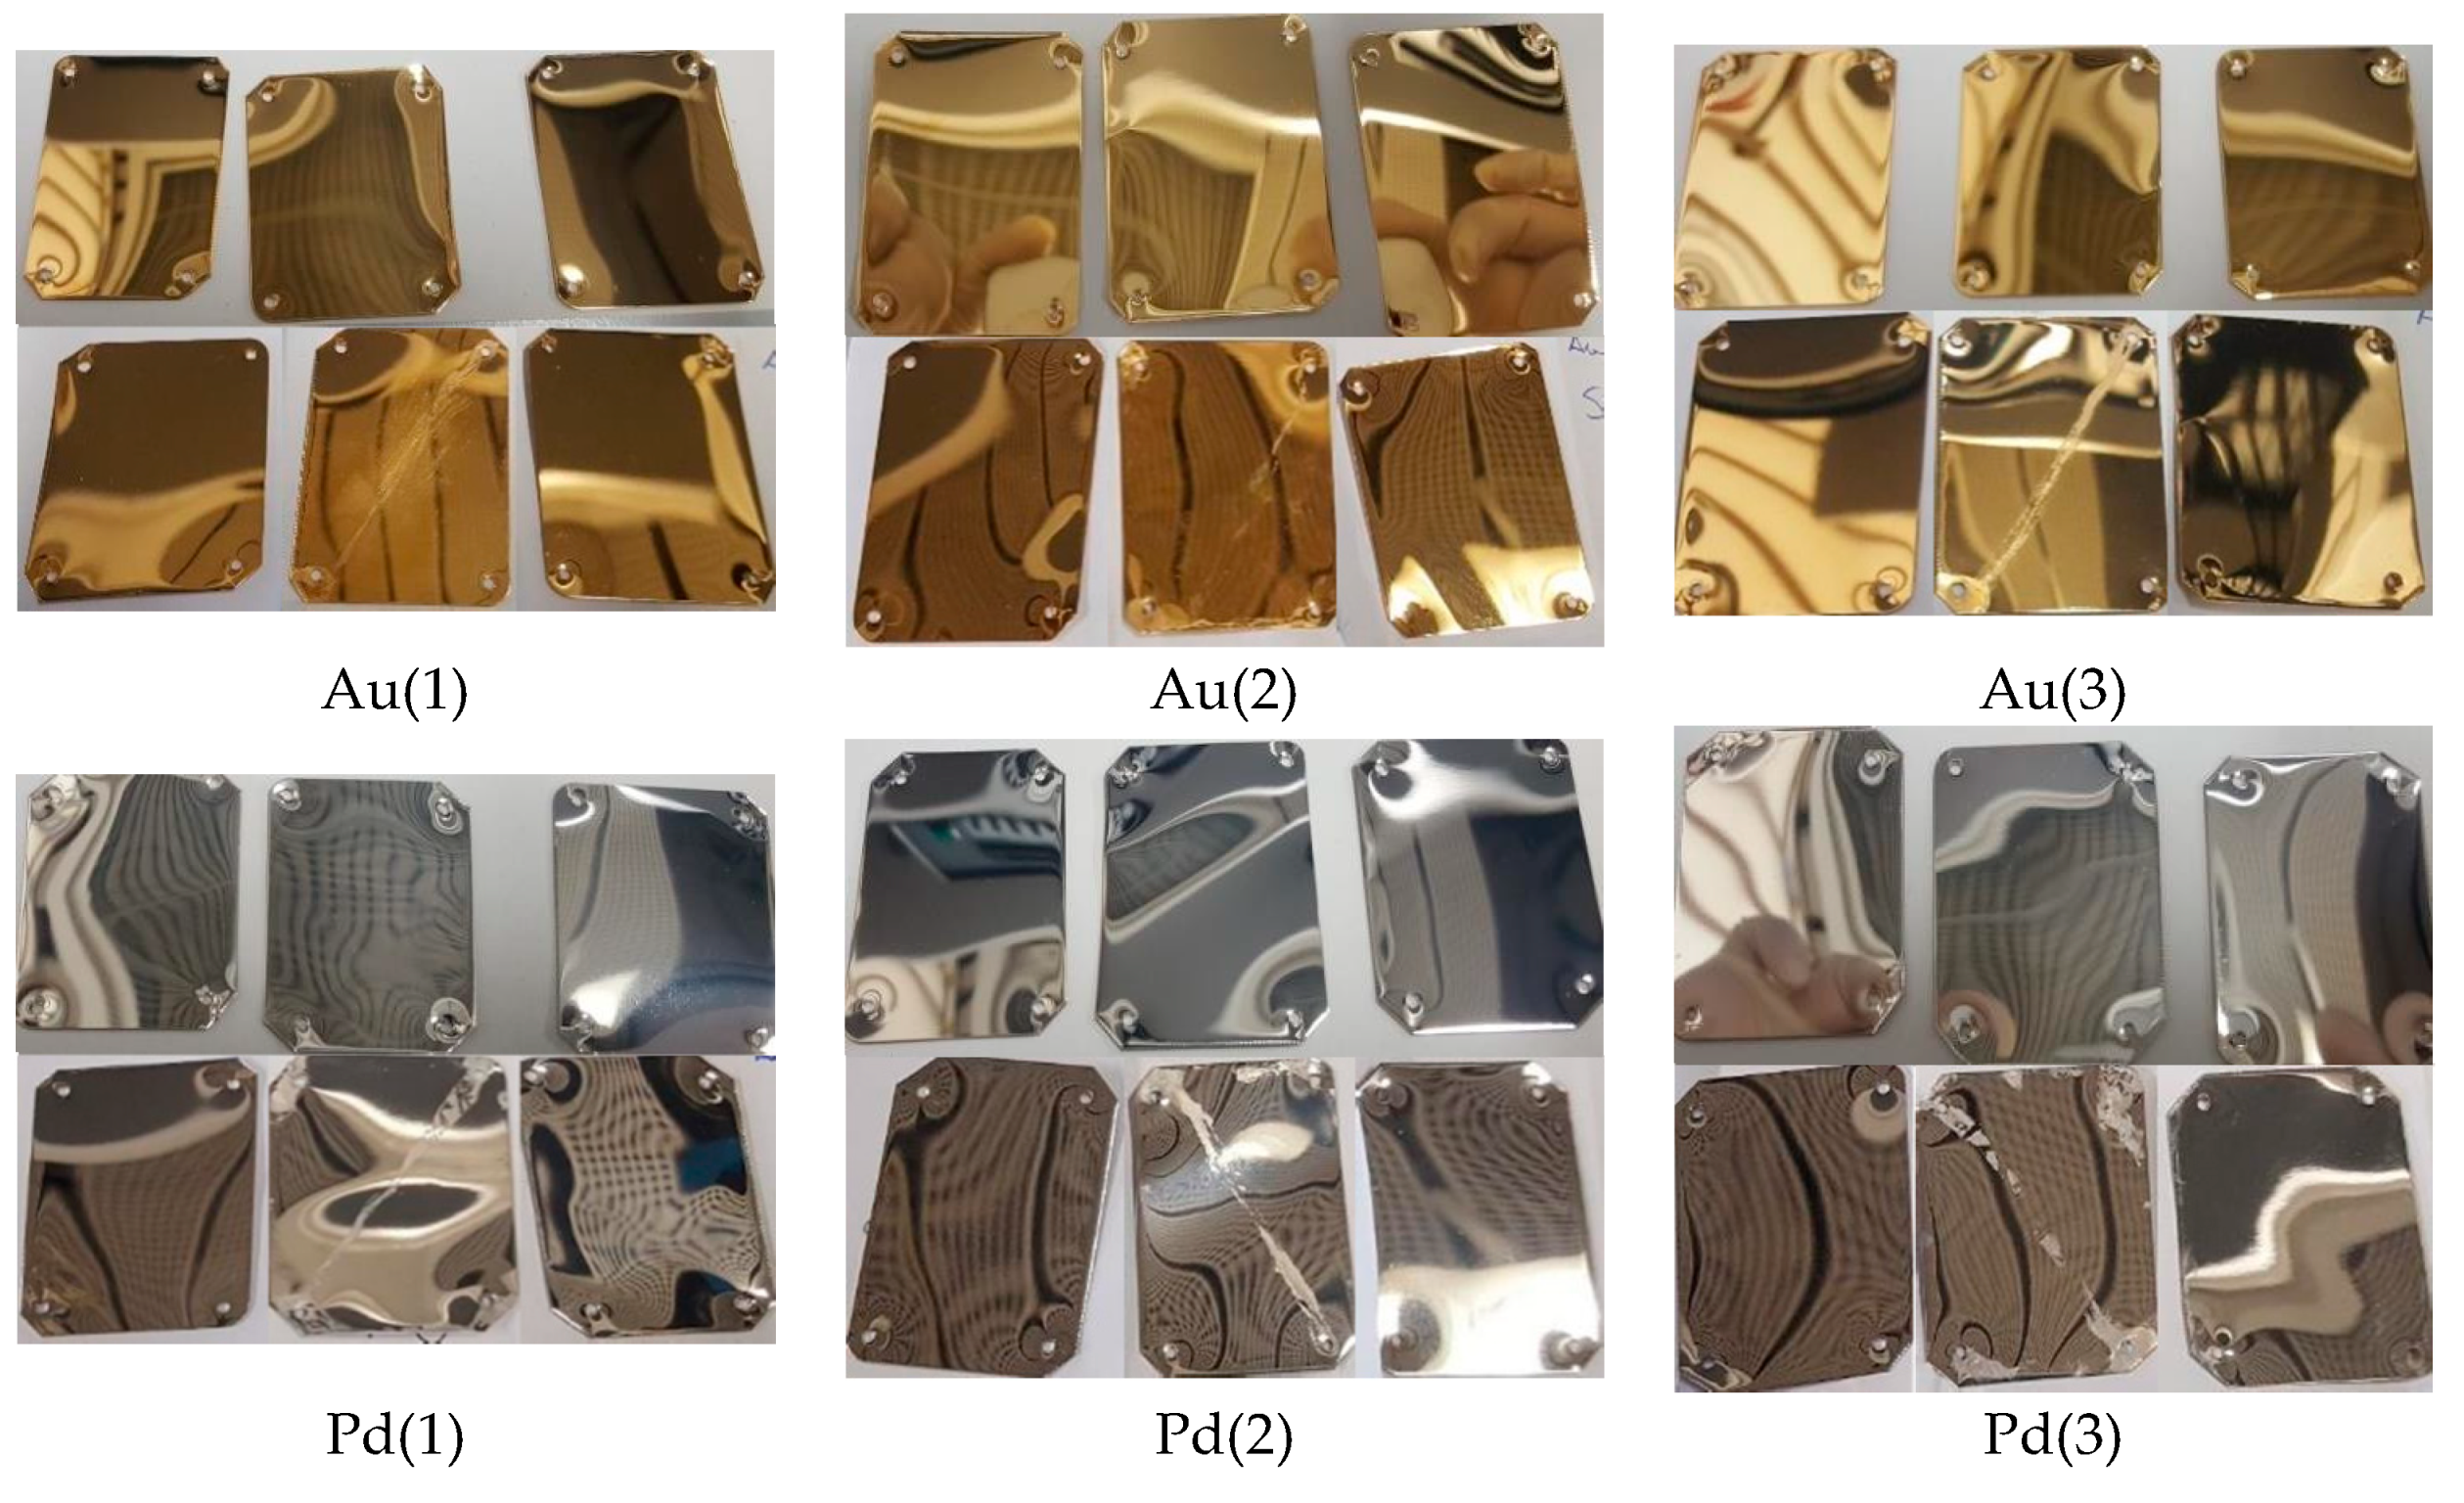
3.2. Classical Corrosion Tests

All the samples were subjected to three commonly used accelerating corrosion tests: damp heat, salt spray and sulphur dioxide (Figure 3). The coatings were so smooth and without imperfection that the damp heat test and sulphur dioxide were not able to attack even the samples with the coating of lower thickness. Only the samples exposed to salt spray exhibited some variation before and after the test: Gold samples with lower thickness appear more reddish and all the samples present a white line, due to the inclusion of the salt, along the diagonal because of their position in the test chamber, and a little amount of greenish salt was spotted near the holes (weak points) used to hang up the plates during the sample preparation. For this reason, we choose the salt spray test as reference to compare the results of the electrochemical tests.

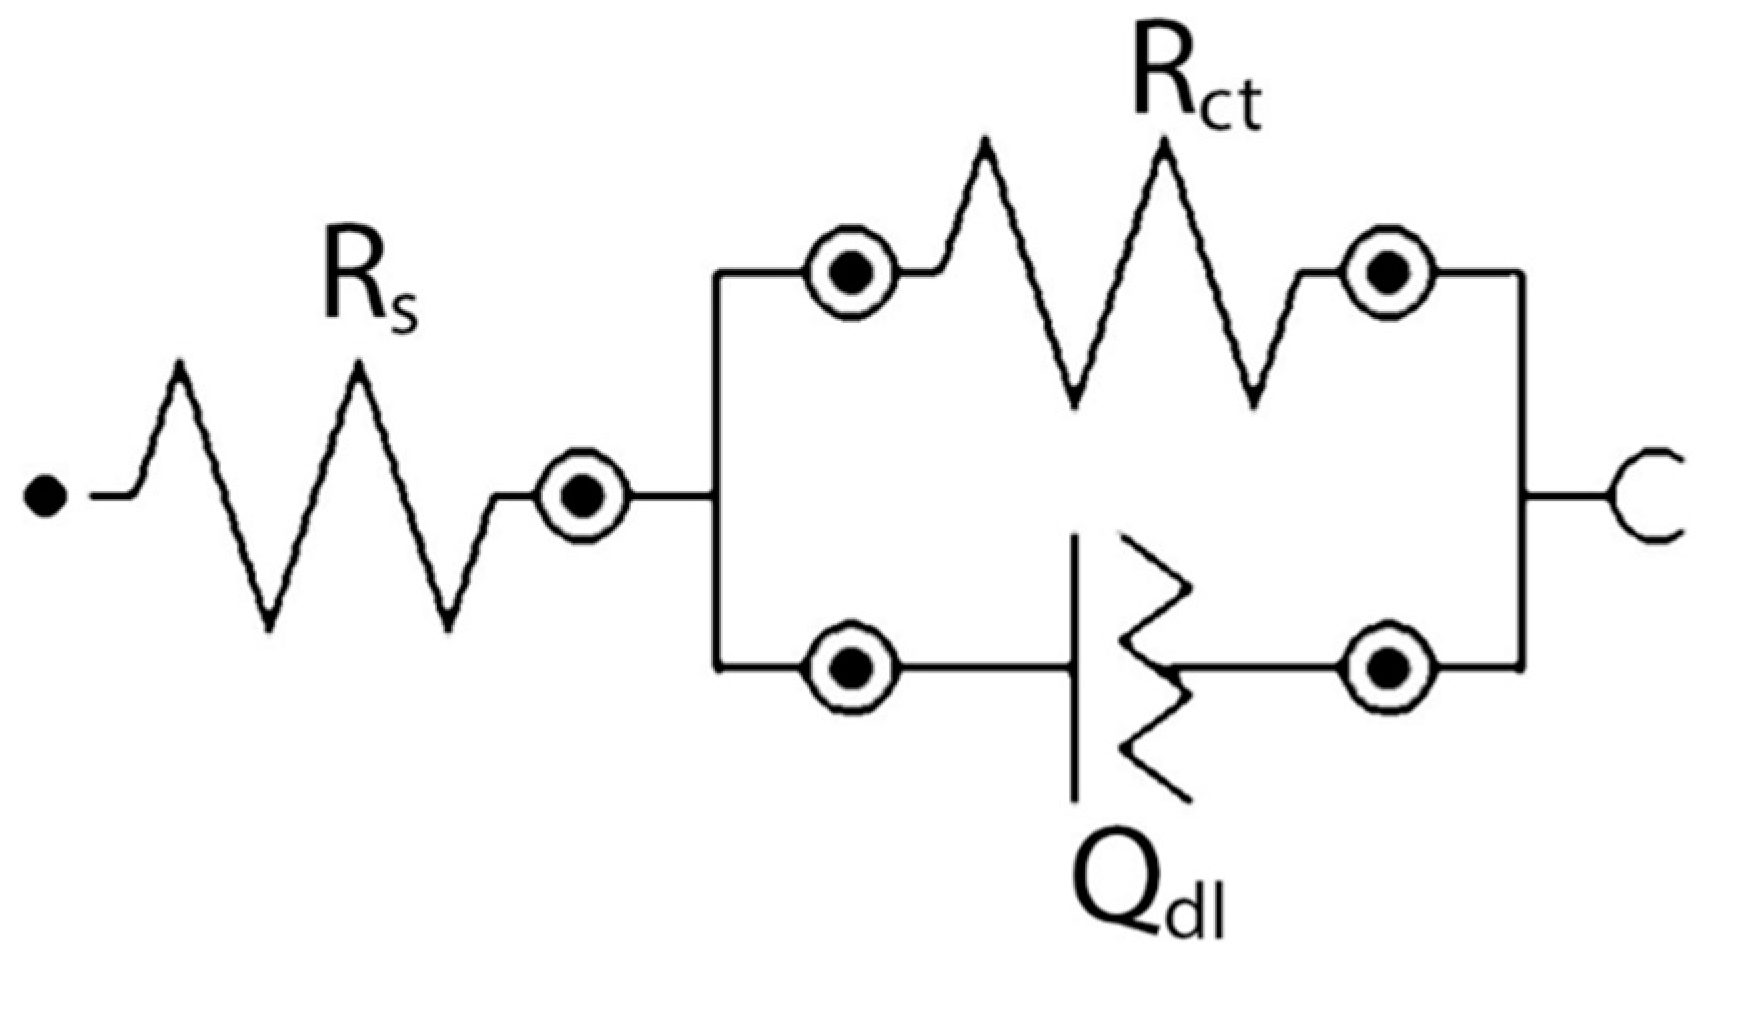
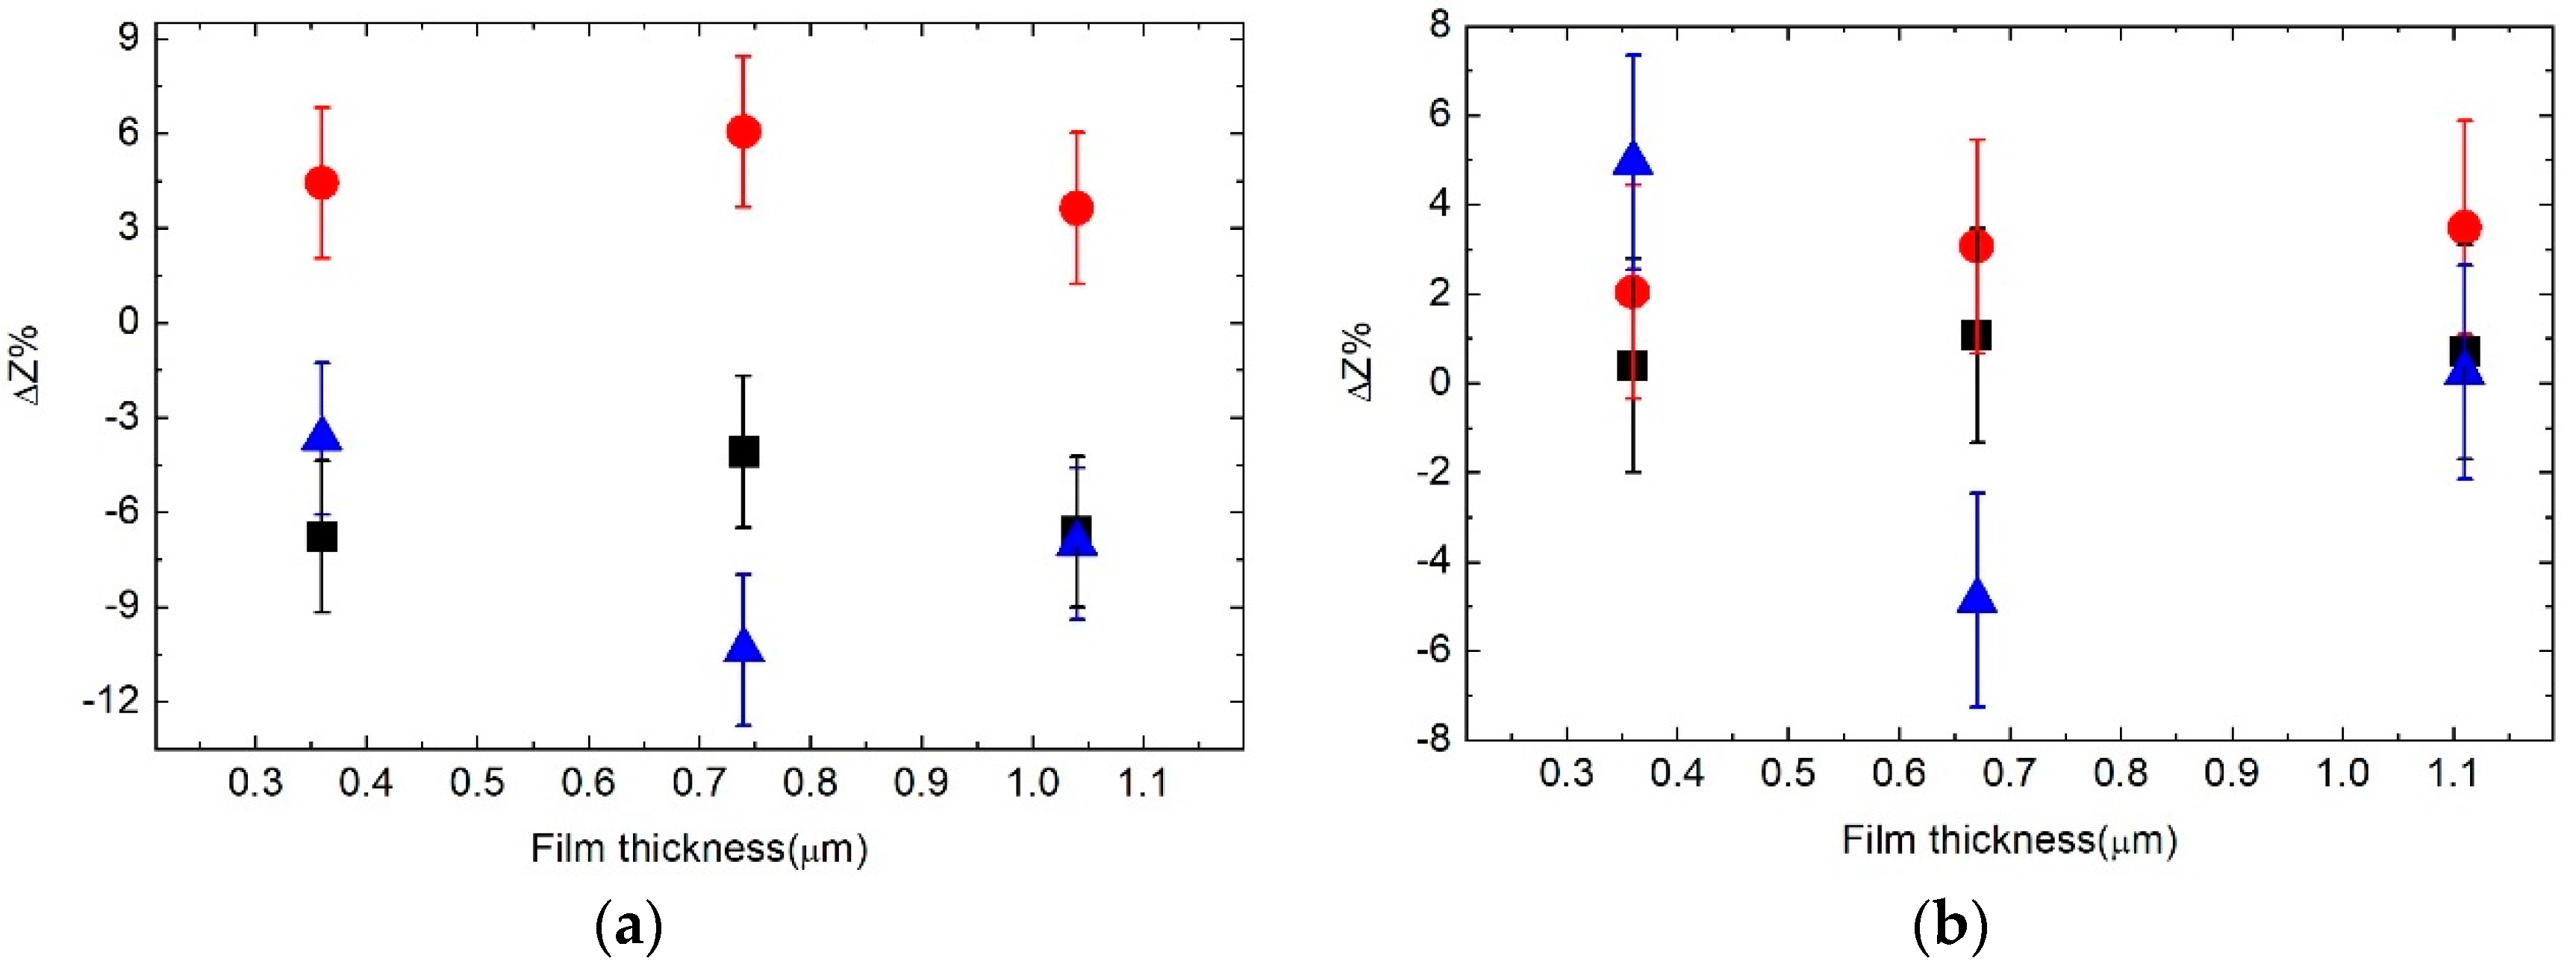
3.3. Elecrochemical Tests

The electrochemical tests was performed as follows: (1) 5 min OCP measurement; (2) initial EIS measurement; (3) repeated 12 times: Application of a stress potential for 30 min and charge sampling; 5 min relaxation and OCP measurement; (4) final EIS measurement.
We chose to limit the OCP measurement to 5 min to shorten the time needed for the complete test, also considering that the precious top coating reaches a stable goal quickly as seen in Figure 2a. The EIS measurements were performed at the OCP, with an amplitude of 0.01 V, from 100 kHz to 10 Hz with 10 samplings per decade. We chose to limit also the minimum frequency for the EIS analysis to 10 Hz [30,31] to perform a very fast measurement and also because the solution in which the measurements were made is very aggressive therefore long analysis times could lead to a modification of the surface due to over-stressing the samples. We chose two different stress potentials: +20 mV and +100 mV with respect to the last measured OCP. For all samples after the stresses no visual modification was observed even if their electrochemical behaviour changed. The corrosion was evaluated by recording three signals: Cumulative charge during the stresses (Figure 4), OCP before and after every stress (Figure 4), and EIS before and after the stresses. To compare the electrochemical tests and the salt spray test, the OCP and the EIS measurement were also performed on the samples subjected to the salt spray, before and after the test.
The charge measurement was used to obtain qualitative information of the corrosion resistance. In fact, a high amount of charge may be due to the oxidation of the coating and a low quantity of charge to resistance, however passivation will also lead only little currents passing. The amount of charge that pass in the gold samples is higher than for palladium, while the OCP is lower; except for Au(3), in all the samples the charge is higher for the treatments at +100 mV respect to +20 mV, as expected.
During the test at +20 mV for the Au(1) the charge tends to increase by one order of magnitude suggesting that modifications are taking place in on the surface, while the other two gold samples exhibit a stable trend. The OCP in these samples remains quite constant during the cycles. In all the gold samples, during the +100 mV stress, a high amount of charge was recorded in the first two cycles, then the current dropped. This behaviour was more evident for Au(3) than the other samples. In this case the OCP went up in the first two cycles and then fell back in the following ones, indicating that modification takes place on the surface. The palladium samples exhibit a similar trend during both the two stresses and for all the thicknesses: The amount of charge decreases ten times and the OCP increases during the cycles; this behaviour was ascribed to the passivation of the metal. This trend is more evident for the thinner samples.
The EIS data were fitted with the equivalent circuit reported in Figure 5 [30]: Rs represents the uncompensated ohmic resistance of the electrolyte; Rct the total resistance of the charge transfer, ideally infinite in a non-faradic EIS measurement; Qdl is a constant phase element (expressed with the terms Y0 and n) for the non-ideal capacitive response of the system and ideally represent the double layer capacitance.
The resulting parameters of the fitting are reported in Table 2 for each sample and stress. Considering the parameters Rct and Y0 it is possible to notice a general trend: In the Au samples Rct decreases after all the stresses (advising the intercalation of the solution in the layer below) while Y0 decreases after the 100 mV stress but increases after the 20 mV and salt spray test; on the other hand the Pd samples exhibit an increase of Rct after all the tests (probably due to the formation of a passive layer of palladium oxide and hydroxide) while Y0 remains almost constant. The intensity of the variation of the parameters could suggest the intensity of the corrosion suffered by the sample but more studies must be performed to investigate this aspect in depth.
We analyse the EIS measurement also in terms of impedance variation ΔZ% [3,30,31], that could offer a simpler interpretation of the results, respect to the single parameters values obtained from the equivalent circuit, in the optics of an application of this analysis at the industrial level. The data were treated considering the relative variation of the logarithmic value of the impedance module at the lowest frequency (10 Hz), named ΔZ%, as shown by Equation (1):
Δ Z % =   log ( | Z f | )   log ( | Z i | )   log ( | Z i | )
Figure 6a,b showed the results of the gold and palladium samples. It is possible to notice that the electrochemical tests are more consistent than the results obtained with the salt spray test, which appear more scattered. The results also confirm the previous deductions: The treatment at +20 mV does not attack significantly either of the two metals, in fact ΔZ% is close to 0 or even negative. Instead, after the application of +100 mV, all the samples have an increase in ΔZ%. However, there are not significant differences for different thicknesses of the same metal. This could be due to the fact that using ΔZ% the information about the real (resistance) and the imaginary (reactance) parts of the impedance are lost and so cannot be distinguished between corrosion and passivation.

4. Conclusions

In this paper we evaluate the corrosion of metal coatings using electrochemical methods. EIS is a common technique used to test passivated coatings and paints but there are not many studies to test the resistance of noble metal films. Currently these kind of samples are tested with long and destructive methodologies. In this study we experiment with three different thicknesses of commonly electroplated alloys in the precious galvanic industry: Gold films on bronze, and palladium on copper, namely a noble metal deposited on a not precious one. The results were also compared with more classical tests. The proposed method is not visually destructive, leading to numerical results (instead of visual comparison), the stress could be easily modulated and requires about 8 h (compared to the 24 or 48 h chemical tests), but could be even faster if the number of cycles is reduced or the potential stress increased. On the other hand, the interpretation of the results is not immediate, we evaluate the cumulative charge and OCP trends, EIS fitting results and ΔZ%. From the first two we obtained comparative qualitative results on the quality of the deposit. The fitted parameters obtained from EIS measurement shows a global trend increasing the stress and the coating thickness, but the interpretation is not trivial and probably not scalable at an industrial level. In our opinion ΔZ% is a good candidate to evaluate the corrosion of metal coatings: We found a trend in the results varying the stress and the thickness and the interpretation of the results is not complex. From the ΔZ% results we also appreciate how much electrochemical stress could be more modulable and predictable than with the salt spray test. Even if the proposed analysis shows high potentials, more research must be done on samples with different thicknesses and composition to find which parameter, or parameters, are more significant for a simple interpretation of metal film corrosion.

Author Contributions

Conceptualization, W.G.; Methodology, W.G.; Investigation, F.B.; Data Curation, W.G. and F.B.; Writing-Original Draft Preparation, W.G. and F.B.; Writing-Review & Editing, P.M., F.G., M.P., E.S. and A.D.L.; Supervision, W.G. and D.B.; Project Administration, M.I.; Funding Acquisition, M.I.

Funding

This research was funded by Regione Toscana POR CreO FESR 2014-2020—azione 1.1.5 sub-azione a1 Bando 2 “Progetti di ricerca e sviluppo delle MPMI” which made possible the project “Gioielli in Argento Da Galvanica Ecologica e Tecnologica” (GADGET) and “Tecnologia al plasma per l’industria del lusso: una manifattura innovativa nel comparto accessori in ottica 4.0” (THIN FASHION).

Acknowledgments

The authors acknowledge Metrohm s.r.l. for the technical support and the devices made available.

Conflicts of Interest

The authors declare no conflict of interest.

References

  1. ISO 16773:2016 Electrochemical Impedance Spectroscopy (EIS) on Coated and Uncoated Metallic Specimens; International Organization for Standardization: Geneva, Switzerland, 2016.
  2. ISO/TR 16208:2014 Corrosion of Metals and Alloys—Test Method for Corrosion of Materials by Electrochemical Impedance Measurements; International Organization for Standardization: Geneva, Switzerland, 2014.
  3. ISO 17463:2014 Paints and Varnishes—Guidelines for the Determination of Anticorrosive Properties of Organic Coatings by Accelerated Cyclic Electrochemical Technique; International Organization for Standardization: Geneva, Switzerland, 2014.
  4. ISO 3160-2:2015 Watch-Cases and Accessories—Gold Alloy Coverings—Part 2: Determination of Fineness, Thickness, Corrosion Resistance and Adhesion; International Organization for Standardization: Geneva, Switzerland, 2015.
  5. ISO 4538:1978 Metallic Coatings—Thioacetamide Corrosion Test (TAA Test); International Organization for Standardization: Geneva, Switzerland, 1978.
  6. ISO 4524-2:2000 Metallic Coatings—Test Methods for Electrodeposited Gold and Gold Alloy Coatings—Part 2: Mixed Flowing Gas (MFG) Environmental Tests; International Organization for Standardization: Geneva, Switzerland, 2000.
  7. ISO 17228:2015 (IULTCS/IUF 412) Leather—Tests for Colour Fastness—Change in Colour with Accelerated Ageing; International Organization for Standardization: Geneva, Switzerland, 2015.
  8. ISO 9227:2017 Corrosion Tests in Artificial Atmospheres—Salt Spray Tests; International Organization for Standardization: Geneva, Switzerland, 2017.
  9. Lee, S.J.; Pyun, S.I. Assessment of corrosion resistance of surface-coated galvanized steel by analysis of the AC impedance spectra measured on the salt-spray-tested specimen. J. Solid State Electrochem. 2007, 11, 829–839. [Google Scholar] [CrossRef]
  10. Poljacek, S.M.; Risovic, D.; Cigula, T.; Gojo, M. Application of electrochemical impedance spectroscopy in characterization of structural changes of printing plates. J. Solid State Electrochem. 2012, 16, 1077–1089. [Google Scholar] [CrossRef]
  11. Mendoza-Canales, J.; Marín-Cruz, J. EIS characterization of corrosion processes of titanium and alloy UNS N10276 in sour environments. J. Solid State Electrochem. 2008, 12, 1637–1644. [Google Scholar] [CrossRef]
  12. Rosalbino, F.; Scavino, G.; Mortarino, G.; Angelini, E.; Lunazzi, G. EIS study on the corrosion performance of a Cr(III)-based conversion coating on zinc galvanized steel for the automotive industry. J. Solid State Electrochem. 2011, 15, 703–709. [Google Scholar] [CrossRef]
  13. Femenias, Y.S.; Angst, U.; Moro, F.; Elsener, B. Development of a novel methodology to assess the corrosion threshold in concrete based on simultaneous monitoring of pH and free chloride concentration. Sensors 2018, 18, 3101. [Google Scholar] [CrossRef] [PubMed]
  14. Autolab Application Note COR08. Stepwise Dissolution Measurement. Available online: https://www.ecochemie.nl/download/Applicationnotes/Autolab_Application_Note_COR08.pdf (accessed on 15 February 2019).
  15. Autolab Application Note COR09. Electrochemical Impedance Spectroscopy of Three Coated Aluminum Samples. Available online: https://www.ecochemie.nl/download/Applicationnotes/Autolab_Application_Note_COR09.pdf (accessed on 15 February 2019).
  16. Afshar, F.N.; Tichelaar, F.D.; Glenn, A.M.; Taheri, P.; Sababi, M.; Terryn, H.; Mol, J.M.C. Improved corrosion resistance of aluminum brazing sheet by a post-brazing heat treatment. Corrosion 2016, 73, 379–393. [Google Scholar] [CrossRef]
  17. Díaz, B.; Freire, L.; Nóvoa, X.R.; Pérez, M.C. Electrochemical behaviour of high strength steel wires in the presence of chlorides. Electrochim. Acta 2009, 54, 5190–5198. [Google Scholar] [CrossRef]
  18. Gabrielli, C.; Keddam, M. Review of applications of impedance and noise analysis to uniform and localized corrosion. Corrosion 1992, 48, 794–811. [Google Scholar] [CrossRef]
  19. Gabrielli, C.; Maurin, G.; Mirkova, L.; Perrot, H.; Tribollet, B. Transfer function analysis of hydrogen permeation through a metallic membrane in a Devanathan cell. I. Theory. J. Electroanal. Chem. 2006, 590, 1–14. [Google Scholar] [CrossRef]
  20. Huang, H.H. Electrochemical impedance spectroscopy study of strained titanium in fluoride media. Electrochim. Acta 2002, 47, 2311–2318. [Google Scholar] [CrossRef]
  21. Loglio, F.; Innocenti, M.; D’Acapito, F.; Felici, R.; Pezzatini, G.; Salvietti, E.; Foresti, M.L. Cadmium selenide electrodeposited by ECALE: Electrochemical characterization and preliminary results by EXAFS. J. Electroanal. Chem. 2005, 575, 161–167. [Google Scholar] [CrossRef]
  22. Guidelli, R.; Foresti, M.L.; Innocenti, M. Two-dimensional phase transitions of chemisorbed uracil on Ag(111): Modeling of short- and long-time behavior. J. Phys. Chem. 1996, 3654, 18491–18501. [Google Scholar] [CrossRef]
  23. Pezzatini, G.; Moncelli, M.R.; Innocenti, M.; Guidelli, R. Comparative adsorption study of 1-butanol and 1-pentanol on mercury and gallium from aqueous 0.5 M Na2SO4 at 32 °C. J. Electroanal. Chem. 1990, 295, 275–290. [Google Scholar] [CrossRef]
  24. Becucci, L.; Innocenti, M.; Salvietti, E.; Rindi, A.; Pasquini, I.; Vassalli, M.; Foresti, M.L.; Guidelli, R. Potassium ion transport by gramicidin and valinomycin across a Ag(111)-supported tethered bilayer lipid membrane. Electrochim. Acta 2008, 53, 6372–6379. [Google Scholar] [CrossRef]
  25. Failli, P.; Bani, D.; Bencini, A.; Cantore, M.; Mannelli, L.D.C.; Ghelardini, C.; Giorgi, C.; Innocenti, M.; Rugi, F.; Spepi, A.; et al. A novel manganese complex effective as superoxide anion scavenger and therapeutic agent against cell and tissue oxidative injury. J. Med. Chem. 2009, 52, 7273–7283. [Google Scholar] [CrossRef]
  26. Innocenti, M.; Loglio, F.; Pigani, L.; Seeber, R.; Terzi, F.; Udisti, R. In situ atomic force microscopy in the study of electrogeneration of polybithiophene on Pt electrode. Electrochim. Acta 2005, 50, 1497–1503. [Google Scholar] [CrossRef]
  27. Cecconi, T.; Atrei, A.; Bardi, U.; Forni, F.; Innocenti, M.; Loglio, F.; Foresti, M.L.; Rovida, G. X-ray photoelectron diffraction (XPD) study of the atomic structure of the ultrathin CdS phase deposited on Ag(111) by electrochemical atomic layer epitaxy (ECALE). J. Electron. Spectrosc. Relat. Phenom. 2001, 114–116, 563–568. [Google Scholar] [CrossRef]
  28. Wang, L.; Lavacchi, A.; Bevilacqua, M.; Bellini, M.; Fornasiero, P.; Filippi, J.; Innocenti, M.; Marchionni, A.; Miller, H.A.; Vizza, F. Energy efficiency of alkaline direct ethanol fuel cells employing nanostructured palladium electrocatalysts. ChemCatChem 2015, 7, 2214–2221. [Google Scholar] [CrossRef]
  29. Giurlani, W.; Zangari, G.; Gambinossi, F.; Passaponti, M.; Salvietti, E.; Di Benedetto, F.; Caporali, S.; Innocenti, M. Electroplating for decorative applications: Recent trends in research and development. Coatings 2018, 8, 260. [Google Scholar] [CrossRef]
  30. Park, J.S.; Kim, H.J.; Lee, J.H.; Park, J.H.; Kim, J.; Hwang, K.S.; Lee, B.C. Amyloid beta detection by faradaic electrochemical impedance spectroscopy using interdigitated microelectrodes. Sensors 2018, 18, 426. [Google Scholar] [CrossRef]
  31. Cellere, G.; Bandiera, L.; Borgo, M.; De Toni, A.; Santoni, L.; Paccagnella, A.; Lorenzelli, L. A purely electronic method to measure transfection efficiency in a single-cell electroporation biochip. ECS Trans. 2007, 6, 1–11. [Google Scholar]
Figure 1. Atomic force microscopy (AFM) images of the electroplated substrates used for the determination of their roughness: (a) bronze; (b) copper. The roughness of the substrate must be very low in respect to the film thickness to ensure complete coverage.
Coatings 09 00405 g001
Figure 2. (a) Open circuit potential (OCP) measurement over 16 h of copper (black), bronze (red), palladium (blue) and gold (green). (b) Polarization curves recorded between −0.25 and +1.3 V respect to the OCP after 16 h copper (black), bronze (red), palladium (blue) and gold (green). The measurement was performed also after the measurement of the OCP for 1 h in the case of bronze (pink).
Coatings 09 00405 g002
Figure 3. Pictures of all the samples taken before and after the chemical corrosion tests. The three top images in each cell correspond to the before, while the after is on the bottom, the performed tests from left to right are: dump heat, salt spray and sulphur dioxide.
Coatings 09 00405 g003
Figure 4. Cumulative charge plot (a) and OCP variation (b) during the electrochemical stress of 30 min repeated 12 times. Au +20 mV (black), Au +100 mV (red), Pd +20 mV (blue), Pd +100 mV (green); (1) samples (solid line), (2) samples (dash line), (3) samples (dot line).
Coatings 09 00405 g004
Figure 5. Equivalent circuit used to fit the electrochemical impedance spectroscopy (EIS) data.
Coatings 09 00405 g005
Figure 6. Comparison after the +20 mV stress (black), +100 mV stress (red) and salt spray test (blue) of the calculated ΔZ% value for the gold (a) and the palladium (b) samples.
Coatings 09 00405 g006
Table 1. Composition and thicknesses of the samples measured with XRF.
SampleBase MetalCu (µm)Bronze (µm)Pd (µm)Au (µm)
Au(1)Brass>54.46 ± 0.620.36 ± 0.02
Au(2)Brass>54.46 ± 0.620.74 ± 0.09
Au(3)Brass>54.46 ± 0.621.04 ± 0.07
Pd(1)Brass>50.36 ± 0.07
Pd(2)Brass>50.67 ± 0.03
Pd(3)Brass>51.11 ± 0.06
Table 2. Electrical parameters of equivalent circuit attained by fitting the EIS data.
SampleStressEISRs (Ω)Rct (kΩ)Y0 (µF)n
Au(1)20 mVInitial14.97.711.350.80
Final11.61.418.500.76
100 mVInitial5.220.19.130.79
Final5.81.65.510.80
Salt sprayInitial10.518.614.150.83
Final15.76.430.810.69
Au(2)20 mVInitial13.210.53.920.87
Final13.58.77.960.76
100 mVInitial10.215.16.690.81
Final9.42.22.990.85
Salt sprayInitial13.127.45.630.82
Final11.73.320.160.67
Au(3)20 mVInitial7.151.75.840.83
Final5.75.210.310.78
100 mVInitial11.210.87.340.86
Final9.34.25.090.89
Salt sprayInitial12.321.06.150.85
Final7.019.917.530.71
Pd(1)20 mVInitial8.118.11.290.92
Final6.757.91.250.92
100 mVInitial14.515.72.080.93
Final12.023.92.220.88
Salt sprayInitial9.97.43.210.93
Final9.013.72.590.91
Pd(2)20 mVInitial15.122.41.990.95
Final14.433.82.090.93
100 mVInitial9.931.61.800.90
Final6.192.71.580.88
Salt sprayInitial12.420.92.500.91
Final8.921.43.890.88
Pd(3)20 mVInitial15.426.62.100.95
Final14.141.02.230.92
100 mVInitial7.122.31.820.91
Final7.5165.31.420.91
Salt sprayInitial11.123.92.650.92
Final12.645.02.580.92

