Article

Impact of Thermal Stress on Abrasive Dust from a Carbon Fiber-Reinforced Concrete Composite

1
Joint Mass Spectrometry Center, Chair of Analytical Chemistry, University of Rostock, 18059 Rostock, Germany
2
Department Life, Light & Matter (LLM), University of Rostock, 18051 Rostock, Germany
3
Department of Mechanical Process Engineering, Technical University of Dresden, Münchner Platz 3, 01187 Dresden, Germany
4
Medical Biology and Electron Microscopy Center, University Medical Center Rostock, Strempelstraße 14, 18057 Rostock, Germany
5
Joint Mass Spectrometry Center, Comprehensive Molecular Analytics, Helmholtz-Zentrum München, Ingolstädter Landstraße 1, 85764 Neuherberg, Germany
*
Author to whom correspondence should be addressed.
Submission received: 19 February 2022 / Revised: 15 April 2022 / Accepted: 24 April 2022 / Published: 26 April 2022
(This article belongs to the Topic Fiber-Reinforced Cementitious Composites)

Abstract

:
Recently, a novel corrosion-resistant construction material, Carbon Concrete Composite (C3), consisting of coated carbon fibers embedded in a concrete matrix, was introduced. However, thermal exposure during domestic fires may impact the release of organic pollutants and fibers during abrasive processing and/or demolition. Consequently, the objective of this study was to explore the emission characteristics of toxic compounds and harmful fibers during the dry-cutting after exposure to 25–600 °C (3 h, air). These parameters mimic the abrasive machining and dismantling after a domestic fire event. Mass spectrometry and chromatography served as analytical methodologies, and no organic pollutants for exposure temperatures ≥ 400 °C were found. In contrast, significant amounts of pyrolysis products from the organic fiber coating were released at lower temperatures. Studying the morphology of the released fibers by electron microscopy revealed a decrease in fiber diameter for temperatures exceeding 450 °C. At ≥550 °C, harmful fibers, according to the World Health Organization (WHO) definition, occurred (28–41 × 103 WHO fibers/m3 at 550–600 °C). This leads to the conclusion that there is a demand for restraining and protection measures, such as the use of wet cutting processes, suction devices, particle filtering masks and protective clothing, to handle thermally stressed C3.

1. Introduction

At present, concrete is the mainstay in the construction industry, and will remain so in the near future. Since the most commonly used steel bar-reinforced concrete is susceptible to corrosion, buildings have a limited lifetime of only about 40–80 years [1]. Indeed, corrosion-resistant alternatives are needed. Extensive research was conducted on identifying resilient and durable reinforcement materials such as asbestos [2,3], glass [4,5], basalt [5,6], or carbon fibers [7,8]. Although glass and basalt fibers have poor resistance against alkaline matrices such as the cementitious matrix [9,10], asbestos fibers were found to cause severe health impairments such as asbestosis or lung cancer [11]. Therefore, carbon fibers can be a promising reinforcement material for concrete composites.
A new carbon fiber-reinforced construction material called Carbon Concrete Composite (C3) has been developed since the 1990s by a cooperation of the Technical University (TU) Dresden and Rheinisch-Westfälische Technische Hochschule (RWTH) Aachen [12,13]. C3 consists of a grid- or rod-shaped reinforcement material made from continuous, unidirectional carbon fibers embedded in a concrete matrix [1,12,14]. The carbon fibers are produced from various organic precursor fibers such as polyacrylonitrile (PAN), pitch or cellulose, by (1) stabilizing them at 200–400 °C [1,15,16,17] under air atmosphere, (2) carbonizing them at 400–1600 °C [1,15,16,17] under inert nitrogen or argon [18] atmosphere and, if high tensile strength is required, (3) graphitizing at temperatures of up to 3000 °C [15,16,17]. As a result, carbon fibers with a carbon fraction of >98% [15] and ~7 µm diameter [12] are formed due to oxidation, cyclization and dehydrogenation of the precursor fibers [19,20]. A roving is formed with up to 48,000 carbon fibers combined and coated by an organic polymer matrix, such as a styrene-butadiene resin (SBR) or epoxy resin. The organic coating improves the grip between the reinforcement material and the concrete matrix to increase the stability of the resulting C3 material. Subsequently, rovings are combined in a weaving process to produce the reinforcement material. The resulting C3 material yields a five-fold higher tensile strength compared to steel bar-reinforced concrete and is expected to have higher longevity due to its corrosion resistance [12].
Construction materials are exposed to various stress situations during their lifecycle, such as weathering, abrasive processing, thermal recycling or domestic fires. However, only a limited number of studies address the release of chemicals or fibers, as observed for asbestos concrete [21], and its linked health impacts in these scenarios. Weiler and Vollpracht (2019) [22] studied the release of heavy metals and trace elements leached from C3 during wet weathering, but found concentrations considered that were not environmentally harmful. Bienkowski et al. (2018) [14], Hillemann et al. (2018) [12], and Koch et al. (2021) [23] showed that no harmful fibers were formed during crushing and cutting processes of C3. According to the World Health Organization (WHO), biopersistent, inorganic fibers with length >5 µm, diameter <3 µm and a length-to-diameter ratio >3 are considered to be harmful to human health [24]. However, carbon fibers with ~7 µm diameter in the total dust fraction were found, and a considerable amount of inhalable particulate matter (PM) fraction PM10 (aerodynamic diameter ≤ 10 µm) was released during dry-cutting of C3 [23]. Furthermore, Hillemann et al. (2018) [12] and Koch et al. (2021) [23] found organic compounds in the gas phase and in the inhalable PM fractions PM2.5 (aerodynamic diameter ≤ 2.5 µm) and PM10, posing health risks associated with exposure. These compounds resulted from pyrolysis of the organic matrix of the reinforcement material at the saw blade edge during dry-cutting.
In contrast, the impact of thermal stress during domestic fires or thermal recycling on the abrasive dust from cutting C3 materials has not been investigated yet. However, the thermal behavior of carbon fiber-reinforced plastics (CFRPs) with a comparable composition as C3 reinforcement materials is well studied. No changes in the surface morphology of fibers or mass loss due to fiber degradation were found in scanning electron microscopy (SEM), and thermal analysis (TA) experiments at temperatures below 800 °C under N2 atmosphere [25,26,27]. However, these fibers are coated by a pyrolytic carbon layer resulting from the degradation of the polymer matrix. This layer can impair the bonding properties of recycled fibers with their new matrix [25]. Oxygen-containing atmospheres can remove the pyrolytic carbon from the fiber surface due to oxidation, potentially altering the fiber morphology and structure [25,26,27,28,29,30,31]. Degradation effects, such as localized fiber oxidation and pitting processes [28,30,31] or total mass loss [25,27], were observed at a broad temperature range between >540 °C (Yatim et al. (2020) [26]) and >700 °C (Tranchard et al. (2017) [27]).
The aim of this study was to investigate the impact of thermal stress on the release of toxic organic pollutants and harmful fibers during abrasive processing of a C3 material. This experimental design primarily mimics the building demolition scenario after a domestic fire event. Moreover, this study may also act as a proxy for abrasive processing after recycling under oxidative conditions, e.g., to remove the pyrolytic carbon layer. For this purpose, chemical speciation techniques, such as mass spectrometric detection of volatile organic products, and electron microscopy, to study fiber morphology, were deployed. Furthermore, this study was motivated by giving advice regarding the personal protective equipment and the general health risk of construction workers involved in the demolition of C3-reinforced buildings after domestic fires. It is expected that elevated temperatures will affect the organic composition and fiber morphology of the C3 reinforcement materials. This may have an impact on the toxic profile of PM formed during subsequent abrasive processing. Particularly, morphological investigations were of interest, as a study of Černý et al. (2007) [32] on cement reinforced with short, disordered pitch-based carbon fibers treated at 600 and 1000 °C (air atmosphere, 1 h), and preliminary studies on thermally stressed C3, showed a decrease in fiber diameter and, thus, an increased health concern.

2. Materials and Methods

2.1. Samples and Equipment

A C3 material reinforced with an epoxy resin-coated carbon grid of the type “solidian GRID Q95/95 CCE-38” manufactured by Solidian GmbH (Albstadt, Germany), and its concrete reference, were studied. The carbon fibers of the reinforcement material were made from PAN precursor fibers. Concrete plates were manufactured in a pouring process. The concrete was poured into a 175 mm × 295 mm × 15 mm cuboid form. One layer of the reinforcement grid was centered in the concrete and the plates were stored in a dry environment. It was always ensured that the reinforcement material was completely covered by concrete. To expose the concrete plates to thermal stress, a muffle furnace of the type “L9/S27” from Nabertherm GmbH (Lilienthal, Germany) was used. The reinforcement material, and a C3 sample before and after thermal exposure, are shown in the Supplementary Material (Figure S1b,c).
For homogenization of thermally stressed reinforcement materials, required for chemical analysis, a cryomill of the type “6750 Freezer/Mill” from SPEX Certiprep Inc. (Metuchen, NJ, USA) was used. Cutting of thermally stressed C3 was performed using an “Abrasive Dust Generator” from Vitrocell Systems GmbH (Waldkirch, Germany) equipped with a diamond saw blade. To measure particle size distributions of the PM formed during the dry-cutting process, a laser aerosol particle sizer “LAP322” from Topas GmbH (Dresden, Germany) was used (Figure S1a). Filter samples were collected using a filter control device “LVS3.1” from Comde-Derenda GmbH (Stahnsdorf, Germany). Quartz fiber (47 mm, grade T293) and methylcellulose filters (47 mm, 1.2 µm) were purchased from Munktell and GE Healthcare Life Sciences, respectively. Quartz fiber filters were heated at 550 °C for 12 h prior to sampling. Gases were purchased with a purity of >99.9% and used without further purification. Samples were stored at –20 °C until analysis.

2.2. Sample Preparation

2.2.1. Thermal Stress

Concrete plates were heated in the muffle furnace under air atmosphere with a temperature ramp of 1.5 K/min and held at the final temperature for 3 h. Directly thereafter, the concrete plates were removed from the muffle furnace and allowed to cool under air atmosphere (cooling period of 24 h) until room temperature was reached. These conditions were sufficient to prevent cracking of the concrete and, thus, an increase in oxygen transportation rate from the concrete surface towards the reinforcement material, achieving high repeatability. Three C3 plates were heated to 25, 100, 200, 250, 300, 312, 325, 338, 350, 400, 450, 500, 550, and 600 °C (14 temperatures, n = 3). Furthermore, three concrete reference plates were heated to 25, 325, and 600 °C (3 temperatures, n = 3). C3 reinforcement materials were mechanically separated from thermally stressed C3 and homogenized using the cryomill (Supplementary Material, Section S2).

2.2.2. Dry-Cutting Simulation

Thermally stressed concrete and C3 plates were cut in a dry-cutting simulation using the Abrasive Dust Generator as described earlier by Koch et al. (2021) [23]. An illustration of the dry-cutting simulation arrangement is provided in the Supplementary Material (Figure S1a). Dry-cutting was performed with a sawblade rotation of 50 Hz, cutting depth of 10 mm and cutting speed of 0.1 mm/s for 15 min. It was always ensured to cut along and through the rovings at their full depth to produce concentrations of organic compounds and fibers comparable to realistic demolition scenarios. To obtain reproducible aerosols, the sampling process was started when the deepest point of the saw blade entered and stopped before the foremost point of the saw blade left the concrete plate. The inhalable PM fractions PM2.5 and PM10 were collected with a flow rate of 1.0 m3/h on quartz fiber filters for chemical analysis and methylcellulose filters for morphological analysis using PM2.5 and PM10 impactors. One quartz fiber filter and one methylcellulose filter per PM fraction and concrete plate were collected to gather information about the repeatability of the whole sampling process, including the thermal stress period.

2.3. Analytical Methods

2.3.1. Online Particle Size Determination

Particles produced during dry-cutting of thermally stressed concrete plates were determined online by the laser aerosol particle sizer in order to obtain information about the particle size distribution and concentration, as described earlier by Koch et al. (2021) [23]. Particle size distributions and concentrations/cm3 × minute were recorded and averaged over the whole sampling period. Scattered light-equivalent diameters of particles measured by this method are limited to a range from 0.2 to 40 µm and concentrations below 104 particles/cm3. Calibration was performed using 13 monodisperse particle size standards containing spherical polystyrene latex (ISO 21501).

2.3.2. Pyrolysis Gas Chromatography—Mass Spectrometry

Pyrolysis gas chromatography (Py-GC) was applied as a standard technique to investigate the organic composition of the homogenized reinforcement materials mechanically separated from the thermally stressed C3. Therefore, roughly 0.2–0.9 mg of the homogenized reinforcement material was injected into the pyrolyzer (model PY-2020iD, Frontier Laboratories) connected to a HP 6890 gas chromatograph mass spectrometer. The sample was pyrolyzed at 500 °C for 1 min. Evolved gases were separated by an SGE-BPX5 column (30 m × 250 µm I.D. × 0.30 µm film) using the following temperature program: hold for 5 min at 40 °C, ramp to 330 °C with 10 K/min, and hold for 10 min. Mass spectrometric detection of the effluent gases from the column was performed by 70 eV electron ionization (EI) and analysis by a quadrupole (Q) mass analyzer. Mass spectra were recorded in scan mode from m/z 40 to 500 [33,34,35] (details in Supplementary Material, Section S3.1).

2.3.3. Thermal Analysis—Mass Spectrometry

A thermobalance (TG 209, Netzsch Gerätebau, Selb, Germany)) was hyphenated to a modified Bruker GC-APCI II source. Atmospheric pressure photoionization (APPI) performed by a Kr vacuum ultraviolet lamp preserving the molecular pattern was used as a soft ionization technique [36]. Thermal analysis was carried out with a constant nitrogen flow of 200 mL/min holding the temperature isothermal for 2 min at 20 °C, raising to 600 °C with 10 K/min, and holding for 10 min at 600 °C. Evolved gases were transferred into the ion source of the mass spectrometer via a 280 °C interface and 280 °C transfer line. Mass spectrometric detection was carried out with a Bruker Apex II ultra FTMS equipped with a 7 T superconducting magnet recording from m/z 100 to 1000 with a two-second transient length (4M datapoints), achieving a resolving power of roughly 300,000 at m/z 400. Time-resolved broadband spectra, each with ten summed micro scans, were recorded. Time-resolved processing and sum formula calculation was performed using Bruker DataAnalysis 5.1 for m/z precalibration of the summed mass spectra and a self-written tool CERES based on in-house MATLAB scripting (R2018b). Elemental composition attribution for MS spectra was performed with the following restrictions: #C 2–100, #H 4–200, #N 0–2, #O 0–6, #S 0, H/C ratio 0.4–2.4, ring and double bond equivalent (DBE) 0–30, and a maximal sum formula error of 1 ppm. A detailed description of the setup and methodology can be found elsewhere [35,37] (details in Supplementary Material, Section S3.2).

2.3.4. Thermo-Optical Carbon Analyzer—Mass Spectrometry

Filter punches with an 8 mm diameter were taken from the quartz fiber filter samples obtained during the dry-cutting simulation of thermally stressed concrete and measured according to the Improve A protocol [38] with a thermo-optical carbon analyzer (TOCA) of the type “Model 2001 A” from Desert Research Institute (Reno, USA). This technique yields information about the carbon composition of the inhalable PM by thermally releasing carbon-containing compounds from the PM, oxidizing them to carbon dioxide and subsequently reducing the CO2 to methane, which is measured by a flame ionization detector (FID). A detailed description of the setup and analysis principle can be found elsewhere [23,39,40,41]. Organic carbon (OC) was released during four thermal fractions (OC1, OC2, OC3, and OC4) in helium atmosphere at 140, 280, 480, and 580 °C, respectively. By adding 2 v-% oxygen, elemental carbon (EC) was oxidized to CO2 and evolved in three thermal fractions (EC1, EC2, and EC3) at 580, 740, and 840 °C, respectively. Optical correction of pyrolyzed OC was performed by measuring the filter reflectance using a laser with a wavelength of 635 nm. A decrease in laser reflectance after OC2 for C3 samples exposed to temperatures ≤350 °C indicated enhanced pyrolysis of organic matrix molecules during analysis of these samples. Hence, OC1 and OC2 were combined to form the fraction thermal desorption OC. Since the fractions OC3 and OC4 most likely contain pyrolysis compounds formed during the analysis procedure, those fractions were neglected. To ensure a sufficient comparability of all samples, C3 samples exposed to temperatures >350 °C prior to abrasive treatment were treated equally during data evaluation, although no decrease in laser reflectance was observed.
To gather further information about the organic composition of the inhalable PM fractions formed during dry-cutting of thermally stressed C3, the TOCA was hyphenated to a photo ionization mass spectrometer (PIMS) [39,40,41]. Resonance-enhanced multiphoton ionization (REMPI) [42,43,44] using a wavelength of 248 nm is an efficient technique to obtain information about the aromatic constituents in abrasive PM from C3 [23]. Thus, this wavelength produced by a krypton fluoride excimer laser of the type PhotonEx (Photonion GmbH, Schwerin, Germany) and a repetition rate of 500 Hz was used in this study. The formed ions were analyzed by an orthogonal accelerated time-of-flight (oa-Tof) analyzer with an extraction rate of 20 kHz into the mass analyzer. The TOCA-PIMS coupling was manufactured by Photonion GmbH (Schwerin, Germany).

2.3.5. Scanning Electron Microscopy

C3 reinforcement materials were mechanically separated from thermally stressed C3 and cropped to ~1 cm long segments. Methylcellulose filters were prepared for SEM measurements by carefully cutting out a circular segment of about 4 cm2. The samples were mounted on Al-SEM-carriers with adhesive conductive carbon tape (PLANO GmbH, Wetzlar, Germany). To minimize the induction of a charging process, the reinforcement materials were coated under vacuum with a thin carbon layer of about 5 nm, and the filter samples were sputtered with a 1–2 nm platinum layer using a CCU 010 HV-coating device (Safematic GmbH, Zizers, Switzerland) and a SCD-040 sputtering device (Bal-Tec, Pfäffikon, Switzerland), respectively. SEM measurements were performed with field emission devices of the type MERLIN® VP Compact (Zeiss, Oberkochen, Germany, acceleration voltage 5 kV, operating distance 11 mm) and GeminiSEM 300 (Zeiss, Oberkochen, Germany, acceleration voltage 2 kV, operating distance 5 mm), respectively.
Quantification of harmful WHO fibers was conducted in accordance with the VDI guideline 3492 [45]. To eliminate fluctuation in the WHO fiber concentration when cutting several thermally stressed C3 plates, 60–70 fibers on each filter were counted and sized, analyzing 33% of the filter area using a 2000× magnification. Hence, in total, at least 180 fibers per exposure temperature were considered by performing three cuts through C3 plates that were thermally stressed independently from each other.

2.3.6. Statistical Evaluation

Released particle concentrations were divided into four sizing groups according to their scattered light-equivalent diameter described in Section 3.1. Particle concentrations of the different sizing groups were compared for all samples. Particle concentrations for each sizing group, and fiber dimensions including length, diameter and length-to-diameter (L/D) aspect ratio, were additionally compared between all samples. Statistical evaluation was performed by a two-sided Student’s t-test. Significance was accepted with p ≤ 0.05.

3. Results and Discussion

3.1. Particle Size Distribution

Concentrations of particles formed during abrasive machining of C3 and concrete are shown in Figure 1. The particles were categorized by their scattered light-equivalent diameter into the following groups: 0.2–0.5 µm, 0.5–1.0 µm, 1.0–2.5 µm, and 2.5–10.0 µm. Particles with diameters >10 µm are negligible. Furthermore, the ratio between fine particles with 0.2–1.0 µm diameter and larger particles with 1.0–10.0 µm diameter is indicated. According to the literature [46,47], PM with aerodynamic diameters of ≤2.5 µm (PM2.5) and ≤10 µm (PM10) can penetrate into the alveolar and tracheobronchial regions of the mammal respiratory system, respectively. Thus, those are considered to have the largest impact on the toxicity of PM. Concentrations of PM with equivalent scattered light-equivalent diameters as PM2.5 (0.2–2.5 µm), PM10 (0.2–10.0 µm) and total PM (0.2–40 µm) are summarized in Table 1.
During abrasive processing of C3 exposed to 25 °C, the concentration of fine particles (0.2–1.0 µm in diameter) is 1.5× higher compared to larger particles (1.0–10.0 µm in diameter). At 400 °C, the concentration of fine particles increases slightly (p = 0.0005, reference: 350 °C), while the number of larger particles decreases (p = 0.0002, reference: 350 °C). Exposure to temperatures ≥450 °C leads to a slight decrease in the concentration of fine particles (p = 0.002, reference: 400 °C) in the 0.5–1.0 µm diameter group. In contrast, the concentration of larger particles decreases more severely (p = 0.002, reference: 400 °C) in the 1.0–2.5 µm and the 2.5–10.0 µm diameter groups. These effects lead to an overall increase in the ratio between fine particles and larger particles from 1.5 at 25 °C to 4.1 at 550 °C. However, the concentration of particles in all size groups released during dry-cutting of C3 decreases when C3 is exposed to ≥450 °C prior to abrasive processing.
Concrete without reinforcement materials exposed to temperatures of 600 °C also shows a significant (p = 1 × 10⁻¹⁵) increase in the ratio between fine particles and larger particles from 1.6 at 25 °C to 3.5 at 600 °C. This is due to a larger decrease in the concentration of larger particles compared to the 0.2–1.0 µm diameter fraction. Hence, those effects cannot be solely assigned to C3 materials. Nonetheless, the released concentration of total PM during dry-cutting of concrete is considerably smaller (p = 1 × 10⁻¹¹) compared to C3, when the material is exposed to 325 °C prior to abrasive machining. At 300–350 °C, the organic coating of the reinforcement material pyrolyzed (Section 3.2). Thus, the reduced particle concentration released at 325 °C may be affected by the pyrolysis of the organic coating of the reinforcement material. However, the data gathered in this study are not sufficient to fully investigate this effect.
It must be acknowledged that the measurement of scattered light-equivalent diameters is dependent on the particle shape, the absorption potential, and the angle between light and particle [48]. The released aerosols formed during dry-cutting contained a mixture of rather spherical and non-spherical concrete particles, and fibrous carbon particles. Hence, artifacts due to the measurement method can occur and an underestimation of particle diameters cannot be excluded.

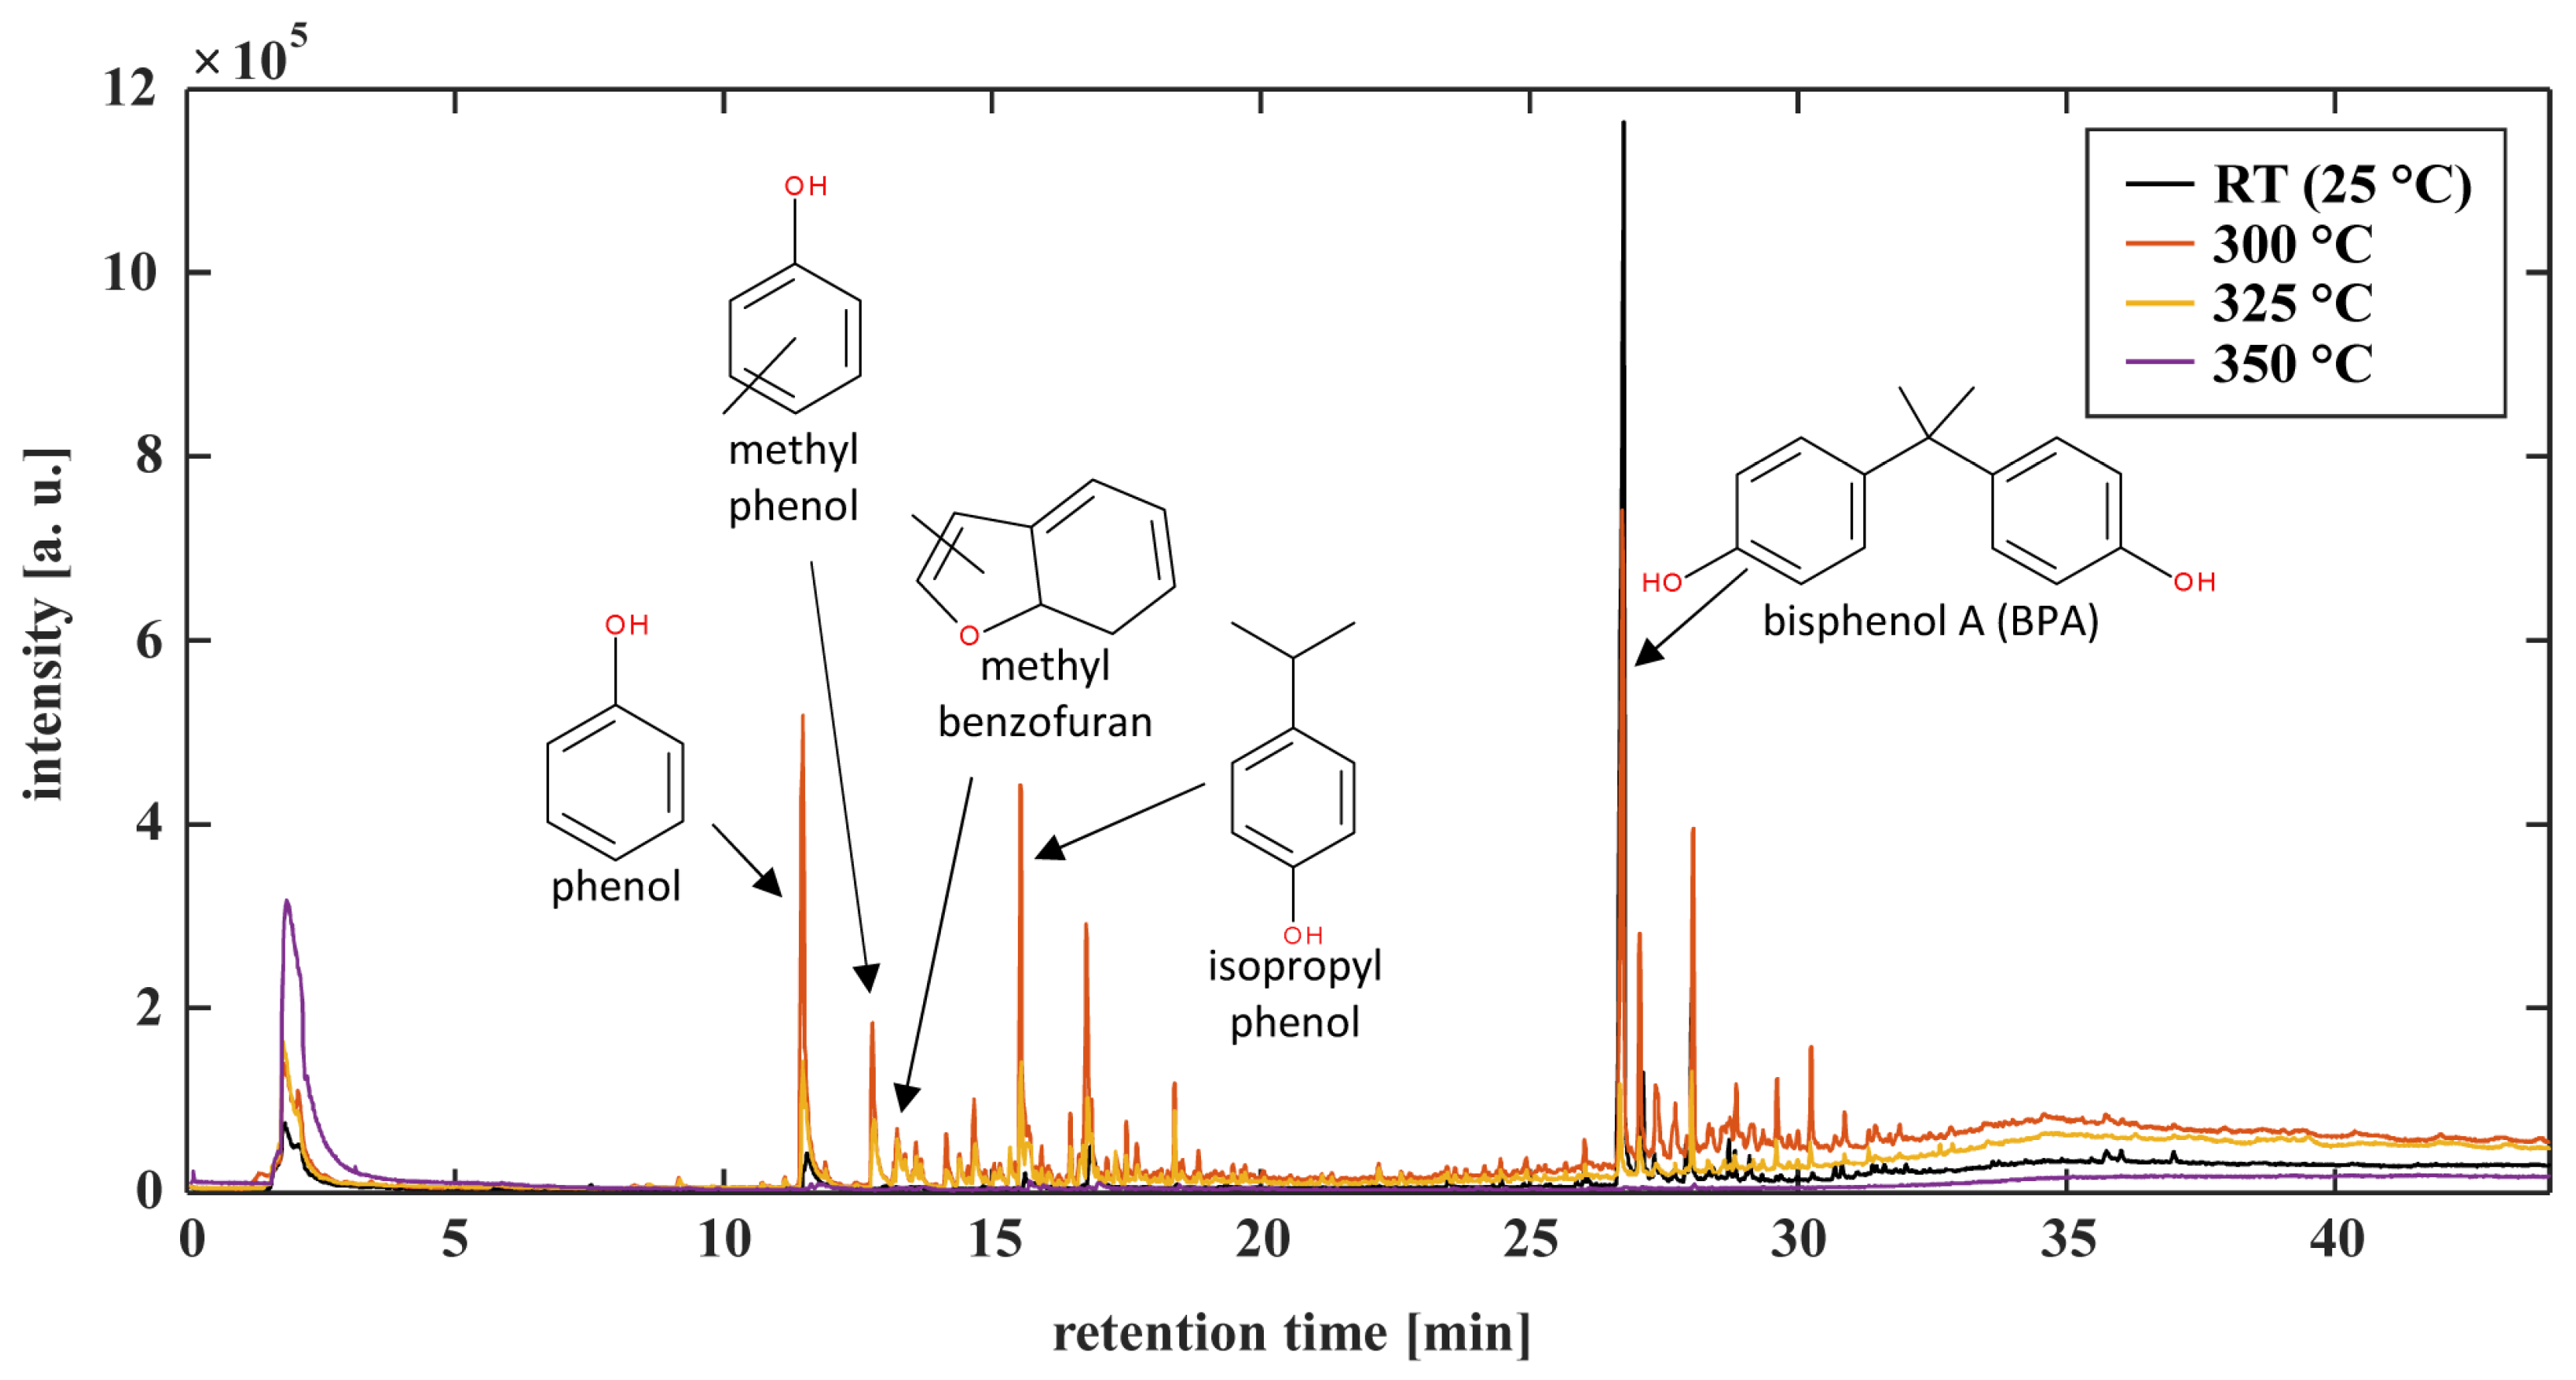
3.2. Organic Composition

The thermally treated samples were analyzed using various analytical techniques to determine the differences in the organic composition before and after the cutting process. A simple way to determine chemical compounds on the carbon fibers is thermal analysis. It becomes clear that after treatment of ≥400 °C for an extended time period of several hours, no organic molecules can be detected to evaporate from the fibers (Figures S2 and S3). Below this temperature, the fraction of evaporable compounds increases (Table 2). Therefore, the fibers treated with 350 °C and lower temperatures are within the focus of chemical analysis. It is noticeable that while the evaporable fraction decreases with increasing exposure temperature, the number of sum formulae increases. During the thermal exposure period, partial pyrolysis of the organic coating of the reinforcement material results in the evaporation of small pyrolysis products and, thus, a reduction in the ratio between the organic coating and carbon fibers. Furthermore, non-evaporable pyrolysis products of the organic coating are formed during the thermal exposure period. In subsequent thermal analysis, those pyrolysis products and the remaining organic coating material are pyrolyzed, leading to a more complex pyrolytic degradation pathway. As a result, the number of sum formulae increases although the evaporable fraction decreases.

3.2.1. Organic Composition of Reinforcement before Cutting

Evolved gas analysis [49] is a useful tool for the investigation of fiber-reinforced plastics (FRPs) [50,51]. In this process, the polymer matrix is thermally degraded into smaller components, which are subsequently analyzed using a spectrometric/spectroscopic method. Herein, Py-GC-EI-QMS was used for this purpose. The corresponding total ion count (TIC) chromatogram is shown in Figure 2. Two regions of interest (10–20 min/26–32 min) can be seen for the different samples. In the first region (Figure S5), almost exclusively small compounds are observed for the thermally treated materials, which do not occur in the room temperature sample. The authors hypothesize that these smaller constituents are thermal fragments, primarily from the coating material. Structural assignment of these released chemicals was carried out by the hard electron ionization fragment pattern and database matching (Table S1). The various phenols originate from the thermal degradation and release of bisphenol A (BPA), which is used as a building block in the polymer matrix (BPA as dominant peak: 26.74 min, Figure 2). Presumably, rearrangements occur at about 300 °C under the influence of oxygen, which favors the formation of smaller molecules during pyrolysis at elevated temperatures. Since the fiber diameter does not change at these temperatures (Section 3.3.1), a significant influence on the carbon fibers can be excluded.
The second region (26–32 min, Figure S6) primarily belongs to the resin matrix coating components. The main component BPA can be identified as the base peak. In addition, several other intense compounds are present and elute after the BPA signal. Based on manual investigation of the fragmentation pattern, these signals presumably have similar structural motives but are not available in the database for automated attribution (Table S1). Hence, to obtain in-depth information and verify these findings, a soft ionization approach, thermal analysis (thermogravimetry) with APPI, was applied. APPI preserved the molecular information, and with the help of high-resolution mass spectrometry, the exact masses of the released compounds can be determined with sub-ppm deviation. From the exact mass, the sum formulae can directly be obtained as chemical information. Using this technique and comparing the sum formulae to previously published structures assigned to pyrolysis of epoxy resin-coated C3 reinforcement materials [23], compounds with the sum formulae C15H16O2 and C18H18O2 occurring in the second region could be confirmed as BPA benzofuran derivatives (Figure S6 and Table S1). The same structural motives could be depicted from the APPI mass spectra, thus verifying the outlined Py-GC-EI-QMS results.
Based on the number of attributed sum formulae (Table 2), it is noticeable that the complexity increases significantly with increasing thermal treatment temperature. With 40.2% (1573 sum formulae), most compounds are found in all samples exposed to 300, 325, and 350 °C (Figure S7). Although the samples exposed to 300 and 350 °C form a large pool of unique compounds, of 24.3% (948 sum formulae) and 15.5% (606 sum formulae), respectively, the sample exposed to 325 °C only contains 1.4% (53 sum formulae) of unique compounds. Hence, a direct shift in the compound pattern from 300 to 350 °C takes place during the thermal exposure period.
For further investigation of the complex data, the molecular attributions can be grouped into compound classes. To ensure comparability with the TOCA-PIMS data, data evaluation was restricted to the thermal desorption fraction (20–280 °C). This approach revealed large differences between the samples (Figure S8). With increasing temperature from 300 to 350 °C, the amount of oxygen- and nitrogen-containing compounds in the evaporated mixture decreases significantly due to evaporation of these compounds during the thermal treatment prior to thermal analysis. In contrast, the quantity of these compounds is significantly lower in the sample exposed to room temperature. Nitrogen compounds, such as isophorone diamine or the triglycidylether of para-aminophenol [52], are introduced into the matrix as hardeners, as cross-linker in the coating. Oxygen-containing groups mainly belong to benzofuran derivatives of BPA and phenolic thermal degradation products of BPA (Table S1). Nitrogen is most likely introduced into these compounds by thermal degradation of the hardener in larger epoxy resin molecules during the thermal exposure period. In subsequent abrasive machining steps, those compounds may be released.

3.2.2. Organic Composition of Abrasive PM

The inhalable PM fractions PM2.5 and PM10 released during dry-cutting of thermally stressed C3 materials were analyzed by TOCA-PIMS. At exposure temperatures ≤250 °C, only small concentrations of thermal desorption OC (20–280 °C) were found in PM10 with significantly higher concentrations in C3 compared to concrete at room temperature exposure (Figure S13). At exposure temperatures of 300–312 °C, three-fold higher thermal desorption OC concentrations could be detected. Higher exposure temperatures of ≥325 °C lead to a decrease of the thermal desorption OC content.
For further information about the thermal desorption OC composition, the samples were investigated with REMPI mass spectrometry preserving the molecular pattern (Figure S3). Compounds detected in the abrasive PM formed during dry-cutting of C3 exposed to elevated temperatures are summarized in Table 3. Averaged REMPI spectra of PM2.5 and PM10 from C3 exposed to 300 °C are illustrated in Figure 3. The corresponding REMPI spectra for exposure temperatures of 312, 325, 338, and 350 °C are provided in the Supplementary Material (Figures S14–S17).
The release of organic compounds can be divided into three major exposure temperature regions: ≤250, 300–350, and ≥400 °C. The same behavior for PM2.5 and PM10, only differing in their intensities, can be found. At temperatures ≤ 250 °C, phenol (m/z 94), dehydroxylated BPA (m/z 212) and the PAHs phenanthrene/anthracene (m/z 178) were detected. Those compounds can be traced back to pyrolysis of the epoxy resin coating at the saw blade edge during the dry-cutting process, as described earlier by Koch et al. (2021) [23]. Higher exposure temperatures of 300–350 °C lead to the release of a different molecular pattern. At 300–312 °C (Figure 3 and Figure S14), a benzofuran derivative of BPA (m/z 304), three phenolic BPA degradation products (m/z 136, 160, and 174), and the PAHs fluoranthene/pyrene (m/z 202), were detected additionally. The complexity of the molecular pattern decreases with increasing exposure temperatures up to 350 °C in this temperature region. At high exposure temperatures ≥400 °C, no organic compounds were detected. Those molecular patterns are caused by a slow pyrolysis process of the organic coating material during thermal exposure leading to partial fragmentation of the epoxy resin (300–350 °C) and complete evaporation of the organic coating (≥400 °C). These results largely confirm the results obtained from Py-GC-EI-QMS and TA-APPI-MS.
Fully developed fires reach temperatures up to 1050 °C [53,54]. Hence, most likely, no organic compounds will be released during abrasive demolition of C3 buildings after fully developed domestic fire events. However, when fires are extinguished by firefighters at an early stage, temperatures of 300–350 °C can occur. This can lead to the release of BPA derivatives and phenolic degradation products, in addition to the PAHs phenanthrene/anthracene and fluoranthene/pyrene. BPA is a well-known endocrine disruptor that can impair the reproductive system, in addition to liver and kidney function [55]. No information about the toxicity of the identified BPA derivatives is available yet. In addition, PAHs are carcinogenic [56]. Thus, we recommend that the pyrolysis products of the organic coating should be considered during the manufacturing process of C3 reinforcement materials. Furthermore, we recommend using organic coating materials not based on BPA-based epoxy resin to minimize the risk of toxic effects.

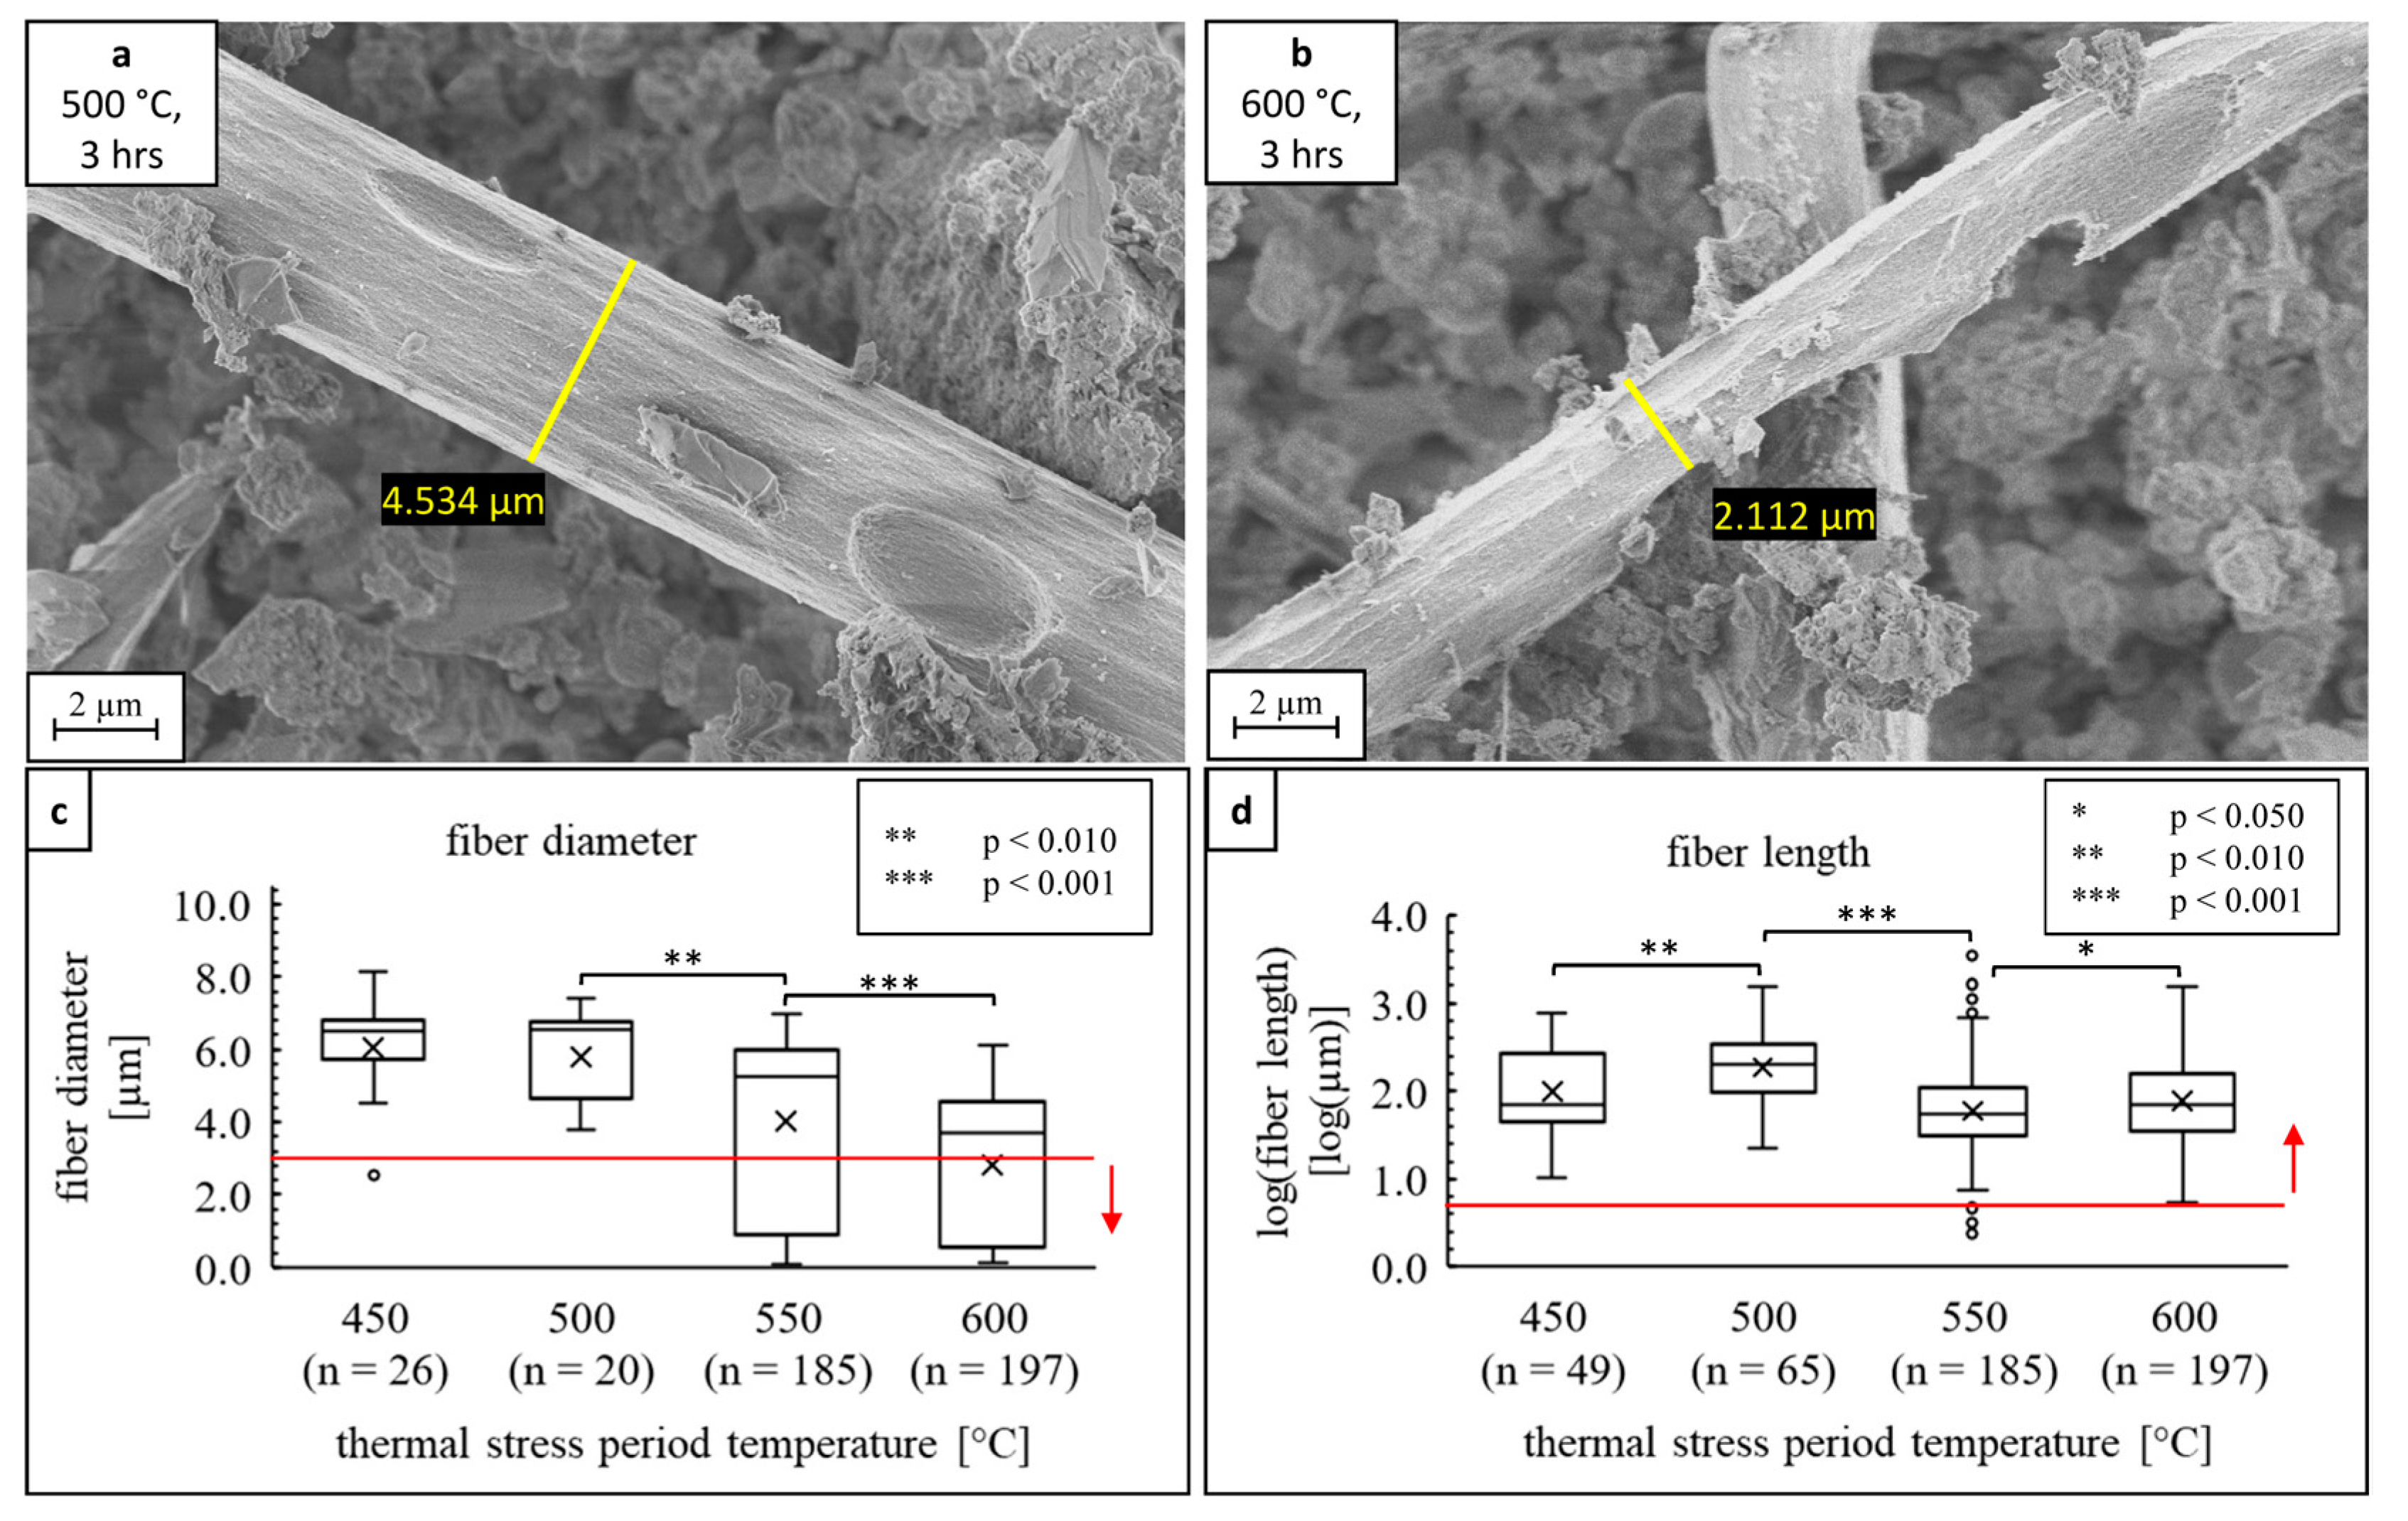
3.3. Fiber Morphology

Carbon fibers were investigated with respect to their morphology before and after dry-cutting of thermally stressed C3. Therefore, reinforcement material mechanically separated from thermally stressed C3 and fibers in the inhalable PM fraction PM10 were studied. Furthermore, the impact of thermal stress on the occurrence and the concentration of harmful WHO fibers released during abrasive machining of thermally stressed C3 were evaluated, allowing the definition of personal protection measures for handling thermally stressed C3 materials [57]. Pictures of the reinforcement materials mechanically separated from thermally stressed C3 are illustrated in the Supplementary Material (Figure S18). It is noticeable that the reinforcement structure is partially degraded at 312 °C due to the pyrolysis of the organic coating material. Exposure to 450 °C leads to a complete loss of the reinforcement structure and the formation of a fluffy bundle of isolated fibers.

3.3.1. Fiber Morphology before Cutting

Electron microscopy is a well-established technique to study fiber morphology [25,28,29]. SEM micrographs of fibers exposed to various temperatures (air atmosphere, 3 h) while embedded in concrete are illustrated in Figure 4a–f. Fibers exposed to low temperatures ≤325 °C are all well-coated with the epoxy resin matrix. Each fiber is covered individually by a smooth epoxy resin film. Furthermore, the epoxy resin leads to the fibers adhering to each other. Degradation effects of the epoxy resin were not observed. Hence, a high stability of the reinforcement grid can be expected due to improved binding properties between the fibers and between the fibers and concrete particles. However, higher exposure temperatures ≥450 °C lead to a total loss of the epoxy resin matrix due to degradation. As a result, the binding properties of the fibers are weakened and isolated fibers can be obtained. At high exposure temperatures ≥550 °C, degradation effects of the carbon fibers, such as pitting processes, can be observed with small notches in the fiber surface and heavy weakening of the fibrous structure occurring at 550 and 600 °C (Figure 4e–f), respectively. These effects are caused by oxidation of the carbon fiber surfaces.
Figure 4g shows the median fiber diameters for exposure temperatures between 25 and 600 °C measured with SEM. At exposure temperatures ≤500 °C, the carbon fibers have a median diameter of 7.1 ± 1.5 µm (n = 147), which corresponds to the fiber diameter obtained due to the manufacturing process. Although the epoxy resin matrix degrades between 300 and 350 °C, the fiber diameter is retained. Thus, the degradation of the epoxy resin matrix has no influence on the fiber diameter. However, at high exposure temperatures ≥550 °C, the fiber diameter is substantially decreased by a factor of 1.3 and 2.3 at 550 and 600 °C, respectively. The reduction in the fiber diameters is caused by the oxidation processes at the fiber surface occurring at high exposure temperatures ≥550 °C. This leads to the formation of fibers with diameters <3 µm at exposure temperatures of 600 °C. Thus, harmful fibers, according to the WHO definition [24], with length >5 µm, diameter <3 µm and a length-to-diameter ratio >3, may occur in subsequent processing steps such as abrasive machining.

3.3.2. Fiber Morphology/Occurrence in Abrasive PM10

The inhalable PM fraction PM10 was investigated with respect to the fiber dimensions and the occurrence of harmful fibers. SEM micrographs of fibers in PM10 from a dry-cutting simulation of C3 exposed to 500 and 600 °C are shown in Figure 5a,b. Although, in PM10 from C3 exposed to lower temperatures ≤450 °C (Figure S19) only isolated fibers with 7 ± 1 µm in diameter were observed, as already shown by Koch et al. (2021) [23] for non-thermally stressed C3, higher exposure temperatures >450 °C lead to a 4.5-fold increase (reference: 450 °C) at 500–550 °C and a 15-fold increase (reference: 450 °C) at 600 °C in the fiber number on the filters due to the isolation of fibers decomposed in the thermally stressed concrete. Although fibers in PM10 of C3 exposed to 500 °C show only small notches on their surface due to localized oxidation processes, exposure temperatures of 600 °C lead to a heavy weakening in the fibrous structure of the carbon fibers. Thus, the formation of harmful WHO fibers becomes more likely with increasing temperatures above 500 °C as the fiber diameter may fall within the speciation prior to the dry-cutting.
The impact of thermal stress on the dimensions of fibers released during dry-cutting of thermally stressed C3 exposed to temperatures ≥ 450 °C (air atmosphere, 3 h) were further investigated by measuring the length and diameter of fibers in the inhalable PM fraction PM10. The corresponding lengths and diameters are shown in Figure 5c,d. It is observed that the median length of the fibers does not change. However, the median fiber diameter decreases with exposure temperatures above 450 °C. Although at 450 °C only isolated fibers with diameters ~3 µm are observed, exposure temperatures ≥ 550 °C lead to the formation of a larger number of fibers with diameters <3 µm and, thus, harmful WHO fibers. The corresponding L/D ratios are predominantly within the speciation of the WHO definition with a value >3 (Figure S20). Table 4 summarizes the measured length and diameter spans of the carbon fibers compared to asbestos fibers. In comparison to asbestos fibers, the carbon fibers are longer and have a larger diameter.
Since the highest risk of exposure to harmful WHO fibers occurs during dry-cutting of C3 exposed to high temperatures of 550 and 600 °C, the concentrations of these two scenarios were measured in accordance to VDI guideline 3492 [45]. Dry-cutting of C3 exposed to 550 and 600 °C leads to a release of 27,940 WHO fibers/m3 (32% of all fibers, 2643 WHO fibers/cm3 cut volume, cut volume: 10.57 cm3/m3 analyzed volume) and 40,500 WHO fibers/m3 (46% of all fibers, 3709 WHO fibers/cm3 cut volume, cut volume: 10.92 cm3/m3 analyzed volume), respectively. Exposure concentrations for the worker may be smaller due to a dilution of the aerosol stream between the spot of fiber release at the saw blade edge and the inhalation area of the worker. Data about the dilution behavior of released carbon fibers with respect to the distance from the cutting device are not available yet. For asbestos fibers, exposure concentrations of <10,000 WHO fibers/m3 [59] and 10,000–100,000 WHO fibers/m3 [59] are considered to cause a small or medium risk of cancer development, respectively, when a daily exposure on workdays for a time span of 40 years can be assumed [59]. Thus, to minimize health risks working with C3, the fiber concentrations should be decreased by using wet cutting processes and suction devices during cutting C3 that is thermally stressed by high temperatures ≥550 °C. Furthermore, construction workers working with C3 exposed to high temperatures should wear particle protection masks and protective clothes [57]. However, in fire conditions, the oxygen concentration may be reduced due to oxygen consumption. This may reduce the risk of fiber damage and lead to the release of lower WHO concentrations. Furthermore, shorter exposure times to high temperatures ≥550 °C during domestic fire events are also expected to reduce the risk of fiber damage. In contrast, a higher risk of WHO fiber release can be expected when the C3 material is exposed to temperatures >600 °C (air atmosphere, 3 h) due to an increased risk of fiber damage. Typical temperatures expected in domestic fire events can reach up to 1050 °C [53,54].
In comparison to asbestos cement, the released WHO fiber concentrations are two orders of magnitude lower during cutting C3 materials. Abelmann et al. (2018) [21] measured the exposure concentration to asbestos fibers during dry-cutting of asbestos cement pipes (two cuts, outer diameter: 10.2 cm, inner diameter: 7.6 cm, cut width: 0.3 cm, cut volume: 21.8 cm3/m3 analyzed volume) and found concentrations of 5,200,000 WHO fibers/m3 (238,533 WHO fibers/cm3 cut volume) to 12,400,000 WHO fibers/m3 (568,808 WHO fibers/cm3 cut volume). Hence, the herein observed WHO fiber concentrations indicate that the health risk for construction workers involved in the demolition of C3 buildings after domestic fire events is much lower compared to that involved in the demolition of asbestos cement buildings.

4. Conclusions

In this study, the release of toxic organic compounds and fibers during the dry-cutting of a Carbon Concrete Composite (C3) was investigated. Prior, the material was thermally stressed at air for 3 h at various temperatures (25–600 °C). These conditions mimic building demolition after domestic fire events and abrasive processing after thermal recycling.
A release of a variety of epoxy resin degradation products, such as phenols, BPA benzofuran derivatives, and PAHs was observed. These pollutants are exposed due to the partial decomposition of the organic fiber coating. Consequently, a substantial environmental and health risk in abrasive building demolition scenarios after domestic fire events can be proposed. Hence, potential degradation products of the organic coating material should be considered in the manufacturing process.
In contrast, the release of WHO fibers observed due to a decrease in fiber diameter at elevated temperatures above 550 °C poses a medium health risk. A medium health risk is assumed when cancer development is sufficiently likely, but can be tolerated if further safety precautions are applied [59]. Hence, the exposure to WHO fibers during abrasive processing of thermally stressed C3 in domestic fire events or thermal recycling should be minimized by applying wet cutting processes, work protection equipment, and a suction device [57]. Since domestic fire conditions vary, future research should address the thermal impact on C3 materials using varying dwell times and atmosphere conditions. Moreover, the distribution behavior of the released carbon WHO fibers at the workplace should be defined by performing exposure measurements at various distances from the saw blade. This data can be used to establish an exposure model for worker and coworker exposure [60]. In addition, various C3 reinforcement materials can behave differently during thermal exposure. Therefore, studies on the decomposition behavior of different C3 reinforcement materials focusing on the fiber and organic coating degradation are currently being performed.
This study focused on the physicochemical description, and toxicity assessment was based on literature guidelines. Thus, future work will investigate the direct toxicity of dust from abrasive machining of thermally stressed C3. However, it is expected that the described organic pollutants will mainly drive the toxicity for low temperature scenarios (≤350 °C). In contrast, released WHO fibers will most likely be the main driving force when the C3 is exposed to high temperatures ≥550 °C. In vitro studies addressing these questions are currently being carried out.

Supplementary Materials

The following Supplementary Materials are available online at: https://0-www-mdpi-com.brum.beds.ac.uk/article/10.3390/fib10050039/s1. Figure S1: Illustration of the dry-cutting simulation and pictures of the C3 reinforcement material and a C3 material before and after thermal exposure to 400 °C. Figure S2: Organic composition of reinforcement materials mechanically separated from C3 exposed to 300–400 °C measured by TA-APPI-MS. Figure S3: Averaged REMPI spectra of thermal desorption OC in PM2.5 and PM10 from dry-cutting of C3 exposed to 25–600 °C. Figures S4–S6: Total ion count chromatogram (TIC) and magnified TIC chromatograms (12–20 min/25–32 min) of reinforcement material mechanically separated from C3 exposed to 25, 300, 325, and 350 °C. Figure S7: Venn diagram of the sum formulae assignment for reinforcement materials mechanically separated from C3 exposed to 300, 325, and 350 °C. Figure S8: Absolute intensities of the compound classes grouped for the reinforcement materials mechanically separated from C3 exposed to 25, 300, 325, and 350 °C. Figures S9–S12: In-depth chemical characterization of the emitted gas mixture for the thermal analysis of reinforcement materials mechanically separated from C3 exposed to 25, 300, 325, and 350 °C by APPI-FT-MS. Figure S13: Concentrations of thermal desorption OC in PM2.5 and PM10 released from dry-cutting of C3 exposed to 25–600 °C. Figures S14–S17: Averaged REMPI spectra of PM2.5 and PM10 released from dry-cutting of C3 exposed to 312, 325, 338, and 350 °C. Figure S18: Pictures of C3 reinforcement materials mechanically separated from C3 exposed to 25–600 °C. Figure S19: SEM micrographs of fibers in PM10 from dry-cutting of C3 exposed to 25–450 °C. Figure S20: Length-to diameter (L/D) aspect ratio of carbon fibers in PM10 from dry-cutting of C3 exposed to 550, and 600 °C. Table S1: Organic constituents in reinforcement materials mechanically separated from C3 exposed to 300–350 °C. Furthermore, a description of the homogenization of reinforcement materials mechanically separated from thermally stressed C3 is given in Section S2. Details of the Py-GC-EI-QMS and TA-APPI-MS measurements are given in Section S3.

Author Contributions

Conceptualization, A.K., L.F., C.P.R., T.S. and R.Z.; formal analysis, A.K. and L.F.; funding acquisition, R.Z.; investigation, A.K., L.F., P.F. and A.S.; methodology, A.K., L.F., P.F. and A.S.; project administration, T.S.; resources, A.K., L.F., P.F. and A.S.; supervision, R.Z.; validation, A.K., L.F. and C.P.R.; visualization, A.K. and L.F.; writing—original draft, A.K.; writing—review and editing, L.F., P.F., A.S., S.D.B., M.S., M.F., C.P.R., T.S. and R.Z. All authors have read and agreed to the published version of the manuscript.

Funding

This research is part of the C3—Carbon Concrete Composites project funded by the German Federal Ministry of Education and Research, grant number 03ZZ0332A, and Research in the loan program “Zwanzig20-Partnerschaft für Innovation. We acknowledge financial support by German Research Foundation (DFG) and University of Rostock/University Medical Center Rostock within the funding program Open Access Publishing, grant number 325496636.

Data Availability Statement

The data presented in this study are available in the article and the Supplementary Material.

Acknowledgments

The authors thank their colleagues from the Institute of Construction Management at the TU Dresden for providing the C3 samples. Funding by the Horizon 2020 program for the EU FT-ICR MS project (European Network of Fourier-Transform Ion-Cyclotron-Resonance Mass Spectrometry Centers, Grant agreement ID: 731077) is gratefully acknowledged. The authors thank the German Research Foundation (DFG) for funding of the Bruker FT-ICR MS (INST 264/56).

Conflicts of Interest

The authors declare no conflict of interest. The funders had no role in the design of the study, in the collection, analyses, or interpretation of data, in the writing of the manuscript, or in the decision to publish the results.

Abbreviations

APPI—atmospheric pressure photoionization; BPA—bisphenol A; C3—Carbon Concrete Composite; CFRP—carbon fiber-reinforced plastic; DBE—double bond equivalent; EC—elemental carbon; EI—electron ionization; FID—flame ionization detector; FRP—fiber-reinforced plastic; GC—gas chromatography; L/D—length-to-diameter aspect ratio; MS—mass spectrometry; oa-Tof—orthogonal accelerated time-of-flight; OC—organic carbon; PAN—polyacrylonitrile; PIMS—photoionization mass spectrometry; PM—particulate matter; Py—pyrolysis; QMS—quadrupole mass spectrometry; REMPI—resonance-enhanced multiphoton ionization; SBR—styrene-butadiene resin; SEM—scanning electron microscopy; TA—thermal analysis; TIC—total ion count; TOCA—thermo-optical carbon analyzer; WHO—World Health Organization.

References

  1. Böhm, R.; Thieme, M.; Wohlfahrt, D.; Wolz, D.; Richter, B.; Jäger, H. Reinforcement Systems for Carbon Concrete Composites Based on Low-Cost Carbon Fibers. Fibers 2018, 6, 56. [Google Scholar] [CrossRef] [Green Version]
  2. Mai, Y.W. Strength and fracture properties of asbestos-cement mortar composites. J. Mater. Sci. 1979, 14, 2091–2102. [Google Scholar] [CrossRef]
  3. Lenain, J.C.; Bunsell, A.R. The resistance to crack growth of asbestos cement. J. Mater. Sci. 1979, 14, 321–332. [Google Scholar] [CrossRef]
  4. Ghugal, Y.M.; Deshmukh, S.B. Performance of Alkali-resistant Glass Fiber Reinforced Concrete. J. Reinf. Plast. Compos. 2006, 25, 617–630. [Google Scholar] [CrossRef]
  5. Kizilkanat, A.B.; Kabay, N.; Akyüncü, V.; Chowdhury, S.; Akça, A.H. Mechanical properties and fracture behavior of basalt and glass fiber reinforced concrete: An experimental study. Constr. Build. Mater. 2015, 100, 218–224. [Google Scholar] [CrossRef]
  6. Fiore, V.; Scalici, T.; Di Bella, G.; Valenza, A. A review on basalt fibre and its composites. Compos. Part B Eng. 2015, 74, 74–94. [Google Scholar] [CrossRef]
  7. Chung, D. Cement reinforced with short carbon fibers: A multifunctional material. Compos. Part B Eng. 2000, 31, 511–526. [Google Scholar] [CrossRef]
  8. Wang, C.; Li, K.-Z.; Li, H.-J.; Jiao, G.-S.; Lu, J.; Hou, D.-S. Effect of carbon fiber dispersion on the mechanical properties of carbon fiber-reinforced cement-based composites. Mater. Sci. Eng. A 2008, 487, 52–57. [Google Scholar] [CrossRef]
  9. Sim, J.; Park, C.; Moon, D.Y. Characteristics of basalt fiber as a strengthening material for concrete structures. Compos. Part B Eng. 2005, 36, 504–512. [Google Scholar] [CrossRef]
  10. Lee, J.J.; Song, J.; Kim, H. Chemical stability of basalt fiber in alkaline solution. Fibers Polym. 2014, 15, 2329–2334. [Google Scholar] [CrossRef]
  11. Felley-Bosco, E.; MacFarlane, M. Asbestos: Modern Insights for Toxicology in the Era of Engineered Nanomaterials. Chem. Res. Toxicol. 2018, 31, 994–1008. [Google Scholar] [CrossRef] [PubMed]
  12. Hillemann, L.; Stintz, M.; Streibel, T.; Zimmermann, R.; Öder, S.; Kasurinen, S.; Di Bucchianico, S.; Kanashova, T.; Dittmar, G.; Konzack, D.; et al. Charakterisierung von Partikelemissionen aus dem Trennschleifprozess von kohlefaserverstärktem Beton (Carbonbeton). Gefahrstoffe 2018, 230–240. [Google Scholar]
  13. Scheerer, S. Was ist Textilbeton? Eine kurze Einführung in das Thema. Beton-Stahlbetonbau 2015, 110, 4–7. [Google Scholar] [CrossRef]
  14. Bienkowski, N.; Hillemann, L.; Streibel, T.; Kortmann, J.; Kopf, F.; Zimmermann, R.; Jehle, P. Bearbeitung von Carbonbeton-eine bauverfahrenstechnische und medizinische Betrachtung. Bauingeneur 2017, 10, 110–117. [Google Scholar]
  15. Frank, E.; Steudle, L.M.; Ingildeev, D.; Spörl, J.M.; Buchmeiser, M.R. Carbon fibers: Precursor systems, processing, structure, and properties. Angew. Chem. Int. Ed. Engl. 2014, 53, 5262–5298. [Google Scholar] [CrossRef]
  16. Jäger, H.; Cherif, C.; Kirsten, M.; Behnisch, T.; Wolz, D.S.; Böhm, R.; Gude, M. Influence of processing parameters on the properties of carbon fibres—An overview. Mater. Werkst. 2016, 47, 1044–1057. [Google Scholar] [CrossRef]
  17. Morgan, P. Carbon Fibers and Their Composites; Taylor & Francis: Boca Raton, FL, USA, 2005; ISBN 978-0-8247-0983-9. [Google Scholar]
  18. Yusof, N.; Ismail, A.F. Post spinning and pyrolysis processes of polyacrylonitrile (PAN)-based carbon fiber and activated carbon fiber: A review. J. Anal. Appl. Pyrolysis 2012, 93, 1–13. [Google Scholar] [CrossRef]
  19. Fu, Z.; Liu, B.; Sun, L.; Zhang, H. Study on the thermal oxidative stabilization reactions and the formed structures in polyacrylonitrile during thermal treatment. Polym. Degrad. Stab. 2017, 140, 104–113. [Google Scholar] [CrossRef]
  20. Saha, B.; Schatz, G.C. Carbonization in polyacrylonitrile (PAN) based carbon fibers studied by ReaxFF molecular dynamics simulations. J. Phys. Chem. B 2012, 116, 4684–4692. [Google Scholar] [CrossRef]
  21. Abelmann, A.; Maskrey, J.R.; Lotter, J.T.; Chapman, A.M.; Nembhard, M.D.; Pierce, J.S.; Wilmoth, J.M.; Lee, R.J.; Paustenbach, D.J. Evaluation of take-home exposure to asbestos from handling asbestos-contaminated worker clothing following the abrasive sawing of cement pipe. Inhal. Toxicol. 2018, 29, 555–566. [Google Scholar] [CrossRef]
  22. Weiler, L.; Vollpracht, A. Environmental Compatibility of Carbon Reinforced Concrete: Irrigated Construction Elements. Key Eng. Mater. 2019, 809, 314–319. [Google Scholar] [CrossRef]
  23. Koch, A.; Bergelt, P.; Fiala, P.; Käfer, U.; Orasche, J.; Bauer, S.; Di Bucchianico, S.; Stintz, M.; Gröger, T.; Streibel, T.; et al. Investigation of Chemical Composition and Fiber-Occurrence in Inhalable Particulate Matter Obtained from Dry Cutting Processes of Carbon Fiber Reinforced Concrete Composite, Concrete and the Carbon Fiber Reinforcement Materials. Aerosol Sci. Eng. 2021, 5, 292–306. [Google Scholar] [CrossRef]
  24. TRGS 905 Verzeichnis Krebserzeugender, Keimzellmutagener Oder Reproduktionstoxischer Stoffe. Available online: https://www.baua.de/DE/Angebote/Rechtstexte-und-Technische-Regeln/Regelwerk/TRGS/TRGS-905.html (accessed on 19 February 2022).
  25. Meyer, L.O.; Schulte, K.; Grove-Nielsen, E. CFRP-Recycling Following a Pyrolysis Route: Process Optimization and Potentials. J. Compos. Mater. 2009, 43, 1121–1132. [Google Scholar] [CrossRef] [Green Version]
  26. Yatim, N.M.; Shamsudin, Z.; Shaaban, A.; Ghafar, J.A.; Khan, M.J.H. Recovery of carbon fiber from carbon fiber reinforced polymer waste via pyrolysis. J. Adv. Manuf. Technol. 2020, 14, 37–47. [Google Scholar]
  27. Tranchard, P.; Duquesne, S.; Samyn, F.; Estèbe, B.; Bourbigot, S. Kinetic analysis of the thermal decomposition of a carbon fibre-reinforced epoxy resin laminate. J. Anal. Appl. Pyrolysis 2017, 126, 14–21. [Google Scholar] [CrossRef]
  28. Matielli Rodrigues, G.G.; Faulstich de Paiva, J.M.; Braga do Carmo, J.; Botaro, V.R. Recycling of carbon fibers inserted in composite of DGEBA epoxy matrix by thermal degradation. Polym. Degrad. Stab. 2014, 109, 50–58. [Google Scholar] [CrossRef]
  29. López, F.A.; Rodríguez, O.; Alguacil, F.J.; García-Díaz, I.; Centeno, T.A.; García-Fierro, J.L.; González, C. Recovery of carbon fibres by the thermolysis and gasification of waste prepreg. J. Anal. Appl. Pyrolysis 2013, 104, 675–683. [Google Scholar] [CrossRef]
  30. Zöllner, M.; Lieberwirth, H.; Kempkes, P.; Fendel, A. Thermal resistance of carbon fibres/carbon fibre reinforced polymers under stationary atmospheric conditions and varying exposure times. Waste Manag. 2019, 85, 327–332. [Google Scholar] [CrossRef]
  31. Eibl, S. Potential for the formation of respirable fibers in carbon fiber reinforced plastic materials after combustion. Fire Mater. 2017, 41, 808–816. [Google Scholar] [CrossRef]
  32. Černý, R.; Němečková, J.; Rovnaníková, P.; Bayer, P. Effect of thermal decomposition processes on the thermal properties of carbon fiber reinforced cement composites in high-temperature range. J. Therm. Anal. Calorim. 2007, 90, 475–488. [Google Scholar] [CrossRef]
  33. Regnier, N.; Mortaigne, B. Analysis by pyrolysis/gas chromatography/mass spectrometry of glass fibre/vinylester thermal degradation products. Polym. Degrad. Stab. 1995, 49, 419–428. [Google Scholar] [CrossRef]
  34. Otto, S.; Streibel, T.; Erdmann, S.; Sklorz, M.; Schulz-Bull, D.; Zimmermann, R. Application of pyrolysis-mass spectrometry and pyrolysis-gas chromatography-mass spectrometry with electron-ionization or resonance-enhanced-multi-photon ionization for characterization of crude oils. Anal. Chim. Acta 2015, 855, 60–69. [Google Scholar] [CrossRef] [PubMed]
  35. Rüger, C.P.; Grimmer, C.; Sklorz, M.; Neumann, A.; Streibel, T.; Zimmermann, R. Combination of Different Thermal Analysis Methods Coupled to Mass Spectrometry for the Analysis of Asphaltenes and Their Parent Crude Oils: Comprehensive Characterization of the Molecular Pyrolysis Pattern. Energy Fuels 2018, 32, 2699–2711. [Google Scholar] [CrossRef]
  36. Brecht, D.; Uteschil, F.; Schmitz, O.J. Thermogravimetry coupled to an atmospheric pressure photo ionization quadrupole mass spectrometry for the product control of pharmaceutical formulations and the analysis of plasticizers in polymers. Talanta 2019, 198, 440–446. [Google Scholar] [CrossRef]
  37. Rüger, C.P.; Miersch, T.; Schwemer, T.; Sklorz, M.; Zimmermann, R. Hyphenation of Thermal Analysis to Ultrahigh-Resolution Mass Spectrometry (Fourier Transform Ion Cyclotron Resonance Mass Spectrometry) Using Atmospheric Pressure Chemical Ionization for Studying Composition and Thermal Degradation of Complex Materials. Anal. Chem. 2015, 87, 6493–6499. [Google Scholar] [CrossRef] [PubMed]
  38. Chow, J.C.; Watson, J.G.; Chen, L.-W.A.; Chang, M.O.; Robinson, N.F.; Trimble, D.; Kohl, S. The IMPROVE_A Temperature Protocol for Thermal/Optical Carbon Analysis: Maintaining Consistency with a Long-Term Database. J. Air Waste Manag. Assoc. 2007, 57, 1014–1023. [Google Scholar] [CrossRef] [Green Version]
  39. Diab, J.; Streibel, T.; Cavalli, F.; Lee, S.C.; Saathoff, H.; Mamakos, A.; Chow, J.C.; Chen, L.-W.A.; Watson, J.G.; Sippula, O.; et al. Hyphenation of a EC/OC thermal—Optical carbon analyzer to photo-ionization time-of-flight mass spectrometry: An off-line aerosol mass spectrometric approach for characterization of primary and secondary particulate matter. Atmos. Meas. Tech. 2015, 8, 3337–3353. [Google Scholar] [CrossRef] [Green Version]
  40. Grabowsky, J.; Streibel, T.; Sklorz, M.; Chow, J.C.; Watson, J.G.; Mamakos, A.; Zimmermann, R. Hyphenation of a carbon analyzer to photo-ionization mass spectrometry to unravel the organic composition of particulate matter on a molecular level. Anal. Bioanal. Chem. 2011, 401, 3153–3164. [Google Scholar] [CrossRef]
  41. Miersch, T.; Czech, H.; Stengel, B.; Abbaszade, G.; Orasche, J.; Sklorz, M.; Streibel, T.; Zimmermann, R. Composition of carbonaceous fine particulate emissions of a flexible fuel DISI engine under high velocity and municipal conditions. Fuel 2019, 236, 1465–1473. [Google Scholar] [CrossRef]
  42. Boesl, U.; Zimmermann, R.; Weickhardt, C.; Lenoir, D.; Schramm, K.-W.; Kettrup, A.; Schlag, E.W. Resonance-enhanced multi-photon ionization: A species-selective ion source for analytical time-of-flight mass spectroscopy. Chemosphere 1994, 29, 1429–1440. [Google Scholar] [CrossRef]
  43. Streibel, T.; Zimmermann, R. Resonance-enhanced multiphoton ionization mass spectrometry (REMPI-MS): Applications for process analysis. Annu. Rev. Anal. Chem. 2014, 7, 361–381. [Google Scholar] [CrossRef]
  44. Gehm, C.; Streibel, T.; Passig, J.; Zimmermann, R. Determination of Relative Ionization Cross Sections for Resonance Enhanced Multiphoton Ionization of Polycyclic Aromatic Hydrocarbons. Appl. Sci. 2018, 8, 1617. [Google Scholar] [CrossRef] [Green Version]
  45. Fachbereich Umweltmesstechnik. VDI 3492: Messen von Innenraumluftverunreinigungen, Messen von Immissionen, Messen Anorganischer Faserförmiger Partikeln, Rasterelektronenmikroskopisches Verfahren; VDI Verein Deutscher Ingenieure e.V.: Düsseldorf, Germany, 2004; Available online: https://www.vdi.de/richtlinien/details/vdi-3492-messen-von-innenraumluftverunreinigungen-messen-von-immissionen-messen-anorganischer-faserfoermiger-partikel-rasterelektronenmikroskopisches-verfahren (accessed on 23 April 2022).
  46. Harrison, R.M.; Yin, J. Particulate matter in the atmosphere: Which particle properties are important for its effects on health? Sci. Total Environ. 2000, 249, 85–101. [Google Scholar] [CrossRef]
  47. Kim, K.-H.; Kabir, E.; Kabir, S. A review on the human health impact of airborne particulate matter. Environ. Int. 2015, 74, 136–143. [Google Scholar] [CrossRef]
  48. Agimelen, O.S.; Mulholland, A.J.; Sefcik, J. Modelling of artefacts in estimations of particle size of needle-like particles from laser diffraction measurements. Chem. Eng. Sci. 2017, 158, 445–452. [Google Scholar] [CrossRef] [Green Version]
  49. Rüger, C.P.; Tiemann, O.; Neumann, A.; Streibel, T.; Zimmermann, R. Review on Evolved Gas Analysis Mass Spectrometry with Soft Photoionization for the Chemical Description of Petroleum, Petroleum-Derived Materials, and Alternative Feedstocks. Energy Fuels 2021, 35, 18308–18332. [Google Scholar] [CrossRef]
  50. Chen, R.; Xu, X.; Lu, S.; Zhang, Y.; Lo, S. Pyrolysis study of waste phenolic fibre-reinforced plastic by thermogravimetry/Fourier transform infrared/mass spectrometry analysis. Energy Convers. Manag. 2018, 165, 555–566. [Google Scholar] [CrossRef]
  51. Qiu, T.; Ge, F.; Li, C.; Lu, S. Study of the thermal degradation of flame-retardant polyester GFRP using TGA and TG-FTIR-GC/MS. J. Therm. Anal. Calorim. 2022, 147, 5743–5760. [Google Scholar] [CrossRef]
  52. Fache, M.; Montérémal, C.; Boutevin, B.; Caillol, S. Amine hardeners and epoxy cross-linker from aromatic renewable resources. Eur. Polym. J. 2015, 73, 344–362. [Google Scholar] [CrossRef]
  53. Wald, F.; Chlouba, J.; Uhlíř, A.; Kallerová, P.; Štujberová, M. Temperatures during fire tests on structure and its prediction according to Eurocodes. Fire Saf. J. 2009, 44, 135–146. [Google Scholar] [CrossRef]
  54. Alarifi, A.A.; Dave, J.; Phylaktou, H.N.; Aljumaiah, O.A.; Andrews, G.E. Effects of fire-fighting on a fully developed compartment fire: Temperatures and emissions. Fire Saf. J. 2014, 68, 71–80. [Google Scholar] [CrossRef]
  55. Rochester, J.R. Bisphenol A and human health: A review of the literature. Reprod. Toxicol. 2013, 42, 132–155. [Google Scholar] [CrossRef]
  56. Armstrong, B.; Hutchinson, E.; Unwin, J.; Fletcher, T. Lung cancer risk after exposure to polycyclic aromatic hydrocarbons: A review and meta-analysis. Environ. Health Perspect. 2004, 112, 970–978. [Google Scholar] [CrossRef]
  57. TRGS 519 Asbest: Abbruch-, Sanierungs- oder Instandhaltungsarbeiten. Available online: https://www.baua.de/DE/Angebote/Rechtstexte-und-Technische-Regeln/Regelwerk/TRGS/TRGS-519.html (accessed on 19 February 2022).
  58. Gibbs, G.W.; Hwang, C.Y. Physical parameters of airborne asbestos fibres in various work environments-preliminary findings. Am. Ind. Hyg. Assoc. J. 1975, 36, 459–466. [Google Scholar] [CrossRef]
  59. TRGS 910 Risikobezogenes Maßnahmenkonzept für Tätigkeiten mit Krebserzeugenden Gefahrstoffen. Available online: https://www.baua.de/DE/Angebote/Rechtstexte-und-Technische-Regeln/Regelwerk/TRGS/TRGS-910.html (accessed on 19 February 2022).
  60. Donovan, E.P.; Donovan, B.L.; Sahmel, J.; Scott, P.K.; Paustenbach, D.J. Evaluation of bystander exposures to asbestos in occupational settings: A review of the literature and application of a simple eddy diffusion model. Crit. Rev. Toxicol. 2011, 41, 52–74. [Google Scholar] [CrossRef] [PubMed]
Figure 1. Particle concentration per cm3 and minute divided into four groups by their scattered light-equivalent diameter formed during abrasive processing of thermally stressed C3 materials and concrete (25–600 °C, air atmosphere, 3 h). Error bars indicate the standard deviation of the distinct sizing group.
Fibers 10 00039 g001
Figure 2. Total ion count (TIC) chromatogram of reinforcement material mechanically separated from thermally stressed C3 (RT (25 °C), 300, 325, 350 °C) measured by Py-GC-EI-QMS. Exposure to room temperature leads to characteristic larger pyrolysis fragments, e.g., BPA derivatives, at higher retention times. C3 exposed to higher temperatures shows a variety of additional smaller compounds at 300 and 325 °C, e.g., phenol derivatives, homologous of benzene, and other methoxyphenols, and a drastic decrease in detected compounds at 350 °C.
Fibers 10 00039 g002
Figure 3. Averaged REMPI spectra (248 nm, 500 Hz) of thermal desorption OC fraction (20–280 °C, OC1 + OC2) of PM2.5 (a) and PM10 (b) formed during dry-cutting of C3 exposed to 300 °C (air atmosphere, 3 h).
Fibers 10 00039 g003
Figure 4. SEM micrographs (1000× magnification). Morphology of epoxy resin-coated carbon fibers extracted from thermally stressed C3 (25–600 °C, air atmosphere, 3 h, (af)). Pitting processes occurring at ≥550 °C lead to a decrease in the median fiber diameter (g). WHO fiber diameters <3 µm are indicated by a red line and arrow.
Fibers 10 00039 g004
Figure 5. SEM micrographs (5000× magnification). Morphology of fibers in PM10 formed during dry-cutting of C3 exposed to 500 (a) and 600 °C ((b), air atmosphere, 3 h). Pitting processes start to occur at 500 °C, leading to decreasing fiber diameters (c), while fiber lengths (d) show no clear trend. The speciation for harmful fibers according to the WHO definition (length > 5 µm, diameter < 3 µm) is indicated by a red line and arrow.
Fibers 10 00039 g005
Table 1. Concentrations of inhalable PM fractions with scattered light equivalent diameters of 0.2–2.5 µm, 0.2–10 µm and 0.2–40 µm in particles per cm3 and minute formed during dry-cutting of thermally stressed C3 (25–600 °C, air atmosphere, 3 h). These size groups imitate the inhalable PM fractions PM2.5, PM10 and total PM, respectively, categorized by the aerodynamic diameter.
0.2–2.5 µm
[particles/cm3 * min]
0.2–10 µm
[particles/cm3 * min]
0.2–40 µm
[particles/cm3 * min]
C3
25 °C7600 ± 2008600 ± 3008600 ± 300
100 °C6400 ± 2007300 ± 2007400 ± 200
200 °C6700 ± 2007600 ± 2007600 ± 200
250 °C6200 ± 2007000 ± 2007000 ± 200
300 °C8000 ± 3008800 ± 3008800 ± 300
312 °C7800 ± 2008500 ± 3008500 ± 300
325 °C7500 ± 2008200 ± 1008300 ± 100
338 °C7900 ± 2008800 ± 2008800 ± 200
350 °C7700 ± 2008500 ± 2008600 ± 200
400 °C8300 ± 3008900 ± 2008900 ± 200
450 °C7100 ± 3007600 ± 2007700 ± 300
500 °C7100 ± 2007500 ± 2007500 ± 200
550 °C4700 ± 2004900 ± 2005000 ± 200
600 °C4500 ± 2004800 ± 2004900 ± 200
Concrete
25 °C6900 ± 1007800 ± 2007900 ± 200
325 °C4500 ± 2005100 ± 2005100 ± 200
600 °C3800 ± 1004000 ± 1004000 ± 100
Table 2. Percentage of evaporable organic compounds, residue and the number of attributed sum formulae in fibers from thermally stressed C3 (25, 300, 325 and 350 °C, air atmosphere, 3 h) measured by TA-APPI-MS (10 K/min, 600 °C, hold for 10 min). Compounds evaporating during the temperature program (25–600 °C) are combined as the evaporable fraction. The remaining fraction is defined as residue.
Exposure Temperature [°C]Residue
[wt%]
Evaporable Fraction
[wt%]
Number of
Sum Formulae
2571.228.81897
30076.523.52951
32584.915.12274
35093.26.82584
Table 3. Organic compounds detected in the inhalable PM fractions PM2.5 and PM10 formed during dry-cutting of thermally stressed C3 (25–600 °C, air atmosphere, 3 h). Differences between PM2.5 and PM10 occurred only in the signal intensities. The compounds were observed by TOCA-REMPI-MS and evaluated by comparison with the Py-GC-EI-QMS and TA-APPI-MS data.
#Identified
Substance
Compound Namem/z25–250 °C300–312 °C325–350 °C400–600 °C
1 Fibers 10 00039 i001Phenol94XX--
2 Fibers 10 00039 i0024-isopropyl phenol136-X--
3C11H12O-160-XX-
4C12H14O-174-XX-
5 Fibers 10 00039 i003Phenanthrene178XXX-
6 Fibers 10 00039 i004Anthracene178XXX-
7 Fibers 10 00039 i005Fluoranthene202-X--
8 Fibers 10 00039 i006Pyrene202-X--
9 Fibers 10 00039 i0074-(2-phenyl-2-propanyl) phenol212XX--
10 Fibers 10 00039 i008n-methyl-5-[1-methyl-1-(n-methylbenzofuran-5-yl)ethyl] benzofuran304-XX-
Table 4. Spans of fiber length and diameters in abrasive PM10 formed during dry-cutting of thermally stressed C3 (450, 500, 550, and 600 °C, air atmosphere, 3 h) in comparison to asbestos fibers.
Exposure Temperature
[°C]/material
Fiber Length Span
[µm]
Fiber Diameter Span
[µm]
450/C310.3–769.22.6–8.1
500/C322.3–15733.8–7.4
550/C31.6–34470.1–7.0
600/C35.4–15140.1–6.0
room temperature/asbestos0.2–38.0 [58]0.01–2.9 [58]
Publisher’s Note: MDPI stays neutral with regard to jurisdictional claims in published maps and institutional affiliations.

