Life Cycle Assessment of Mortars with Incorporation of Industrial Wastes
by
 , , and
Catarina Brazão Farinha
1,2 ,
,
José Dinis Silvestre
1 ,
,
Jorge de Brito
1,* and
Maria do Rosário Veiga
2 1
CERIS, Instituto Superior Técnico, University of Lisbon, Av. Rovisco Pais, 1-1049-001 Lisbon, Portugal
2
National Laboratory for Civil Engineering, Av. do Brasil 101, 1700-066 Lisbon, Portugal
*
Author to whom correspondence should be addressed.
Fibers 2019, 7(7), 59; https://0-doi-org.brum.beds.ac.uk/10.3390/fib7070059
Submission received: 15 April 2019
/
Revised: 26 June 2019
/
Accepted: 26 June 2019
/
Published: 4 July 2019
(This article belongs to the Special Issue Cementitious Composites Reinforced with Recycled and Natural Fibers: Experimental Results and Numerical Modelling 2019)
Abstract
:The production of waste is increasing yearly and, without a viable recycle or reutilization solution, waste is sent to landfills, where it can take thousand to years to degrade. Simultaneously, for the production of new materials, some industries continue to ignore the potential of wastes and keep on using natural resources for production. The incorporation of waste materials in mortars is a possible solution to avoid landfilling, through their recycling or reutilization. However, no evaluation of their “sustainability” in terms of environmental performance is available in the literature. In this sense, in this research a life cycle assessment was performed on mortars, namely renders, with incorporation of industrials wastes replacing sand and/or cement. For that purpose, eight environmental impact categories (abiotic depletion potential, global warming potential, ozone depletion potential, photochemical ozone creation potential, acidification potential, eutrophication potential, use of non-renewable primary energy resources, and use of renewable primary energy resources) within a “cradle to gate” boundary were analyzed for 19 mortars with incorporation of several industrial wastes: sanitary ware, glass fiber reinforced polymer, forest biomass ashes, and textile fibers. Sixteen out of the 19 mortars under analysis presented, in all environmental impact categories, an equal or better environment performance than a common mortar (used as a reference). The benefits in some environmental impacts were over 20%.
1. Introduction
Waste management is a current issue in society. The amount of waste produced yearly is increasing and, without a viable solution of reutilization or recycling, waste is sent directly to landfills. A great part of these are inorganic and take thousands of years to degrade. Thus, with the increase of waste production, landfills are starting to be overloaded. Adding to space scarcity, waste disposal in landfill causes environmental impacts such as soil, air, and water pollution [1].
At the same time, for the production of new materials, some industries continue to use natural resources as raw materials, ignoring the availability of wastes in the same or in other industries (industrial symbiosis that promote circular economy). The incorporation of wastes as by-products can reduce the environmental impacts of the new materials. They can replace natural resources and, at the same time, be an alternative to landfilling. However, waste replacement has to be carefully done, since the recycling process can be responsible for some environmental impacts related to re-processing and transportation [1,2].
In fact, the environmental impacts of the end-of-life of materials must be analyzed and discussed. Blengini and Garbarino [1] studied the environmental advantages of construction and demolition wastes (CDW) recycling over landfill dumping. They concluded that the environmental impacts produced by the wastes’ collection, recycling, and delivery are lower than those of their dumping. Hence, it is necessary to find other solutions for the wastes since landfill dumping should be the last option to be made.
The incorporation of waste materials in concrete or mortars is a possible solution for waste recycling or reutilization. The cementitious matrix can encapsulate the wastes, decreasing landfill dumping and, at the same time, reducing the natural resources used in these composite materials.
Concrete is one of the most widely-used construction materials nowadays due to its versatility, availability, and price [3]. The incorporation of wastes in concrete and their environmental benefits have been studied over time [2,3,4,5,6]. Concrete is composed of several constituents. However, cement is the one that contributes the most to the environmental impacts of concrete production [3,4]. The cement content, type, or strength class directly influence the environmental impacts of concrete [2,3,4,5,6]. Jiménez et al. [3] analyzed three cement types (Portland type I, Portland type II, and Portland type III) in concrete mixes. Cement Portland type I presented 17% higher CO2 emissions than Portland type II and 27% higher than Portland type III [3]. Braga [4] analyzed the use of different CEM I and CEM II types for different concrete strength classes 32.5, 42.5, and 52.5 MPa and also found a difference in the environmental impacts of each strength category, for each cement type. Because cement is the component that mostly affects the environmental performance of concrete, the wastes that are able to reduce the cement content are the ones that contribute the most to the environmental benefits. Fly ash, as a pozzolanic material, is able to replace this binder and, as a consequence, significantly reduces the global warming potential [5,6]. A fly ash replacement of 60% can lead to a 60% reduction of CO2 emissions [5,6]. The replacement of natural aggregate, fine or coarse, in a concrete mix, although at a different scale, can also contribute to a reduction of the environmental impacts in some categories [5,6].
Renders or plasters represent a low amount of the total cement used worldwide. The incorporation of wastes in mortars as substitutes of sand or cement has already been studied. Red or white ceramic, powder glass, construction and demolition wastes, several types of polymers, and stone powder are examples of wastes that can be incorporated in mortars to achieve a good technical performance. However, no life cycle assessment of the resulting materials is available in the literature.
In this research, the incorporation of several industrial wastes in renders is discussed. The good technical performance of the mortars obtained has been demonstrated in several previous researches [7,8,9]. All the mortars, presented in this research, are in the same strength category according to EN 998-1 [10], meaning that the compressive strength of the mortars is between 3.5 MPa and 7.5 MPa. In this one, the environmental sustainability of the several mortars with incorporation of industrial wastes is discussed. This assessment will allow identifying and quantifying the environmental benefits of the incorporation of these industrial wastes in renders.
2. Sustainability and LCA
Life Cycle Assessment (LCA) is a possible tool to measure the real environmental sustainability of a construction. LCA is a tool to assess the environmental aspects and potential impacts associated to a product, process or service [3,11,12] and consists of four phases [12,13]:
- Goal and scope definition: Define and describe the product, process or activity, establish the assessment context, and identify the boundaries and the environmental aspects considered;
- Inventory analysis: Identify and quantify the energy, water and materials used and the environmental releases;
- Impact assessment: Assess the potential human and ecological effects of the energy, water and material use and of the environmental releases quantified in the inventory analysis;
- Interpretation: Evaluate the results of the inventory analysis and impact assessment to select the preferred product, process or service, with a clear understanding of the uncertainty and the assumptions used to generate the results.
The term “Life cycle” refers to the major activities in the course of the product life: production, use, maintenance and final disposal [12].
The LCA of a building or product can be more or less comprehensive depending on the level of detail intended. The level of detail is defined by the LCA boundary: “cradle to gate”, “gate to grave”, and “cradle to cradle”. The “cradle to gate” boundary is focused only on the product stage of the life cycle. The “gate to grave” boundary includes the construction process, the use and the end-of-life stages. The “cradle to cradle” boundary allows the most complete LCA and includes the life cycle stages of the previous ones and the reuse, recover or recycling options at the end-of-life of the materials.
A Life Cycle Inventory (LCI) is a process that quantifies the energy and raw material requirements, atmospheric and waterborne emissions, solid wastes, and other releases for the entire life cycle of a product, process, or activity [12]. The inventory analysis involves data collection and calculation procedures to quantify relevant inputs and outputs of a product, process or activity [13]. The level of accuracy and detail of the data collected is reflected throughout the remainder of the LCA process [12]. The inventory of a product based on data collection can be found in environmental product declarations (EPD), collected site-specific data, scientific researches, or in international databases.
The Life Cycle Impact Assessment (LCIA) is the evaluation of the potential human health and environmental impacts of the environmental resources and releases identified in the LCI [12].
In the following chapters, the goal definition and scope of the LCA, LCI, and LCIA are defined, and the results of several mortars with incorporation of industrial wastes are interpreted.
3. Materials
In this research, the environmental impacts of several mortars with incorporation of industrial wastes as replacers of sand and/or cement is discussed.
The wastes incorporated were: sanitary ware, glass reinforced polymer, forest biomass ashes, and textile fibers. Sanitary ware and glass fiber reinforced polymer replaced sand. Sanitary ware replaced sand in two different types of incorporation: as a filler (particles lower than 149 μm) [8] and as an aggregate (particles lower than 2 mm) [7]. The mortars with filler incorporation were labelled SWF and the ones with aggregate incorporation SW. Glass fiber reinforced polymer replaced sand as a filler [9] and the corresponding mortars were labelled GFRP. Forest biomass ashes replaced cement and the corresponding mortar were labelled FBA. Textile fibers were incorporated as an addition, i.e., they replaced both sand and cement and the respective mortars are labelled TF. In this research, the combination of these wastes was also studied. The combination of the wastes was designated by the sum of the wastes that compose the mix. For example, the combination of sanitary ware (as an aggregate) and glass reinforced polymer was labelled SW + GFRP. A reference mortar was also analyzed in this research and is labelled REF. All the environmental impacts of the modified mortars (mortars with wastes) were compared to those of the reference mortar. The volume of sand and cement replaced in each mortar and the total volume of recycled materials are presented in Table 1.
4. Methods
4.1. Goal and Scope Definition
In this research, LCA was carried out based on ISO 14040 [13] and ISO 14044 [14] and on EN 15804 [15]. The environmental sustainability of several mortars with industrial by-products, in comparison with a reference mortar (REF), was analyzed using this methodology.
The production process of mortars starts with the reception of the raw materials: cement, natural aggregate, admixtures (air entrainer, superplasticizer, and waterproofing agents) and wastes. Sanitary ware is the only raw material that goes through a treatment process (crushing and sieving) when it arrives at the factory. The remaining materials are directly stored in silos upon reaching the factory. The materials arrive in bulk through a lorry transport and are discharged by gravity into the silos, where they remain until mixing. The raw materials are mechanically mixed, at the right proportions, by an industrial mixer, and then contained in bags. The bags are composed of Kraft paper with a Low-Density Polyethylene (LDPE) layer. After bagging of the powder mortars, the bags go through a palletization process in which they are stacked on pallets with a plastic protection (PE shrink film layers on the lateral and top of the pallet) and stored in a specific area inside the factory. In the production process, some electric equipment is used (conveyor belt transport, automatic balance, filling machine, and automatic pallet wrapping) and its environmental impacts were considered.
4.2. Declared Unit
In this LCA, the declared unit was defined as a volume unit (1 m3) of finished powder mortars.
4.3. System Boundary
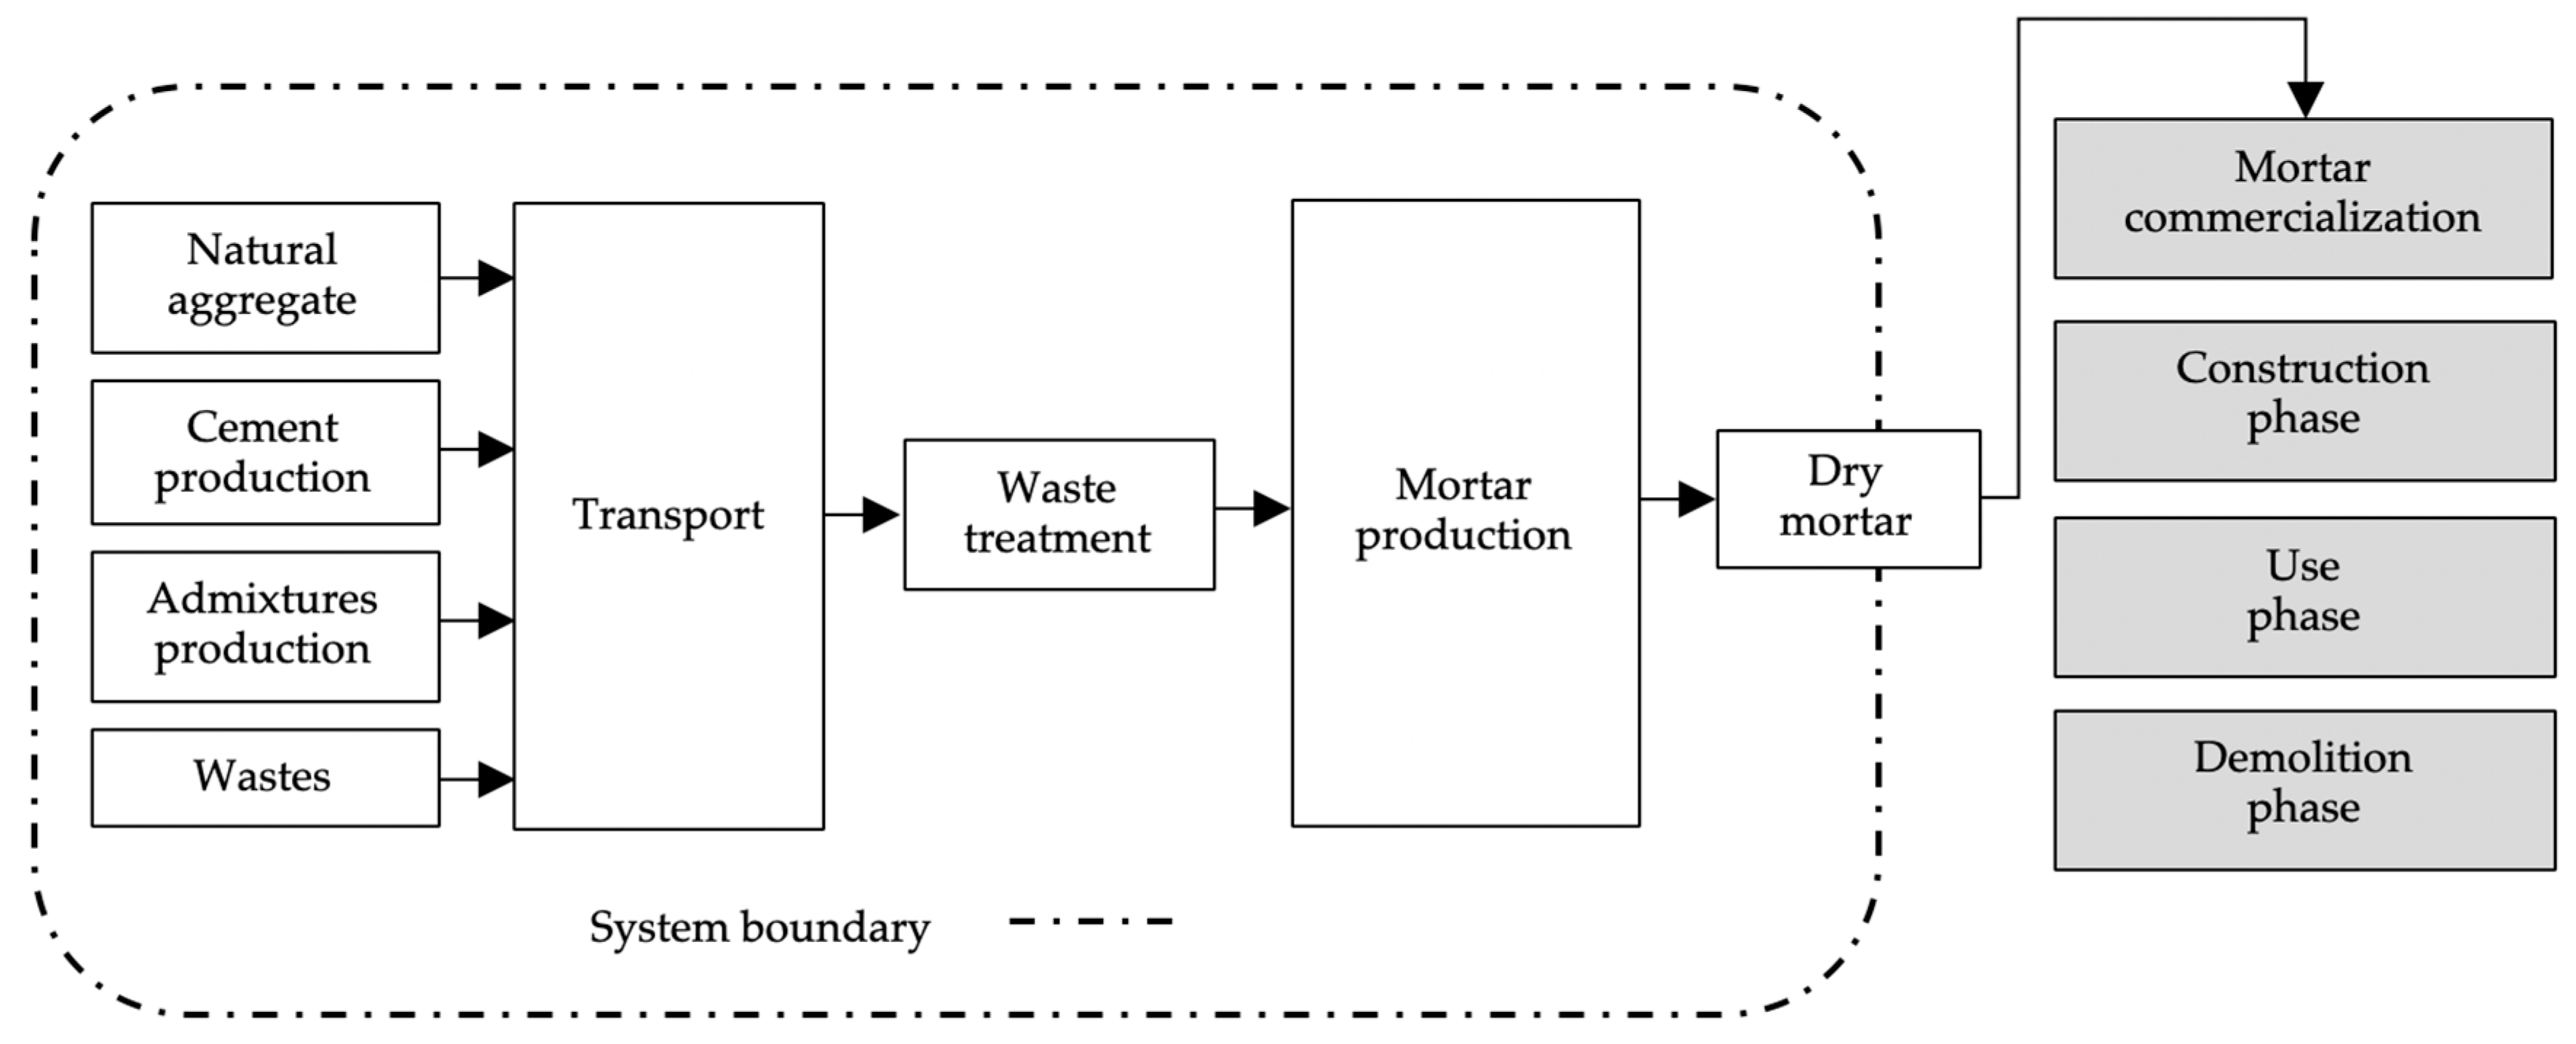
In this research, a “cradle to gate” boundary was considered. This boundary includes the analysis of raw materials extraction and processing (A1), their transport to the factory (A2), and the manufacturing process of the product (A3). In Figure 1, the boundary of the LCA is illustrated. The manufacturing process, in turn, was divided into:
- A3.1—Packaging materials that leave the factory with the final product (raw materials and transport of the packaging materials);
- A3.2—Manufacturing process (energy used, internal transport and waste production during the manufacturing process);
- A3.3—Production and disposal of wastes resulting from raw materials’ packaging and from packaging materials’ wastes.
4.4. Environmental Impact Categories under Analysis
The life cycle impact was assessed through the analysis of eight environmental impact categories required for Environmental Product Declarations (EPD) by EN 15804 [15]: Abiotic depletion potential (two components: ADP—materials and ADP—Fossil fuels), global warming potential (GWP), ozone depletion potential (ODP), photochemical ozone creation potential (POCP), acidification potential of land and water (AP), eutrophication potential (EP), use of non-renewable primary energy resources (PE-NRe), and use of renewable primary energy resources (PE-Re). The first six impact categories were analyzed according to the methodology of the Institute of Environmental Sciences (CML) from Leiden University, Netherlands, one of the most commonly applied in practice [3]. The last two impact categories (PE-NRe and PE-Re) were analyzed according to the Cumulative Energy Demand (CED) Method.
4.5. LCA Assumptions and Limitations
There were some limitations in the LCA methodology used in this research, due to the assumptions made. The assumptions and corresponding limitations identified were:
- The environment impact categories considered in the LCA were those that are commonly used in civil engineering activities (eight environment impact categories). However, there are other environmental impacts that could be estimated;
- The LCA of the powdered mortars was considered “cradle to gate”. Thus, the construction, use and end-of-life stages were not taken into account;
- The data used to obtain the environmental impacts of the processing of sanitary ware (crushing and internal transport from crushing area to storing area) were collected from Portuguese companies that produce granite aggregates. The energy used to crush sanitary ware aggregates can differ from the granite aggregates and, as mentioned, can differ if a different factory was chosen;
- Some data were collected and estimated by the companies because the inputs were not recorded separately at the production sub-stage;
- The data used to obtain the environmental impacts of the mortars production were collected from a specific Portuguese company. The energy used can differ if a different company is chosen;
- The factory was considered in a specific location. A different location would affect the transport distances and, consequently, the transport environmental impacts and the overall results;
- The environmental impacts of the mortars production were considered dependent only on the mortars’ bulk density, and other aspects could change these impacts;
- In some cases, it was not possible to use an EPD, a site-specific data collection or a scientific research to estimate the environmental impacts of a product or process. In those cases, databases from SimaPro software (Ecoinvent 3 and ELCD) were used. The data from these databases present some uncertainty because they are generic.
- The textile fibers added to some mortars under analysis had to be cut before their application in mortars. However, it was considered that the energy spent in this process is negligible by comparison with the other processes under analysis. Hence, the environmental impacts of the cutting process were not considered.
5. Life Cycle Inventory
The LCA data of cement, air entrainer, superplasticizer, and waterproofing admixtures were obtained from International EPD. The environmental impacts of cement were obtained from a report of the European Cement Research Academy [16] and the admixtures (air entrainer, superplasticizer, and water proofing) from three different reports of the European Federation of concrete admixtures associations [17,18,19], all from the year of 2015. The LCA data of sand (natural aggregate) were obtained from a generic dataset available in SimaPro (using version 3.05 of CML 2 baseline 2000 released by CML in April 2013, and CED version 1.10). The LCA data of sanitary ware (aggregate and filler incorporation) were obtained using site-specific data from a research study of Braga et al. [2] in a Portuguese company. No impacts were considered for GFRP, FBA, and TF by-products (in A1 product stage), because these production impacts were already associated to the product stage of the materials that originate them.
The life cycle inventory of transportation of the raw materials to the factory were obtained from the European Life Cycle Database (ELCD) from SimaPro software.
The life cycle inventory of the production of 1 m3 of powder mortars (A3) were adapted by a site-specific data from a research study by Silvestre [20] in Portuguese companies.
5.1. Raw Materials Production (A1)
The environmental impacts of cement were obtained from an EPD of the European Cement Research Academy [16]. This EPD was chosen because it is the most recent average dataset for Europe for CEM II. In Table 2, the results from the ECRA report are determined for a kilogram of cement in a cradle to gate LCA [16]. The environmental impacts of the natural aggregate were obtained from the European Life Cycle Database (ELCD) denominated “Sand 0/2 mm, wet and dry quarry, production mix, at plant, undried RER S”. In Table 2, the environmental impacts of the natural aggregate production are presented. The environmental impacts of the air entrainer, superplasticizer, and waterproofing admixtures were obtained from three EPDs of the European Federation of concrete admixtures associations. In Table 2, the results for each admixture by kilogram of product are presented.
Some wastes considered in this research are incorporated in mortars without any previous treatment, i.e., exactly in the form they were disposed of by other industries. Thus, the environmental impacts of the production of these wastes are associated with the product that originated them [21]. Glass fiber reinforced polymer waste and forest biomass ashes waste are examples of these wastes. The cutting process of textile fibers was not considered in this LCA and, therefore, there are no environmental impacts associated to this process. The sanitary ware waste, on the other hand, has to go through a processing procedure before its application in the mortars. The waste is crushed and sieved beforehand. This preparation process contributed to the environmental impacts of sanitary ware mortars. The environmental impacts of the crushing process of sanitary ware was obtained from site-specific data from a research study by Braga et al. [2] in Portuguese companies. Braga et al. [2] analyzed the impacts of the crushing and sieving process of limestone and granite aggregates. The sanitary ware waste’s hardness is more similar to that of granite aggregates than to limestone aggregates. Thus, the environmental impacts considered were the ones obtained in the crushing and sieving processes of granites aggregates. The crushing and sieving process takes place at the mortars’ factory. The transportation of the sanitary ware fine aggregates (filler and aggregates) inside the factory was also taken in account and the corresponding environmental impacts of this internal transportation have been adapted from Silvestre [20]. In Table 3, the environmental impacts results of processing 1 kg of sanitary ware to be incorporated in mortars are presented.
5.2. Transport (A2)
The transportation distance varies according to the supplier. In order to measure the distance between the materials origin (raw materials and packaging materials) and the factory, it was necessary to define a localization of the factory. A Portuguese factory of mortars localized in the Setubal district was therefore chosen.
Each waste came from a different supplier. The transport distance between the supplier and the factory was the real distance between the wastes and the factory.
The river sand in Portugal comes from different locations, depending on the distance and on the cost of the aggregates. Thus, to better represent the Portuguese scenario of natural aggregate acquisition, different locations of silica sand were identified, and an average distance (107 km away from the factory) was considered for the transport distance.
In Portugal, there is one major cement producer (CEM II) that is located in the Setúbal district. The distance between the cement producer and the mortars factory was about 28 km.
The wastes used in the mortars come from different locations. Glass fiber reinforced polymer come from the Lisbon district (58 km away from the factory), forest biomass ashes come from the Aveiro district (294 km away from the factory), textile fibers come from the Setúbal district just 24 km away from the factory, and sanitary ware comes from the Leiria district, about 166 km away from the factory.
To calculate the environmental impacts of transportation, an “Articulated lorry transport” (with a maximum capacity of 27 tonnes) was considered. The impacts produced by the transportation process were obtained from the European Life Cycle Database (ELCD) using SimaPro software. The results are presented in Table 4. An empty lorry produces less environmental impacts than when it is full [20] and, therefore, in the lorry return trip the environmental impacts were reduced by 30% [6].
5.3. Production Process (A3)
The environmental impacts of the production process of powder mortars were adapted from site-specific data from a research study by Silvestre [20] in a Portuguese company. Silvestre’s [20] research focused on the LCA of a powder mortar (component A) and a resin (component B) to be used as a two-component adhesive. The author analyzed the environmental impacts of each component individually. Thus, in this research, the results that correspond to the powder mortars (component A) were adapted (Table 5).
These results had to be adapted because some aspects of the mortars differ. Namely, the bulk density of the component A (1700 kg/m3) is different from that of the mortars used in this research (between 1040 and 1400 kg/m3). The difference in the bulk density has a direct influence on the bags used to contain the mortars. A lower bulk density implies a higher number of bags to contain 1 m3 of product, which affects the A3.1 substage of LCA.
6. Life Cycle Impact Assessment
The life cycle impacts were assessed by analyzing eight environmental impact categories.
Abiotic depletion potential corresponds to the use of mineral and energy resources [20]. This environmental impact category is essentially influenced by the rate of extraction of resources [5]. The effect of this consumption on the depletion of each resource is estimated according to the available stock of the latter at a global scale, given that the resource is considered non-renewable [22] or finite. This environmental category is divided in two components: an energy component (MJ) and a materials component (kg Sb equivalent).
Global warming potential is the environmental impact known as “Greenhouse effect” that represents the amount of the “greenhouse gases” emitted to the atmosphere [5,20]. The greenhouse gases reflect or trap the radiation emitted by the Earth’s surface, such as the infrared reflection of solar radiation, increasing the global medium temperature [20]. The increment of temperature is higher with the rise of the concentration of these gases and can result in several climate changes that can affect the ecosystems and human health [20]. The main gases responsible for the greenhouse effect are carbon dioxide (CO2), methane (CH4) and halocarbons (CFC and HCFC) [5,20] and N2O. According to the U.S. Environmental Protection Agency [12], the global warming is responsible for several environmental impacts such as polar melting, soil moisture loss, longer seasons, forest loss/change, and change in wind and ocean patterns.
The ozone layer is reduced with the concentration of Halocarbons in the atmosphere. These gases dissociate the ozone molecules present, reducing the thickness of their layer [5]. The depletion of the stratospheric ozone layer increases ultraviolet radiation that can reach the Earth’s surface [12,20]. This radiation can affect the ecosystems and human health [20].
Photochemical oxidation produces several reactive chemical compounds, where the most important are Peroxyacetylnitrate and Ozone [20]. Ozone can occur naturally but can also result from the photochemical oxidation of gases emitted by vehicles [20]. The vehicles produce carbon monoxide (CO) and volatile organic compounds (VOC). When sunlight hits VOC, they form airborne particles and ground level ozone, commonly called “smog” [20]. Thus, the concentrations of ozone are higher in the summer and, due to its toxic nature, can directly affect human health, being responsible for eye irritation, respiratory tract and lung irritation [12] and ecosystems disruption [20].
The main gases responsible for acidification are produced by the combustion of fossil fuels: Sulfur dioxide (SO2), nitrous oxides (NOx), and reduced nitrogen (NHx) [5,20]. The sulfur compounds deposit within two to four days after emission and, therefore, affect areas close to the emission source [20]. The acidification can affect the soil, ground and surface water, animals, ecosystems, and also the building environment [12].
Eutrophication is the enrichment by nutrients, mainly nitrogen and phosphorus from polluting emissions, wastewater and fertilizers, originating excessive development of algae and plants [5]. This excessive development decreases the rates of oxygen and solar energy in the case of aquatic eutrophication, and results in the contamination of plants and groundwater in terrestrial eutrophication [5,12].
Non-renewable primary energy is produced by resources that exist in a finite amount that cannot be replenished on a human time scale (EN 1508, 2012). The renewable primary energy comes from renewable non-fossil sources, corresponding to resources that grow naturally, are replenished or naturally cleansed, at a human time scale (EN 1508, 2012).
All the environmental impacts in analysis were measured for 19 modified mortars and for a reference mortar (Table 6).
6.1. Abiotic Depletion Potential
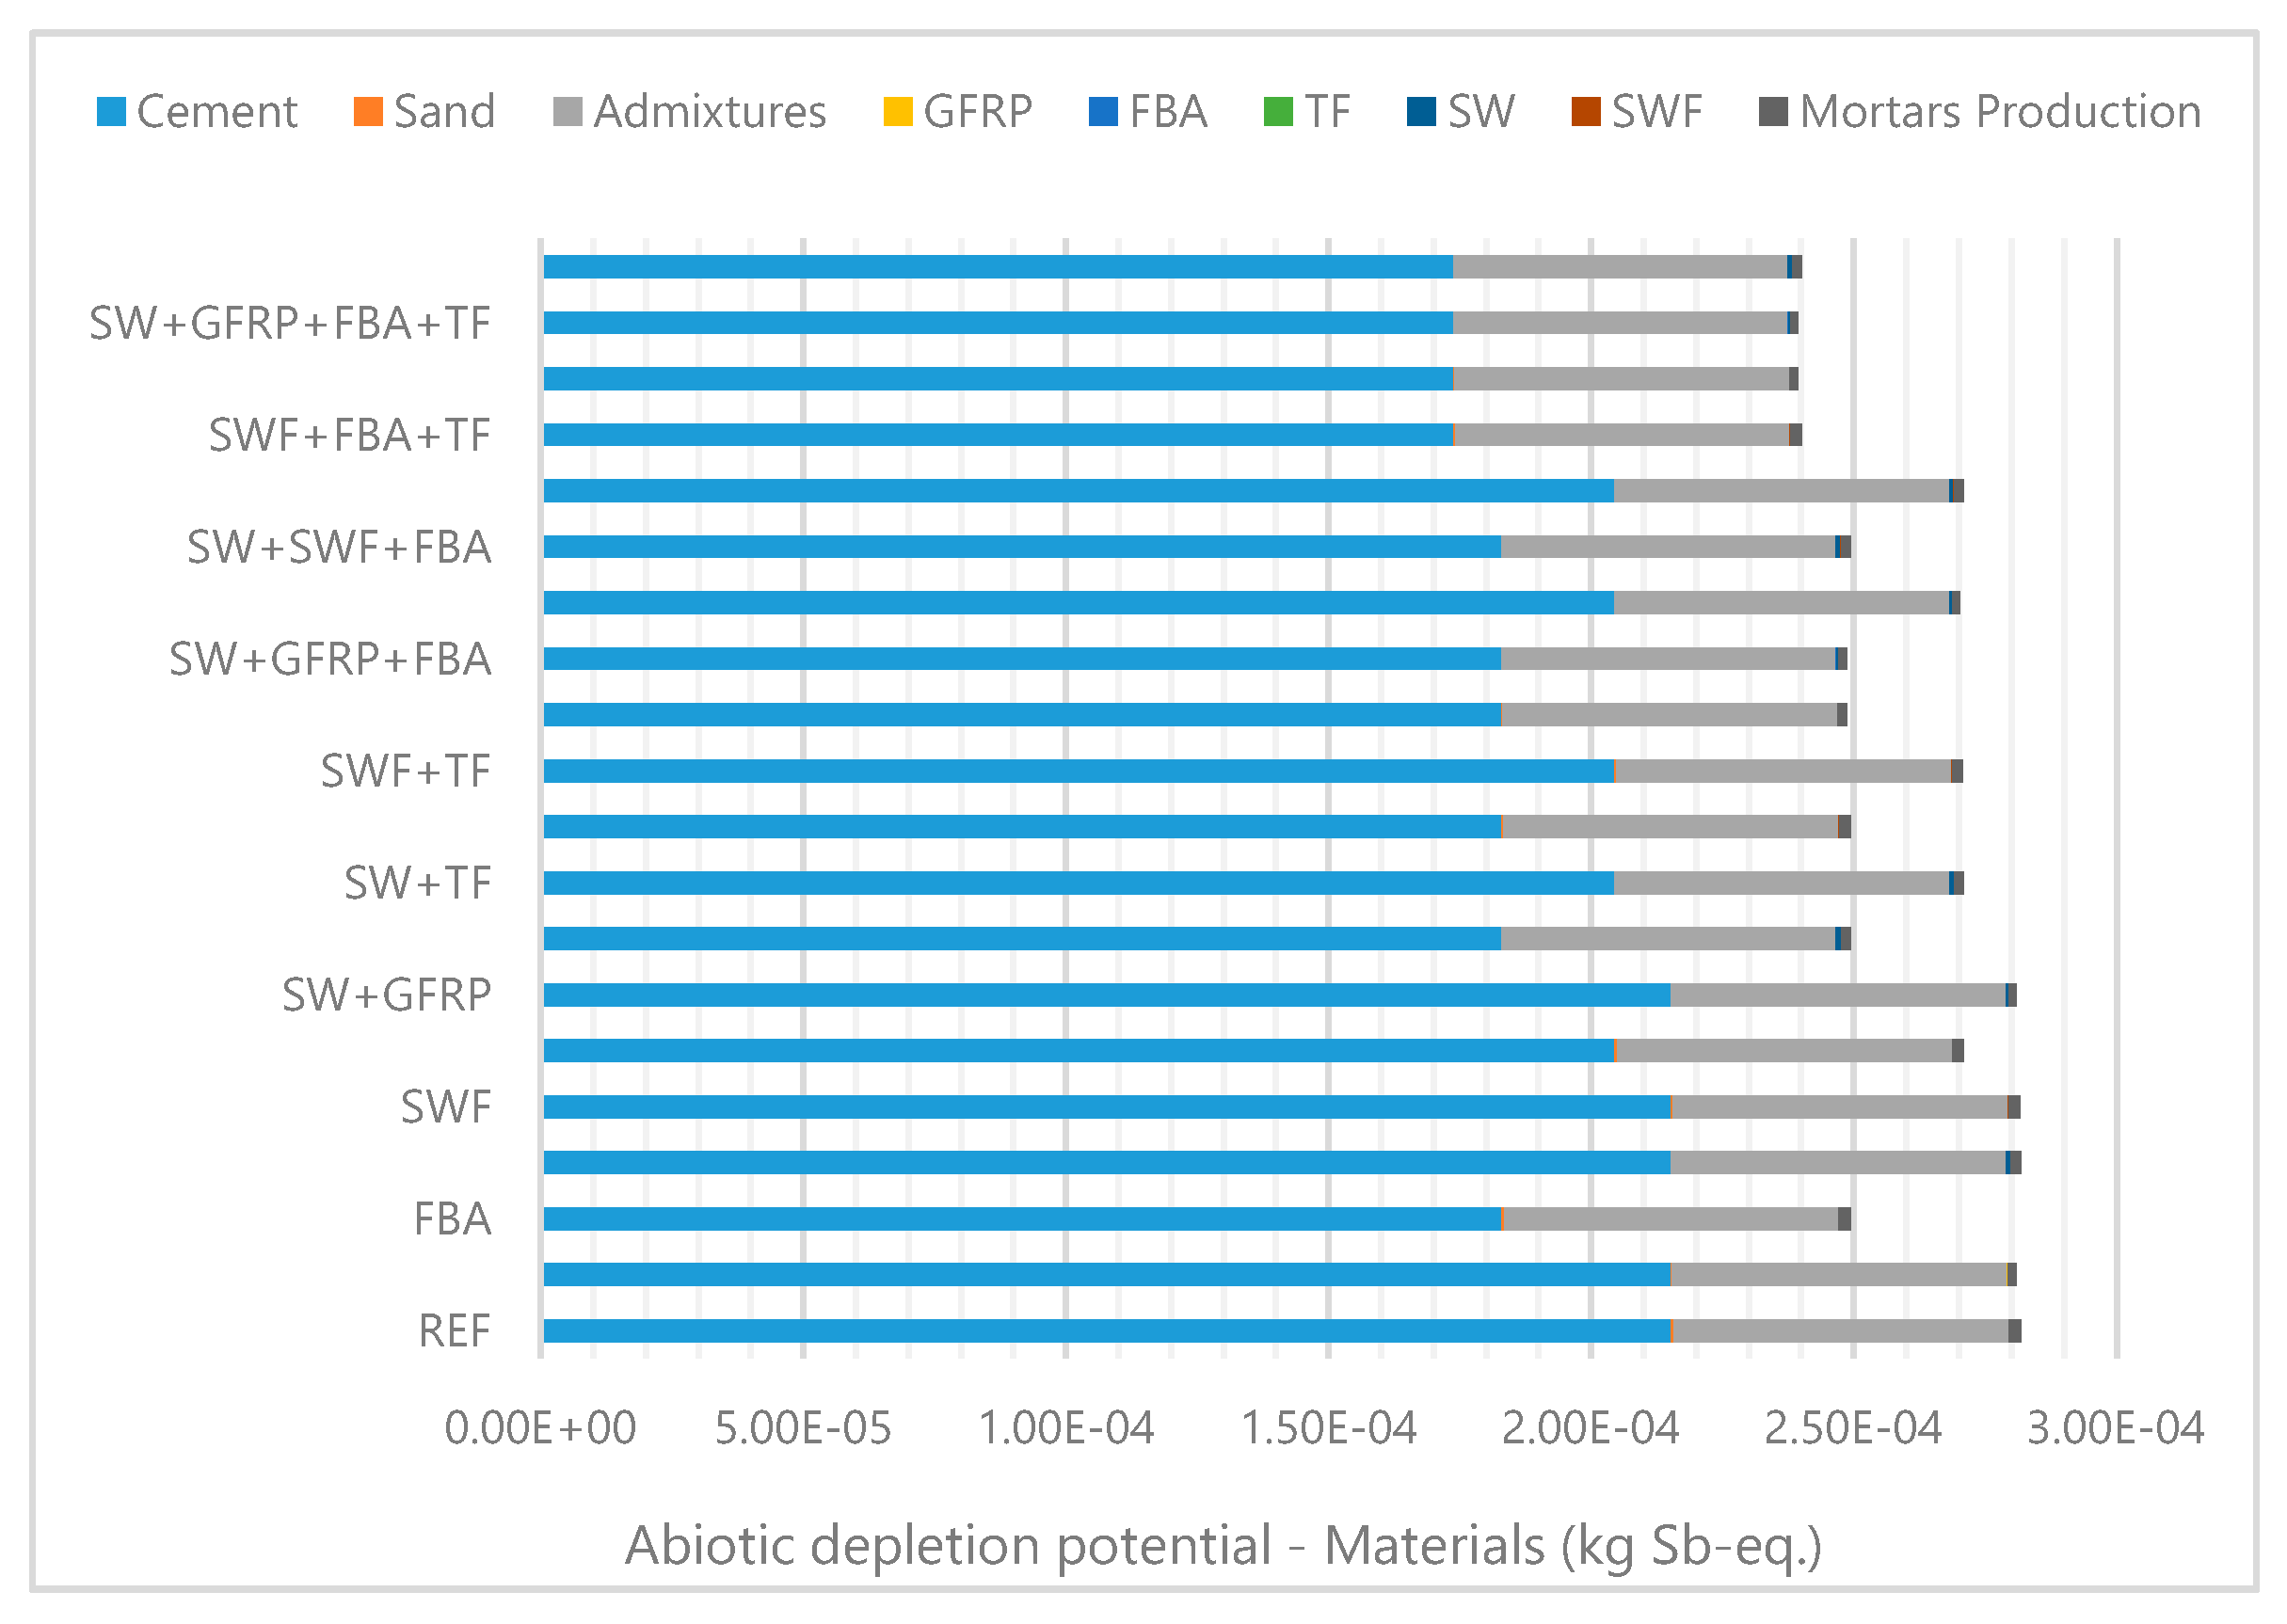
• ADP—Materials
Cement and admixtures were the constituents with higher impact in this component of ADP impact category. The binder was responsible for over 75% of the total impacts and admixtures for almost 25%. In this category, all mortars had an impact similar to or lower than that of the reference mortar (Figure 2).
Among the mortars with one waste only, the forest biomass ashes and the textile fibers wastes were the only ones that, when incorporated in mortars, reduced the material component in ADP impact. The remaining wastes had an equal impact to that of the reference mortar. These two wastes had a lower impact because they reduce the cement content of the mortars. In fact, the FBA waste replaced 15% of the total volume of cement, decreasing the most polluting constituent of the mortar in this impact category: cement. In this sense, the mortars that incorporate this waste were the ones that had the greatest reduction in this impact category: SW + FBA + TF, GFRP + FBA + TF and SW + GFRP + FBA + TF mortars were the ones that presented the lowest ADP—Materials impact, with a decrease of 15% in comparison with REF.
Therefore, the incorporation of wastes in general decreases the ADP—Materials in comparison with current mortars.
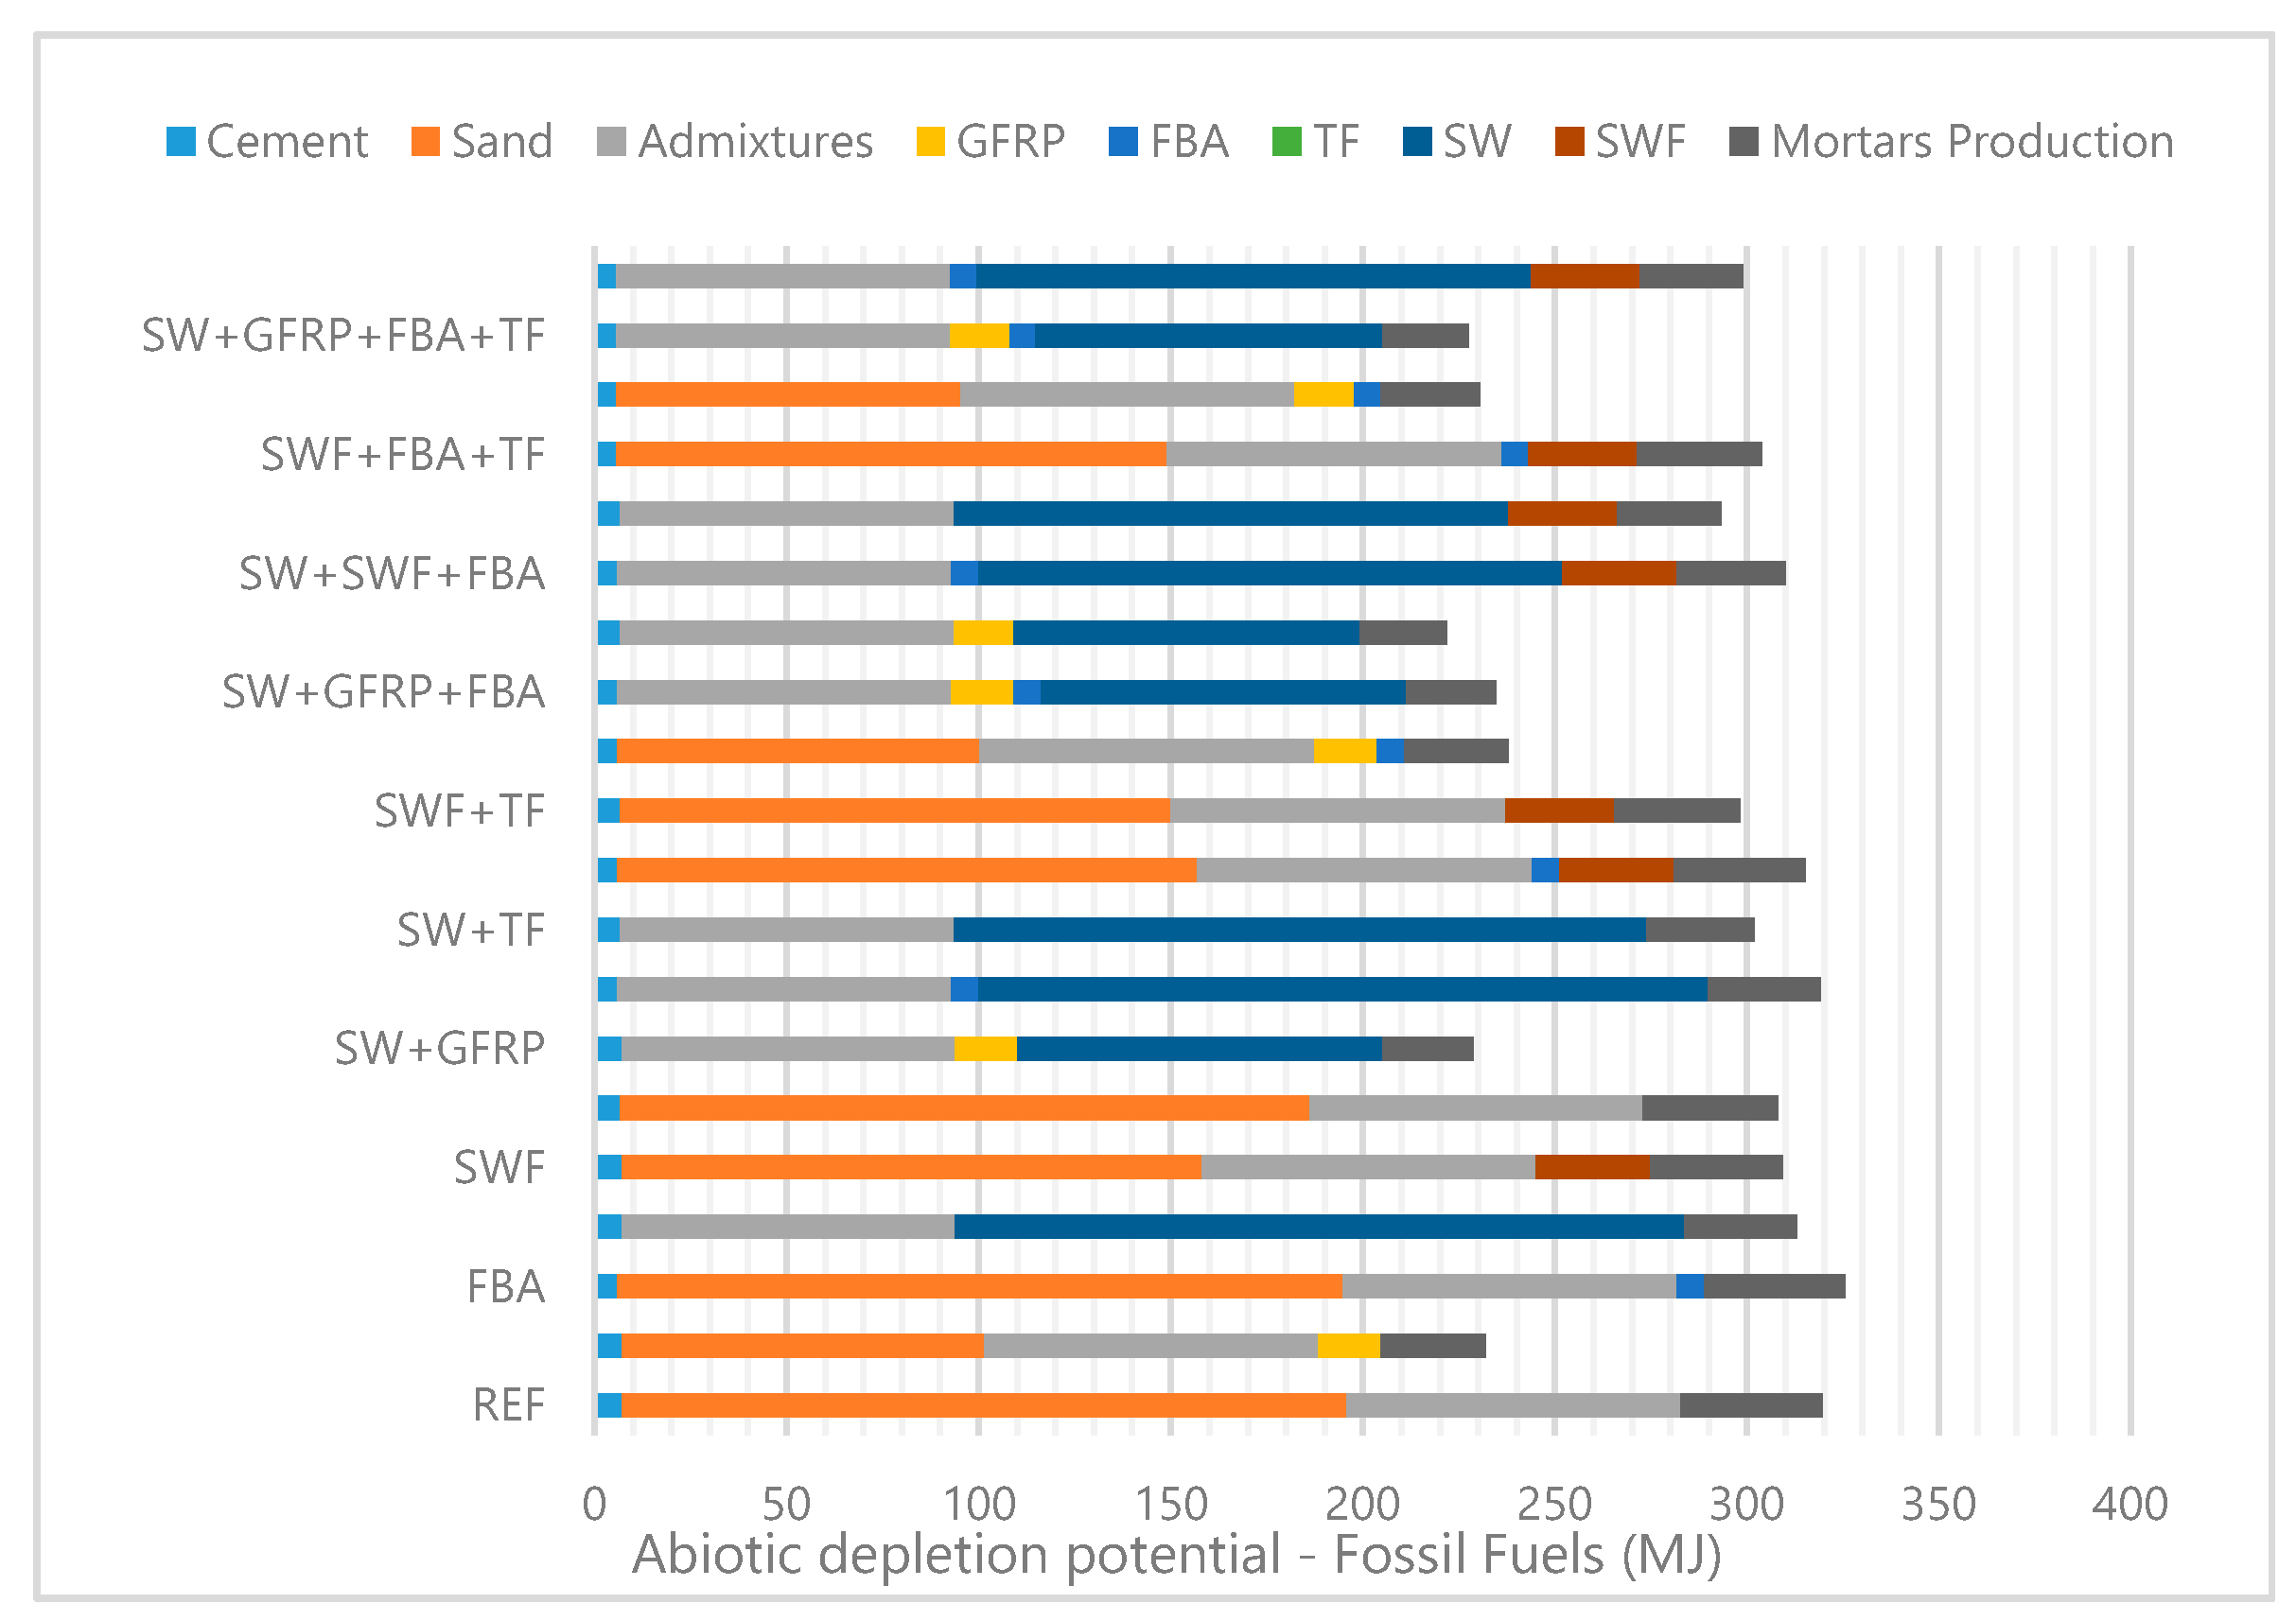
• ADP—Fossil fuels
In this environmental impact category, the mortars’ constituents that most contribute were sand and admixtures. Cement did not give a large contribution to this environmental impact category due to the small transportation distance, in comparison with the other raw materials. Sand was responsible for 40% to 60% of the total impact and admixtures for about 30%, the remaining being mainly due to the production process. The wastes also contributed to this impact category mainly due to the impacts of the transport process. The treatment process of sanitary ware waste also contributed to the increment of the impacts in this environmental category.
In this environmental category, the mortars had, in general, an impact similar to or lower than that of the reference mortar, with the exception of the FBA mortar (Figure 3).
Transport revealed to be the most relevant factor in the fossil fuels component of the abiotic depletion potential environment impact. Therefore, the wastes transport distance revealed to be greatly relevant in this impact category. FBA is the waste that comes from the longest distance-294 km until reaching the factory, thus having the greatest impact. The FBA mortar showed an increase of ADP—Fossil fuels impact of 2% relative to the reference mortar. If this distance of the waste were reduced to 110 km, this mortar would have the same environmental impact as REF’s. On the other hand, the lower transport distance of GFRP waste, in comparison with sand, was responsible for a considerable decrease of ADP—Fossil fuels. In this sense, the mortars that contain GFRP waste showed lower impacts in this environmental impact category: the GFRP, SW + GFRP, GFRP + FBA, SW + GFRP + FBA, SW + GFRP + TF GFRP + FBA + TF and SW + GFRP + FBA + TF mortars showed an environmental impact more than 25% lower than REF’s.
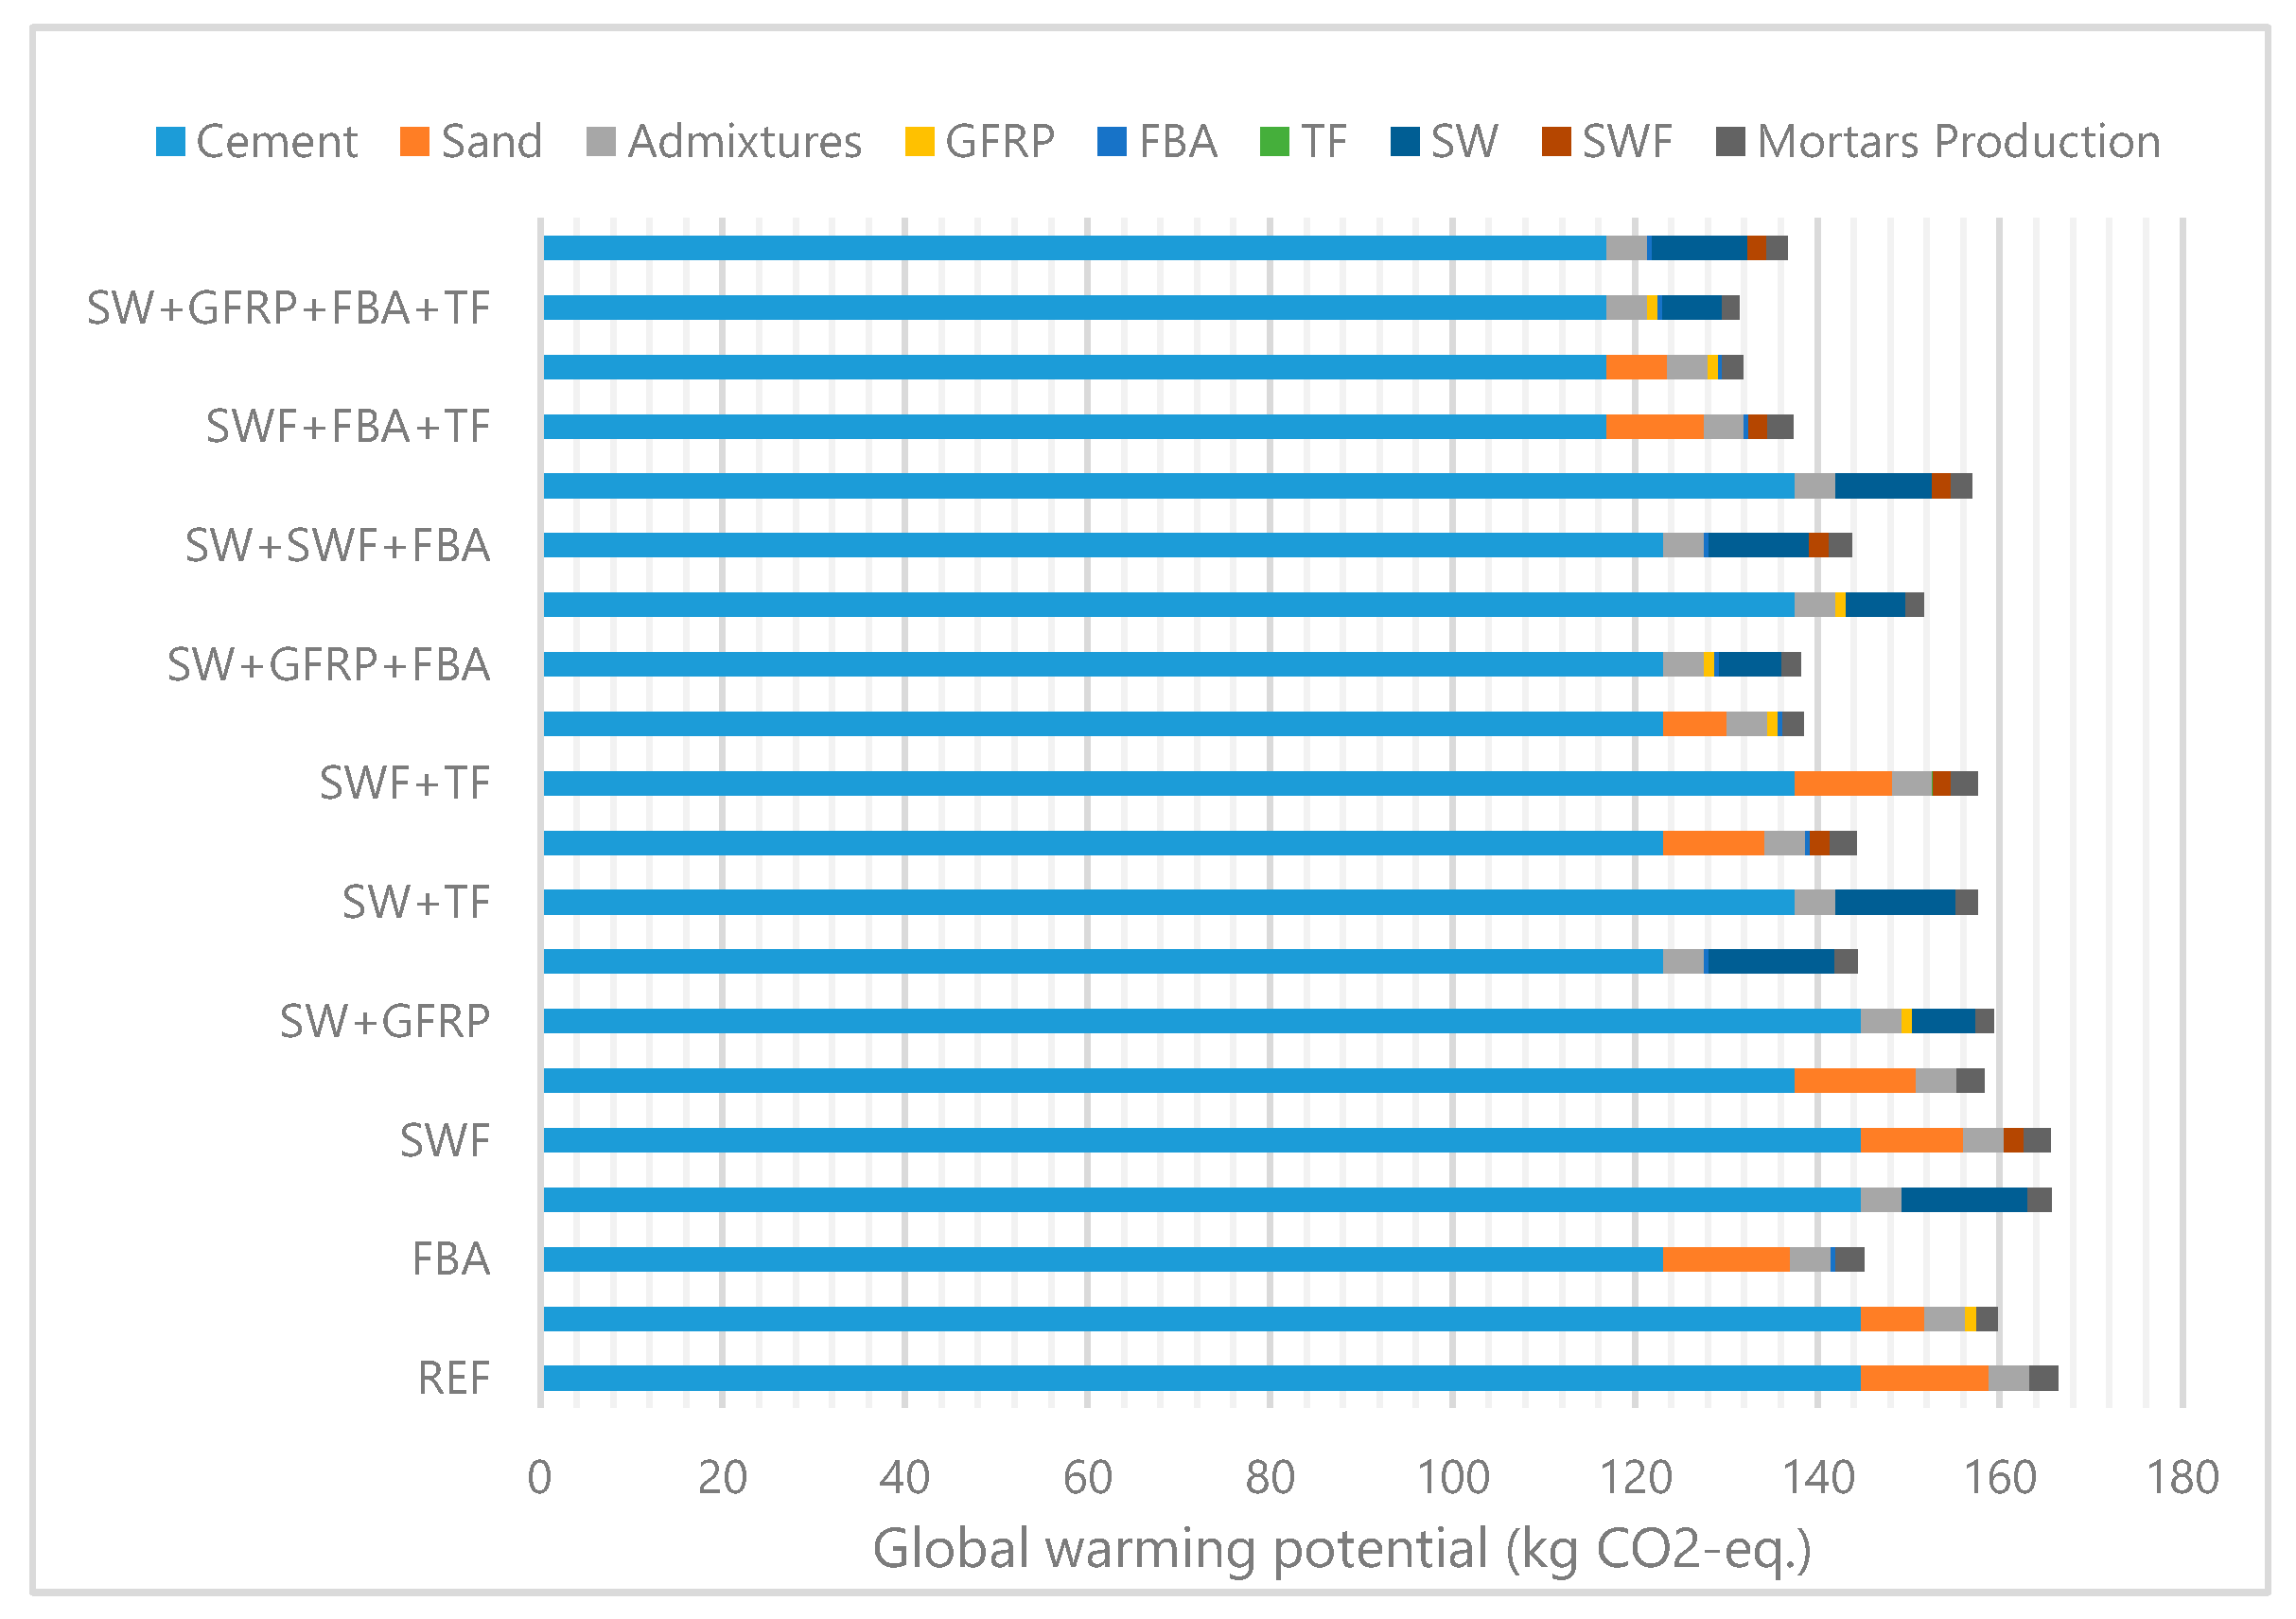
6.2. Global Warming Potential
In the mortars analyzed, cement was the component that contributed the most to the global warming impact, increasing the greenhouse gases sent to the atmosphere. Cement was responsible for more than 85% of the GWP impact. The natural aggregate also contributed, at a smaller scale, to this impact: about 8%. In what concerns industrial wastes, sanitary ware was the only one, when incorporated in mortars, which presented an equal GWP impact, in comparison with REF’s mortar. The crushing process and internal transportation (between the crushing area and the storing area) in the factory were the main reasons for the impact value. The remaining wastes, when incorporated in mortars, reduced the global warming potential of the mortars, when compared with current ones (Figure 4).
The industrial wastes incorporated in mortars substituted sand, cement or both. Therefore, all the mortars with wastes presented a lower GWP impact than that of the reference mortar, with the exception of the SW and SWF mortars that had a similar impact in this category. In the remaining mortars, the decrease of the GWP impact (in comparison with REF’s) was between 3% and 21%, depending on the mortars. The mortars with FBA content decreased the GWP impact at least by 13%, due to the cement replacement. The mortars with lower GWP environmental impact were GFRP + FBA + TF (21% lower) and SW + GFRP + FBA + TF (21% lower).
In fact, cement is well known for being a relevant contributor to global warming [3]. According to the International Energy Agency [23], the global CO2 emissions reached 32.5 billion tons in 2017. The world cement production contributed with 4.65 billion tons [24], which corresponds to a 615 kg/habitant and about 7% of the total CO2 production generated worldwide. Therefore, it was expected that the mortars impact in GWP was mainly influenced by the cement content. The same was concluded by other authors [1,3,6].
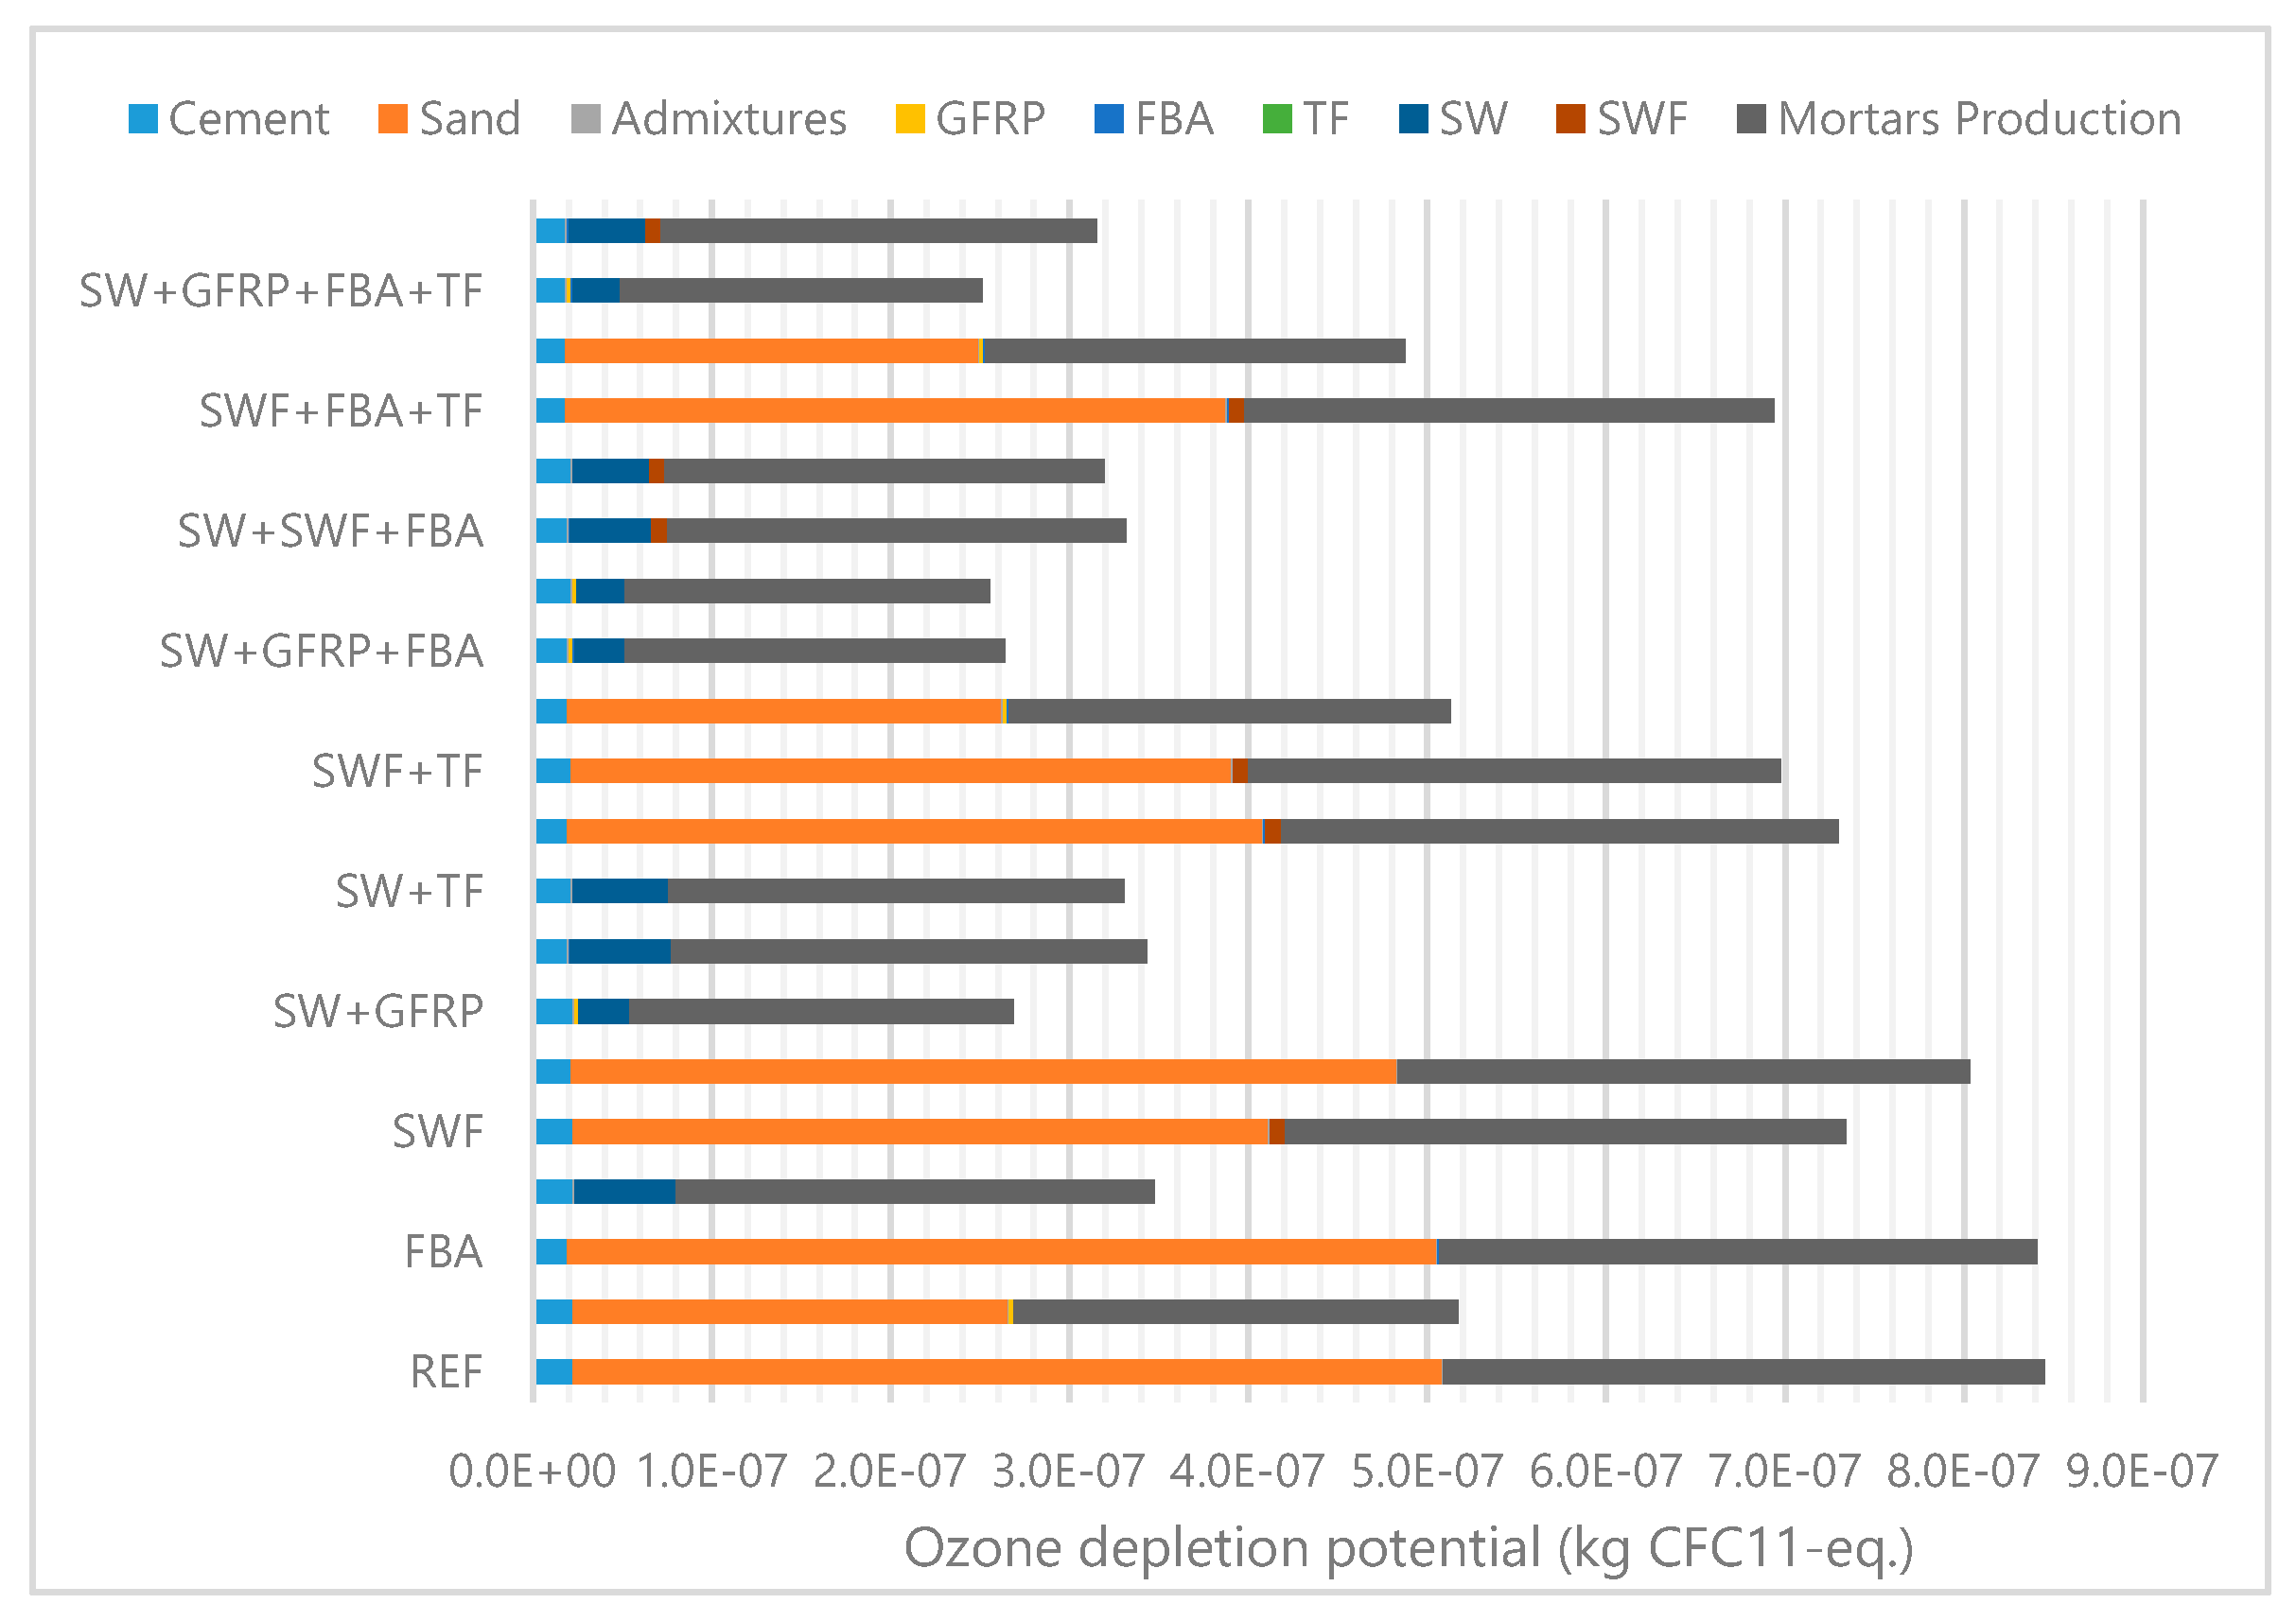
6.3. Ozone Depletion Potential
According to Silvestre et al. [25], the HCFCs were already banned in Europe and in USA. Therefore, the analysis of this environmental category is just indicative and does not have a significant influence on the environmental sustainability assessment.
The natural aggregate was the main contributor to the ODP impact, representing almost 60% of the total impact produced by the REF mortar. The mortars’ production was responsible for almost the remaining 40% of the impact.
In what concerns the industrial wastes, as in the previous impact categories, sanitary ware was the one that had a higher ODP impact. However, the impact of the production of sanitary ware’s mortar was completely offset by its benefit as sand replacement (Figure 5). The SW mortar, which replaced sand at 100%, reduced the ODP impact by almost 60%. The GFRP mortar, which replaced sand at 50%, reduced the ODP impact by almost 40%. The SW and GFRP wastes were the ones that replaced the greater volume of sand; therefore, all the mortars that contained these wastes improved their performance in this impact category.
The bulk density of the mortars influences the energy used in mortars’ production. A lighter mortar decreases the energy used in internal transport, in the mixing and in other processes (as bagging and palletization). Less than sand, the bulk density of mortars influenced the ODP impact, due to the production process.
Figure 6 shows that all the mortars (with industrial wastes) presented lower ODP impact than the REF’s. The mortars with lowest ODP impact were the ones that incorporated SW or GFRP waste and the lighter ones. The mortars SW + GFRP + TF and SW + GFRP + FBA + TF reduced the impacts in this environmental category in 70%, relative to a current mortar.
Once more, the incorporation of these wastes improved the performance in another environmental impact category, reaching improvements of 70%.
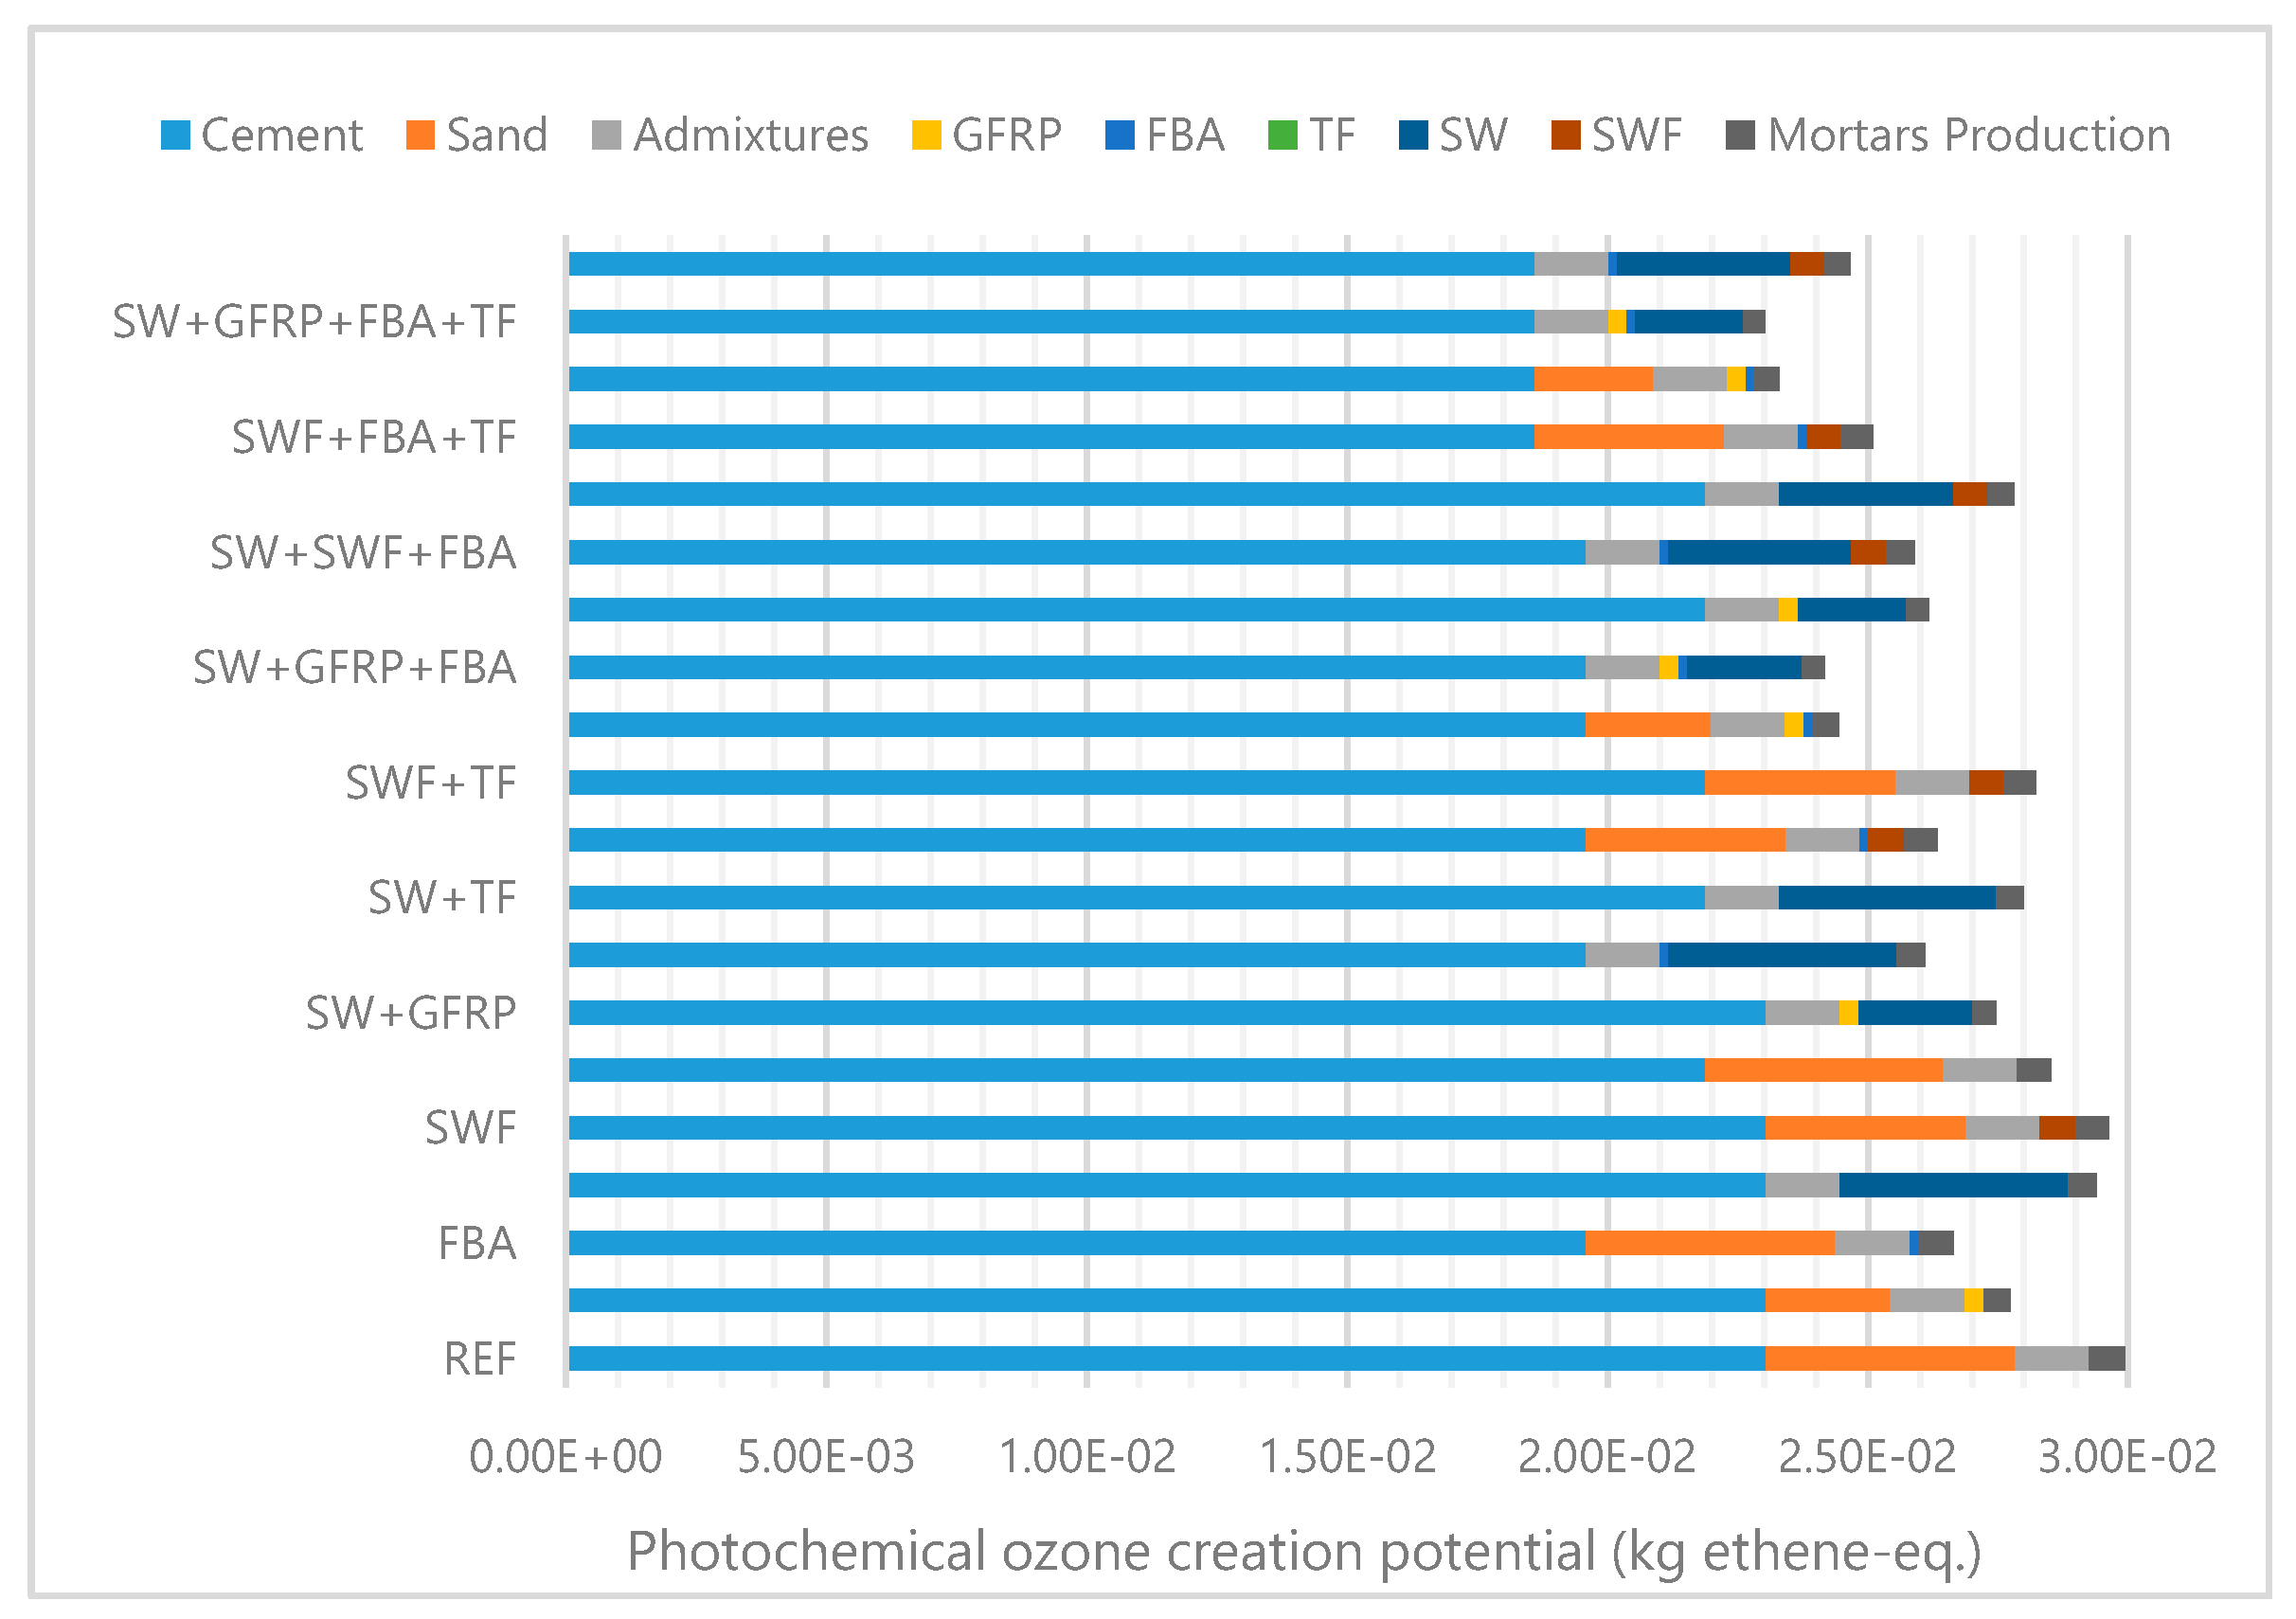
6.4. Photochemical Ozone Creation Potential
In the mortars analyzed, cement was the component that mostly contributed to the POCP impact, increasing the concentration of ozone at the ground level. Cement was responsible for more than 75% of the POCP impact. In the REF mortar, the natural aggregate contributed with about 16% of the POCP impact and admixtures about 5%, the remaining contribution being due to the mortar’s production (A3).
As mentioned, industrial wastes incorporated in mortars substitute sand, cement or both. Consequently, all the mortars with wastes presented a lower POCP impact than that of the reference mortar (Figure 6). The decrease of POCP impact (in comparison with REF’s) was between 1% and 23%, depending on the mortars. The waste that most reduced the impacts in this environmental category was FBA. This waste replaced the cement at 15% in the FBA mortar and, with this replacement, reduced the POCP impact by 11%. The mortars that had the lowest impact were, therefore, the ones that incorporate FBA waste, such as GFRP + FBA + TF and SW + GFRP + FBA + TF mortars, with 22% and 23% less, respectively.
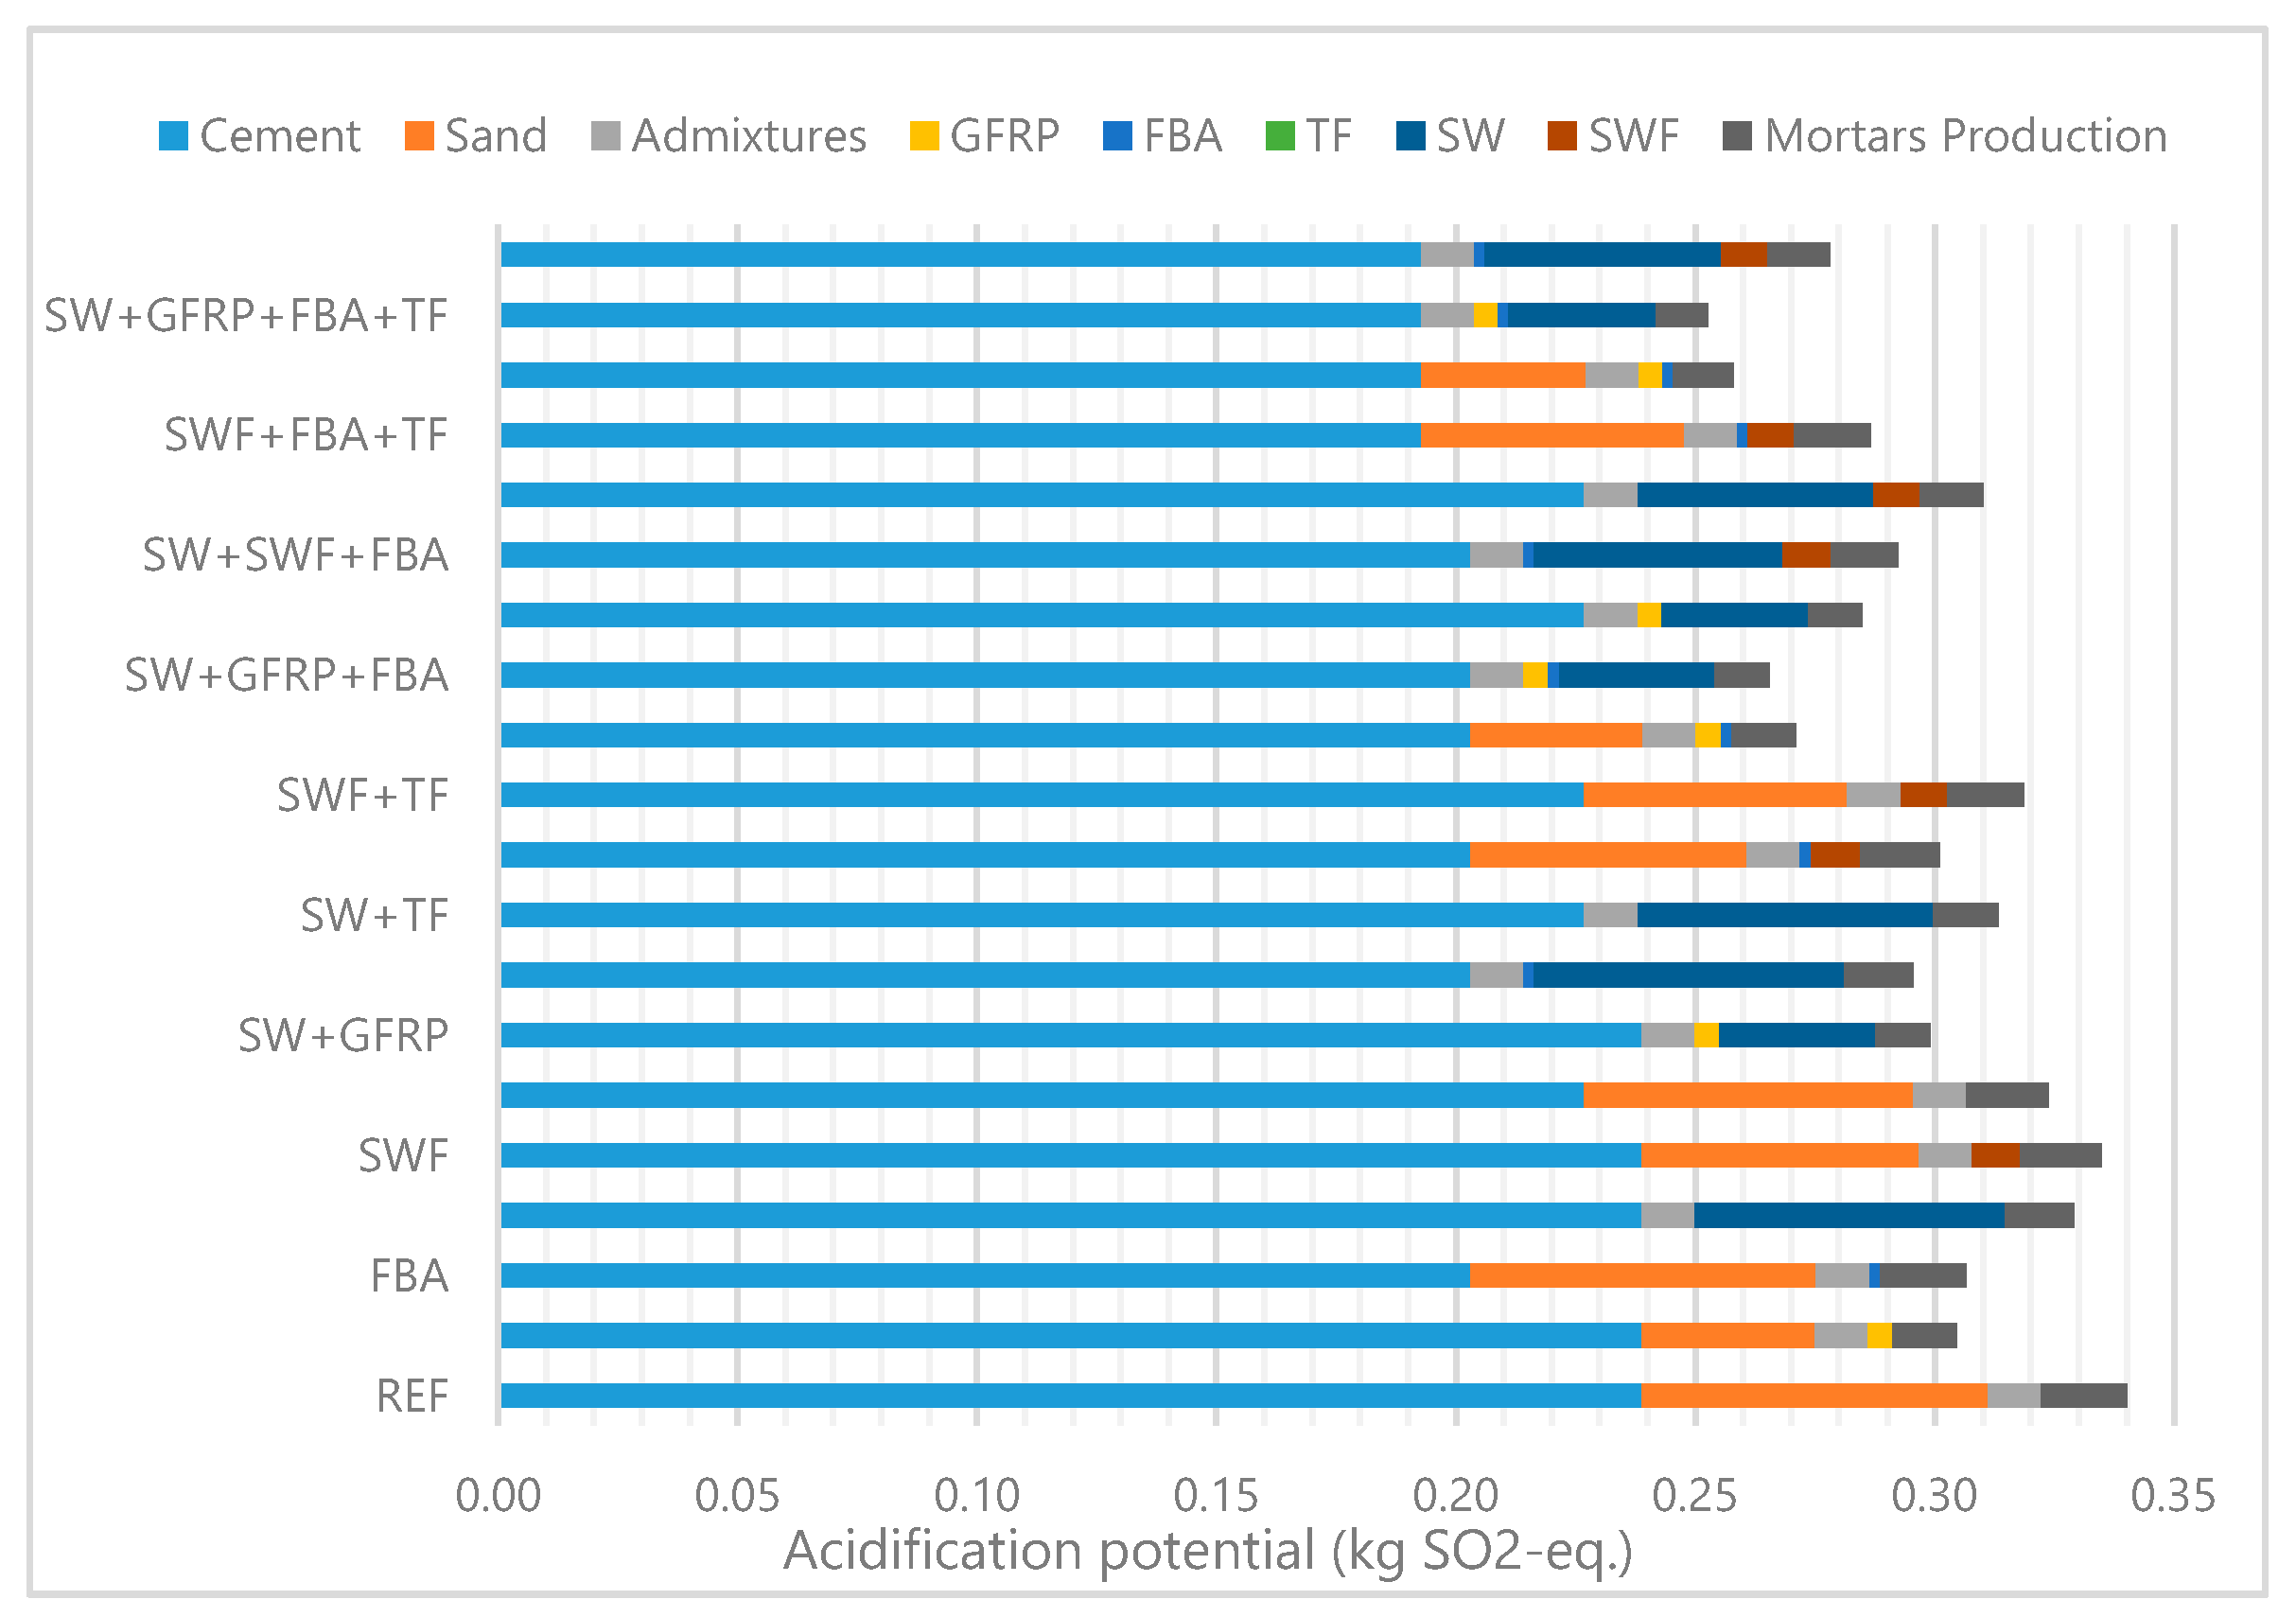
6.5. Acidification Potential of Land and Water
The AP impact produced by the mortars was influenced mainly by cement and sand (raw materials production and transportation). In the REF mortar, the impact of cement and sand was over 90% of the total. Sanitary ware waste was the industrial waste that produced higher environmental impact.
Figure 7 shows the total impact of the analyzed mortars in the AP impact category. In this figure, all the mortars with industrial wastes presented a lower AP than the REF’s, which was expected since the wastes replace the initial constituents of the mortars. The mortars that presented the lowest AP impact were: GFRP + FBA (20% lower), SW + GFRP + FBA (22% lower), GFRP + FBA + TF (24% lower), and SW + GFRP + FBA + TF (26% lower).
6.6. Eutrophication Potential
The EP impact is significantly influenced by cement and sand incorporation. Cement, in general, was responsible for more than 60% of the total impact, and sand for 25%. The sanitary ware waste, due to the processing procedure, also contributed directly to the EP impact.
Figure 8 presents the impacts produced by each mortar in the EP environmental impact category. All the modified mortars presented an impact equal to or lower than that of the reference mortar, due to the replacement of the initial constituents (cement or sand). The reduction was between 0% and 25%. The mortars with lowest EP impact were GFRP + FBA, SW + GFRP + FBA, GFRP + FBA + TF and SW + GFRP + FBA + TF mortars, with respectively 21%, 21%, 25%, and 25% less impact.
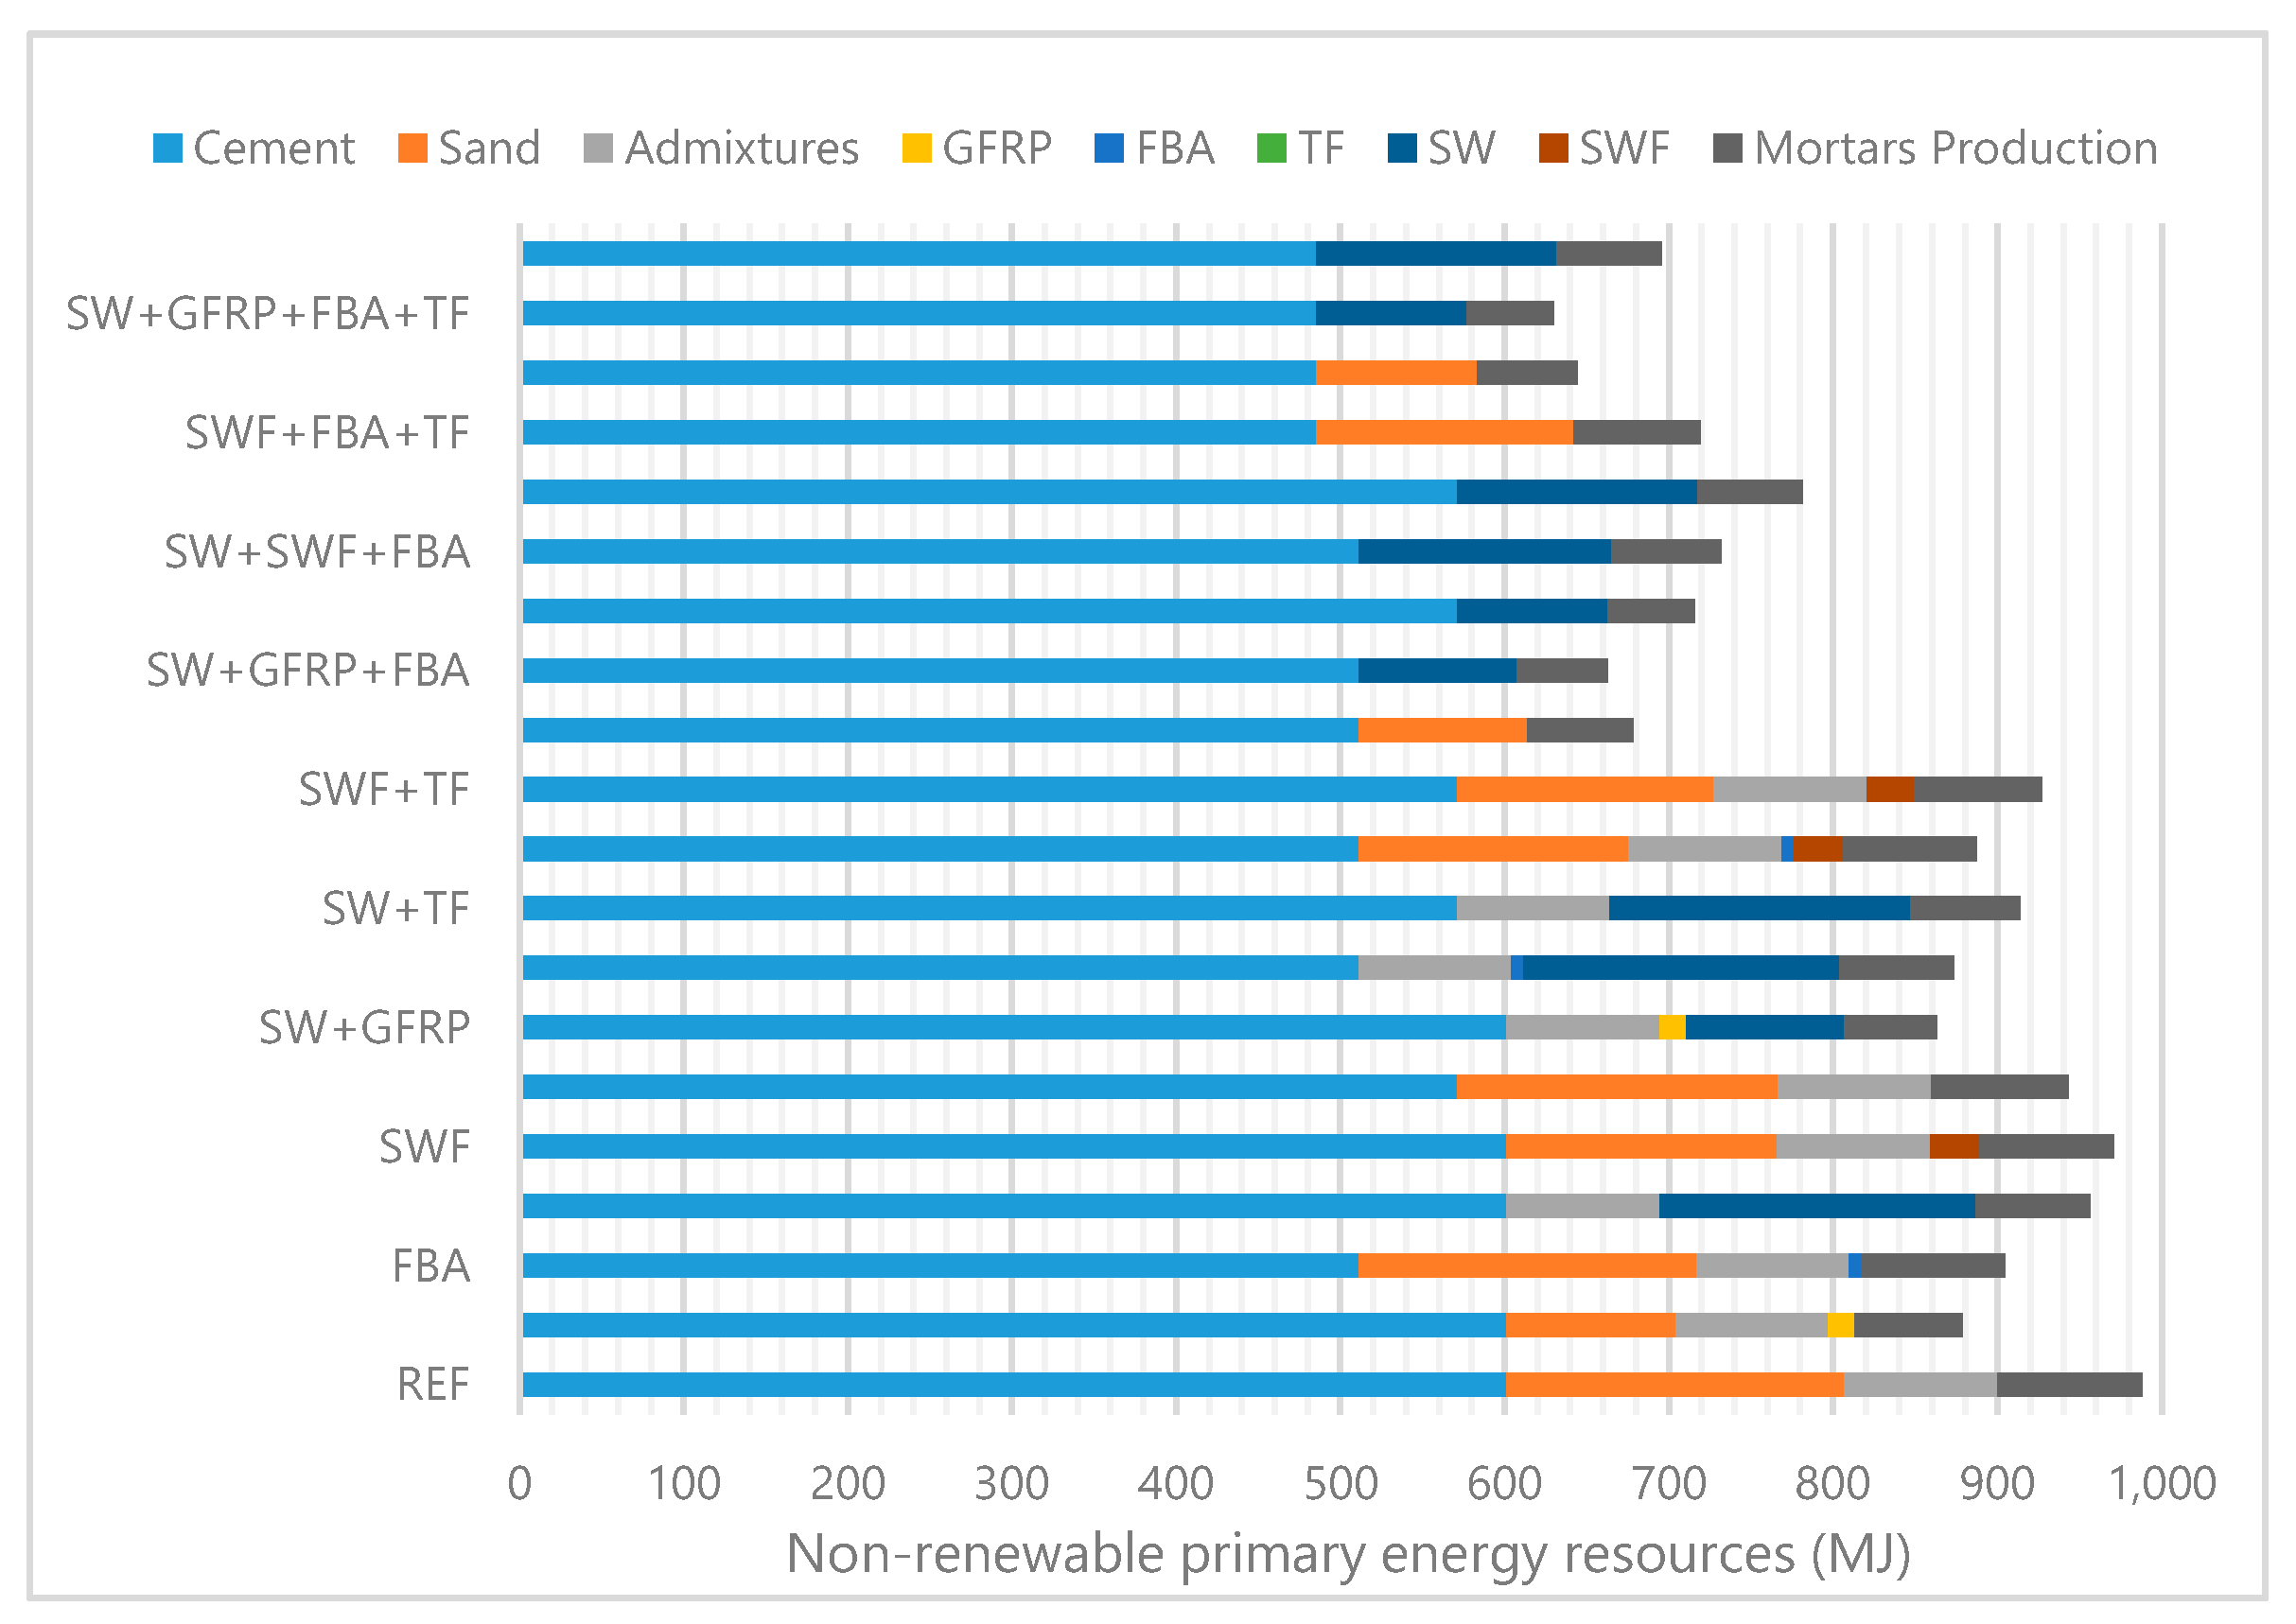
6.7. Use of Non-Renewable Primary Energy Resources
Cement was responsible for more than 60% of the PE-NRe impact in the REF mortar. The sand was responsible for about 20% of the impact, and the mortars production and admixtures used in the mixes for the remaining. Sanitary ware waste also increased the PE-NRe impact, but its impact was lower than sand’s. With a reduction of the primary components (cement and sand), the modified mortars decreased the PE-NRe impact in the final product (Figure 9). All the modified mortars presented less non-renewable energy spending than that of the REF’s. Seven out of the 19 mortars under analysis decreased the impact by 10% to 20%, and four presented a decrease higher than 20%, relative to the REF mortar.
6.8. Use of Renewable Primary Energy Resources
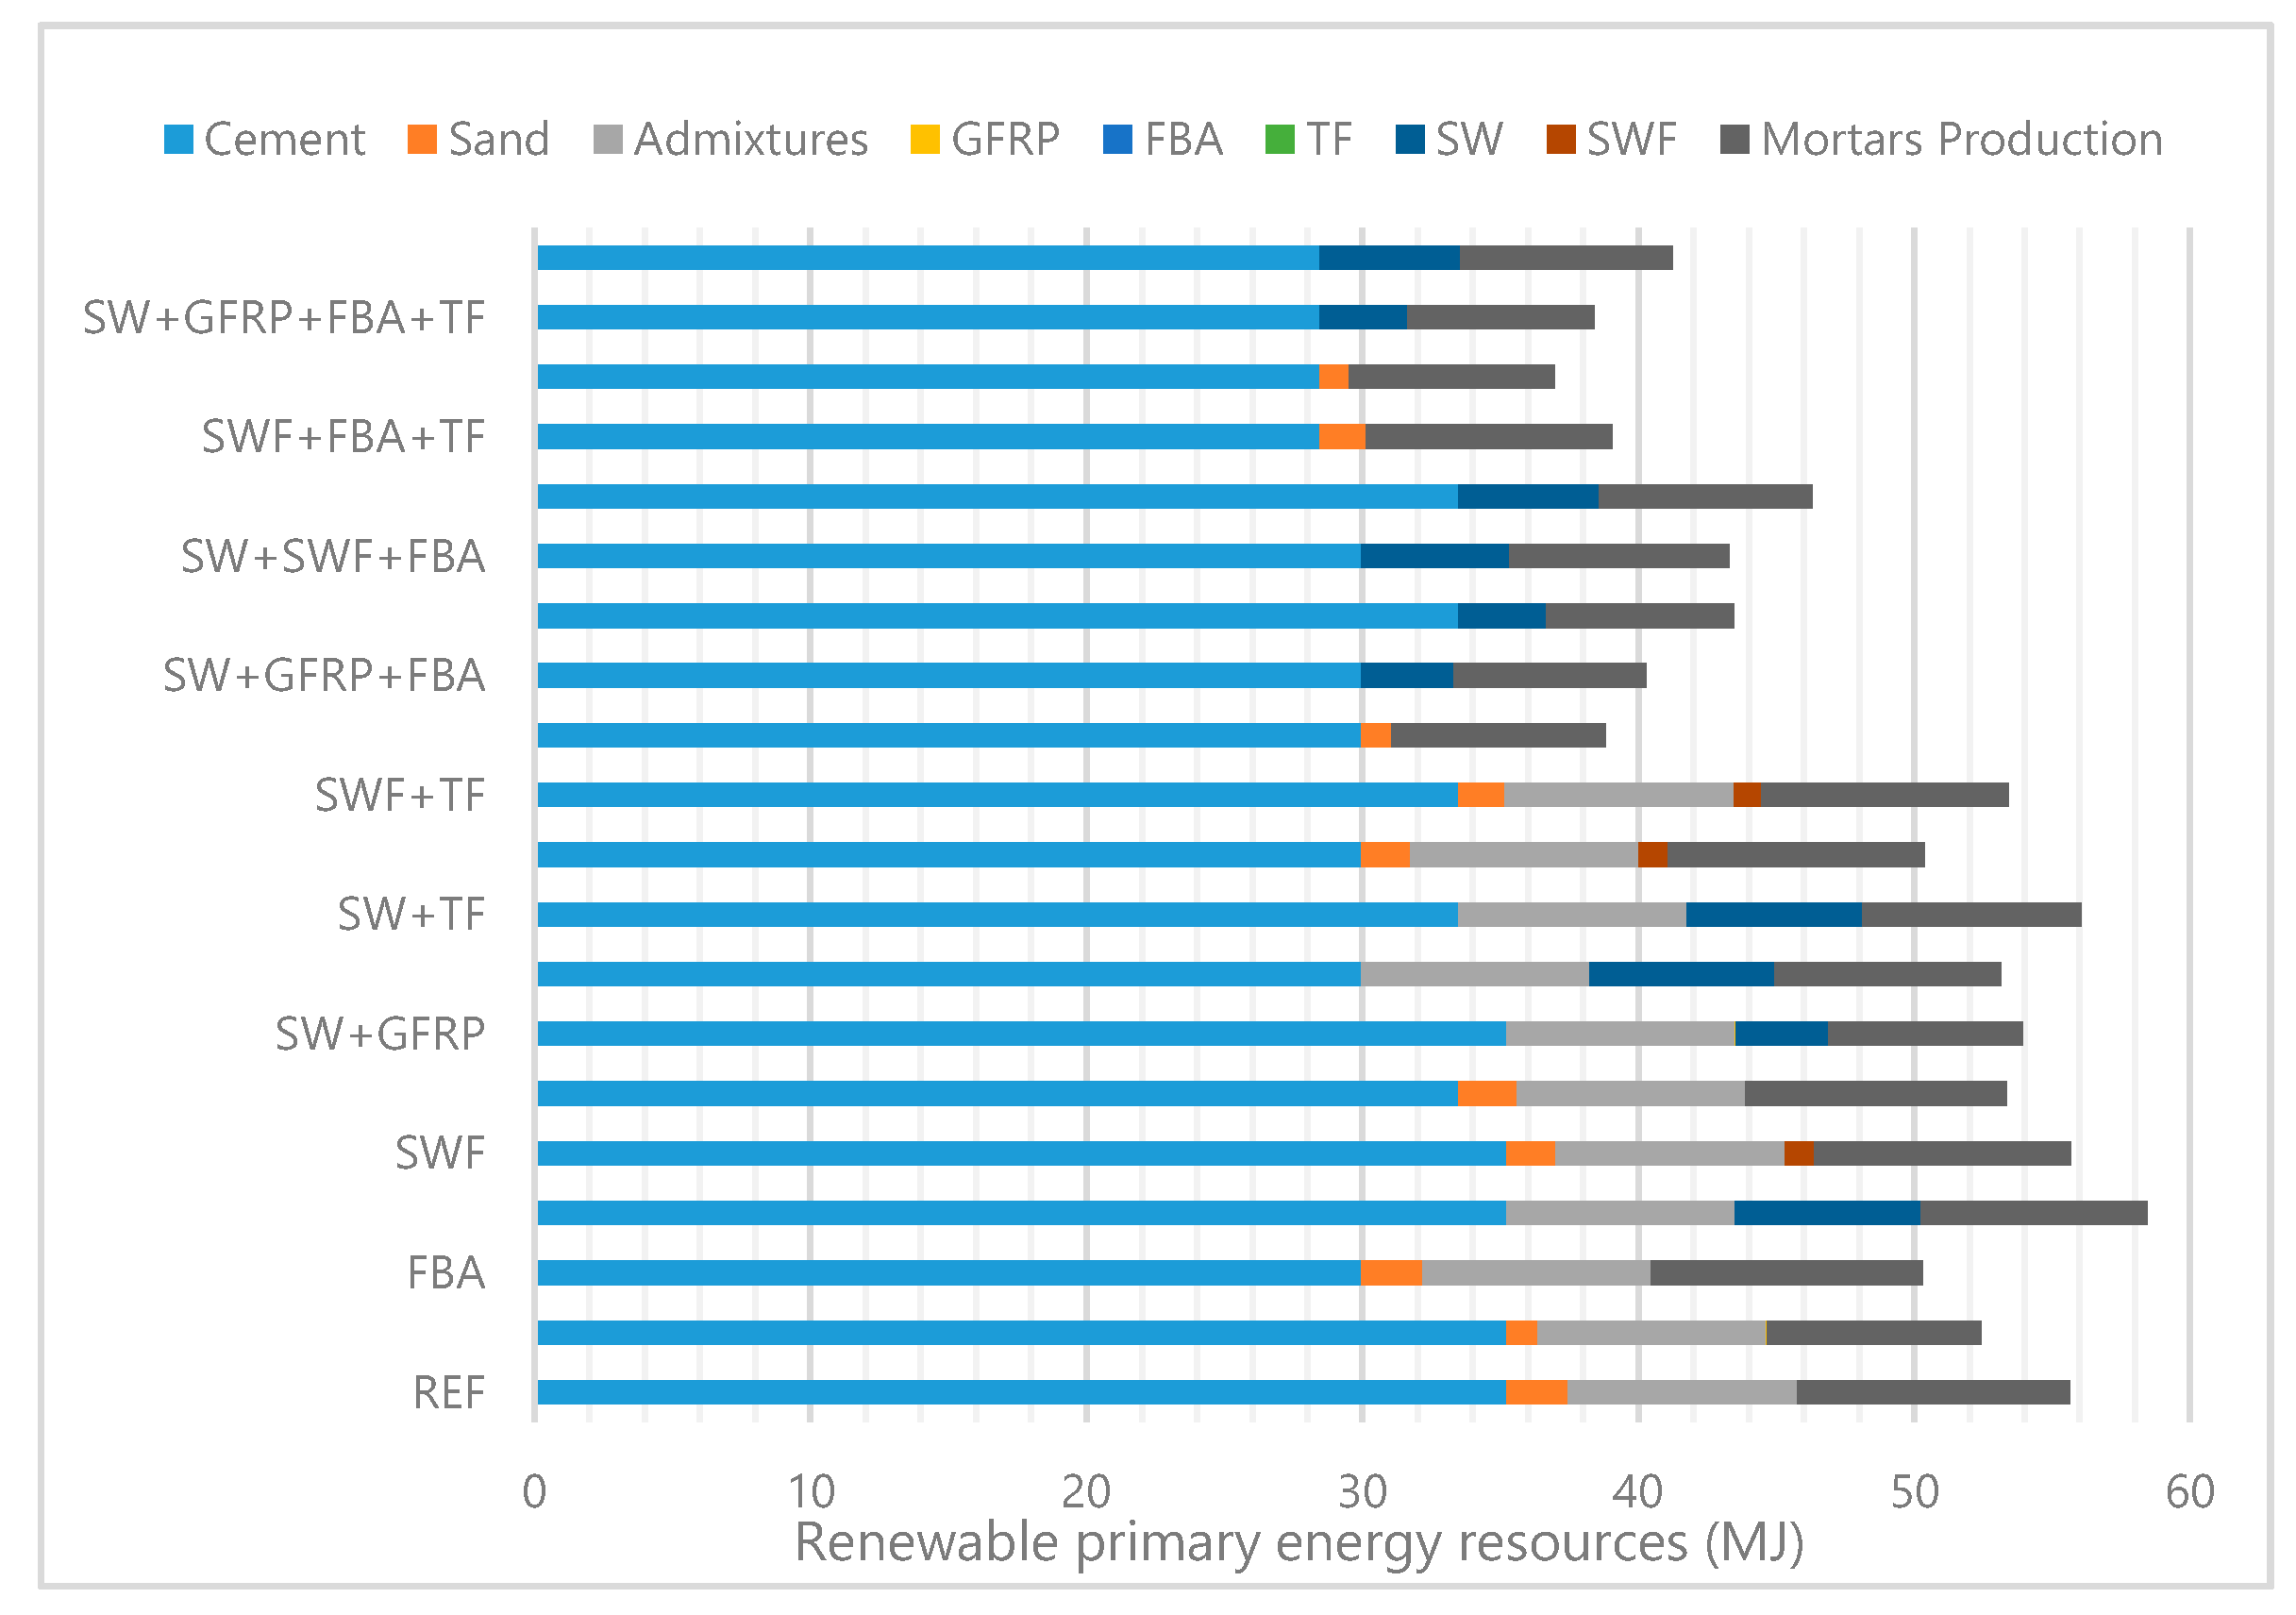
Cement and admixtures were the components that most influenced the PE-Re impact, being responsible for almost 80% of the total renewable energy spent. The mortars’ production (A3) also had an important influence on this impact category, mainly due to the packaging materials (A3.1.). Sanitary ware was the waste with more renewable energy consumption.
Figure 10 presents the PE-Re impact for all mortars under analysis. The mortars SW and SW + TF spent 5% and 1% more energy than REF’s, respectively. The reduction of energy for the remaining mortars varied between 1% and 25%. The mortars with less PE-Re impact were GFRP + FBA, SW + GFRP + FBA, GFRP + FBA + TF and SW + GFRP + FBA + TF, with more than 20% less impact.
7. Conclusions
The sustainability of a construction, of a material or process, still represents a paradigm. Life cycle assessment is the methodology to quantify the environmental dimension of this “sustainability”.
In this chapter, 19 mortars with incorporation of wastes were analyzed in parallel with a standard mortar designated as reference mortar (REF). In order to determine the environmental improvements of these mortars, eight environmental impact categories, using two different methods, were analyzed. The normalized results of the analysis are summed up in Table 7. The results are presented in comparison with the reference mortar (ratio between the mortars’ impact and REF’s).
The wastes replace sand, cement, or both, and most of the wastes do not need a preparation process before its application (with the exception of the sanitary ware waste). Thus, the environmental impacts of the mortars with wastes were mainly due to the transportation process (A2) and mortars production (A3). Therefore, in general, the modified mortars presented a better environmental behavior than that of the reference mortar.
A long distance from the wastes’ origin to the mortars production site proved to be an important factor on environmental impacts. For the forest ashes waste, the importance of transportation was clear. This waste replaces CEM II by 15% and does not need a preparation process before its application; however, the long transportation distance was in this case responsible for an increase of 2% of the ADP (fossil fuels component). The initial distance of the forest ashes was defined to be 294 km. If the distance was reduced to 110 km, the ADP—Fossil fuels category impact would be exactly the same as REF’s.
Besides a long distance to the factory, sanitary ware (166 km away) is the only waste that needs a processing procedure before its application. The waste has to be crushed and sieved beforehand. The possible benefits of the incorporation of this waste in some impact categories were offset, due to the impacts of the sanitary ware’s preparation process. In ADP (materials component), GWP, and EP, the impact of the SW and REF mortars was the same. A slight increase in PE-Re was also noticed (5%) when waste replaced sand. In the filler introduction (SWF mortar), only for 20% of sanitary ware incorporation, a negative impact was not noticed. A similar environmental impact, in some impact categories, was noticed for this mortar in comparison with REF, namely in ADP (materials component), GWP and PE-Re impact categories. In fact, sanitary ware did not show improvements in all the impact categories due to its preparation process. However, the combination of this waste with others was responsible for a great reduction of some environmental impacts. The sanitary ware waste improves the technical performance of the mortars and allows, for example, the reduction of cement maintaining a similar performance when compared to REF’s. Therefore, the environmental benefits in these mixes (probably provided by other wastes, such as FBA waste) are only possible by the incorporation of sanitary ware waste.
16 out of the 19 mortars under analysis presented, in all environmental impact categories, an environment performance equal to or better than the REF’s (GFRP, SWF, TF, SW + GFRP, SWF + TF, SW + FBA, SWF + FBA, SWF + TF, GFRP + FBA, SW + GFRP + FBA, SW + GFRP + TF, SWF + FBA + TF, GFRP + FBA + TF, SW + GFRP + FBA + TF and SW + SWF + FBA + TF). The remaining mortars only presented an increase in one environmental impact category. The FBA mortar showed, due to the high transport distance, an ADP (fossil fuels component) impact higher by 2% than REF’s. This increment is not considered relevant. A different or a more efficient transport could lead to a lower impact. It was also considered that, in its return trip, the lorry was empty in 30% of the distance. If it were considered that it was full in the entire trip, the impacts would be reduced to an increment of only 1%, when compared with REF’s. In fact, the distance assumptions have a great influence on the environmental impacts. The choice of local waste materials can reduce even more the environmental impacts of these new materials, by reducing the transportation impacts.
The SW mortar, as mentioned, increased the PE-Re category by 5%, while the SW + TF mortar increased the same environmental category in 1%. These increments are related to the preparation process of the waste. It is necessary to find more efficient processes in order to improve the PE-Re category that is influenced by the incorporation of this waste.
The LCA of the mortars with and without wastes was determinant in order to quantify the possible environmental sustainability of the renders under analysis. The main objective was always to compare the environmental impacts of the modified mortars with those of the reference mortar. There were some assumptions in the LCA that were enumerated in Section 4.5. However, the assumptions taken are justifiable and, in general, were the same for all the mortars analyzed. The reduction of the environmental impacts of the mortars with wastes is clear for most of the mortars analyzed. In this research, it was found that the incorporation of recycled wastes presents environmental benefits in replacing sand, cement, or both. This improvement of the render’s environmental impacts can be even more significant if the environmental impact of landfill deposition in the long-term were considered, even though if it means the use of a consequential LCA approach instead of the attributional LCA used in this research work. Thus, based on these LCA results and allied to a better technical behavior, it is possible to conclude that the mortars with incorporation of wastes also contribute to a reduction of the environmental impacts.
Author Contributions
C.B.F. and J.D.S. developed the methodology used in the life cycle assessment of the mortars. C.B.F. defined the goal and scope of the research, analyzed the inventory data and assessment the impact of the mortars analyzed. The validation and interpretation of the impact assessment was performed for C.B.F. and J.D.S., J.d.B. and M.d.R.V. were responsible for the supervision of the research. The writing—Original draft preparation was performed by C.B.F. and writing—Review and editing by J.d.B., M.d.R.V., and J.D.S.
Funding
This research was founded by Portuguese Foundation for Science and Technology (PD/BD/113639/2015).
Acknowledgments
The authors would like to acknowledge the REuSE project from National Laboratory for Civil Engineering of Portugal (LNEC) and the research unit CERIS from Instituto Superior Técnico (IST).
Conflicts of Interest
The authors declare no conflict of interest.
References
- Blengini, G.A.; Garbarino, E. Resources and waste management in Turin (Italy): The role of recycled aggregates in the sustainable supply mix. J. Clean. Prod. 2010, 18, 1021–1030. [Google Scholar] [CrossRef]
- Braga, M.; Silvestre, D.; de Brito, J. Compared environmental and economic impact from cradle to gate of concrete with natural and recycled coarse aggregates. J. Clean. Prod. 2017, 162, 529–543. [Google Scholar] [CrossRef]
- Jiménez, C.; Barra, M.; Josa, A.; Valls, S. LCA of recycled and conventional concretes designed using the Equivalent Mortar Volume and classic methods. Constr. Build. Mater. 2015, 84, 245–252. [Google Scholar] [CrossRef] [Green Version]
- Braga, M. Compared Environmental Impact of the Life Cycle of Concrete with Natural and Recycled Coarse Aggregates. Master’s Thesis, Instituto Superior Técnico, Universidade de Lisboa, Lisbon, Portugal, 2015. (In Portuguese). [Google Scholar]
- Kurda, R. Sustainable Development of Cement-Based Materials: Application to Recycled Aggregates Concrete. Ph.D. Thesis, Instituto Superior Técnico, Universidade de Lisboa, Lisbon, Portugal, 2017. [Google Scholar]
- Kurad, R.; Silvestre, J.D.; de Brito, J.; Ahmed, H. Effect of incorporation of high volume of recycled concrete aggregates and fl y ash on the strength and global warming potential of concrete. J. Clean. Prod. 2017, 166, 485–502. [Google Scholar] [CrossRef]
- Lucas, J.; de Brito, J.; Veiga, R.; Farinha, C.B. The effect of using sanitary ware as aggregates on rendering mortars ’ performance. Mater. Des. 2016, 91, 155–164. [Google Scholar] [CrossRef]
- Farinha, C.B.; de Brito, J.; Veiga, R. Incorporation of fine sanitary ware aggregates in coating mortars. Constr. Build. Mater. 2015, 83, 194–206. [Google Scholar] [CrossRef]
- Farinha, C.B.; de Brito, J.; Veiga, R. Assessment of glass fibre reinforced polymer waste reuse as filler in mortars. J. Clean. Prod. 2019, 210, 1579–1594. [Google Scholar] [CrossRef]
- EN 998-1. Specification for Mortar for Masonry. Part 1: Rendering and Plastering Mortar; CEN: Brussels, Belgium, 2010. [Google Scholar]
- Ortiz, O.; Castells, F.; Sonnemann, G. Sustainability in the construction industry: A review of recent developments based on LCA. Constr. Build. Mater. 2009, 23, 28–39. [Google Scholar] [CrossRef]
- U.S. Environmental Protection Agency (EPA). Life Cycle Assessment: Principles and Practice; EPA: Washington, DC, USA, 2006.
- ISO 14040. International Standard. Environmental Management—Life Cycle Assessment—Principles and Framework; ISO: Geneva, Switzerland, 2006. [Google Scholar]
- ISO 14044. Environmental Management—Life Cycle Assessment—Principles and Framework; ISO: Geneva, Switzerland, 2006. [Google Scholar]
- EN 15804. European Standard. Sustainability of Construction Works—Environmental Product Declarations—Core Rules for the Product Category of Construction Products; European Committee for Standardization (CEN): Brussels, Belgium, 2012. [Google Scholar]
- European Cement Research Academy (ECRA). Environmental Product Declaration Report. Portland-Composite Cement (CEM II) Produced in Europe; ECRA: Düsseldorf, Germany, 2015. [Google Scholar]
- European Federation of Concrete Admixtures Associations Ltd. (EFCA). Environmental Product Declaration Report. Concrete Admixtures—Water Resisting Admixtures; EFCA: Bloomington, MN, USA, 2015. [Google Scholar]
- European Federation of Concrete Admixtures Associations Ltd. (EFCA). Environmental Product Declaration Report. Concrete Admixtures—Air Entrainers; EFCA: Bloomington, MN, USA, 2015. [Google Scholar]
- European Federation of Concrete Admixtures Associations Ltd. (EFCA). Environmental Product Declaration Report. Concrete Admixtures—Plasticisers and Superplasticisers; EFCA: Bloomington, MN, USA, 2015. [Google Scholar]
- Silvestre, J.D. Life Cycle Assessment ‘from Cradle to Cradle’ of Building Assemblies—Application to External Walls. Ph.D. Thesis, Instituto Superior Técnico, Lisbon, Portugal, 2012. [Google Scholar]
- Silvestre, J.D.; de Brito, J.; Pinheiro, M.D. Environmental impacts and bene fi ts of the end-of-life of building materials e calculation rules, results and contribution to a ‘cradle to cradle’ life cycle. J. Clean. Prod. 2014, 66, 37–45. [Google Scholar] [CrossRef]
- Blengini, G.A. Life Cycle Assessment Tools for Sustainable Development: Case Studies for the Mining and Construction Industries in Italy and Portugal. Ph.D. Thesis, Instituto Superior Técnico, Universidade de Lisboa, Lisbon, Portugal, 2006. [Google Scholar]
- International Energy Agency (IEA). Global Energy and CO2 Status Report 2017; IEA: Paris, France, 2018.
- The European Cement Association (CEMBUREAU). Activity Report 2017; The European Cement Association (CEMBUREAU): Brussels, Belgium, 2018. [Google Scholar]
- Silvestre, J.D.; de Brito, J.; Pinheiro, M.D. From the new European Standards to an environmental, energy and economic assessment of building assemblies from cradle-to-cradle. Energy Build. 2013, 64, 199–208. [Google Scholar] [CrossRef]
Figure 1.
Life Cycle Assessment (LCA) and system boundary.

Figure 2.
ADP—Materials (in kg Sb-eq.).

Figure 3.
ADP—fossil fuels (in MJ).

Figure 4.
Global warming potential impact (in kgCO2-eq.).

Figure 5.
Ozone depletion potential impact (in kg CFC11-eq.).

Figure 6.
Photochemical ozone creation potential impact (in kg ethane-eq.).

Figure 7.
Acidification potential impact (in kg SO2-eq.).

Figure 8.
Eutrophication potential impact (in PO4-3-eq.).

Figure 9.
Non-renewable primary energy resources impact (in MJ).

Figure 10.
Renewable primary energy resources impact (in MJ).


Table 1.
Volume of sand and cement replaced by the industrial wastes. REF: reference mortar.
| Mortars | Volume of Sand Replaced (%) | Volume of Cement Replaced (%) | Total Volume of Recycled Materials (%) |
|---|---|---|---|
| REF | 0 | 0 | 0 |
| GFRP | 50 | 0 | 40 |
| FBA | 0 | 15 | 3 |
| SW | 100 | 0 | 80 |
| SWF | 20 | 0 | 16 |
| TF | 5 | 5 | 5 |
| SW + GFRP | 100 | 0 | 80 |
| SW + FBA | 100 | 15 | 83 |
| SW + TF | 100 | 5 | 81 |
| SWF + FBA | 20 | 15 | 19 |
| SWF + TF | 25 | 5 | 20 |
| GFRP + FBA | 50 | 15 | 43 |
| SW + GFRP + FBA | 100 | 15 | 83 |
| SW + GFRP + TF | 100 | 5 | 81 |
| SW + SWF + FBA | 100 | 15 | 83 |
| SW + SWF + TF | 100 | 5 | 81 |
| SWF + FBA + TF | 25 | 20 | 23 |
| GFRP + FBA + TF | 50 | 20 | 46 |
| SW + GFRP + FBA + TF | 100 | 20 | 84 |
| SW + SWF + FBA + TF | 100 | 20 | 84 |
GFRP—Glass fiber reinforced polymer; FBA—Forest biomass ashes; SW—Sanitary ware (aggregate); SWF—Sanitary ware (filler); TF—Textile fibers.
Table 2.
Environmental impact of cement, sand, and admixtures (for 1 kg).
| Environmental Impacts of the Mortars’ Constituents | Baseline CML Method | Cumulative Energy | ||||||||
|---|---|---|---|---|---|---|---|---|---|---|
| ADP | GWP | ODP | POCP | AP | EP | PE-NRe | PE-Re | |||
| kg Sb-eq. | MJ | kg CO2-eq. | kg CFC11-eq. | kg ethene-eq. | kg SO2-eq. | kg PO4−3-eq. | MJ | MJ | ||
| Cement | 1.10 × 10⁻⁶ | 2.84 × 10⁻³ | 7.38 × 10⁻¹ | 1.10 × 10⁻¹⁰ | 1.17 × 10⁻⁴ | 1.21 × 10⁻³ | 1.74 × 10⁻⁴ | 3.04 | 1.80 × 10⁻¹ | |
| Sand | 7.31 × 10⁻¹¹ | 2.88 × 10⁻² | 2.46 × 10⁻³ | 3.83 × 10⁻¹⁰ | 1.08 × 10⁻⁶ | 1.90 × 10⁻⁵ | 2.03 × 10⁻⁶ | 4.23 × 10⁻² | 1.70 × 10⁻³ | |
| Admixtures | Air entrainer | 3.66 × 10⁻⁷ | 13.3 | 5.27 × 10⁻¹ | 7.56 × 10⁻¹¹ | 3.45 × 10⁻⁴ | 1.30 × 10⁻³ | 1.43 × 10⁻⁴ | 14.2 | 8.24 × 10⁻¹ |
| Superplasticizer | 1.10 × 10⁻⁶ | 29.1 | 1.88 | 2.30 × 10⁻¹⁰ | 3.12 × 10⁻⁴ | 2.92 × 10⁻³ | 1.03 × 10⁻³ | 31.4 | 1.51 | |
| Water proofing | 7.20 × 10⁻⁵ | 57.0 | 2.67 | 4.26 × 10⁻¹⁰ | 9.62 × 10⁻⁴ | 8.29 × 10⁻³ | 9.55 × 10⁻⁴ | 60.8 | 7.23 | |
Table 3.
Environmental impact of 1 kg of sanitary ware in Portugal (adapted from Braga et al., [2]).
Table 3.
Environmental impact of 1 kg of sanitary ware in Portugal (adapted from Braga et al., [2]).
| Baseline CML Method | Cumulative Energy | |||||||
|---|---|---|---|---|---|---|---|---|
| ADP | GWP | ODP | POCP | AP | EP | PE-NRe | PE-Re | |
| kg Sb-eq. | MJ | kg CO2-eq. | kg CFC11-eq. | kg ethene-eq. | kg SO2-eq. | kg PO4−3-eq. | MJ | MJ |
| 5.36 × 10⁻¹⁰ | 8.88 × 10⁻³ | 9.50 × 10⁻⁴ | 3.29 ×10⁻¹¹ | 2.81 × 10⁻⁷ | 7.31 × 10⁻⁶ | 1.30 × 10⁻⁶ | 1.09 × 10⁻² | 7.08 × 10⁻³ |
Table 4.
Environmental impact of the transport (1 kg.km) in Europe (European Life Cycle Database (ELCD)).
Table 4.
Environmental impact of the transport (1 kg.km) in Europe (European Life Cycle Database (ELCD)).
| Baseline CML Method | Cumulative Energy | |||||||
|---|---|---|---|---|---|---|---|---|
| ADP | GWP | ODP | POCP | AP | EP | PE-NRe | PE-Re | |
| kg Sb-eq. | MJ | kg CO2-eq. | kg CFC11-eq. | kg ethene-eq. | kg SO2-eq. | kg PO4−3-eq. | MJ | MJ |
| 1.98 × 10⁻¹² | 6.99 × 10⁻⁴ | 4.99 × 10⁻⁵ | 1.01 × 10⁻¹³ | 1.59 × 10⁻⁸ | 2.2 × 10⁻⁷ | 5.11 × 10⁻⁸ | 7.03× 10⁻⁴ | 7.95× 10⁻⁷ |
Table 5.
Environmental impact of the production process of 1 m3 of powder mortar (adapted from Silvestre [20]).
Table 5.
Environmental impact of the production process of 1 m3 of powder mortar (adapted from Silvestre [20]).
| Baseline CML Method | Cumulative Energy | ||||||||
|---|---|---|---|---|---|---|---|---|---|
| ADP | GWP | ODP | POCP | AP | EP | PE-NRe | PE-Re | ||
| kg Sb-eq. | MJ | kg CO2-eq. | kg CFC11-eq. | kg ethene-eq. | kg SO2-eq. | kg PO4−3-eq. | MJ | MJ | |
| A3.1 | 8.59 × 10⁻⁵ | 437 | 27.8 | 1.75 × 10⁻⁶ | 1.11 × 10⁻² | 1.40 × 10⁻¹ | 4.70 × 10⁻² | 510 | 1.12 × 10³ |
| A3.2 | 1.05 × 10⁻⁹ | 2.51 × 10⁻² | 2.16 × 10⁻³ | 2.29 × 10⁻¹⁰ | 4.65 × 10⁻⁷ | 1.25 × 10⁻⁵ | 2.54 × 10⁻⁶ | 6.09 × 10⁻² | 6.53 × 10⁻³ |
| A3.3 | 5.50 × 10⁻¹⁰ | 8.31 × 10⁻⁴ | 7.57× 10⁻⁵ | 8.95 × 10⁻¹² | 2.07 × 10⁻⁸ | 2.68 × 10⁻⁷ | 2.05 × 10⁻⁷ | 1.23 × 10⁻³ | −6.37 × 10⁻⁵ |
Table 6.
Environmental impacts for the production of 1 m3 of modified mortars.
| ADP kg Sb-eq. | ADP MJ | GWP kg CO2-eq. | ODP kg CFC11-eq. | POCP kg ethene-eq. | AP kg SO2-eq. | EP kg PO4-3-eq. | PE-NRe MJ | PE-Re MJ | |
|---|---|---|---|---|---|---|---|---|---|
| REF | 2.82 × 10⁻⁴ | 319 | 166 | 8.45 × 10⁻⁷ | 2.99 × 10⁻² | 3.40 × 10⁻¹ | 5.40 × 10⁻² | 55.6 | 988 |
| GFRP | 2.81 × 10⁻⁴ | 232 | 160 | 5.17 × 10⁻⁷ | 2.77 × 10⁻² | 3.05 × 10⁻¹ | 4.73 × 10⁻² | 52.4 | 878 |
| FBA | 2.49 × 10⁻⁴ | 325 | 145 | 8.41 × 10⁻⁷ | 2.67 × 10⁻² | 3.06 × 10⁻¹ | 4.93 × 10⁻² | 50.3 | 904 |
| SW | 2.82 × 10⁻⁴ | 313 | 166 | 3.47 × 10⁻⁷ | 2.94 × 10⁻² | 3.29 × 10⁻¹ | 5.40 × 10⁻² | 58.5 | 957 |
| SWF | 2.82 × 10⁻⁴ | 309 | 166 | 7.34 × 10⁻⁷ | 2.96 × 10⁻² | 3.35 × 10⁻¹ | 5.33 × 10⁻² | 55.7 | 971 |
| TF | 2.71 × 10⁻⁴ | 308 | 158 | 8.04 × 10⁻⁷ | 2.85 × 10⁻² | 3.24 × 10⁻¹ | 5.14 × 10⁻² | 53.4 | 943 |
| SW + GFRP | 2.81 × 10⁻⁴ | 229 | 159 | 2.68 × 10⁻⁷ | 2.75 × 10⁻² | 2.99 × 10⁻¹ | 4.73 × 10⁻² | 53.9 | 863 |
| SW + FBA | 2.49 × 10⁻⁴ | 319 | 144 | 3.43 × 10⁻⁷ | 2.61 × 10⁻² | 2.95 × 10⁻¹ | 4.93 × 10⁻² | 53.1 | 873 |
| SW + TF | 2.71 × 10⁻⁴ | 302 | 158 | 3.30 × 10⁻⁷ | 2.80 × 10⁻² | 3.13 × 10⁻¹ | 5.14 × 10⁻² | 56.1 | 913 |
| SWF + FBA | 2.49 × 10⁻⁴ | 315 | 144 | 7.30 × 10⁻⁷ | 2.63 × 10⁻² | 3.01 × 10⁻¹ | 4.86 × 10⁻² | 50.4 | 887 |
| SWF + TF | 2.71 × 10⁻⁴ | 298 | 158 | 6.98 × 10⁻⁷ | 2.82 × 10⁻² | 3.19 × 10⁻¹ | 5.07 × 10⁻² | 53.4 | 927 |
| GFRP + FBA | 2.49 × 10⁻⁴ | 238 | 139 | 5.13 × 10⁻⁷ | 2.44 × 10⁻² | 2.71 × 10⁻¹ | 4.27 × 10⁻² | 47.1 | 795 |
| SW + GFRP + FBA | 2.49 × 10⁻⁴ | 235 | 138 | 2.64 × 10⁻⁷ | 2.42 × 10⁻² | 2.65 × 10⁻¹ | 4.27 × 10⁻² | 48.6 | 779 |
| SW + GFRP + TF | 2.70 × 10⁻⁴ | 222 | 152 | 2.56 × 10⁻⁷ | 2.62 × 10⁻² | 2.85 × 10⁻¹ | 4.51 × 10⁻² | 51.8 | 824 |
| SW + SWF + FBA | 2.49 × 10⁻⁴ | 310 | 144 | 3.31 × 10⁻⁷ | 2.59 × 10⁻² | 2.92 × 10⁻¹ | 4.86 × 10⁻² | 52.6 | 862 |
| SW + SWF + TF | 2.71 × 10⁻⁴ | 293 | 157 | 3.19 × 10⁻⁷ | 2.78 × 10⁻² | 3.10 × 10⁻¹ | 5.07 × 10⁻² | 55.6 | 903 |
| SWF + FBA + TF | 2.40 × 10⁻⁴ | 304 | 137 | 6.94 × 10⁻⁷ | 2.51 × 10⁻² | 2.87 × 10⁻¹ | 4.63 × 10⁻² | 48.3 | 848 |
| GFRP + FBA + TF | 2.39 × 10⁻⁴ | 230 | 132 | 4.88 × 10⁻⁷ | 2.33 × 10⁻² | 2.58 × 10⁻¹ | 4.06 × 10⁻² | 45.3 | 760 |
| SW + GFRP + FBA + TF | 2.39 × 10⁻⁴ | 227 | 131 | 2.51 × 10⁻⁷ | 2.30 × 10⁻² | 2.53 × 10⁻¹ | 4.06 × 10⁻² | 46.7 | 745 |
| SW + SWF + FBA + TF | 2.40 × 10⁻⁴ | 299 | 137 | 3.15 × 10⁻⁷ | 2.47 × 10⁻² | 2.78 × 10⁻¹ | 4.63 × 10⁻² | 50.5 | 824 |
Table 7.
Normalized environmental impacts for all categories under analysis.
| ADP (Materials) | ADP (Fossil Fuels) | GWP | ODP | POCP | AP | EP | PE-NRe | PE-Re | |
|---|---|---|---|---|---|---|---|---|---|
| REF | 1.00 | 1.00 | 1.00 | 1.00 | 1.00 | 1.00 | 1.00 | 1.00 | 1.00 |
| GFRP | 1.00 | 0.73 | 0.96 | 0.61 | 0.93 | 0.90 | 0.88 | 0.89 | 0.94 |
| FBA | 0.89 | 1.02 | 0.87 | 0.99 | 0.89 | 0.90 | 0.91 | 0.92 | 0.90 |
| SW | 1.00 | 0.98 | 1.00 | 0.41 | 0.98 | 0.97 | 1.00 | 0.97 | 1.05 |
| SWF | 1.00 | 0.97 | 1.00 | 0.87 | 0.99 | 0.98 | 0.99 | 0.98 | 1.00 |
| TF | 0.96 | 0.96 | 0.95 | 0.95 | 0.95 | 0.95 | 0.95 | 0.95 | 0.96 |
| SW + GFRP | 1.00 | 0.72 | 0.96 | 0.32 | 0.92 | 0.88 | 0.88 | 0.87 | 0.97 |
| SW + FBA | 0.89 | 1.00 | 0.87 | 0.41 | 0.87 | 0.87 | 0.91 | 0.88 | 0.95 |
| SW + TF | 0.96 | 0.94 | 0.95 | 0.39 | 0.93 | 0.92 | 0.95 | 0.92 | 1.01 |
| SWF + FBA | 0.89 | 0.99 | 0.87 | 0.86 | 0.88 | 0.89 | 0.90 | 0.90 | 0.91 |
| SWF + TF | 0.96 | 0.93 | 0.95 | 0.83 | 0.94 | 0.94 | 0.94 | 0.94 | 0.96 |
| GFRP + FBA | 0.88 | 0.74 | 0.83 | 0.61 | 0.82 | 0.80 | 0.79 | 0.80 | 0.85 |
| SW + GFRP + FBA | 0.88 | 0.73 | 0.83 | 0.31 | 0.81 | 0.78 | 0.79 | 0.79 | 0.87 |
| SW + GFRP + TF | 0.96 | 0.69 | 0.91 | 0.30 | 0.87 | 0.84 | 0.83 | 0.83 | 0.93 |
| SW + SWF + FBA | 0.89 | 0.97 | 0.86 | 0.39 | 0.86 | 0.86 | 0.90 | 0.87 | 0.95 |
| SW + SWF + TF | 0.96 | 0.92 | 0.94 | 0.38 | 0.93 | 0.91 | 0.94 | 0.91 | 1.00 |
| SWF + FBA + TF | 0.85 | 0.95 | 0.83 | 0.82 | 0.84 | 0.84 | 0.86 | 0.86 | 0.87 |
| GFRP + FBA + TF | 0.85 | 0.72 | 0.79 | 0.58 | 0.78 | 0.76 | 0.75 | 0.77 | 0.81 |
| SW + GFRP + FBA + TF | 0.85 | 0.71 | 0.79 | 0.30 | 0.77 | 0.74 | 0.75 | 0.75 | 0.84 |
| SW + SWF + FBA + TF | 0.85 | 0.94 | 0.82 | 0.37 | 0.82 | 0.82 | 0.86 | 0.83 | 0.91 |
| LEGEND: | |||||||||
| Environmental Impact higher than REF | Up to 10% | ||||||||
| Between 10% and 15% | |||||||||
| Environmental impact lower than REF | Up to 10% | ||||||||
| Between 10% and 20% | |||||||||
| Higher than 20% |
© 2019 by the authors. Licensee MDPI, Basel, Switzerland. This article is an open access article distributed under the terms and conditions of the Creative Commons Attribution (CC BY) license (http://creativecommons.org/licenses/by/4.0/).
Share and Cite
MDPI and ACS Style
Farinha, C.B.; Silvestre, J.D.; de Brito, J.; Veiga, M.d.R. Life Cycle Assessment of Mortars with Incorporation of Industrial Wastes. Fibers 2019, 7, 59. https://0-doi-org.brum.beds.ac.uk/10.3390/fib7070059
AMA Style
Farinha CB, Silvestre JD, de Brito J, Veiga MdR. Life Cycle Assessment of Mortars with Incorporation of Industrial Wastes. Fibers. 2019; 7(7):59. https://0-doi-org.brum.beds.ac.uk/10.3390/fib7070059
Chicago/Turabian StyleFarinha, Catarina Brazão, José Dinis Silvestre, Jorge de Brito, and Maria do Rosário Veiga. 2019. "Life Cycle Assessment of Mortars with Incorporation of Industrial Wastes" Fibers 7, no. 7: 59. https://0-doi-org.brum.beds.ac.uk/10.3390/fib7070059
Note that from the first issue of 2016, this journal uses article numbers instead of page numbers. See further details here.