Kinetics of Cellulose Deposition in Developing Cotton Fibers Studied by Thermogravimetric Analysis


Department of Plant and Soil Science, Fiber and Biopolymer Research Institute, Texas Tech University, P.O. Box 45019, Lubbock, TX 79403, USA
*
Author to whom correspondence should be addressed.
†
Current address: Department of Physics and Engineering, California State University at Bakersfield, 9001 Stockdale Highway, Bakersfield, CA 93311, USA.
Fibers 2019, 7(9), 78; https://0-doi-org.brum.beds.ac.uk/10.3390/fib7090078
Submission received: 1 July 2019
/
Revised: 8 August 2019
/
Accepted: 24 August 2019
/
Published: 29 August 2019
Abstract
:During cotton fibers development, important structural changes occur, which lead to cellulose deposition and organization in the secondary cell wall. Several studies have focused on the analysis of the cell wall extracts of cotton fibers to gain an understanding of the changes in carbohydrate profiles and to determine the changes in crystallinity, cellulosic and non-cellulosic compounds at various stages of the fiber cell wall development. In this research, thermogravimetric analysis (TGA) was used to study intact fibers harvested from two cotton genotypes. Cellulose macromolecules structural changes occurring during different developmental stages were studied. The results from TGA technique were in agreement with results from other analytical techniques, which indicates that TGA could be a great tool to investigate the onset of cellulose deposition and to evaluate the cell wall composition during fiber development. The results obtained in this study demonstrated that the initiation of the secondary cell wall is genotype-dependent.
1. Introduction
Humans have valued the potential of natural fibers to produce garments more than two and a half millennia. In addition to its economic importance, developing cotton fibers are an excellent model for studying fundamental processes of plant cell walls development [1]. Cellulose is the main component of mature cotton fibers (from 88 up to 96.5%). The remaining portion is composed of non-cellulosic materials located on the outer layers and in the lumen. These materials include proteins (1–1.9%), pectins (0.4–1.2%), waxes (0.4–1.2%), and other substances [2]. Although cotton fiber development has been studied extensively, it is still poorly understood [3]. It has been established that cotton fiber development consists of five main developmental stages [4]: differentiation, initiation, elongation, secondary cell wall (SCW) deposition, and maturation. In other reports, cotton fiber development was divided into only four stages [1,5] (1) initiation or differentiation, (2) elongation, (3) SCW formation, and (4) maturation. Fiber initiation commences at the flowering or anthesis stage (0 days post-anthesis = 0 dpa). The elongation phase consists of the primary cell wall synthesis, which is marked by an increase in the fiber length. This stage lasts up 21 dpa. The secondary cell wall stage starts around 21 dpa and continues up to 40 dpa. The third stage is characterized by the deposition of a thick cellulosic wall. The period between 16 and 21 dpa marks a developmental change from primary to secondary cell wall synthesis [4]. Cotton fibers present a microfibrillar structure, which is composed of elementary fibrils. These fibrils, with a width measuring around 3.5 nm, are composed of crystalline and amorphous cellulose. The crystalline regions alternate with amorphous regions [6,7]. As the fiber develops, the crystallinity, crystallite size, and orientation in cellulose change. Using electron diffraction, Paralikar found the crystalline cellulose in developing cotton fibers as early as 5 dpa, corresponding to cellulose I [8]. Hu and Hsieh found cellulose I crystalline structure at 21 dpa in samples of Acala cotton using X-ray diffraction (XRD). Their data demonstrated that as the cell wall developed, the crystallinity and the crystallite size increased, with the most significant increase occurring between 21 and 34 dpa [9]. Hsieh et al. reported an increase in the crystallite size and percent crystallinity in cotton fiber samples between 14 and 50 dpa [10]. The crystallinity of cellulose has an effect on water absorption, and thus, it affects weight loss during water evaporation. Several authors reported that as the crystallinity index decreases in cellulose, the amount of water absorbed increases due to the presence of a higher amount of amorphous cellulose. Mihranyan et al. reported that the moisture sorption decreases with increasing crystallinity up to a 75% RH. Above this level of humidity, the moisture content increased due to capillary condensation in the pores [11]. The effect of ball milling on cellulose samples was also investigated, and it was reported that as the amorphous content of the samples increased, the initial moisture content also increased [12,13].
Huwyler et al. [14] reported on the compositional changes during development of cotton fibers. The results showed a decrease in the quantity of non-cellulosic glucose and arabinose residues during SCW formation. Timpa et al. [15] analyzed cotton cell walls during fiber development using gel-permeation chromatography. The authors showed that the amount of polymer chains with high molecular weight decreased during the period between 10 and 18 dpa while the components with low molecular weight increased. Other studies were focused on investigating the composition of cotton fibers during development using other analyses, which are time-consuming [16].
The initiation of the SCW stage is interpreted as the beginning of the increase in the fiber weight per unit length. A cellulose-rich wall is deposited during this period. The highest rate of cellulose synthesis was estimated to commence around 24 dpa after the cessation of the elongation phase. The increase in the thickness of the cell wall during the SCW deposition increases the amount of hydroxyl functional groups available to absorb water and bind dyes. Furthermore, there is also an increase in crystallinity, which implies a reduction in dye uptake per unit area [5].
Since SCW in cotton is one of the purest forms of cellulose in nature, its development can be studied by techniques commonly used to study other polymers, such as Fourier transform infrared (FTIR) spectroscopy [17,18]. In a previous study, we used several techniques to investigate cellulose deposition in developing cotton fibers. The results indicating the onset of SCW deposition obtained from other techniques were confirmed by FTIR results [4,19]. Furthermore, the amount of mono and disaccharides in developing cotton fibers were studied with high performance liquid chromatography (HPLC) to understand how sugars are used during each stage of fiber development [20]. In addition, we studied weight loss percentages and peak temperatures at different regions calculated from thermogravimetric analysis (TGA). The measurements obtained from TGA for fibers from two genotypes were related to their onset of SCW deposition [4].
Thermal analysis of cellulose provides information on its molecular structure. There are important thermal transitions of a polymer, such as melting point, glass transition, and degradation temperature. In this study, the focus is on the thermal degradation behavior of developing cotton fibers. Understanding the thermal degradation of cellulose is of great importance in diverse areas such as flame retardancy and biomass gasification [21]. TGA is useful for thermal characterization of organic materials, including cellulose [22]. Thermogravimetry is the study of the relationship between the mass of a sample and its temperature, and it can be used to study physical and chemical processes, e.g., degradation. TGA can be used for quantitative compositional analysis of polymers, lifetime prediction, and kinetic analysis [23]. Abidi et al. [24] reported relationships between cotton fiber micronaire, maturity, and fineness, and their thermal degradation properties. The results demonstrated the effect of cotton fiber properties on the percent weight loss and decomposition temperatures of cellulose in the temperature region between 225 and 425 °C. In this region, a good correlation between the weight loss and the primary cell wall per unit mass was established [24]. In addition, TGA has been used in the past to correlate the thermal degradation behavior of cellulosic samples with their crystallinity. Schultz et al. presented a linear correlation between the crystallinity indexes and the thermal degradation rate [25]. Lengowski et al. developed a mathematical model to predict the cellulose Segal’s index from TGA and DTA data [26].
Previously, we investigated developing cotton fibers using TGA. The results showed that fibers from two different genotypes exhibited different structural evolutions. The transition between the primary cell wall (PCW) and SCW occurs earlier for fibers from TX19 genotype compared to fibers from TX55 genotype. This conclusion was in agreement with the FTIR spectroscopy results [4,27]. We studied the thermal degradation of microcrystalline cellulose and cellulose in developing cotton fibers. The model-free method developed by Vyazovkin was used to analyze the data [22]. This method serves as an alternative to the model fitting approaches. The main advantage of this method is that it allows the calculation of the activation energy at different degrees of conversion without assuming any reaction model [21,28,29]. The results showed that cotton fibers harvested at 56 dpa have higher activation energy compared to fibers harvested at 24 dpa. This was attributed to the difference in molecular weight and crystallinity of cellulose [22].
In this research, we report on the use of TGA to investigate the structural changes that occur during cotton fiber development. Valuable information was obtained from the percent weight losses related to the composition of the cell walls.
2. Materials and Methods
During the 2007–2008 growing season, two cotton genotypes (wild type cotton Texas Marker-1 (TM-1), and TX55 genotype) were planted in the greenhouse. The total number of plants was 20 from each genotype. The plants were divided into two and each section of 10 plants was used as a replication. Cotton genotypes were planted in a greenhouse on 12 March 2008 with cycles changing from 12/12 to 14/10 h and day/night temperatures of about 31 °C/24 °C. Plants were located in 20 L (5 gallons) pots of Sungrow SB 300 potting mix that was amended with slow release fertilizer Peters 15-9-12. Plants were watered as needed. The set of samples collected focused on the development of the PCW with samples harvested at 10, 14 dpa, and then at each dpa between 17 and 24 dpa. The period between 17 and 24 dpa consists of two development phases: the transition period between PCW and SCW formation, and the SCW formation phase itself. The collection of samples was extended up to 56 dpa. By extending the study beyond 24 dpa, the maturation process of the developing cotton fibers was studied as well. Thus, fibers were harvested at 10, 14, 17, 18, 19, 20, 21, 22, 23, 24, 27, 30, 36, 46, and 56 dpa. Figure S1 shows the list of samples. On the day of flowering (0 dpa), individual flowers were marked, and at least three ee bolls at each dpa per genotype and per replication were harvested. Additional bolls were collected from 10, 14, 17, 18, and 19 dpa, due to the fact that a smaller amount of fibers was collected from each seed. The bolls were collected from May 2008 to August 2008. The pericarp was removed (with a scalpel), and the ovules were placed in vials and kept in a Cryobiological Storage System at 196 °C. Each replication was independently tested.
Cotton fibers were separated from the seeds after thawing. Afterward, fibers were rinsed in DI water several times. This procedure was performed in order to remove sugars and other soluble substances that could interfere with analytical testing. Cotton fibers obtained from several cotton bolls taken within replications were mixed manually. In the end, each genotype had two samples of cotton fibers for each dpa. A higher number of bolls was blended from younger dpa, due to the fact that a small number of fibers could be obtained from each seed. Then, fibers were dried at 40 °C for two days and placed for at least two days prior to testing in a laboratory maintained at 21 ± 1 °C and 65 ± 2% RH.
The anthrone method was used to determine the cellulose content of the cotton fibers [30]. A tricyclic hydrocarbon, anthrone (C14H10O), is used for cellulose and carbohydrates content determination [31,32]. The method starts with the addition of anthrone solution (0.05 to 0.20%) in concentrated sulfuric acid to an aqueous solution of cotton fibers, which has been digested with sulfuric acid. A UV-Vis spectrophotometer (LAMDA 650, PerkinElmer, Waltham, MA, USA) is used to read the absorbance of the solution at 625 nm. In this study, the anthrone method was slightly modified. Dried cotton fibers at different developmental stages were ground on a Wiley mill and passed through a 20 mesh. Samples were dried for 1 day at 105 °C, weighted (between 0.01 and 0.05 g) and placed in 15 mL centrifugal tubes. To each tube, 10 mL of 67% H2SO4 were added. The tube was covered with parafilm and mixed in a Vortex mixer every 15 min during 1 h. Then, 1 mL of this solution was taken to 100 mL volume with distilled water. Afterward, to 1 mL of the diluted solution was added 4 mL of distilled water. This procedure was repeated in order to have two UV-VIS readings of each sample. The tubes were placed in an ice bath to cool for 5 min. Then, 10 mL of cold anthrone reagent were added. This reagent was prepared as a 0.2% solution of anthrone ACS reagent 97% (Sigma, St. Louis, MO, USA) in concentrated H2SO4. After adding the anthrone, samples were mixed well on a Vortex mixer. The tubes were placed in boiling water for 16 min and mixed in the Vortex instrument. Samples were cooled in an ice bath until all samples were treated with boiling water. Immediately after, the tubes were allowed to stand at room temperature for 20 min. Then, the solutions were read on the spectrophotometer. Some instability of the anthrone reactant has been reported, thus, a new set of standards were prepared for each set of samples. In addition, the anthrone solution was used before 9 days passed since its preparation [31,32]. A calibration curve was performed by dissolving 50 mg of Avicel PH-101 (FMC biopolymers) microcrystalline cellulose, dried for 2 h at 105 °C and cooled in desiccators, digested in 10 mL of 67% H2SO4. This solution was diluted to 500 mL with distilled water. A standard curve was performed by analyzing 0.1, 0.3, 0.5, 0.7, 1, 2, and 3 mL of this solution and taken to 5 mL with distilled water. Then, 10 mL of anthrone reagent were added and the same procedure as with the samples was followed: mixing, boiling, cooling, standing at room temperature, and final reading in the spectrophotometer.
Cotton samples were placed in the laboratory at 65 ± 2% RH and 21 ± 1 °C for a minimum of 48 h. Thermogravimetric analysis of these samples was performed using Pyris1-TGA equipped with an autosampler (PerkinElmer Shelton, CT). The calibration of TGA was done with the curie point of alumel and nickel alloys at a heating rate of 10 °C min−1. TGA curves were acquired between room temperature and 600 °C at 10 °C min−1 in a flow of nitrogen at 20 mL min−1. Each sample had a mass between 1 and 5 mg. Three replications were performed from each sample. In order to compare thermograms, the first derivative was calculated. The physical interpretation of the inflection point of the first derivative is the point at which the degradation rate is the fastest. Using the inflection points, the thermograms of different samples of cotton were compared. Thus, the inflection points on the thermograms are correlated to the amount of non-cellulosic materials, the amount of cellulose, and crystallinity. The Pyris software was used to calculate the first derivatives and to determine the percent weight loss for each sample.
The analysis of the data was performed using MATLAB (Mathworks, Natick, MA). The plots, curve fittings, and fitting coefficients were obtained with the curve fitting tool in MATLAB. The confidence intervals were calculated at 95%.
3. Results and Discussion
3.1. Cellulose Content
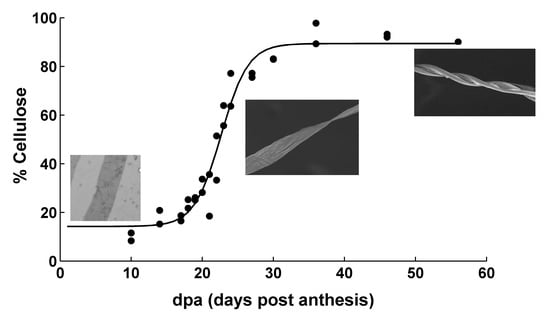
In order to understand the composition of the samples, a modeling analysis of the data of cellulose content in the samples was made. Cellulose content data for this set of samples was previously reported [30]. Statistical analysis of previously published results showed that TX55 cotton genotype started cellulose deposition a few days earlier compared to TM-1 genotype. Figure 1 shows the cellulose content of samples harvested from TM-1 genotype as a function of dpa. The calibration curve for the samples was performed using microcrystalline cellulose. The 100% cellulose in Figure 1 is relative to the concentration of microcrystalline cellulose dissolved in sulfuric acid. Due to the fact that the crystalline cellulose is more difficult to dissolve than the amorphous cellulose, it is expected that the amorphous and crystalline cellulose in the developing cotton fibers are dissolved by the acid digestion process. It can be seen in this figure that the data can be fitted with a sigmoid function. These types of functions have been used in the past to fit data from crops growth [33]. This sigmoid function was used:
in which y represents cellulose content and x represents dpa. Since the data of cellulose content as a function of dpa were fitted with this equation, the coefficients in the equation have a physical meaning. Coefficient a is related to the final cellulose content minus the initial cellulose content. Coefficient b is the inflection point in the sigmoid curve. Thus, this coefficient can be interpreted as the dpa at which the maximum rate of cellulose deposition occurs. Coefficient c is related to cellulose deposition rate. Coefficient d is related to the initial cellulose content. Other researchers fitted a sigmoid function to the cellulose content data from cotton fibers. However, the sigmoid function used differs from the one used in this paper. In addition, extraction and thermal degradation techniques were used to quantify cellulose, instead of using direct quantification such as anthrone method [34].
The cellulose content data as a function of dpa of fibers harvested from genotype TX55 was plotted and fitted to the sigmoid function described above. Figure S2 shows the data and the fitting model.
Table 1 shows confidence intervals for the cellulose content data. All coefficients confidence intervals overlap except for coefficient b. Thus, since coefficient b confidence intervals do not overlap indicates that in fibers from TX55 genotype, the maximum rate of cellulose deposition is reached earlier. This could provide an indication that cellulose deposition starts earlier as well. From the data obtained, fibers harvested from TX55 genotype has an earlier onset of cellulose deposition compared to fibers harvested from TM-1 genotype. This analysis will be used further in this work. Table 2 shows the fitting coefficients and fit statistics for the sigmoid curves.
The derivative of Equation (1) was taken and the result is the following Equation (2):
in which, the first derivative provides data related to the rate of cellulose deposition. It is important to point out that coefficients in Equation (2) are the same as in Equation (1). Thus, by adding the dpa data (x) to this equation, it is possible to plot the rate of cellulose deposition as a function of dpa (Figure 2). This figure shows that fibers harvested from TX55 genotype reach maximum cellulose deposition rate earlier than fibers harvested from TM-1 genotype. The graph also shows that the onset of cellulose deposition is initiated earlier for fibers harvested from TX55 genotype.
3.2. Thermogravimetric Analysis
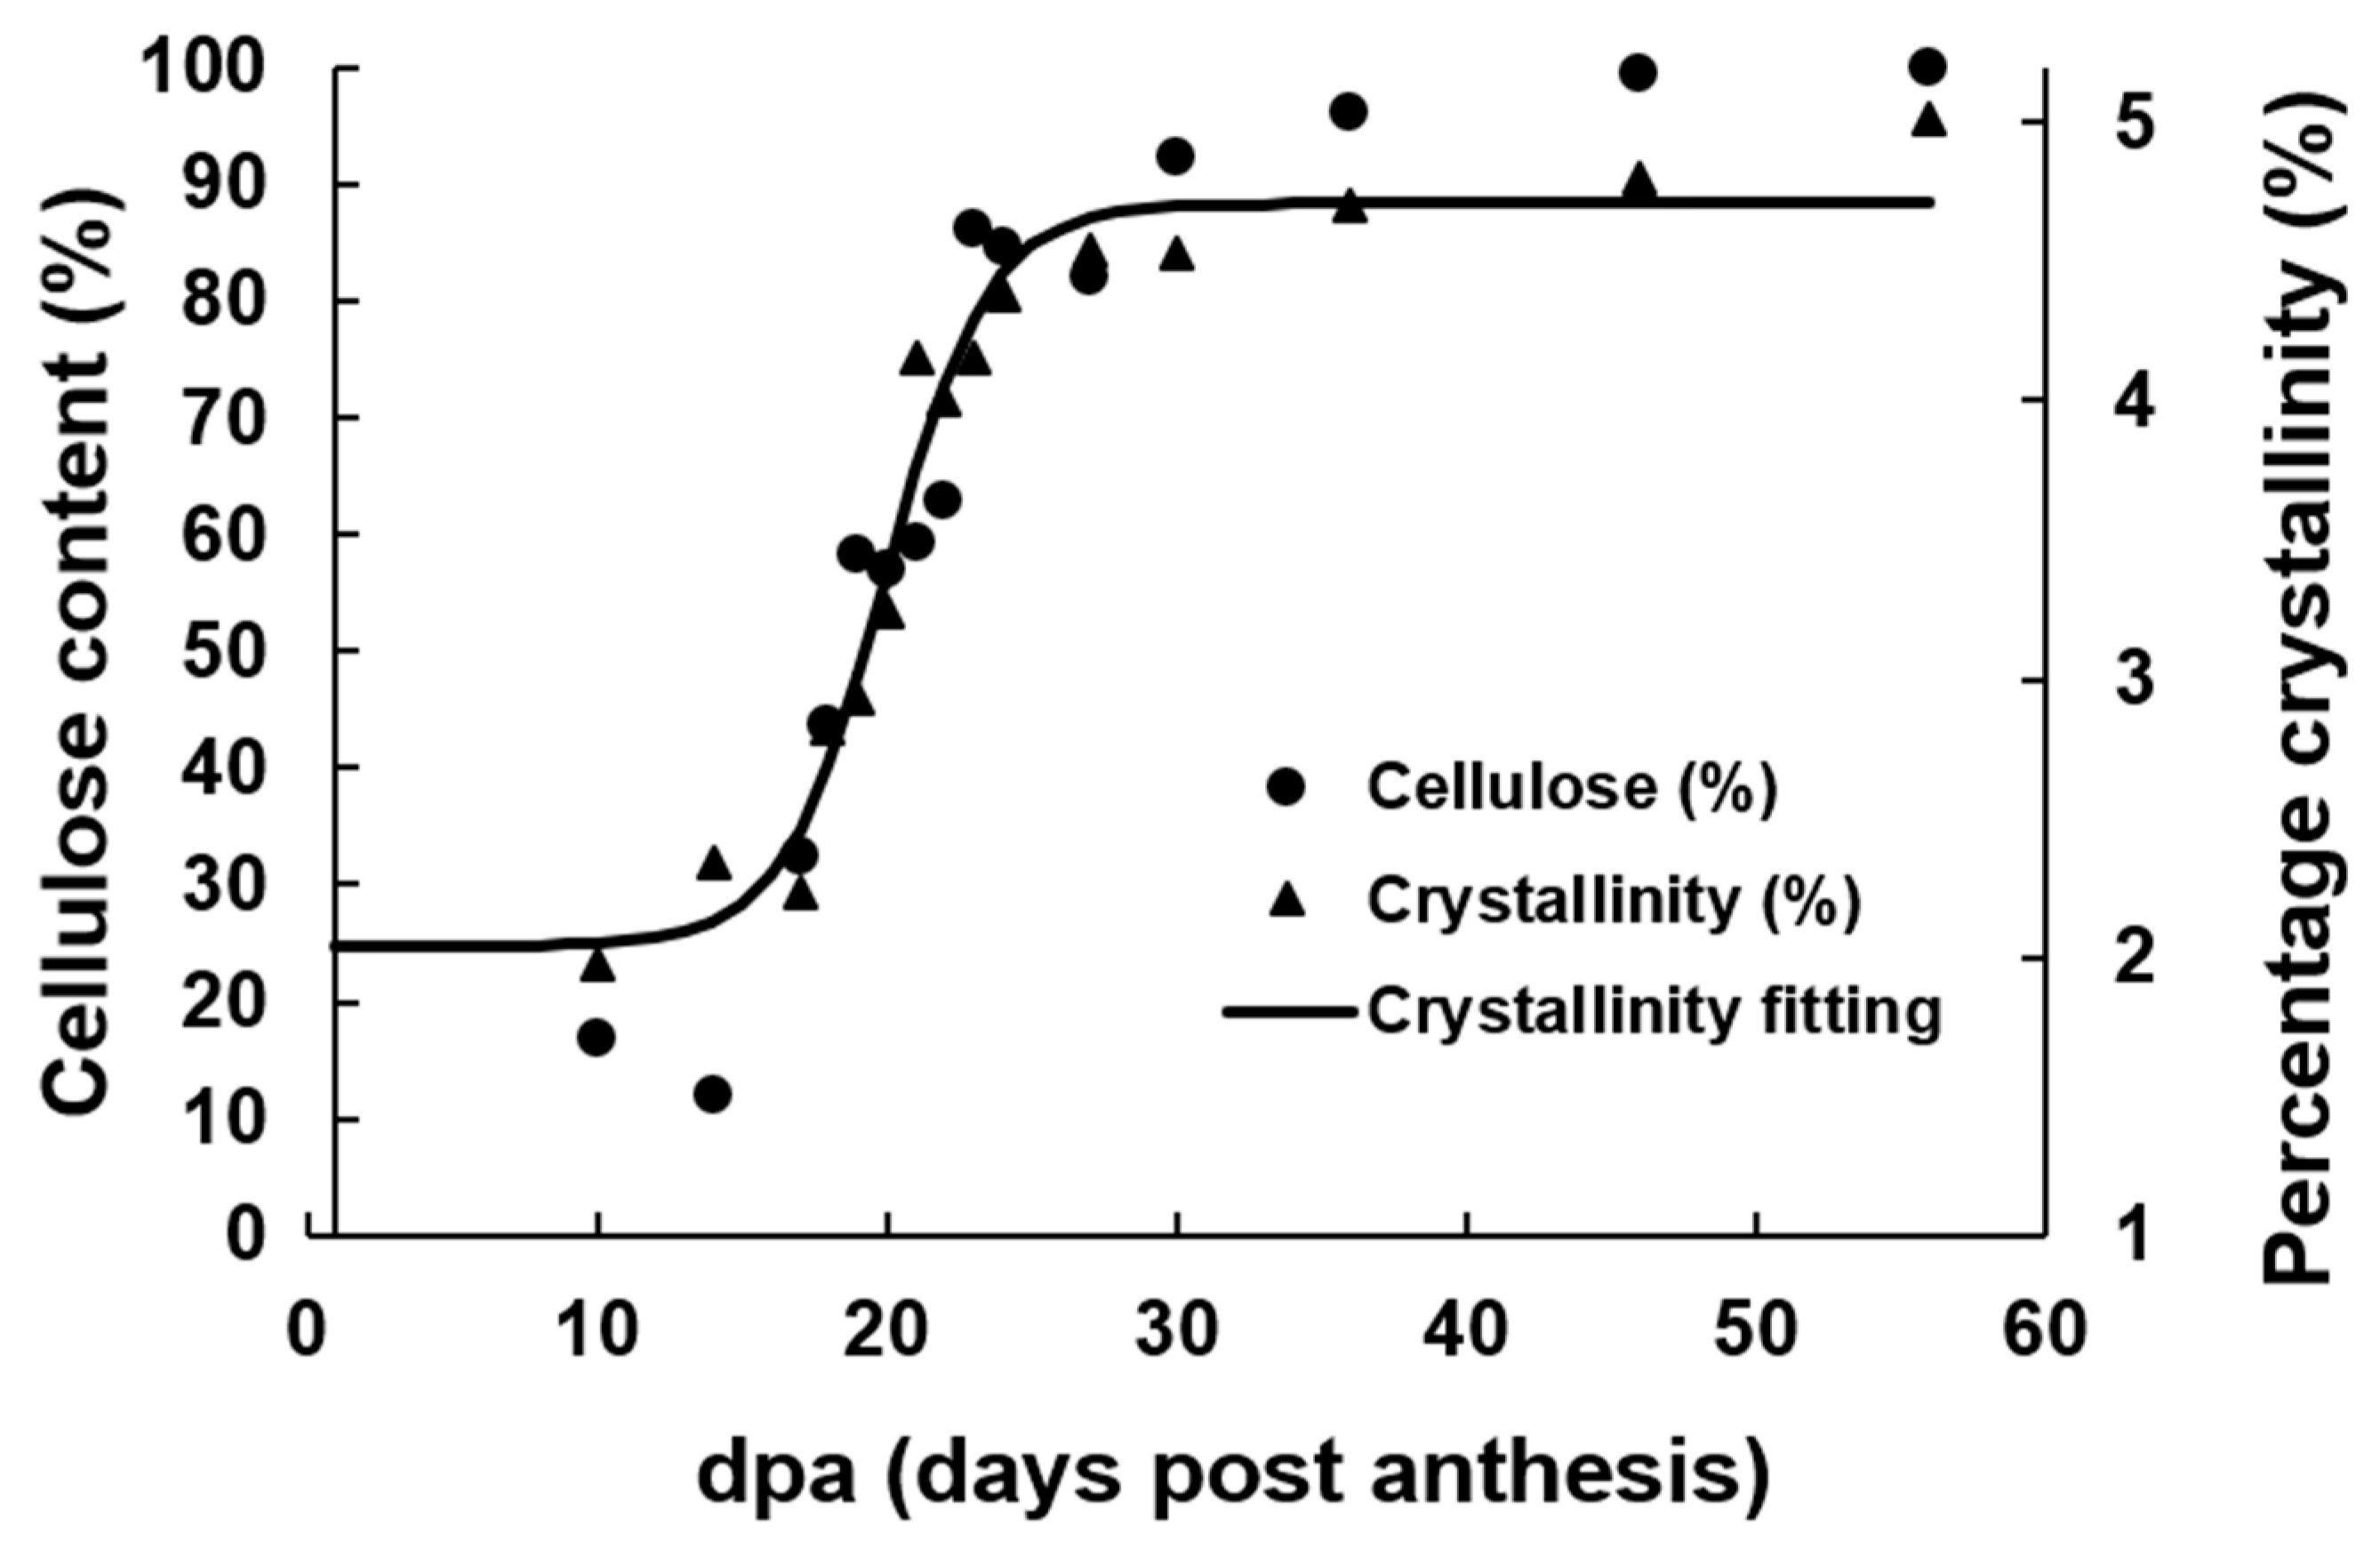
The analysis of the structural development using TGA as a function of dpa could provide additional information on the SCW composition and organization. Figure 3 shows the weight loss percent as a function of temperature for fiber samples harvested from TM-1 genotype at 20 and 56 dpa. The initial weight loss occurs between 37 and 150 °C. This weight loss is due essentially to the loss of absorbed and adsorbed water molecules. It is followed by a weight loss between 150 and ~400 °C, which is assigned to the decomposition of non-cellulosic and cellulosic materials. Between ~400 and 600 °C, the third weight loss occurs and is related to the loss of the product of decomposition in the second region (150 to ~400 °C). The difference in the thermograms between the samples can be attributed to the proportion of non-cellulosic materials and the crystallinity of the samples. The samples in this study have been characterized using X-ray diffraction (XRD) and Fourier transform infrared spectroscopy (FTIR), and the results were published elsewhere [35]. The data of the crystallinity content presented by Abidi and Manike as a function of dpa for genotype TX55 is shown in Figure 4. The same graph for genotype TM-1 is shown in Figure S3. The data of the crystallinity of the samples as a function of dpa follow closely the sigmoid curve of cellulose content as a function of dpa, as shown in Figure 4. The data of the crystallinity of the samples was fitted to the sigmoid equation, and it showed a good fit as shown in Table 2 (R2 = 0.95). Abidi and Manike presented a linear relationship between the crystallinity index and the cellulose content [35]. Avolio et al. reported a decrease in the onset of the degradation temperature as the crystallinity decreased in the samples [13]. Other researchers attributed the distinct behavior of the thermal decomposition among cellulosic samples to different crystallinity content. As the crystallinity index of the cellulosic samples increases, the thermal stability of the samples tends to increase [25,36,37,38].
The first derivative of the thermograms was calculated to emphasize the inflection points. These points could be an indication of thermal transitions. Figure 5 shows the first derivative of the thermogram of fibers harvested from TM-1 genotype at 20 dpa. The first derivative exhibits three major transitions. The first transition which occurs around 50 °C is assigned to the loss of adsorbed water. The losses of non-cellulosic and cellulosic materials are indicated by the second and third transitions. The second transition disappears in the thermograms of fibers harvested at 20 dpa. After this stage, the second transition is present only as a small shoulder. At 20 dpa there is a decrease in the relative amount of non-cellulosic compounds.
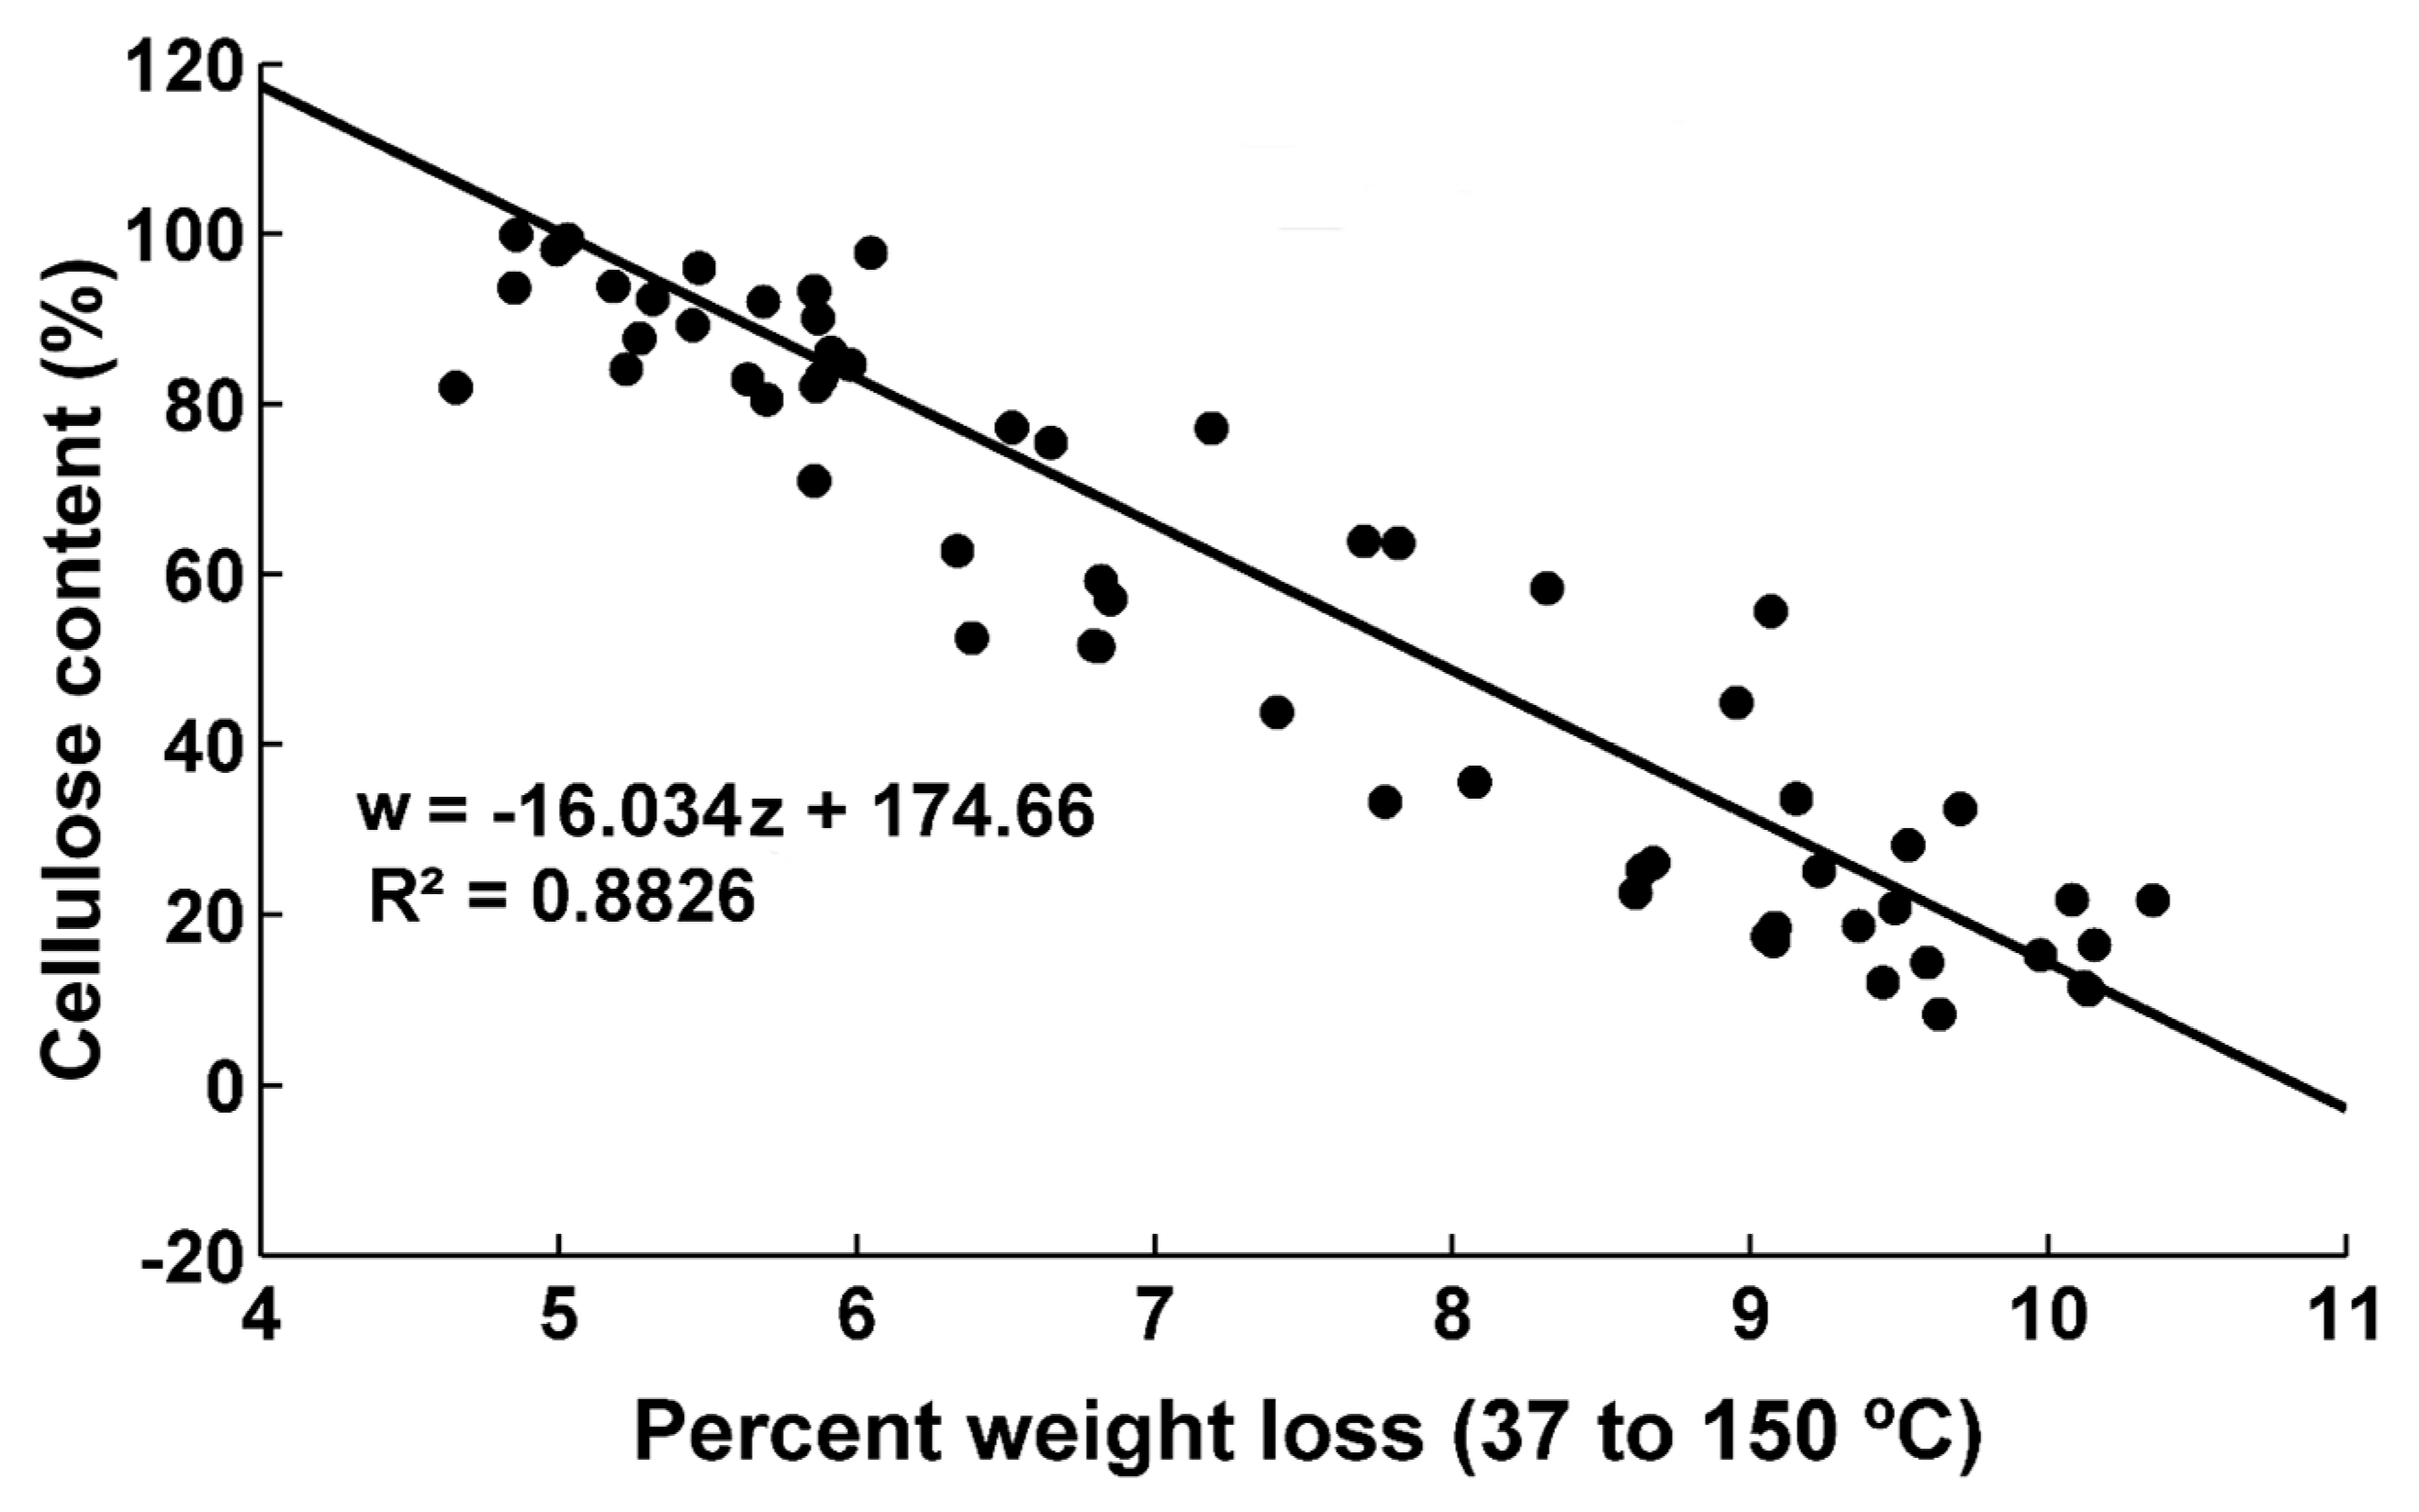
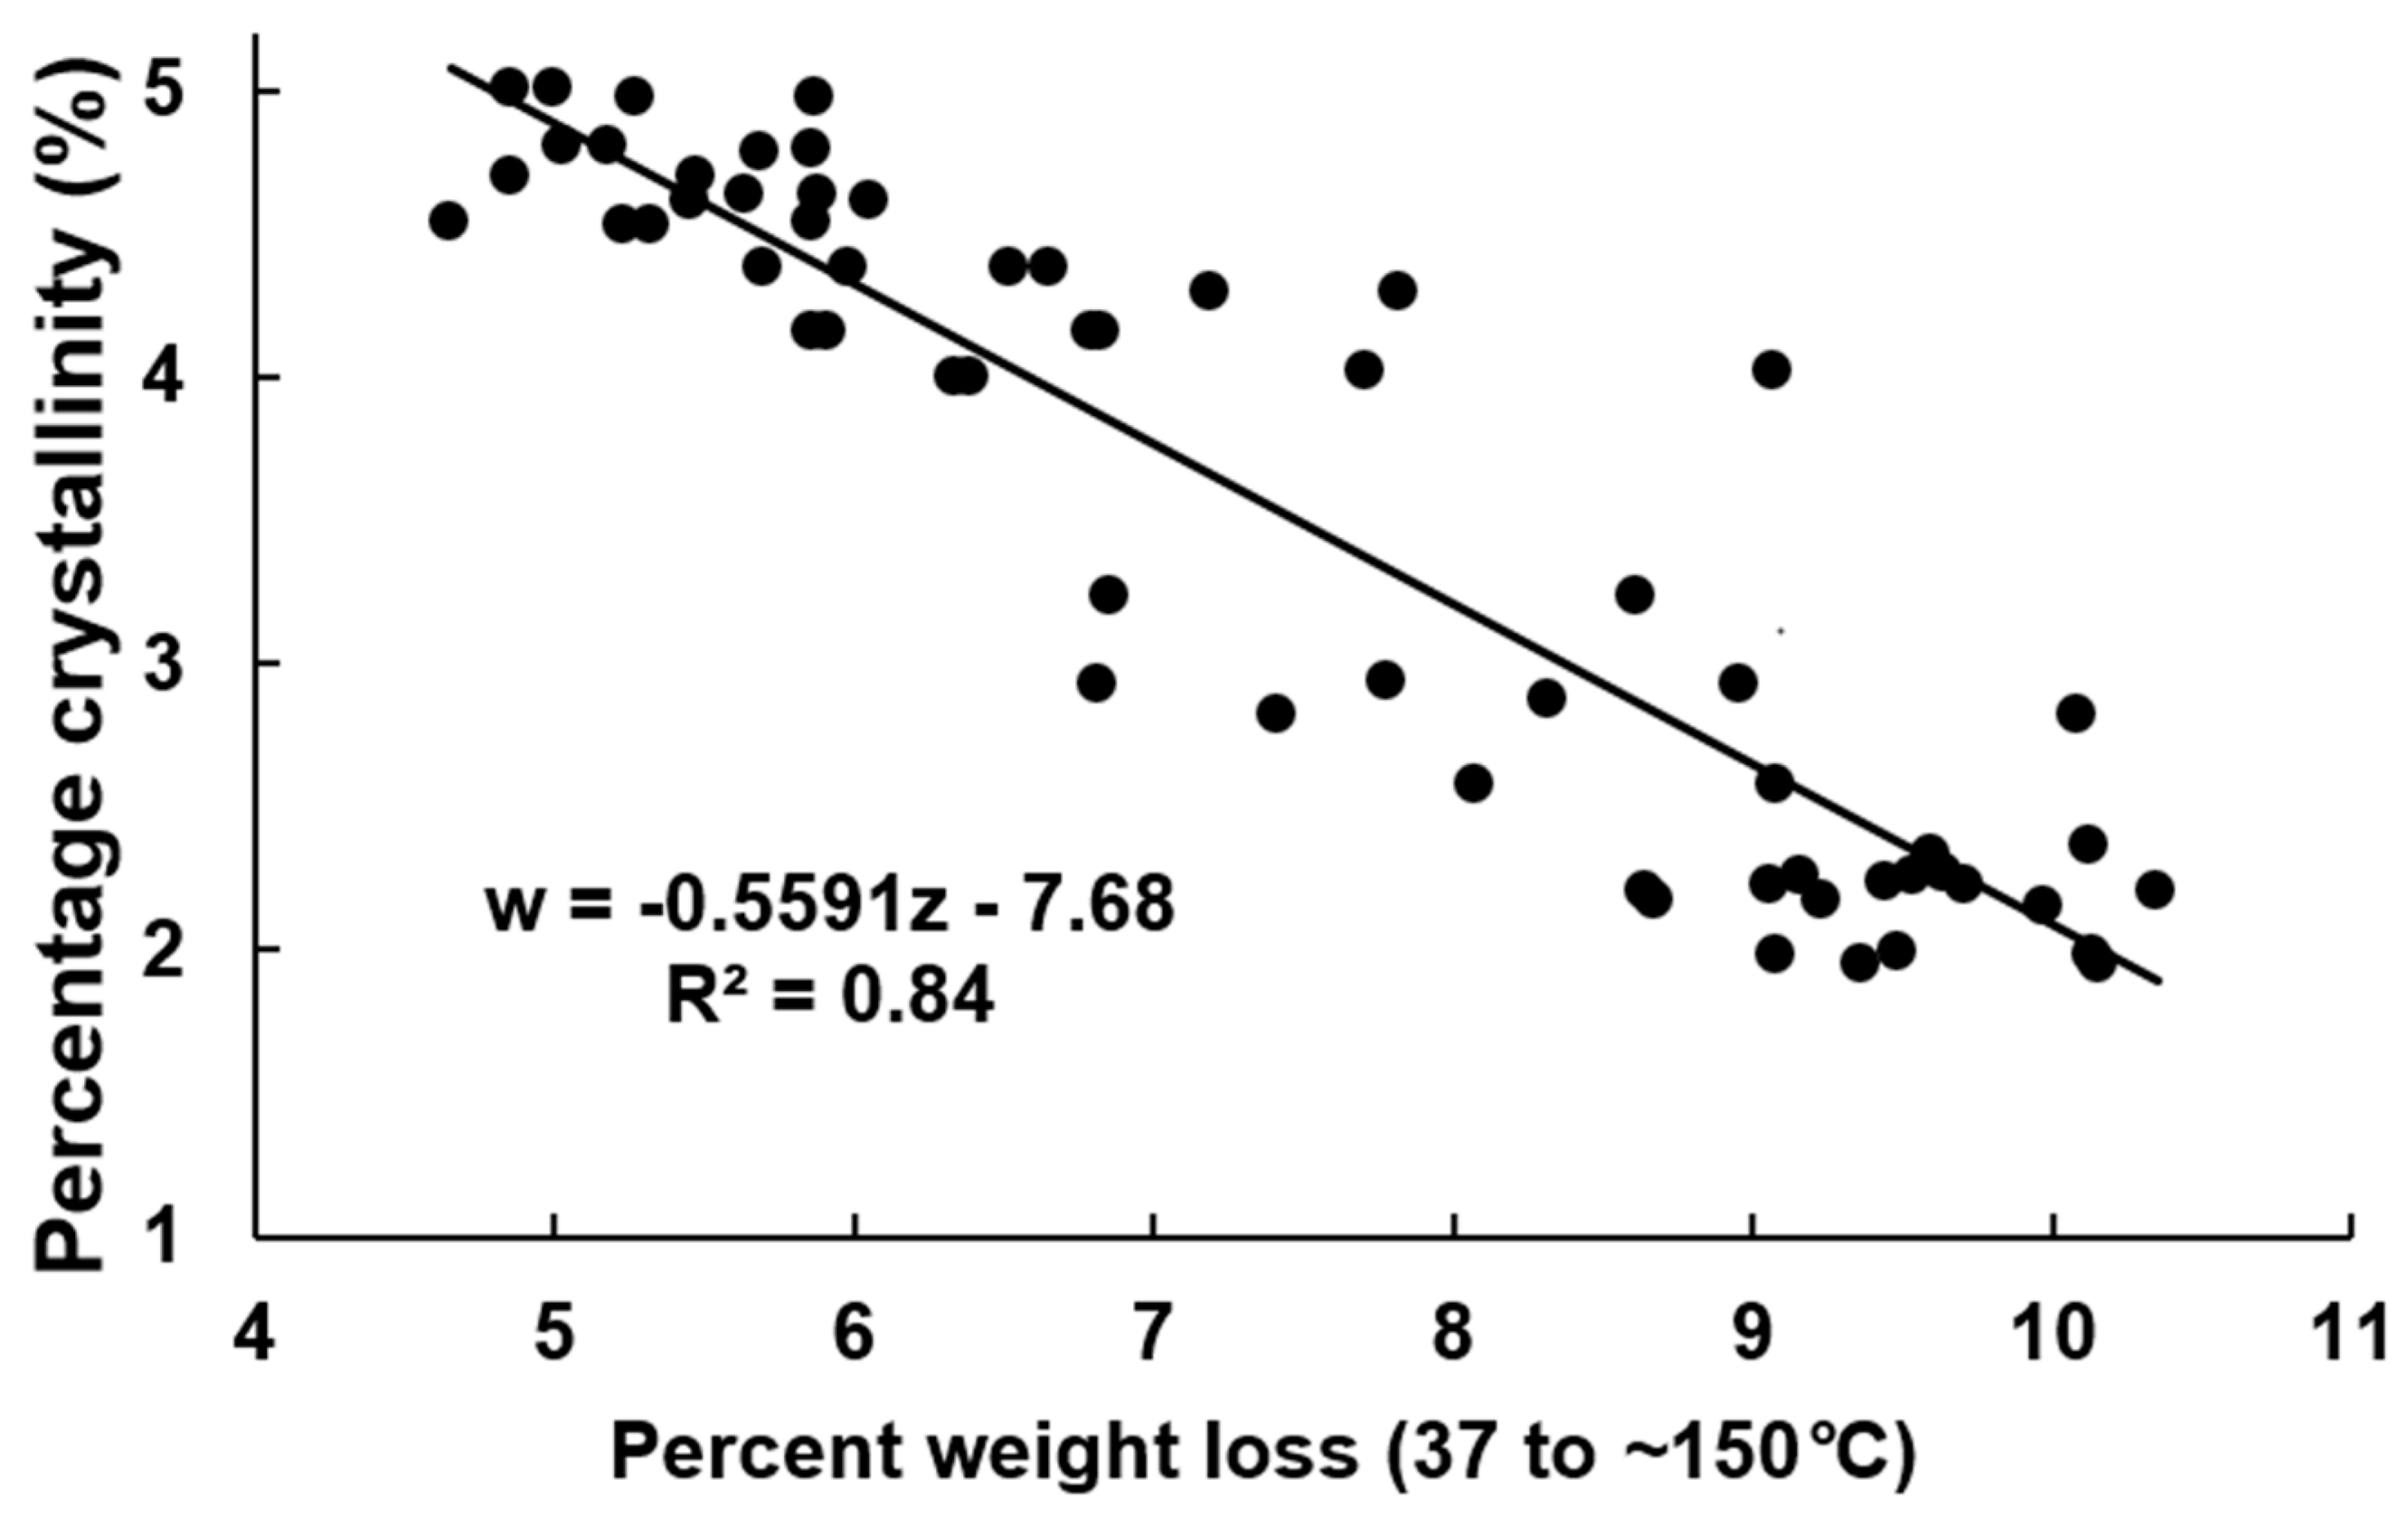
The evolution of the weight loss percent in the region 37–150 °C as a function of dpa is shown in Figure 6 (fibers harvested from TM-1 genotype) and Figure S4 (fibers harvested from TX55 genotype). There is a decrease in weight loss as dpa increases. This region of weight loss has been correlated to the amount of adsorbed water [27]. As cellulose is deposited in the fibers, the amount of the surface area per mass decreases. As the surface area decreases, the amount of adsorbed water decreases as well [4]. Cellulose content for both genotypes as a function of weight loss in the region 37–150 °C shows a linear relationship with a good fitting (R2 = 0.88) (Figure 7). In addition, as the cellulosic layers deposit, there is an increase in the crystallinity as shown in Figure 4. The higher the crystallinity of cellulose samples, the lower its water content. Avolio et al. reported the effect of ball milling on the thermal stability in cellulose samples. The authors presented TGA curves which described an increase in the weight loss between 37 to 150 °C due to the decrease in the crystallinity of the samples. The weight loss changed from 7.3 wt% for untreated cellulose up to 11.6 wt% for the cellulose sample ball milled for 60 min. Thus, the amorphous cellulose had a higher water absorbency than crystalline cellulose [13]. Figure 8 shows the crystallinity of the samples plotted as a function of weight loss in the 37–150 °C region. There is a linear relationship of the crystallinity and the weight loss int this region with good fitting (R2 = 0.84). The decrease in absorbed and adsorbed water in the samples could originate from the reduced surface area per mass of mature fibers and from the decrease of the proportion of amorphous cellulose to crystalline cellulose as the fibers develop. The sigmoid equation fitted to the cellulose content results was also used for these data sets. The fitting coefficients, intervals, and statistics are shown in Table 2 and Table 3. Since the results from the fitting coefficients of cellulose content data showed that coefficient b was statistically different in both genotypes, only the results for coefficient b are shown in the TGA results. Table 3 shows that the confidence intervals for b in this weight loss region do not overlap. Since fibers harvested from TX55 genotype have an earlier increase of cellulose content than fibers from TM-1, it can be hypothesized that the decrease in the weight loss in this region is associated with the increase in cellulose deposition. Thus, the higher the cellulose content, the higher the amount of water that the fiber absorbs and the higher the percent weight loss in this region. The model fitting analysis of the weight loss in this region confirmed that there is a difference in the onset of cellulose deposition among the two genotypes. Graphically, this can be shown by taking the first derivative of the weight loss curves. The weight loss rate as a function of dpa indicates that the weight loss of fibers harvested from TX55 is initiated earlier compared to fibers harvested from TM-1 genotype (Figure S5).
The changes in the percent weight loss in the region 150–400 °C as a function of dpa is exhibited in Figure 9 for fibers harvested from TM-1 genotype (and in Figure S6 for fibers harvested from TX55 genotype). Abidi et al. attributed the weight loss in this temperature range to the loss of non-cellulosic compounds and cellulose [27]. Das et al. attributed the distinct thermal decomposition behavior of cellulosic samples from various sources to non-cellulosic materials, interfibrillar bonding, and different crystal sizes among the samples [39]. It has been reported that cellulose samples with lower crystallinity start to degrade at lower temperatures and have lower thermal degradation activation energies [36]. Among the factors influencing the variability in the thermograms are the proportion of non-cellulosic materials, cellulose, and crystallinity. In general, as the cotton fibers develop, the cellulose content increases, thus, the proportion of non-cellulosic materials decreases. Furthermore, as the dpa increases, the cellulose becomes more organized (increased crystallinity) [35]. Previously, the thermal decomposition behavior of cellulose was correlated to the crystallinity index of the samples [13,37]. Kim et. al. reported that as the crystallite size increased, the thermal decomposition shifted to higher temperatures. However, the activation energy remained almost the same [40]. Poletto et. al. showed a shift of the thermal decomposition to a higher temperature as the crystallinity and crystallite size increased [41]. Figure 10 shows a linear relationship between the weight loss in the region 150–400 °C and the percent crystallinity for both genotypes. The results clearly indicate that TGA could be used to estimate the crystallinity of samples in developing cotton fibers.
The data of weight loss in the region 150–400 °C were fitted to the sigmoid equation previously presented. The fitting data are presented in Table 2 and Table 3. Since the 95% confidence intervals for coefficient b do not overlap, it is possible to show that the dpa at which they achieve a maximum weight loss rate differs for each genotype. The maximum weight loss is achieved earlier for fibers harvested from TX55 genotype compared to fibers harvested from TM-1 genotype.
By taking the first derivative of the weight loss data, the rate of the weight loss as a function of dpa is obtained. Figure S7 shows the weight loss rate in the region 150 to ~400 °C as a function of dpa. The weight loss in this region was plotted as a function of cellulose content (Figure 11). The graph indicates that there is a non-linear relationship between the weight loss in this region and the cellulose content. Therefore, a link between the weight loss in this region and the increase in cellulose content can be established.
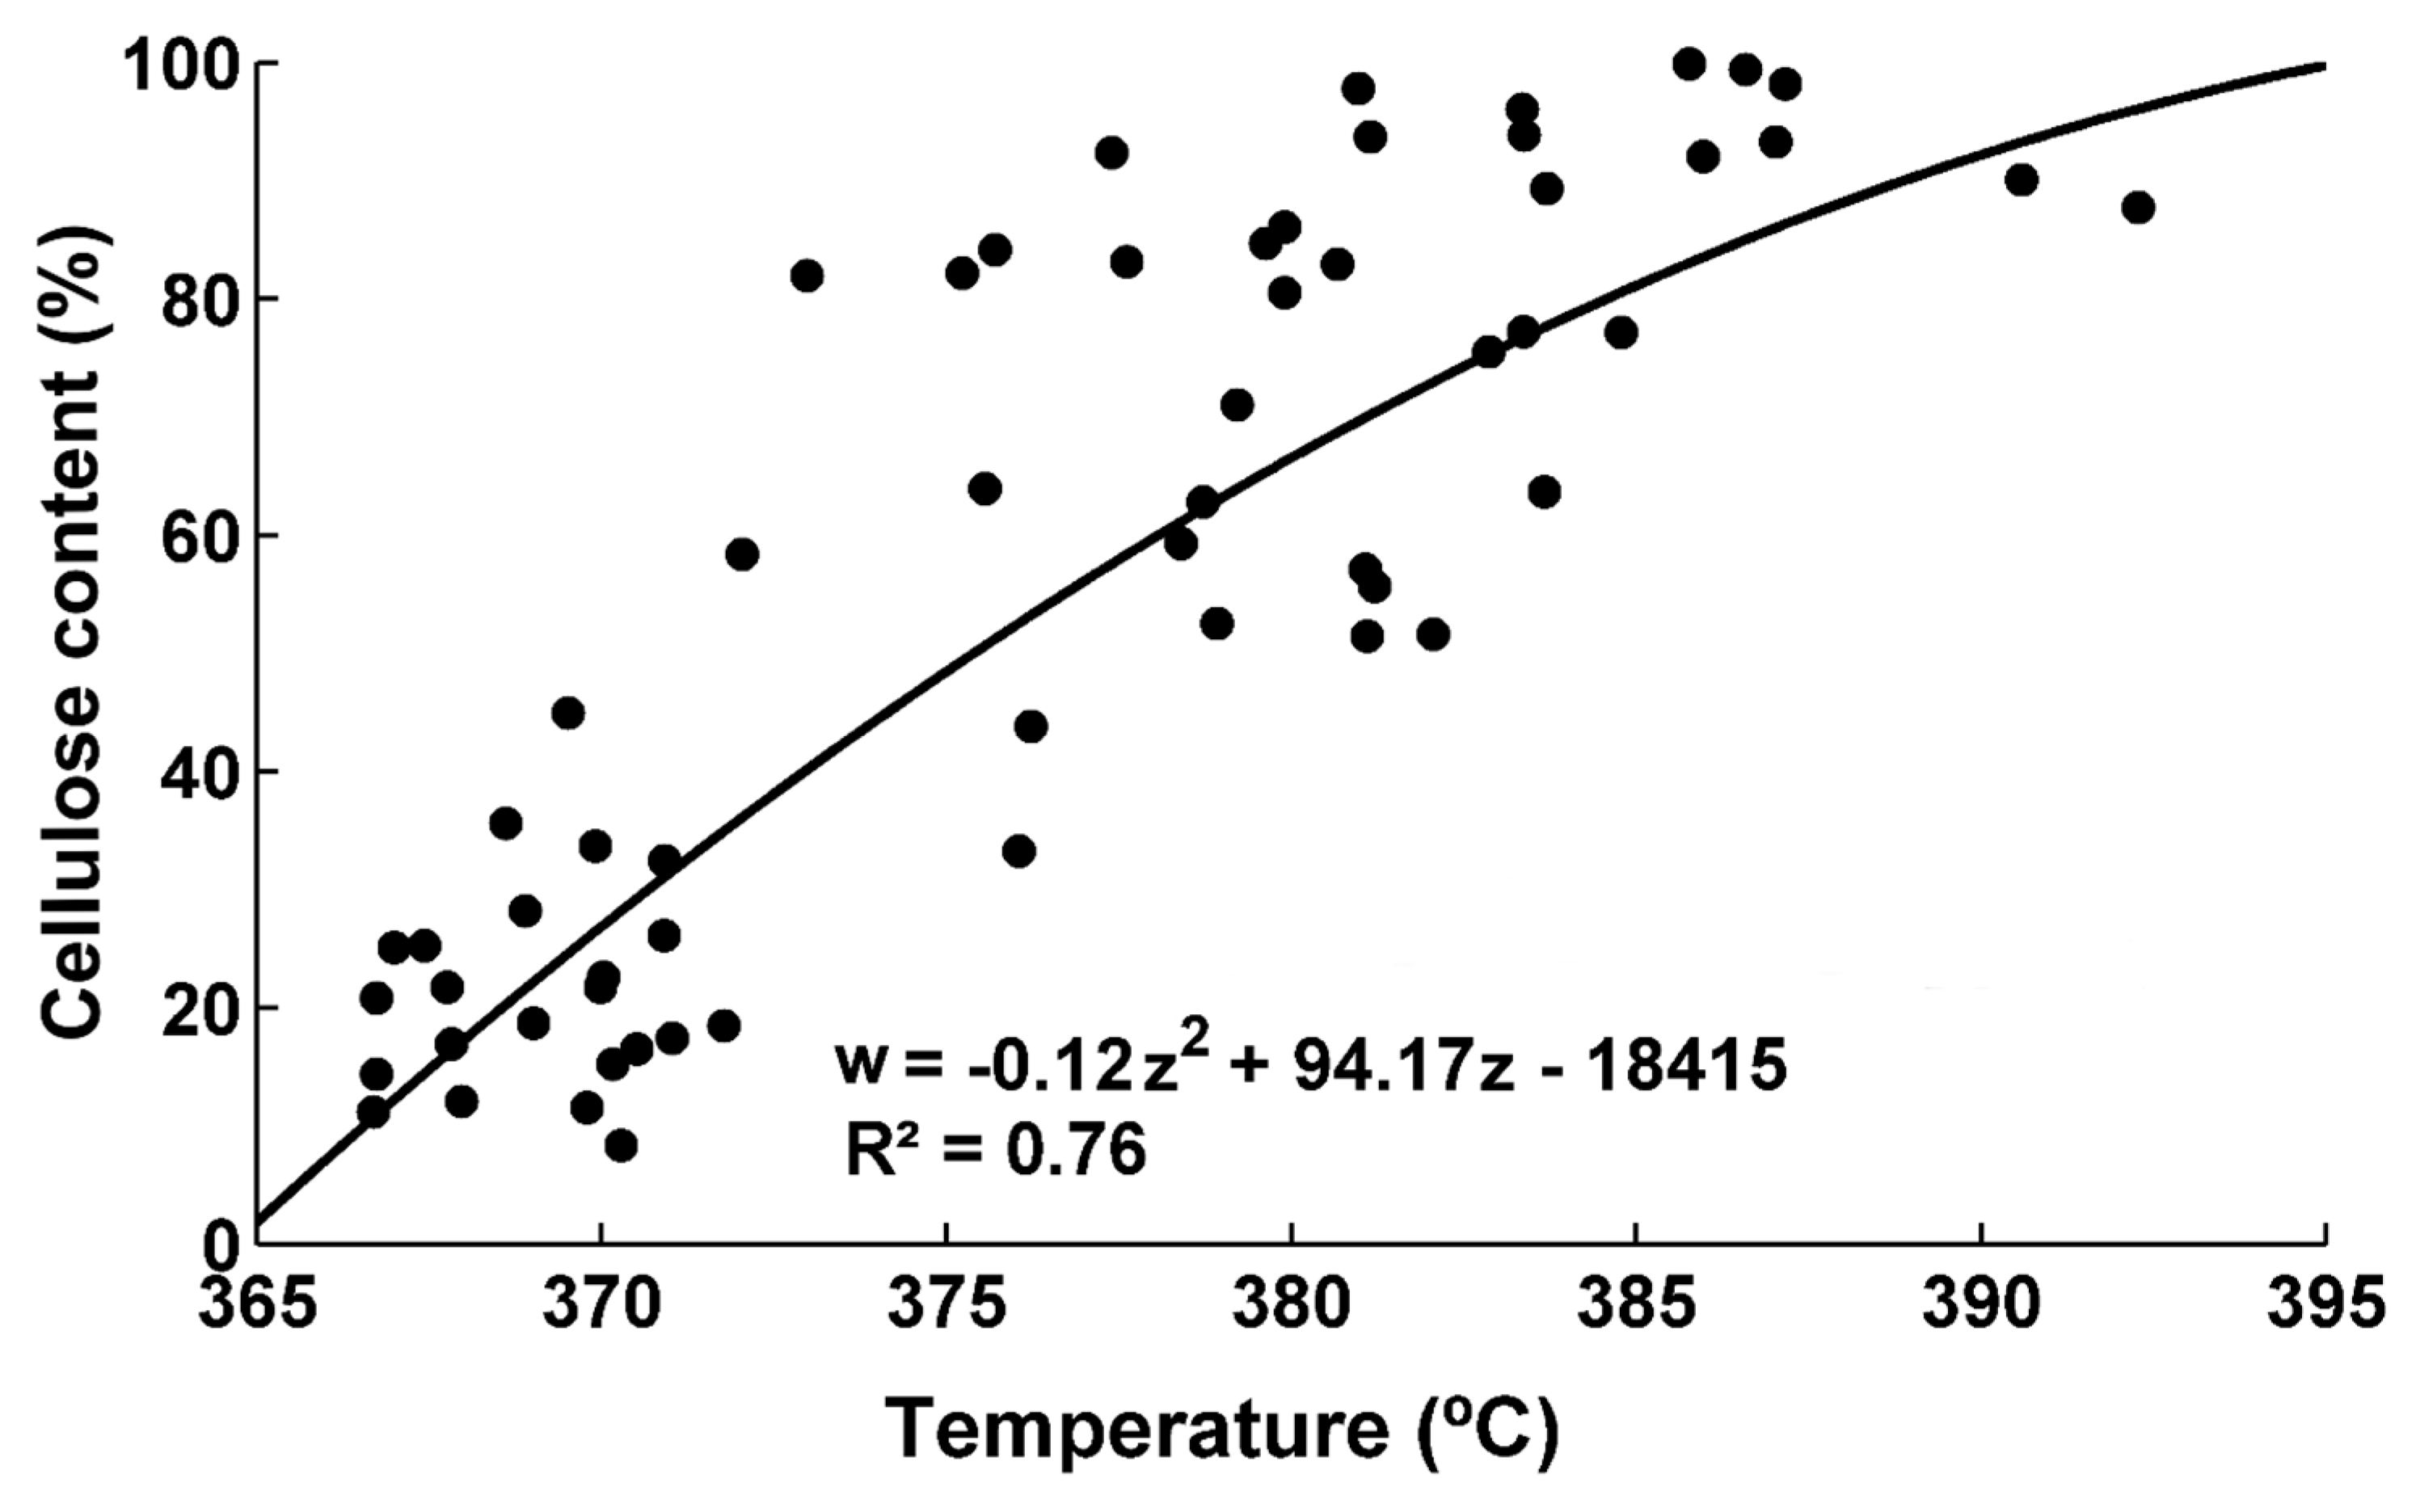
Figure 12 (TM-1 genotype) and S8 (TX55 genotype) show the evolution of the peak temperature in the region 300–400 °C as a function of dpa for the two genotypes. There is an increase in the peak of the decomposition temperature as dpa increases. For example, fibers harvested from TM-1 genotype 10 dpa have a peak of the decomposition temperature of 370 °C, while fibers harvested at 56 dpa have a peak of the decomposition temperature of 391 °C. Fibers harvested from TX55 genotype at 10 dpa have a peak temperature of 367 °C, while the peak temperature fibers harvested at 56 dpa is 387 °C. The sigmoid curve does not fit well the data after 30 dpa as shown in Figure 12 and Figure S8, the R2 values are 0.82 (TM-1) and 0.67 (TX55) as shown in Table 2. The change in the peak temperature could be derived from the amount of cellulose deposited in the fibers, its molecular weight, and crystallinity. Cellulose content in the fibers harvested at 10 dpa is less than 15% and increases to reach ~85–98% at full maturity depending on the genotype [30]. In addition, it has been reported that cellulose in young fibers has a lower molecular weight compared to cellulose in developed fibers [16]. The crystallinity in the samples increases even after 30 dpa [35]. Avolio et al. reported a decrease in the temperature at which the maximum rate of degradation is achieved for cellulosic samples with lower crystallinity. They reported that the samples with a crystallinity index of 0.53 had a temperature of maximum degradation rate at 349 °C. The samples with a crystallinity index of 0.15 had a value of 337 °C [13]. Wang et al. reported that the maximum degradation rate shifted to lower temperatures for amorphous cellulose when compared with crystalline cellulose [36]. Hideno reported similar findings, the ball-milled cellulose had a decrease from 335 °C to 328 °C in the maximum degradation rate temperature when compared to the original sample. This was attributed to the decrease in crystallinity of the sample [38]. The data of crystallinity reported by Abidi et al. was compared to the peak temperature of the developing cotton fibers (graph not shown) and there is not a good relationship, especially after 30 dpa. The same sigmoid curve was fitted to the data from 10 dpa to 27 dpa, and the fitting coefficients and fit statistics are shown in Table 2 and Table 3. These curves fitted well the data and the R2 increased to 0.87 (TM-1) and 0.76 (TX55). The fitting analysis, presented in Table 3, indicates that fibers harvested from TX55 has a lower value of coefficient b compared to fibers harvested from TM-1 genotype and the confidence intervals do not overlap. Thus, for fibers harvested from TX55 genotype the onset of cellulose decomposition temperature is earlier compared to fibers harvested from TM-1 genotype. This can be visualized in Figure S9, in which the first derivatives of the peak temperature were plotted as a function of dpa. Although the proposed sigmoid model does not fit well the data of the peak temperature after 30 dpa, this model can be used to indicate the onset of cellulose deposition for each genotype. It can be concluded that there is a relationship between the initiation of cellulose deposition, and the increase in the peak temperature in the region 300–400 °C.
The data of peak temperature in the region from 300–400 °C was plotted as a function of cellulose content for fibers harvested from TM-1 and TX55 genotypes (Figure 13).
Figure 14 and Figure S10 show the % remaining at 600 °C as a function of dpa for fibers harvested from genotypes TM-1 and TX55 respectively. There is a decrease in weight loss as dpa increases. The model-fitting results (Table 3) indicate an overlapping of the 95% confidence intervals for coefficient b. Therefore, the dpa at which the maximum cellulose deposition rate occurs does not differ from one genotype to the other according to the results from the % remaining at 600 °C.
4. Conclusions
The evolution of the percent weight loss obtained by TGA can provide information on the onset of the cellulose deposition. The results of the weight loss in the regions 37–150 °C and 150–400 °C support the hypothesis that fibers harvested from TX55 genotype have an earlier onset of the SCW compared to fibers harvested from TM-1 genotype. These results indicate that fibers harvested from TX55 genotype may exhibit different structural evolution compared to fibers from TM-1 genotype. This hypothesis is also supported by the results from the peak decomposition temperature in the region 300–400 °C. As dpa increases, the decomposition temperature increases as well. TGA showed great potential to determine the cellulose content and percent crystallinity of developing fibers. The thermal degradation properties could also indicate the onset of cellulose deposition. The results converge towards the conclusion that the initiation of the secondary cell wall is genotype-dependent.
Supplementary Materials
Available online at https://0-www-mdpi-com.brum.beds.ac.uk/2079-6439/7/9/78/s1, Figure S1: List of collected samples, Figure S2: Cellulose content as a function of dpa from TX55 genotype, Figure S3. Cellulose content and percentage crystallinity as a function of dpa for TM-1 genotype, Figure S4: Evolution of the weight loss percent in the region from 37 to 150 °C as a function of dpa for TX55 genotype, Figure S5: Weight loss rate in the temperature range of 37 to 150 °C as a function of dpa for TX55 and TM-1 genotype, Figure S6: Evolution of the weight loss percent in the region from 150 to ~400 °C as a function of dpa for TX55 genotype, Figure S7: Weight loss rate in the temperature range of 150 to 400 °C as a function of dpa for TX55 and TM-1 genotype, Figure S8: Evolution of the peak temperature in the region from 300 to 400 °C as a function of dpa for TX55 genotype, Figure S9: First derivative of the evolution of the peak temperature in the region from 300 to 400 °C as a function of dpa for both genotypes, Figure S10: Evolution of the remaining weight percent at 600 °C as a function of dpa for TX55 genotype.
Author Contributions
The manuscript was finalized through contribution from all authors and all authors read and approved the final manuscript.
Funding
This research received no external funding.
Conflicts of Interest
The authors declare no conflict of interest.
References
- Basra, A. Cotton Fibers: Developmental Biology, Quality Improvement, and Textile Processing; Food Products Press; The Haworth Press: Binghamton, NY, USA, 1999. [Google Scholar]
- Hsieh, Y.L. Chapter 6: Structural Development of Cotton Fibers and Linkages to Fiber Quality. In Cotton Fibers: Developmental Biology, Quality Improvement, and Textile Processing; Basra, A., Ed.; Food Products Press; The Haworth Press: Binghamton, NY, USA, 1999; pp. 137–166. [Google Scholar]
- Xu, Y.; Li, H.B.; Zhu, Y.X. Molecular Biological and Biochemical Studies Reveal New Pathways Important for Cotton Fiber Development. J. Integr. Plant Biol. 2007, 49, 69–74. [Google Scholar] [CrossRef]
- Abidi, N.; Hequet, E.; Cabrales, L.; Gannaway, J.; Wilkins, T.; Wells, L.W. Evaluating cell wall structure and composition of developing cotton fibers using Fourier transform infrared spectroscopy and thermogravimetric analysis. J. Appl. Polym. Sci. 2008, 107, 476–486. [Google Scholar] [CrossRef]
- Haigler, C.H. Physiological and Anatomical Factors Determining Fiber Structure and Utility. In Physiology of Cotton; Stewart, J.M., Oosterhuis, D.M., Heitholt, J.J., Mauney, J.R., Eds.; Springer: Dordrecht, The Netherlands, 2010. [Google Scholar]
- Heyn, A.N.J. The microcrystalline structure of cellulose in cell walls of cotton, ramie, and jute fibers as revealed by negative staining of sections. J. Cell Biol. 1966, 29, 181–197. [Google Scholar] [CrossRef] [PubMed]
- Muhlethaler, K. Ultrastructure and Formation of Plant Cell Walls. Annu. Rev. Plant Physiol. 1967, 18, 1–24. [Google Scholar] [CrossRef]
- Paralikar, K.M. Electron diffraction studies of cotton fibers from bolls during early stages of development. J. Polym. Sci. Part C Polym. Lett. 1986, 24, 419–421. [Google Scholar] [CrossRef]
- Hu, X.P.; Hsieh, Y.L. Crystalline structure of developing cotton fibers. J. Polym. Sci. Part B Polym. Phys. 1996, 34, 1451–1459. [Google Scholar] [CrossRef]
- Hsieh, Y.L.; Hu, X.P.; Nguyen, A. Strength and Crystalline Structure of Developing Acala Cotton. Text. Res. J. 1997, 67, 529–536. [Google Scholar] [CrossRef]
- Mihranyan, A.; Llagostera, A.P.; Karmhag, R.; Strømme, M.; Ek, R. Moisture sorption by cellulose powders of varying crystallinity. Int. J. Pharm. 2004, 269, 433–442. [Google Scholar] [CrossRef]
- Ling, Z.; Wang, T.; Makarem, M.; Cintrón, M.S.; Cheng, H.N.; Kang, X.; Bacher, M.; Potthast, A.; Rosenau, T.; King, H.; et al. Effects of ball milling on the structure of cotton cellulose. Cellulose 2019, 26, 305–328. [Google Scholar] [CrossRef]
- Avolio, R.; Bonadies, I.; Capitani, D.; Errico, M.E.; Gentile, G.; Avella, M. A multitechnique approach to assess the effect of ball milling on cellulose. Carbohydr. Polym. 2012, 87, 265–273. [Google Scholar] [CrossRef]
- Huwyler, H.R.; Franz, G.; Meier, H. Changes in the composition of cotton fibre cell walls during development. Planta 1979, 146, 635–642. [Google Scholar] [CrossRef] [PubMed]
- Timpa, J.D.; Triplett, B.A. Analysis of cell-wall polymers during cotton fiber development. Planta 1993, 189, 101–108. [Google Scholar] [CrossRef]
- Hoson, T.; Tokumoto, H.; Wakabayashi, K.; Kamisaka, S. Changes in the Sugar Composition and Molecular Mass Distribution of Matrix Polysaccharides during Cotton Fiber Development. Plant Cell Physiol. 2002, 43, 411–418. [Google Scholar]
- Thomasson, J.A.; Manickavasagam, S.; Mengüç, M.P. Cotton fiber quality characterization with light scattering and fourier transform infrared techniques. Appl. Spectrosc. 2009, 63, 321–330. [Google Scholar] [CrossRef] [PubMed]
- Liu, Y. Recent Progress in Fourier Transform Infrared (FTIR) Spectroscopy Study of Compositional, Structural and Physical Attributes of Developmental Cotton Fibers. Materials 2013, 6, 299–313. [Google Scholar] [CrossRef] [PubMed] [Green Version]
- Abidi, N.; Cabrales, L.; Hequet, E. Fourier transform infrared spectroscopic approach to the study of the secondary cell wall development in cotton fiber. Cellulose 2010, 17, 309–320. [Google Scholar] [CrossRef]
- Abidi, N.; Hequet, E.; Cabrales, L. Changes in sugar composition and cellulose content during the secondary cell wall biogenesis in cotton fibers. Cellulose 2010, 17, 153–160. [Google Scholar] [CrossRef]
- Ball, R.; McIntosh, A.C.; Brindley, J. The role of char-forming processes in the thermal decomposition of cellulose. Phys. Chem. Chem. Phys. 1999, 1, 5035–5043. [Google Scholar] [CrossRef]
- Cabrales, L.; Abidi, N. On the thermal degradation of cellulose in cotton fibers. J. Therm. Anal. Calorim. 2010, 102, 485–491. [Google Scholar] [CrossRef]
- Price, D.M.; Hourston, D.J.; Dumont, F. Thermogravimetry of Polymers. In Encyclopedia of Analytical Chemistry; Meyers, R.A., Ed.; John Wiley & Sons: Hoboken, NJ, USA, 2000; pp. 8094–8105. [Google Scholar]
- Abidi, N.; Hequet, E.; Ethridge, D. Thermogravimetric analysis of cotton fibers: Relationships with maturity and fineness. J. Appl. Polym. Sci. 2007, 103, 3476–3482. [Google Scholar] [CrossRef]
- Schultz, T.P.; McGinnis, G.D.; Bertran, M.S. Estimation of Cellulose Crystallinity Using Fourier Transform-Infrared Spectroscopy and Dynamic Thermogravimetry. J. Wood Chem. Technol. 1985, 5, 543–557. [Google Scholar] [CrossRef]
- Lengowski, E.C.; Magalhães, W.L.E.; Nisgoski, S.; De Muniz, G.I.B.; Satyanarayana, K.G.; Lazzarotto, M. New and improved method of investigation using thermal tools for characterization of cellulose from eucalypts pulp. Thermochim. Acta 2016, 638, 44–51. [Google Scholar] [CrossRef]
- Abidi, N.; Cabrales, L.; Hequet, E. Thermogravimetric analysis of developing cotton fibers. Thermochim. Acta 2010, 498, 27–32. [Google Scholar] [CrossRef]
- Vyazovkin, S.; Wight, C.A. Isothermal and non-isothermal kinetics of thermally stimulated reactions of solids. Int. Rev. Phys. Chem. 1998, 17, 407–433. [Google Scholar] [CrossRef]
- Vyazovkin, S.; Wight, C.A. Kinetics in Solids. Annu. Rev. Phys. Chem. 1997, 48, 125–149. [Google Scholar] [CrossRef] [PubMed]
- Abidi, N.; Cabrales, L.; Haigler, C.H. Changes in the cell wall and cellulose content of developing cotton fibers investigated by FTIR spectroscopy. Carbohydr. Polym. 2014, 100, 9–16. [Google Scholar] [CrossRef] [PubMed]
- Updegraff, D.M. Semimicro determination of cellulose inbiological materials. Anal. Biochem. 1969, 32, 420–424. [Google Scholar] [CrossRef]
- Viles, F.J.; Silverman, L. Determination of Starch and Cellulose with Anthrone. Anal. Chem. 1949, 21, 950–953. [Google Scholar] [CrossRef]
- Yin, X.; Goudriaan, J.A.; Lantinga, E.; Vos, J.; Spiertz, H.J. A flexible sigmoid function of determinate growth. Ann. Bot. 2003, 91, 361–371. [Google Scholar] [CrossRef]
- Wang, Y.; Shu, H.; Chen, B.; McGiffen, M.E.; Zhang, W.; Xu, N.; Zhou, Z. The rate of cellulose increase is highly related to cotton fibre strength and is significantly determined by its genetic background and boll period temperature. Plant Growth Regul. 2009, 57, 203–209. [Google Scholar] [CrossRef]
- Abidi, N.; Manike, M. X-ray diffraction and FTIR investigations of cellulose deposition during cotton fiber development. Text. Res. J. 2018, 88, 719–730. [Google Scholar] [CrossRef]
- Wang, Z.; McDonald, A.G.; Westerhof, R.J.; Kersten, S.R.; Cuba-Torres, C.M.; Ha, S.; Pecha, B.; Garcia-Perez, M. Effect of cellulose crystallinity on the formation of a liquid intermediate and on product distribution during pyrolysis. J. Anal. Appl. Pyrolysis 2013, 100, 56–66. [Google Scholar] [CrossRef]
- Poletto, M.; Pistor, V.; Santana, R.M.C.; Zattera, A.J. Materials produced from plant biomass: Part II: Evaluation of crystallinity and degradation kinetics of cellulose. Mater. Res. 2012, 15, 421–427. [Google Scholar] [CrossRef]
- Hideno, A. Comparison of the Thermal Degradation Properties of Crystalline and Amorphous Cellulose, as well as Treated Lignocellulosic Biomass. Bioresources 2016, 11, 6309–6319. [Google Scholar] [CrossRef]
- Das, K.; Ray, D.; Bandyopadhyay, N.R.; Sengupta, S. Study of the Properties of Microcrystalline Cellulose Particles from Different Renewable Resources by XRD, FTIR, Nanoindentation, TGA and SEM. J. Polym. Environ. 2010, 18, 355–363. [Google Scholar] [CrossRef]
- Kim, U.-J.; Eom, S.H.; Wada, M. Thermal decomposition of native cellulose: Influence on crystallite size. Polym. Degrad. Stab. 2010, 95, 778–781. [Google Scholar] [CrossRef]
- Poletto, M.; Zattera, A.J.; Forte, M.M.; Santana, R.M. Thermal decomposition of wood: Influence of wood components and cellulose crystallite size. Bioresour. Technol. 2012, 109, 148–153. [Google Scholar] [CrossRef] [PubMed]
Figure 1.
Cellulose content as a function of dpa from TM-1 genotype.

Figure 2.
Cellulose deposition rate as a function of dpa from TX55 and TM-1 genotype.

Figure 3.
Percentage weight loss of cotton fibers from TM-1 genotype harvested at 20 and 56 dpa as a function of temperature.
Figure 3.
Percentage weight loss of cotton fibers from TM-1 genotype harvested at 20 and 56 dpa as a function of temperature.

Figure 4.
Cellulose content and percentage crystallinity as function of dpa for TX55 genotype.

Figure 5.
First derivative of the percentage weight loss of fibers from TM-1 genotype harvested at 20 dpa as a function of temperature.
Figure 5.
First derivative of the percentage weight loss of fibers from TM-1 genotype harvested at 20 dpa as a function of temperature.

Figure 6.
Evolution of the weight loss percent in the region from 37 to 150 °C as a function of dpa for TM-1 genotype.
Figure 6.
Evolution of the weight loss percent in the region from 37 to 150 °C as a function of dpa for TM-1 genotype.

Figure 7.
Cellulose content as a function of weight loss in the region from 37 to 150 °C for both genotypes.
Figure 7.
Cellulose content as a function of weight loss in the region from 37 to 150 °C for both genotypes.

Figure 8.
Percent crystallinity as a function of the weight loss percent in the region from 37 to ~150 °C.
Figure 8.
Percent crystallinity as a function of the weight loss percent in the region from 37 to ~150 °C.

Figure 9.
Evolution of the weight loss percent in the region from 150 to ~400 °C as a function of dpa for TM-1 genotype.
Figure 9.
Evolution of the weight loss percent in the region from 150 to ~400 °C as a function of dpa for TM-1 genotype.

Figure 10.
Percent crystallinity as a function of the weight loss percent in the region from 150 to ~400 °C.
Figure 10.
Percent crystallinity as a function of the weight loss percent in the region from 150 to ~400 °C.

Figure 11.
Cellulose content as a function of weight loss in the region from 150 to 400 °C.

Figure 12.
Evolution of the peak temperature in the region from 300 to 400 °C as a function of dpa for TM-1 genotype.
Figure 12.
Evolution of the peak temperature in the region from 300 to 400 °C as a function of dpa for TM-1 genotype.

Figure 13.
Cellulose content as a function of the peak temperature in the region from 300 to 400 °C.
Figure 13.
Cellulose content as a function of the peak temperature in the region from 300 to 400 °C.

Figure 14.
Evolution of the remaining weight percent at 600 °C as a function of dpa for TM-1 genotype.
Figure 14.
Evolution of the remaining weight percent at 600 °C as a function of dpa for TM-1 genotype.


Table 1.
Confidence intervals for cellulose content data. The intervals are calculated at 95% confidence.
Table 1.
Confidence intervals for cellulose content data. The intervals are calculated at 95% confidence.
| Genotype | ||
|---|---|---|
| TM-1 | TX55 | |
| Coefficient a Confidence Interval | [66.67, 83.59] | [68.94, 100.75] |
| Coefficient b Confidence Interval | [21.99, 23.33] | [19.30, 21.77] |
| Coefficient c Confidence Interval | [1.22, 2.55] | [1.47, 3.70] |
| Coefficient d Confidence Interval | [7.99, 20.44] | [−3.07, 23.30] |
Table 2.
Fitting coefficients and fit statistics for the sigmoid curves.
| Coefficients | |||||
|---|---|---|---|---|---|
| Graph | a | b | c | d | R2 |
| Cellulose % TM-1 (Figure 1) | 75.17 | 22.66 | 1.89 | 14.22 | 0.91 |
| Crystallinity TX55 (Figure 4) | −2.67 | 19.99 | −1.78 | 4.71 | 0.95 |
| WL 37–150 °C TM-1 (Figure 6) | 4.31 | 23.04 | −2.07 | 5.65 | 0.89 |
| WL 150–400 °C TM-1 (Figure 9) | 25.43 | 20.96 | 1.4 | 51.27 | 0.94 |
| Peak 300–400 °C TM-1 (Figure 12) | 15.55 (14.17 *) | 22.13 (21.92 *) | 0.76 (0.62 *) | 368.94 (368.99 *) | 0.82 (0.87 *) |
| Remaining % TM-1 (Figure 14) | 13.15 | 20.72 | −1.58 | 13.69 | 0.84 |
| Cellulose % TX55 (Figure S2) | 84.85 | 20.53 | 2.59 | 10.66 | 0.95 |
| Crystallinity TM-1 (Figure S3) | −2.51 | 22.42 | −0.75 | 4.67 | 0.97 |
| WL 37–150 °C TX55 (Figure S4) | 4.48 | 20.47 | −1.53 | 5.15 | 0.91 |
| WL 150–400 °C TX55 (Figure S6) | 26.02 | 18.81 | 1.51 | 49.03 | 0.79 |
| Peak 300–400 °C TX55 (Figure S8) | 14.03 (12.85 *) | 19.25 (19.30 *) | 1.73 (1.26 *) | 367.03 (367.66 *) | 0.67 (0.76 *) |
| Remaining % TX55 (Figure S10) | 12.69 | 18.62 | −1.57 | 16.05 | 0.53 |
* These values were calculated only using the data from 10 to 27 dpa.
Table 3.
Confidence intervals for coefficient b for the sigmoid curves. The intervals are calculated at the 95% confidence.
Table 3.
Confidence intervals for coefficient b for the sigmoid curves. The intervals are calculated at the 95% confidence.
| Graph | Coefficient b Confidence Interval |
|---|---|
| Cellulose % TM-1 (Figure 1) | [21.59, 24.50] |
| Crystallinity TX55 (Figure 4) | [19.08, 20.91] |
| WL 37–150 °C TM-1 (Figure 6) | [21.59, 24.50] |
| WL 150–400 °C TM-1 (Figure 9) | [20.39, 21.54] |
| Peak 300–400 °C TM-1 (Figure 12) | [21.36, 22.90] [21.34, 22.50] * |
| Remaining % TM-1 (Figure 14) | [19.58, 21.87] |
| Cellulose % TX55 (Figure S2) | [19.30, 21.77] |
| Crystallinity TM-1 (Figure S3) | [22.03, 22.81] |
| WL 37–150 °C TX55 (Figure S4) | [19.67, 21.27] |
| WL 150–400 °C TX55 (Figure S6) | [17.54, 20.08] |
| Peak 300–400 °C TX55 (Figure S8) | [17.15, 21.34] [17.65, 20.95] * |
| Remaining % TX55 (Figure S10) | [16.34, 20.91] |
* These values were calculated only using the data from 10 to 27 dpa.
© 2019 by the authors. Licensee MDPI, Basel, Switzerland. This article is an open access article distributed under the terms and conditions of the Creative Commons Attribution (CC BY) license (http://creativecommons.org/licenses/by/4.0/).
Share and Cite
MDPI and ACS Style
Cabrales, L.; Abidi, N. Kinetics of Cellulose Deposition in Developing Cotton Fibers Studied by Thermogravimetric Analysis. Fibers 2019, 7, 78. https://0-doi-org.brum.beds.ac.uk/10.3390/fib7090078
AMA Style
Cabrales L, Abidi N. Kinetics of Cellulose Deposition in Developing Cotton Fibers Studied by Thermogravimetric Analysis. Fibers. 2019; 7(9):78. https://0-doi-org.brum.beds.ac.uk/10.3390/fib7090078
Chicago/Turabian StyleCabrales, Luis, and Noureddine Abidi. 2019. "Kinetics of Cellulose Deposition in Developing Cotton Fibers Studied by Thermogravimetric Analysis" Fibers 7, no. 9: 78. https://0-doi-org.brum.beds.ac.uk/10.3390/fib7090078
Note that from the first issue of 2016, this journal uses article numbers instead of page numbers. See further details here.