Dissolution and Diffusion-Based Reactions within YBa2Cu3O7−x Glass Fibers


1
Department of Materials Science and Engineering, Virginia Polytechnic Institute and State University (Virginia Tech), Blacksburg, VA 24061, USA
2
Center for Photonics Technology, The Bradley Department of Electrical and Computer Engineering, Virginia Polytechnic Institute and State University (Virginia Tech), Blacksburg, VA 24061, USA
3
Department of Chemistry, Virginia Polytechnic Institute and State University (Virginia Tech), Blacksburg, VA 24061, USA
*
Author to whom correspondence should be addressed.
Fibers 2020, 8(1), 2; https://0-doi-org.brum.beds.ac.uk/10.3390/fib8010002
Submission received: 4 October 2019
/
Revised: 4 December 2019
/
Accepted: 10 December 2019
/
Published: 20 December 2019
(This article belongs to the Special Issue Advances in Glass Fibers)
Abstract
:This work presents a thorough identification and analysis of the dissolution and diffusion-based reaction processes that occur during the drawing of YBa2Cu3O7−x (YBCO) glass-clad fibers, using the molten-core approach, on a fiber draw tower in vacuum and in oxygen atmospheres. The results identify the dissolution of the fused silica cladding and the subsequent diffusion of silicon and oxygen into the molten YBCO core. This leads to a phase separation due to a miscibility gap which occurs in the YBCO–SiO2 system. Due to this phase separation, silica-rich precipitations form upon quenching. XRD analyses reveal that the core of the vacuum as-drawn YBCO fiber is amorphous. Heat-treatments of the vacuum as-drawn fibers in the 800–1200 °C range show that cuprite crystallizes out of the amorphous matrix by 800 °C, followed by cristobalite by 900 °C. Heat-treatments at 1100 °C and 1200 °C lead to the formation of barium copper and yttrium barium silicates. These results provide a fundamental understanding of phase relations in the YBCO–SiO2 glass-clad system as well as indispensable insights covering general glass-clad fibers drawn using the molten-core approach.
1. Introduction
The molten-core approach is a common method for manufacturing long lengths of glass-clad fibers, wherein a core material, which cannot be drawn on its own, is molten inside a glass preform which is then softened and drawn into a glass-clad fiber using a fiber draw tower [1,2]. In this fiber drawing process, depending on the thermal expansion coefficient and melting point of the core material, different glass compositions can be used as cladding materials [3]. For core materials with high melting points, fused silica is typically the preferred cladding material.
In the molten-core approach, high temperatures are required during the drawing process in order to soften the glass. Under these conditions, the low viscosity of the molten core can lead to dissolution and diffusion based processes within the glass-clad molten core system causing challenges in controlling the chemical composition of the core during the drawing process, which alters the functionality of the drawn fiber [4,5,6,7,8,9,10]. In one of the first reported dissolution processes occurring during the fiber drawing process involving a silicon core glass fiber [4,11], oxygen was found inside the core, which led to optical loss. Because of the silicon core, the possibility of dissolution and diffusion of silicon from the glass cladding to the core could not be studied. When investigating other semiconductor core materials in glass-clad fiber manufacturing, as in [5,6,8], both silicon and oxygen were present inside the core. Although the studies in [5,6,8,9] reported the dissolution and diffusion based processes of the fused silica cladding into the molten core, in-depth analyses of these processes and of the potentially occurring phase separations were not performed. The first attempts to analyze the dissolution and diffusion based processes within glass-clad fibers in more depth were performed recently for YAG-derived yttrium aluminosilicate glass optical fibers in [12,13]. However, the significance of the oxygen diffusion from the cladding into the molten core, which is indispensable for analyzing the dissolution and diffusion based process in glass-clad fiber systems drawn using the molten-core approach, was not investigated in these works [12,13]. Hence, this highlights the need for further in-depth analyses of these dissolution and diffusion based reactions within glass-clad fibers.
Our previous work in [14] used the molten-core approach to draw YBa2Cu3O7−x (YBCO) into glass fibers, with the goal of studying the feasibility of obtaining superconductive YBCO glass fibers. Energy dispersive spectroscopy (EDS), X-ray photoelectron spectroscopy (XPS), and a cross-polarized light study revealed the occurrence of reactions between the YBCO core and the fused silica cladding in vacuum as-drawn fibers as well as after additional heat-treatments. In particular, from the study in [14], we determined that vacuum as-drawn YBCO glass fibers exhibit a core/cladding interface region, which contains silica-rich precipitations. Heat-treatment studies on the vacuum as-drawn fiber sections revealed, furthermore, the formation of cuprite and silica-rich co-precipitations at 900 °C. In addition, heat-treatments at higher temperatures showed the formation of yttrium-barium-rich and barium-copper-rich phases. Even though [14] presented important preliminary results on the reaction processes within YBCO glass-clad fibers, it did not perform an in-depth analysis of the occurring dissolution and diffusion based processes, as is carried out in the current work. Indeed, herein, we focus on identifying and analyzing the dissolution and diffusion based reactions within YBCO glass fibers and on defining the phase relations within the YBCO–SiO2 system. The performed analyses are based on novel quantitative results obtained using a combination of EDS analyses on an environmental scanning electron microscope (ESEM), X-ray diffraction (XRD) analyses, and Raman spectroscopy. The analyses performed consider as-drawn YBCO glass fibers drawn under vacuum and oxygen atmospheres. Furthermore, the core compositions of the as-drawn fibers were also analyzed after heat-treatments in air between 800 and 1200 °C.
2. Materials and Methods
A detailed description of the manufacturing process of YBCO glass fibers in vacuum is presented in our previous work in [14]. The drawing temperatures used were ~2000 °C. In the current work, in addition to the use of vacuum as the drawing atmosphere, YBCO glass-clad fibers were drawn under oxygen atmosphere. The manufacturing process under oxygen atmosphere is similar to that used in [14], with the exception of introducing industrial grade oxygen at 5 psi into the preform.
Heat-treatments were conducted on vacuum as-drawn YBCO fiber sections in air at 800 °C to 1200 °C with heating and cooling rates of 5 °C/min−1 and a dwelling time of 10 min using a standard tube furnace (MTI Corporation Model GSL−1100X), and a muffle furnace (Barnstead Type 1500) for the 1200 °C heat-treatment.
EDS line-scans at 2 µm increments were performed on polished cross-sections of the fibers at an accelerating voltage of 20 kV using an ESEM (FEI Quanta 600 FEG) with an attached energy dispersive X-ray spectrometer (Bruker QUANTAX 400) equipped with a high speed silicon drift detector.
XRD analyses were performed on YBCO core fragments using a single-crystal X-ray diffractometer (Rigaku XtaLAB Synergy-S) operating in Debye Scherrer geometry using Cu-Kα radiation and equipped with a HyPix–6000 HE area detector. Sample preparation consisted of embedding fiber fragments in Paratone oil and then shattering the fiber to allow for retrieval of glass-free core fragments of dimensions 20–100 µm. Each fragment was analyzed by mounting it on a Nylon loop and collecting a series of 360° phi-scans over a period of 27 min. The program CrysAlisPro [15] was used for data collection and to extract the powder pattern from the raw images. The XRD software HighScore Plus was used for data analysis and phase identification.
Raman spectroscopy analyses were performed on the YBCO cores using an unpolarized confocal Raman microscope (WITec alpha–300-SR). In this regard, the Raman measurements were performed on selected polished fiber cross-sections using a continuous wavelength laser beam of 532 nm focused with a 50 × objective to a spot size of ~2.5 µm. The reflected light was filtered by a long-pass filter (cut-off: 535 nm) before entering the electron-multiplying CCD spectroscopy detector (Andor Newton DU970). The exposure time was 1 s.
3. Results and Discussion
In order to provide an in-depth characterization and analysis of the dissolution and diffusion based reactions of fused silica and the molten YBCO core, we first focus on as-drawn YBCO glass fibers, drawn under vacuum and oxygen atmospheres, and then analyze the results of subsequent heat-treatments.
3.1. Results and Characterization of As-Drawn YBCO Glass Fibers
3.1.1. Vacuum As-Drawn YBCO Glass Fibers
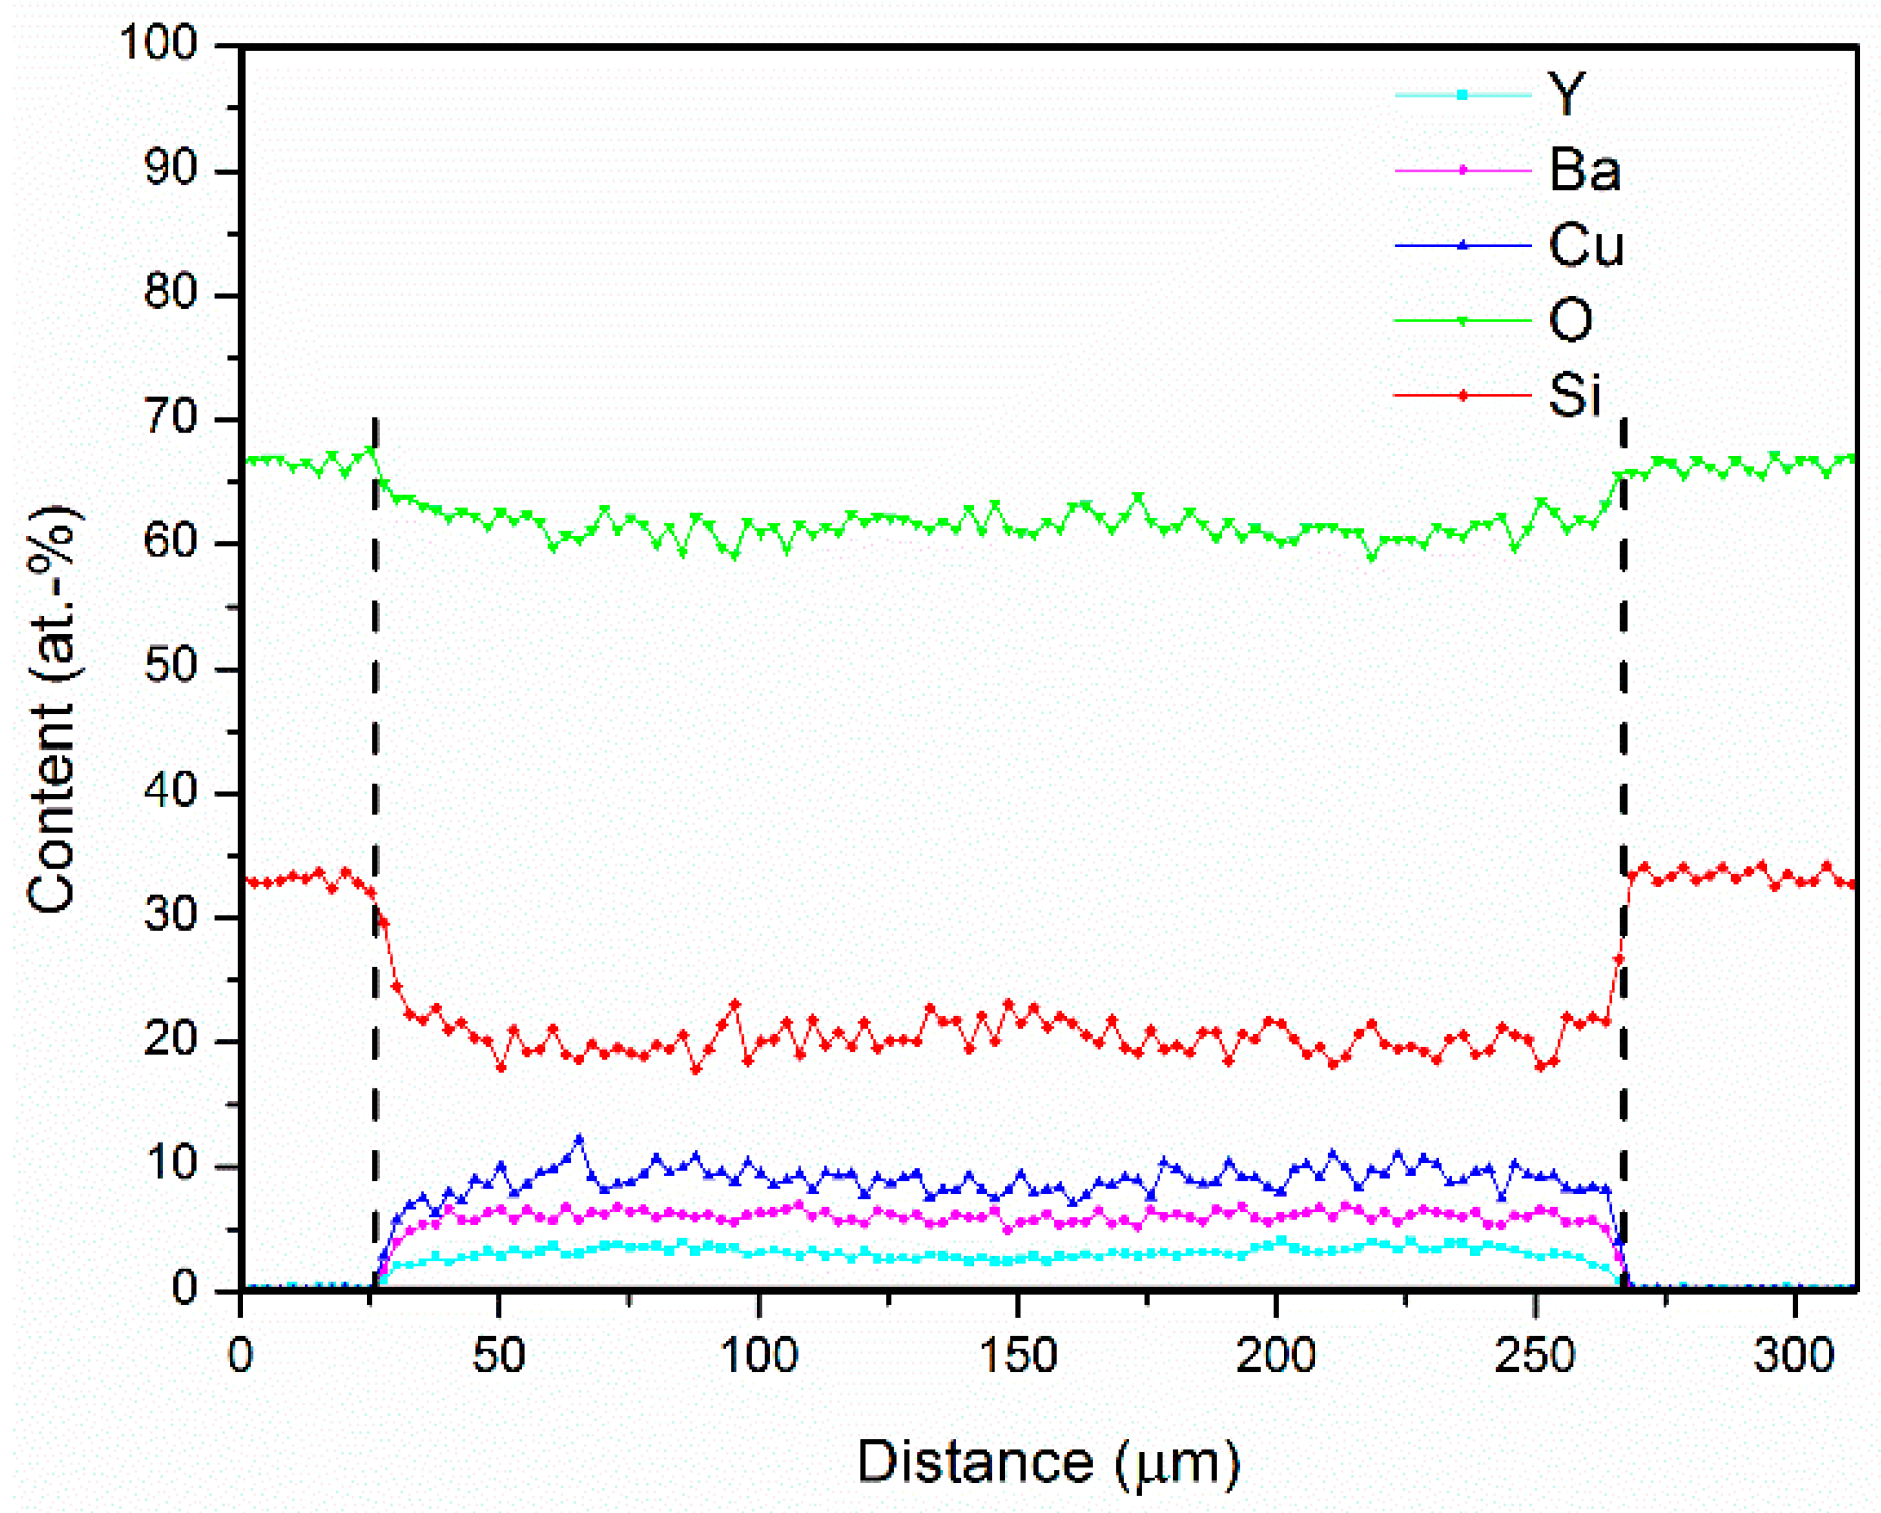
Using the fiber drawing method described in [14], continuous round-shaped and dense YBCO core fiber sections were successfully drawn. The EDS line-scan across the polished cross-section of the as-drawn YBCO glass fiber with a core diameter of 115 µm is shown in Figure 1.
The EDS line-scan shown in Figure 1 starts in the fused silica cladding at the expected Si:O (1:2) ratio, with no Y, Ba, or Cu presence. The cladding-core interface starts at ~12 μm. Between ~12 and 20 μm, the silicon and oxygen content gradually decreases, with concomitant increase in the Y, Ba, and Cu content until the composition flattens and remains steady across the core region until the same concentration gradients are again observed at the opposite core/cladding interface. This indicates the occurrence of silicon diffusion from the fused silica cladding into the interface region within the YBCO core, which was also predicted in [14]. The steady silicon concentration in the core can be attributed to a restricted oxygen diffusion, allowing for silicon to build up and limiting further silicon diffusion.
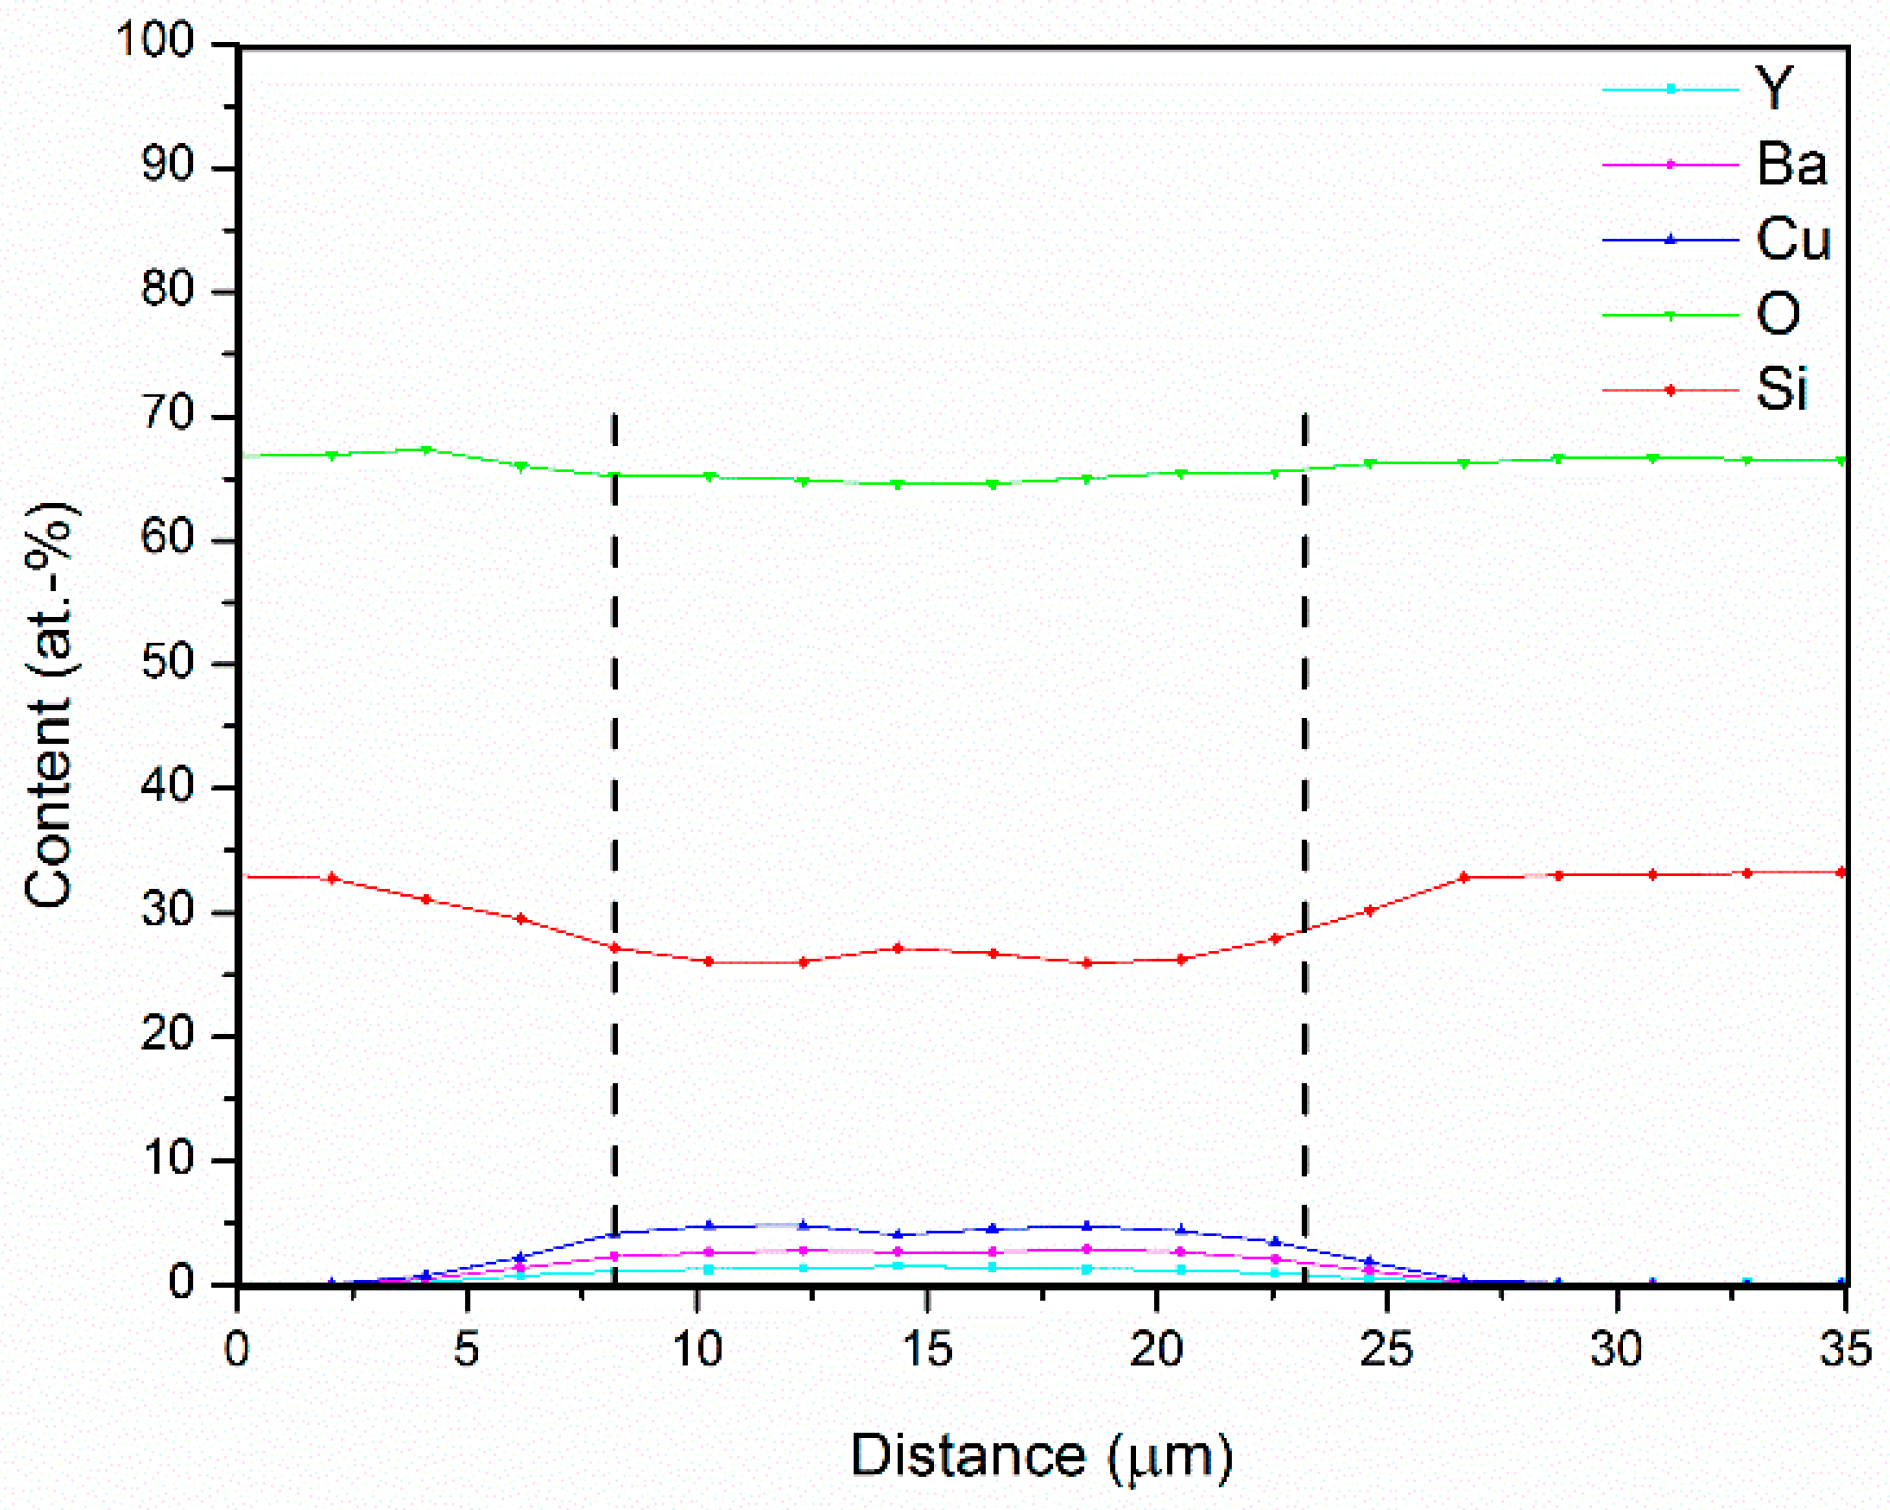
EDS line-scans taken from a larger YBCO glass fiber diameter core (237 µm) and a smaller diameter core (15 µm) are shown in Figure 2 and Figure 3, respectively.
Table 1 shows the average silicon content inside the core for the three different core diameters. The results in Table 1 show that for a larger core diameter of 115 µm and 237 µm, the steady concentration profile of the silicon content inside the core is ~20 at.-%. In addition, both the EDS line-scans in Figure 1 and Figure 2 present a significant diffusion-based concentration gradient at the interface region between the cladding and the core. For the smaller core diameter of 15 µm, the EDS line-scan in Figure 3 shows only a minor concentration gradient at the interface region with a much higher silicon content of 27.6 ± 1.2 at.-% compared to the larger core diameter fibers. This indicates that a solubility limit of the silicon diffusion inside the molten YBCO core exists. The higher silicon and oxygen contents of the smaller diameter core further corroborate the role of the restricted oxygen diffusion in limiting the diffusion of silicon. Moreover, Table 1 and the EDS line-scans shown in Figure 1, Figure 2 and Figure 3 demonstrate that the reactions occurring between the fused silica cladding and the YBCO core are diffusion-controlled.
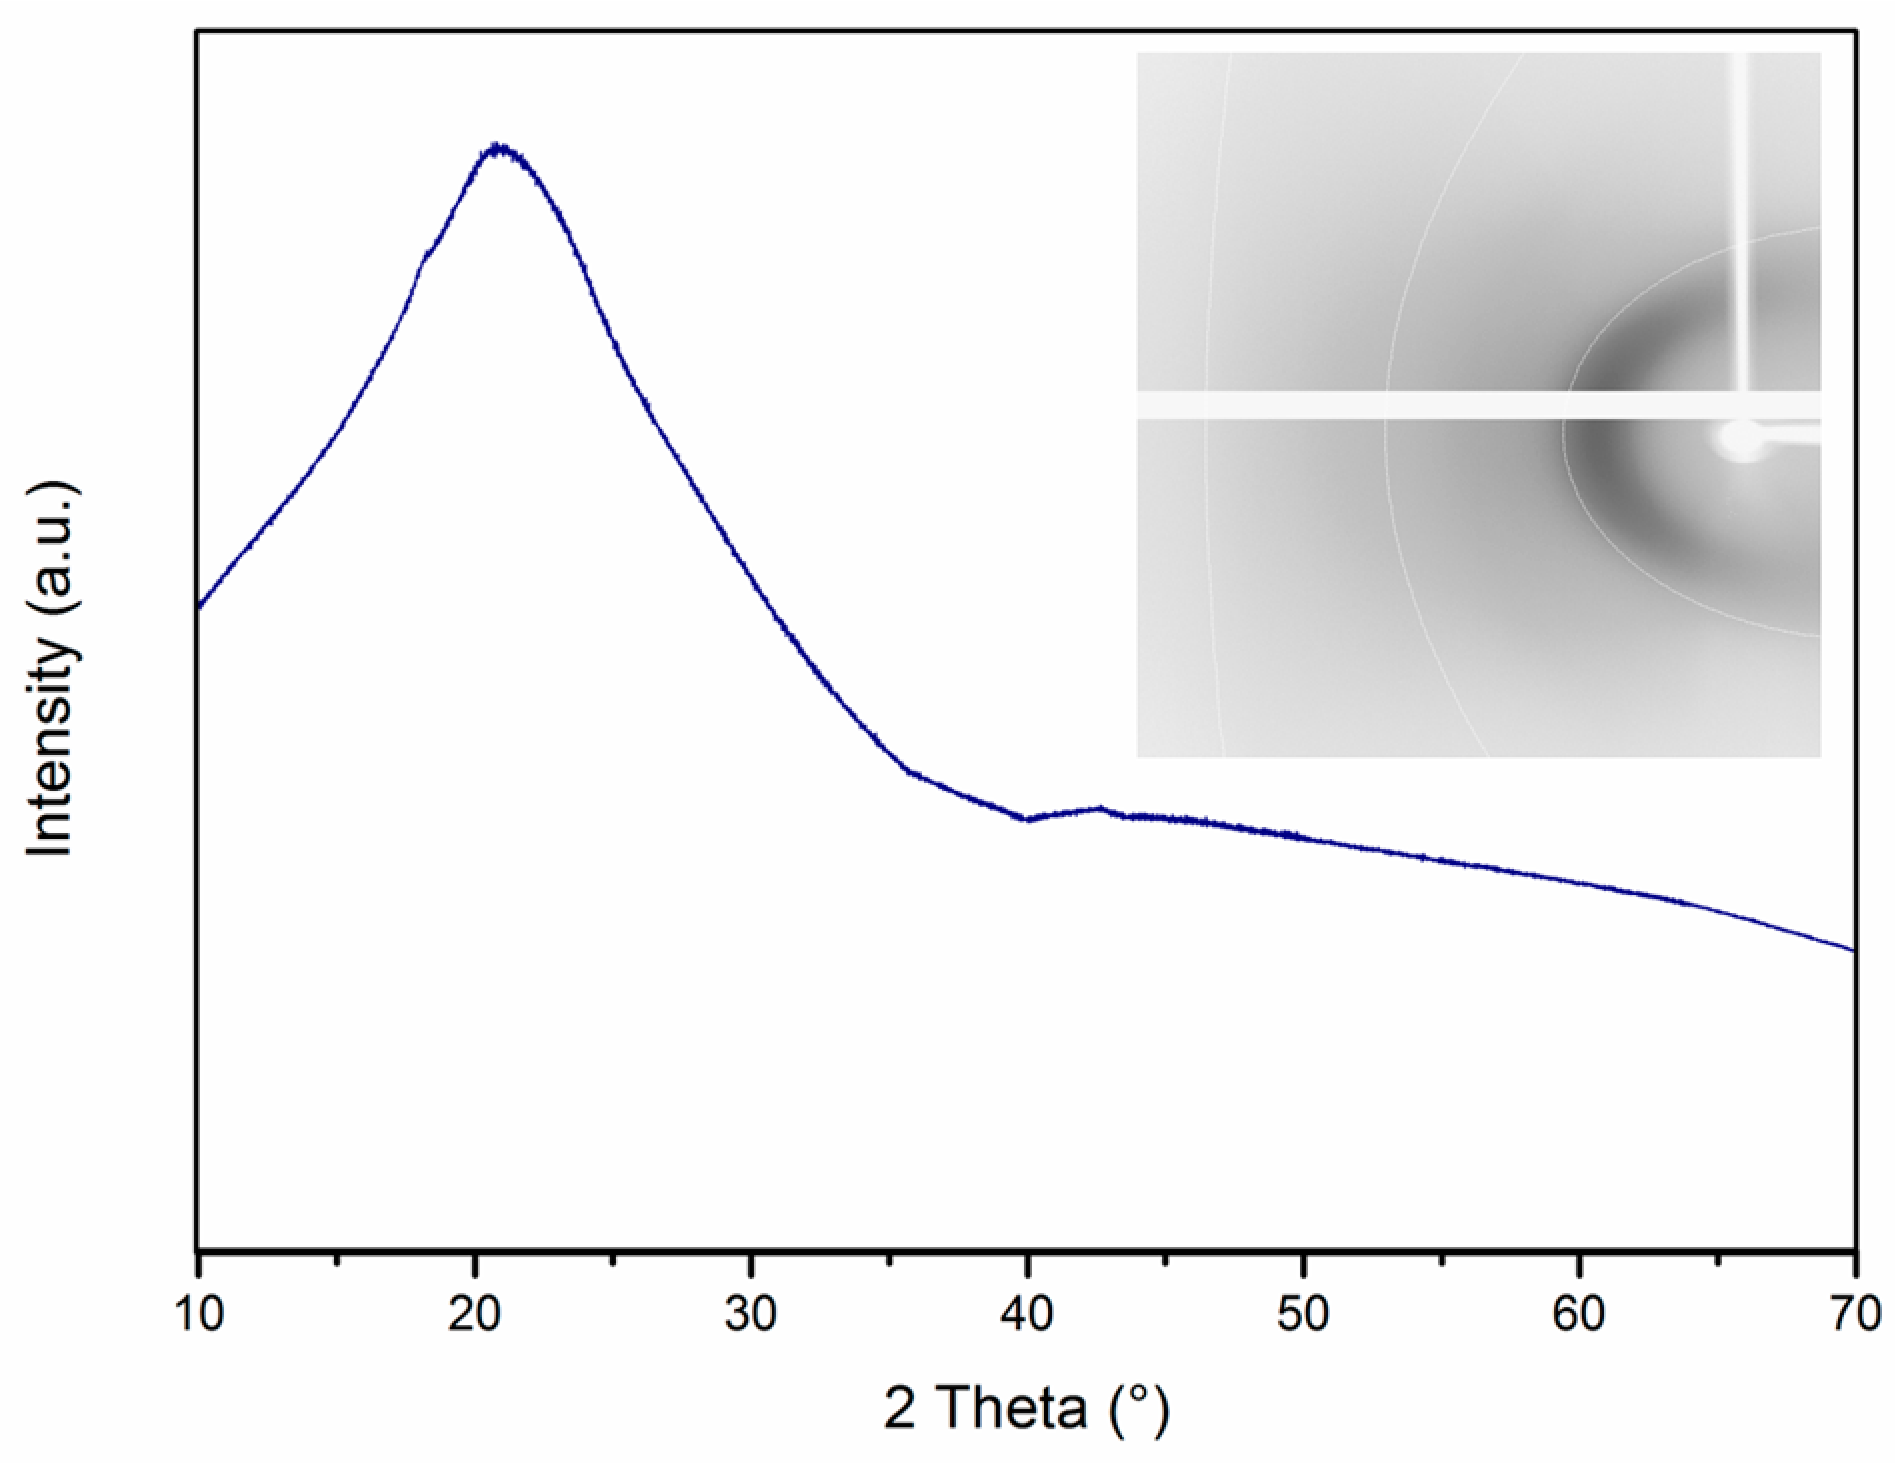
In order to determine the phases present inside the vacuum as-drawn YBCO core, XRD analysis was performed on vacuum as-drawn YBCO fiber core fragments. A resulting XRD pattern can be seen in Figure 4.
As can be seen from the XRD pattern in Figure 4, the core exhibits an amorphous/glassy character. In fact, given the high silicon content inside the core, which forms silicates [14], and the formation of silica-rich precipitations inside the core, which were reported in [14] and will be further discussed in Section 3.1.2, the silica inside the core acts as a glass former leading to the amorphous/glassy phase. In addition, the silica content inside the core favors the melting of Y2O3 at lower temperatures by forming lower eutectics, as shown in [16]. These reasons result in the formation of the amorphous YBCO–SiO2 glass phase.
The high silicon content inside the as-drawn YBCO core is not only a result of a diffusion based process but originates from a dissolution based process between the molten YBCO core and the fused silica cladding. During the drawing process, the molten YBCO core causes the formation of lower eutectics between fused silica and Y2O3 [16], as well as between fused silica and the barium- and copper-rich liquid phases [17,18]. Fused silica can be attacked by glass modifiers inside the molten core at its dangling bonds and bridging-oxygen bonds. Thus, with an increasing content of glass modifiers, the softening point of the fused silica decreases which reduces its viscosity and promotes the dissolution process. The barium oxide, copper oxide as well as yttrium oxide contained in the core are all glass modifiers. Hence, these processes lead to the dissolution of the fused silica and the diffusion of silicon and oxygen into the molten YBCO core. This, indeed, explains the EDS line-scan profiles of the as-drawn YBCO cores shown in Figure 1, Figure 2 and Figure 3. In the dissolution region, the viscosity is higher than the viscosity of the molten-core region, which leads to the diffusion-based concentration gradient shown in Figure 1 and Figure 2. This concentration gradient is, furthermore, caused by the rate-limiting oxygen diffusion through the dissolution region.
In the molten core region, the ions readily mix to give the steady concentration profile observed in the EDS line-scans of the as-drawn YBCO cores shown in Figure 1 and Figure 2. This is due to their higher diffusivity in the liquid state and to the possibility of the occurrence of convection inside the molten core that is induced by a thermal gradient during the drawing process. In addition, due to the dissolution of the fused silica, no out-diffusion of the core material was observed as the interface moved outwards with the dissolution of the fused silica cladding.
3.1.2. Oxygen As-Drawn YBCO Glass Fibers
In order to investigate the effect of the oxygen diffusion, we analyzed YBCO glass fibers which were drawn in an oxygen atmosphere.
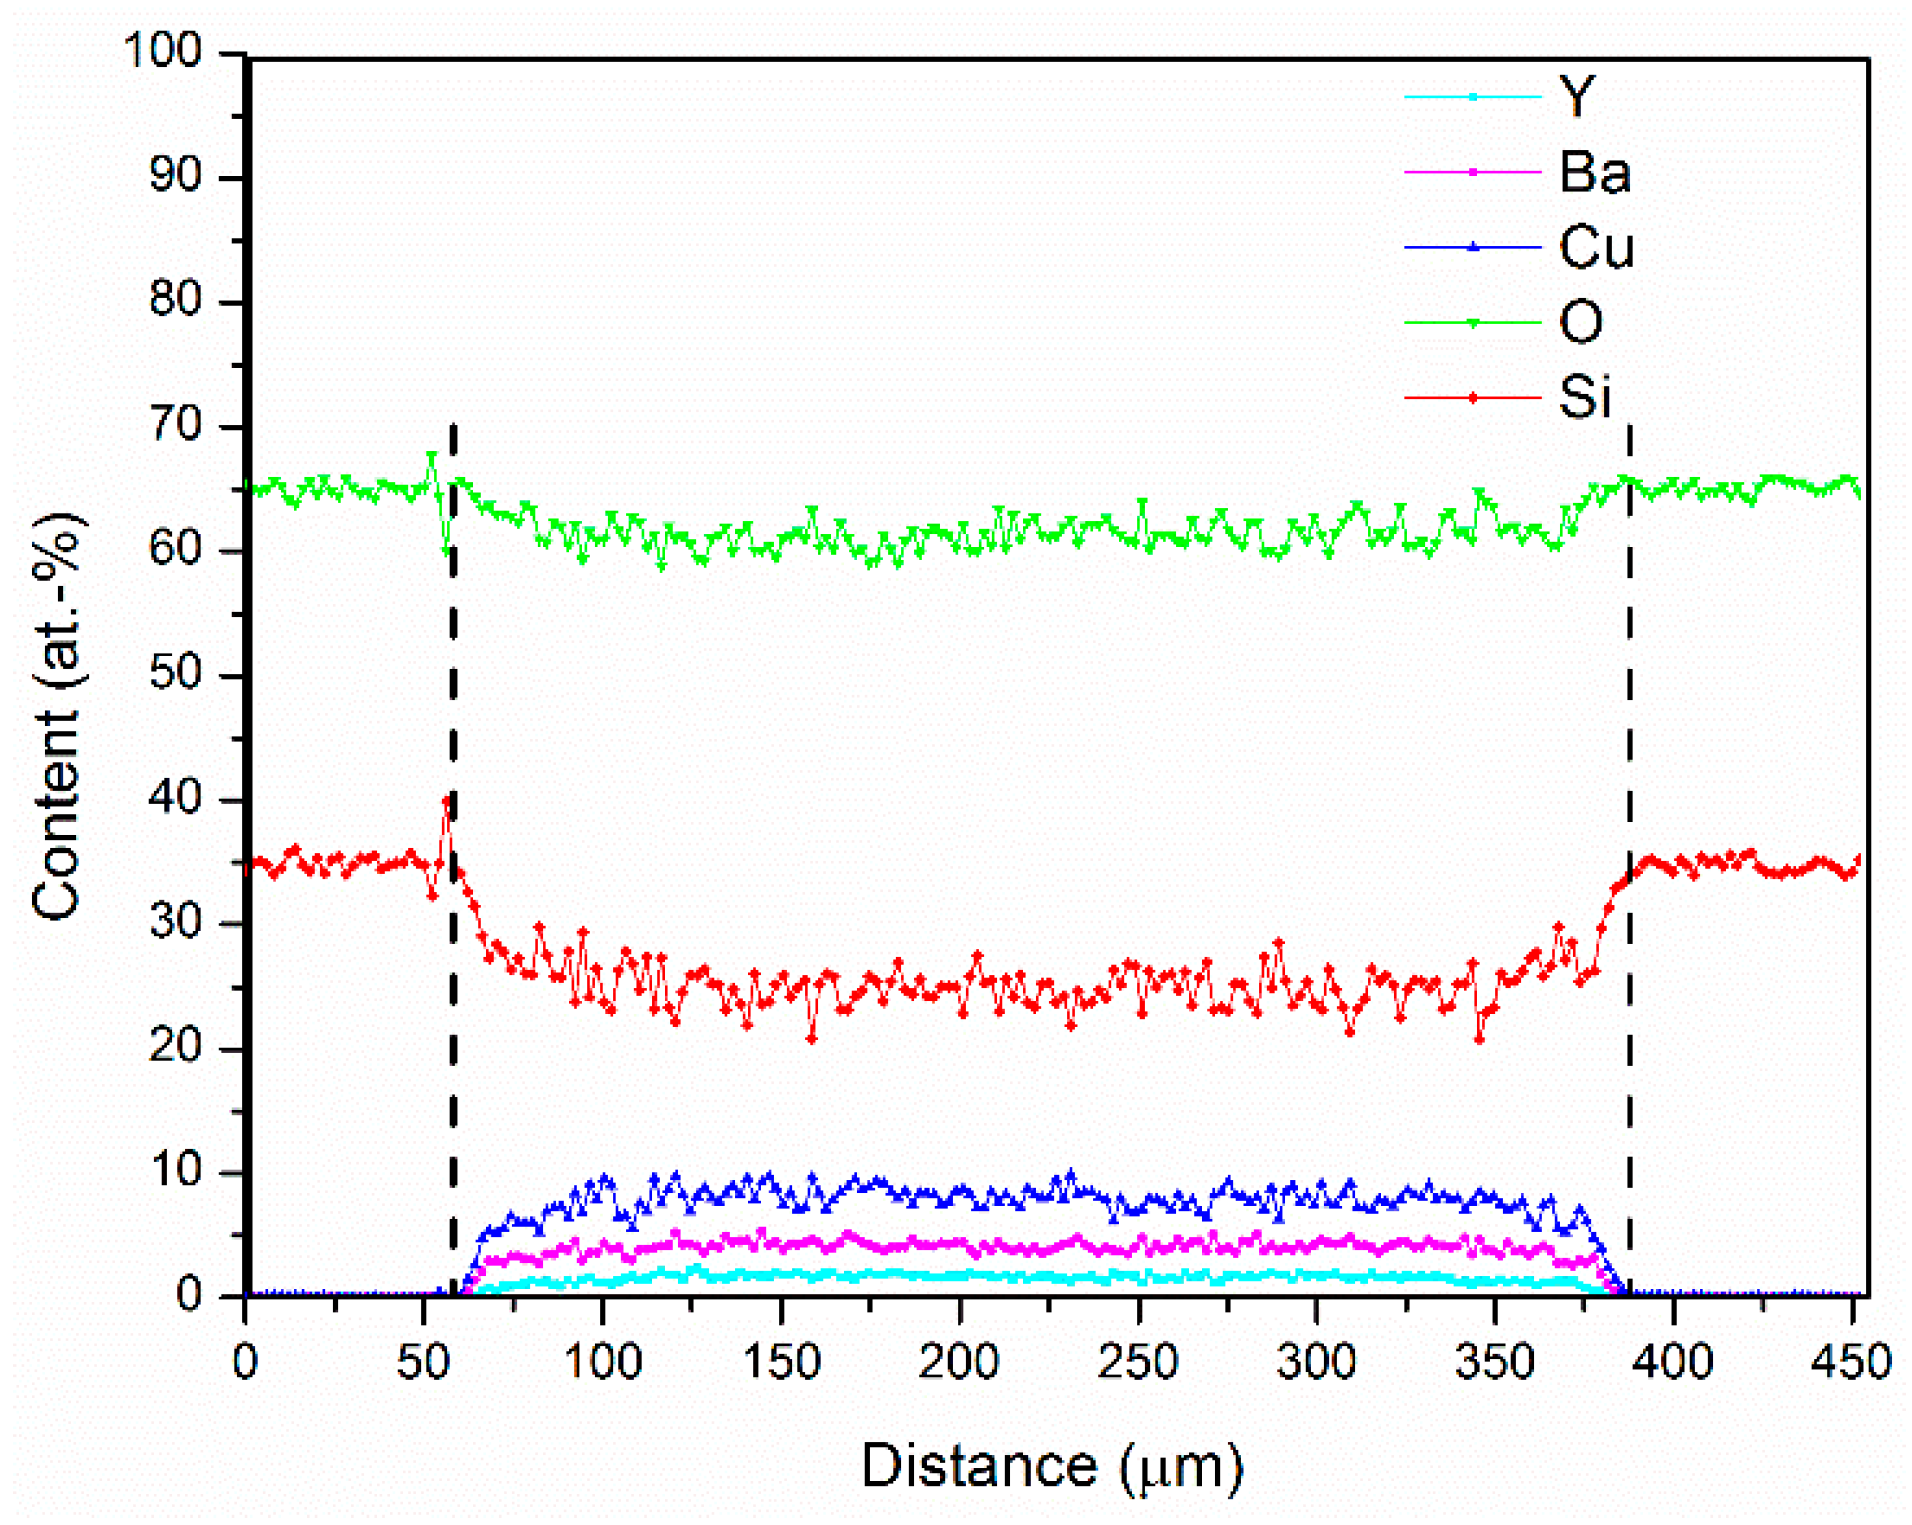
The EDS line-scan of an oxygen-rich as-drawn YBCO fiber cross-section is shown in Figure 5.
Compared to the EDS line-scans of the fibers drawn under vacuum (Figure 1 and Figure 2), the line-scan of a fiber drawn under oxygen atmosphere (Figure 5) shows significantly higher silicon and oxygen content inside the core. Moreover, the higher oxygen content increases the overall silicon diffusion rate inside the YBCO core, as further shown in Table 2, which presents the variation in silicon and oxygen contents depending on the drawing atmosphere and the region of the core. Thus, these results indicate that oxygen is the rate-limiting step in the co-diffusion of silicon and oxygen inside the molten YBCO core, which further corroborates the conclusion drawn in Section 3.1.1.
We note that the fiber drawn in oxygen-rich environment was fabricated under the same drawing conditions as the fibers drawn in vacuum. In this way, we are able to confirm that the considerable dimensional variations in the core diameters of the as-drawn fibers in vacuum and oxygen atmosphere are caused by the different induced pressures. Moreover, given the larger core diameter of the oxygen drawn fiber, a lower diffusion-induced silicon content inside the core region should have been expected due to the longer diffusion pathway as discussed in [8,12,13]. As this was not the case (i.e., the silicon content in the oxygen drawn fiber core is higher than the silicon content of the vacuum fiber core, as shown in Table 2), this indicates that the higher silicon content measured in the oxygen drawn fiber core actually originates from the oxygen-rich drawing environment.
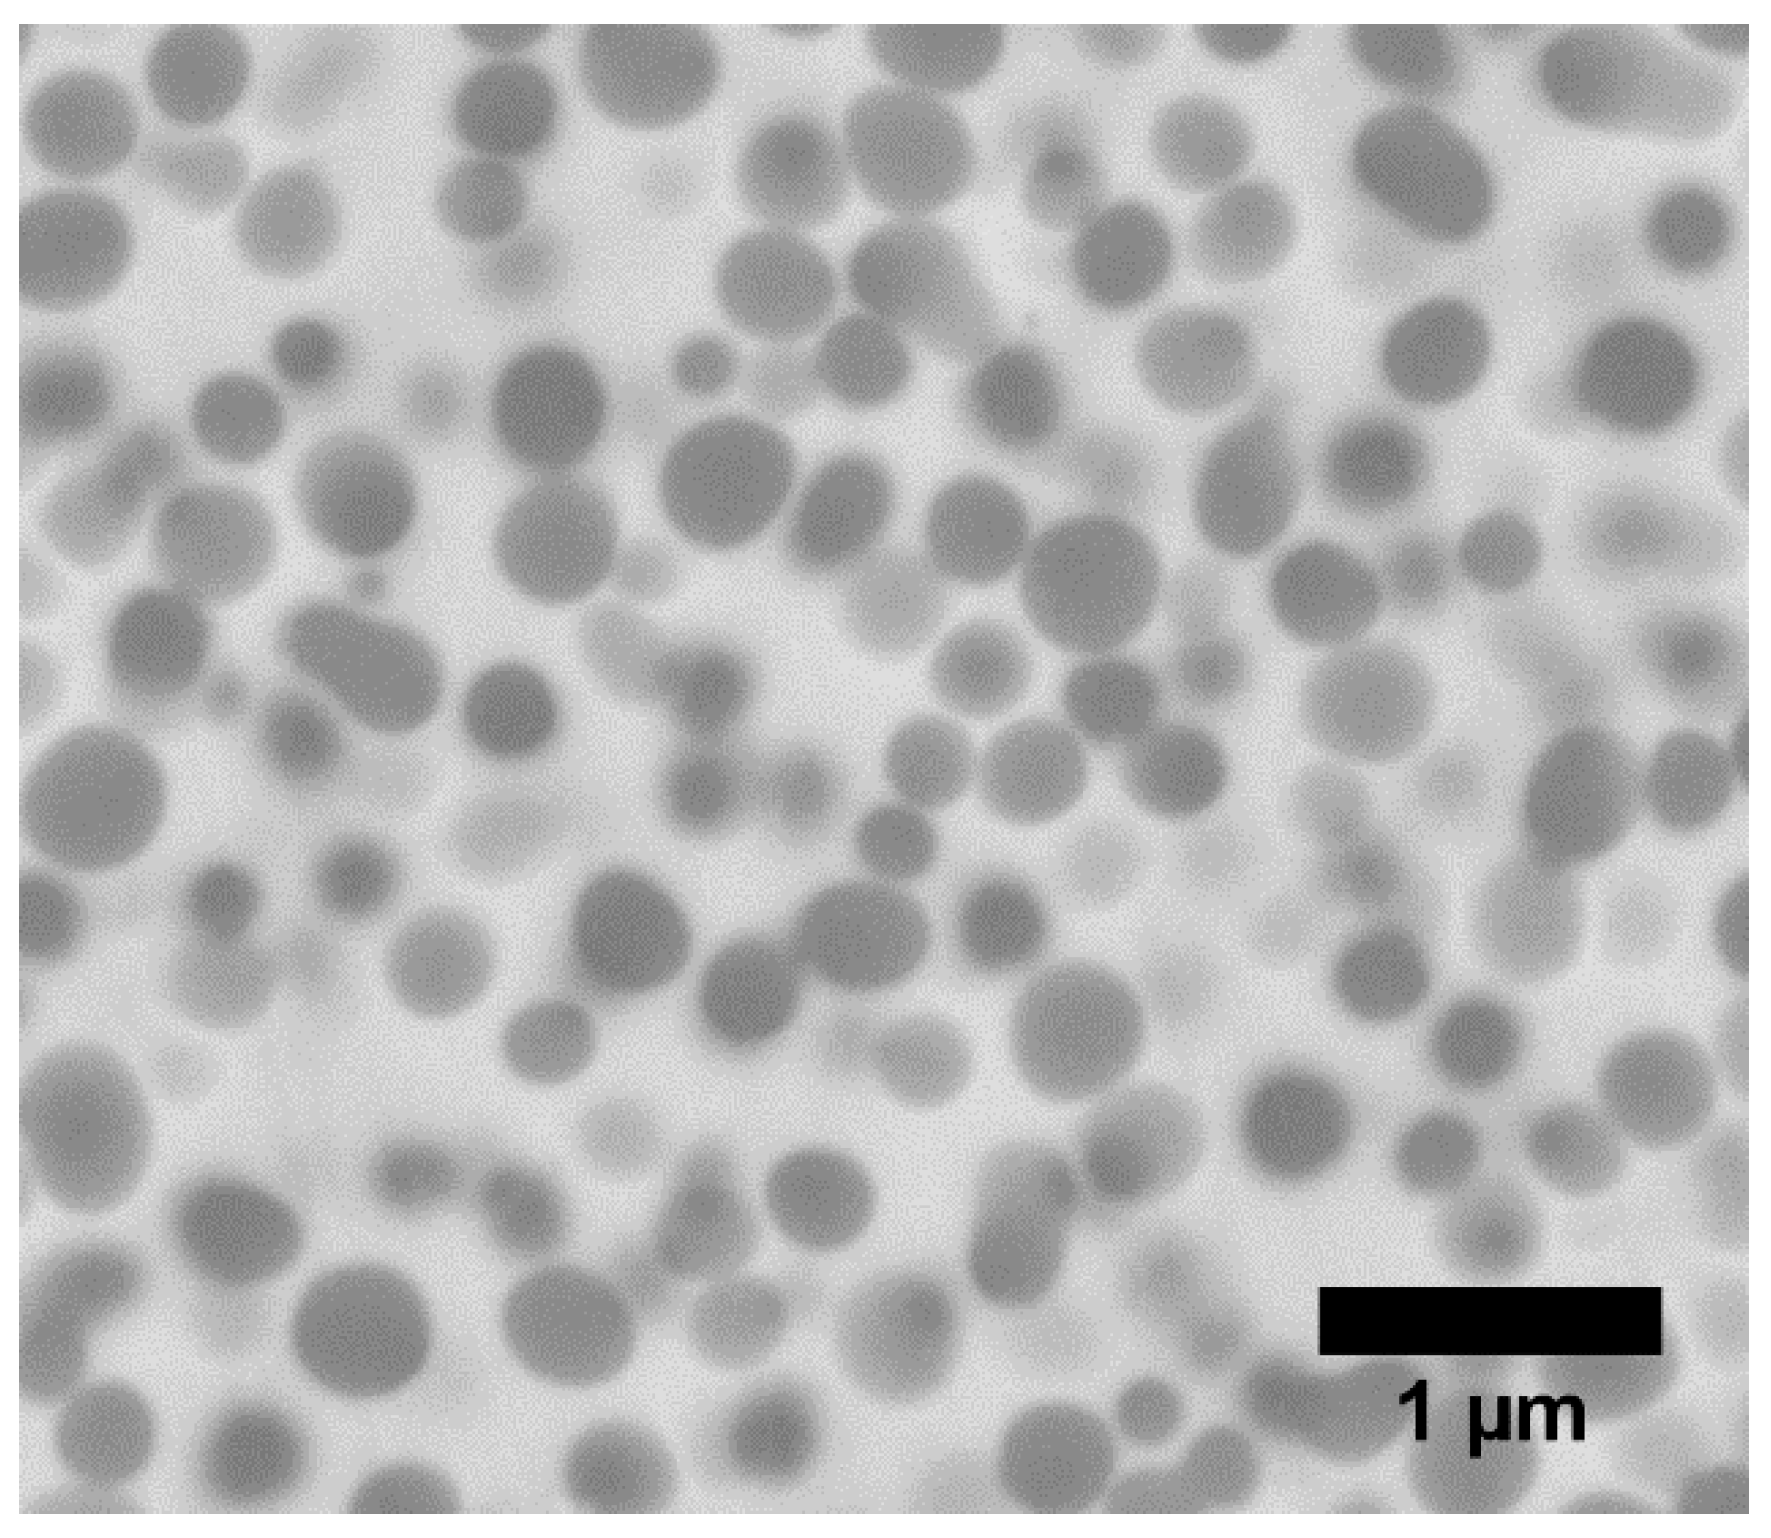
In order to analyze the morphology of the YBCO core, a high-resolution backscattered electron (BSE) image of the center of the core was obtained and is shown in Figure 6.
The BSE image in Figure 6 reveals the formation of round precipitations across the entire core for the oxygen drawn fibers. In contrast, our previous work on vacuum as-drawn fibers [14] showed silica-rich precipitation formations at the interface layer but not across the entire core. This precipitation formation across the entire core in the oxygen drawn fibers stems from the excess of oxygen, which enables the increase in diffusion of both silicon and oxygen into the molten core. This is further addressed in Section 3.1.3.
The morphology and BSE contrast of the precipitations in the oxygen as-drawn core are similar to the morphology and BSE contrast of the silica-rich precipitations reported in our previous work [14] on vacuum as-drawn YBCO fibers, which uses the same material system and similar processing conditions. Moreover, our observations in the two analyses show that the reaction mechanisms at elevated temperatures are similar for vacuum and oxygen as-drawn fibers. This indicates that for the oxygen as-drawn fibers, the round precipitations are also silica-rich. Due to the spatial resolution limit of the EDS measurements, EDS point analysis of the round precipitations was not performed for the oxygen as-drawn fibers.
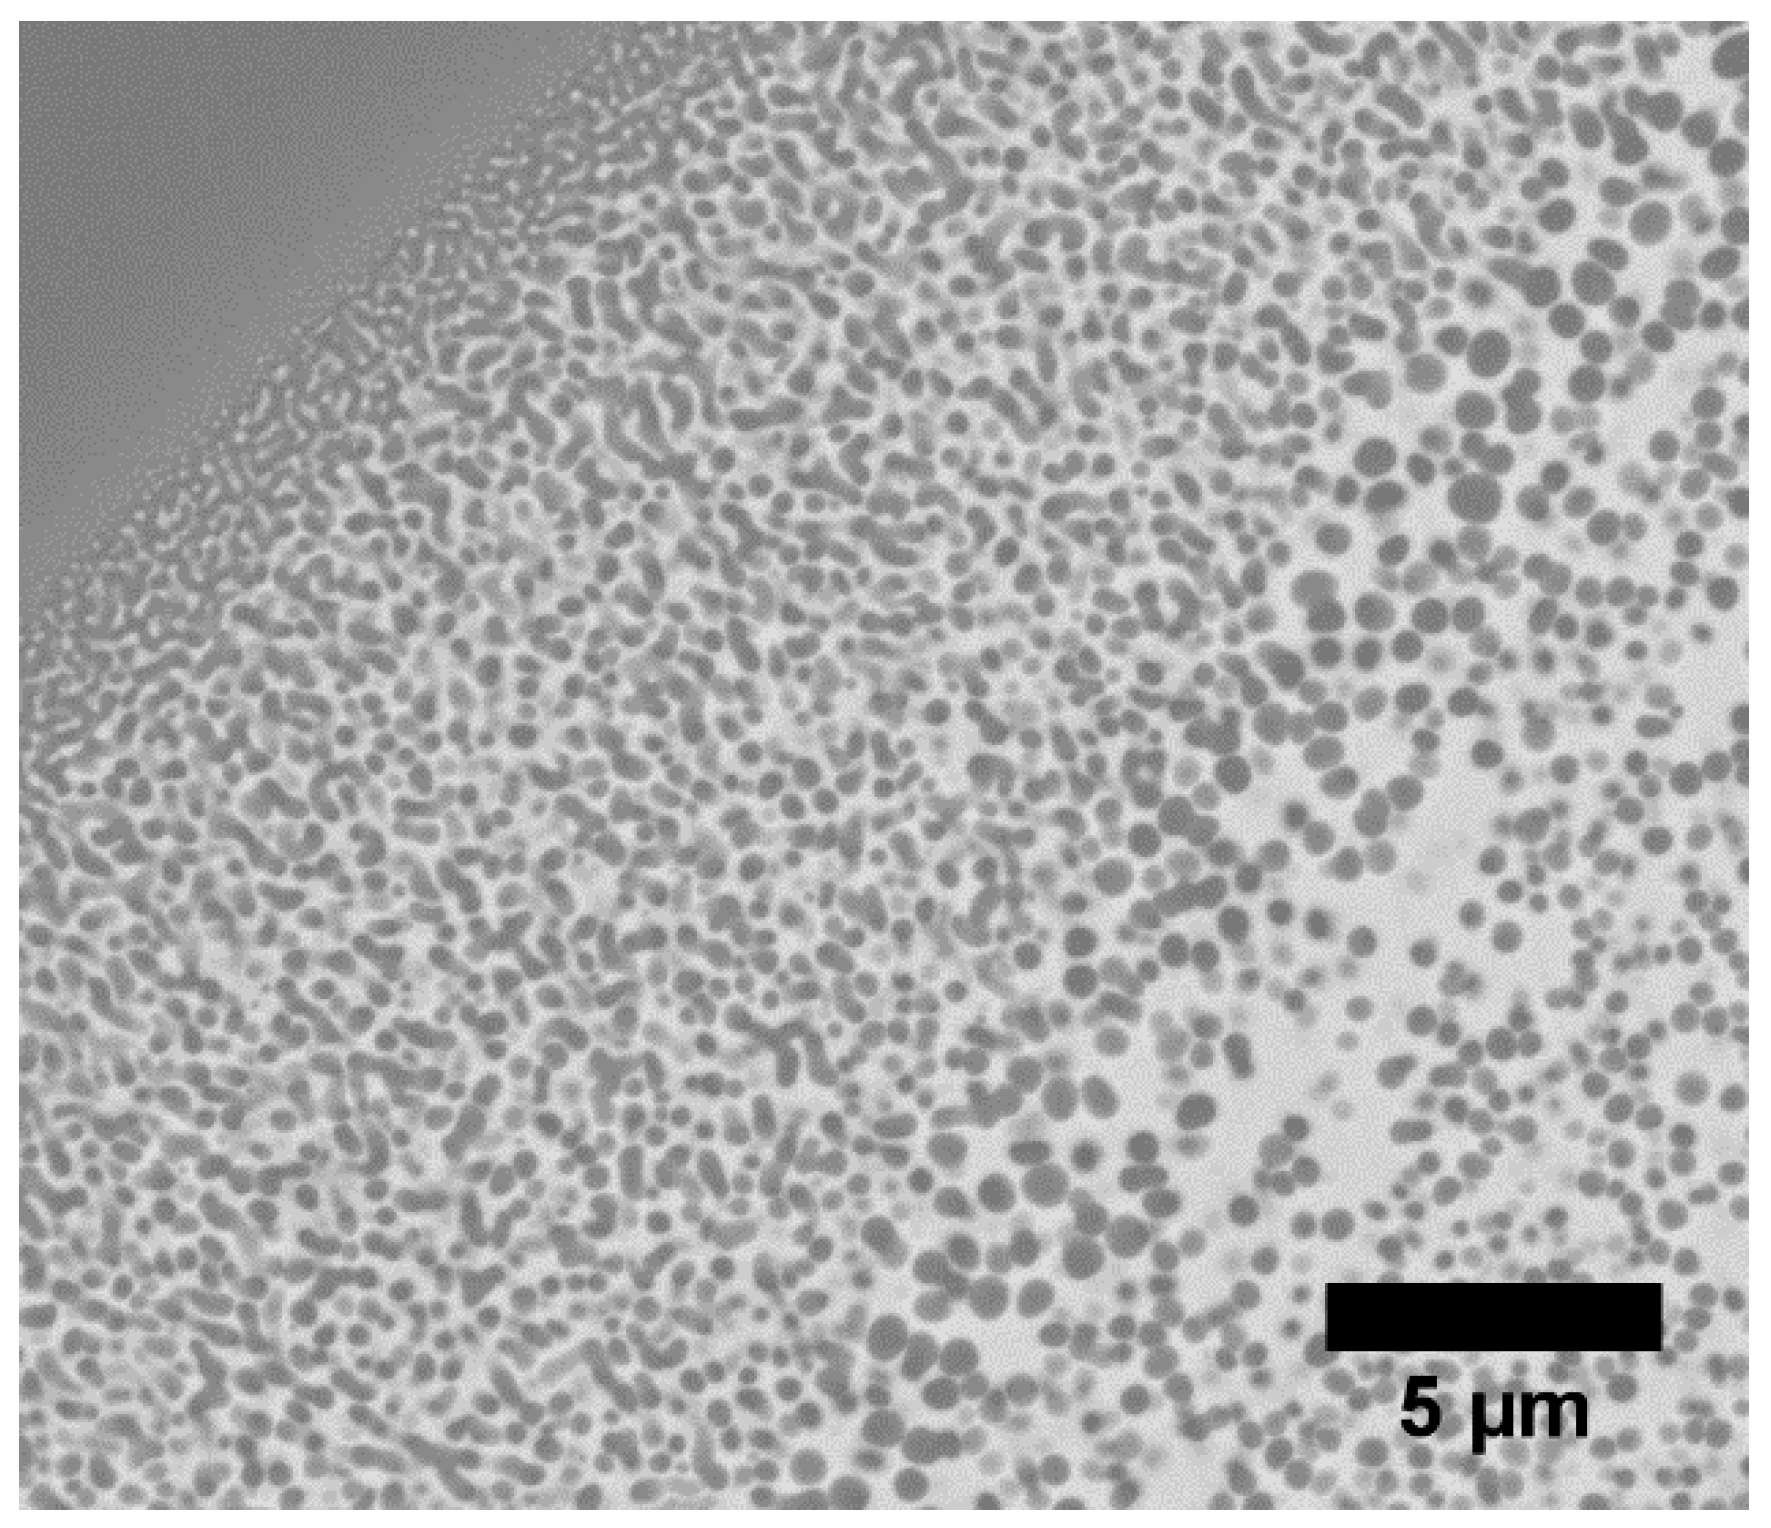
Figure 7 shows a BSE image of the interface region of an oxygen as-drawn YBCO glass fiber. The fiber core shows a spinodal-like phase separation morphology at the interface region.
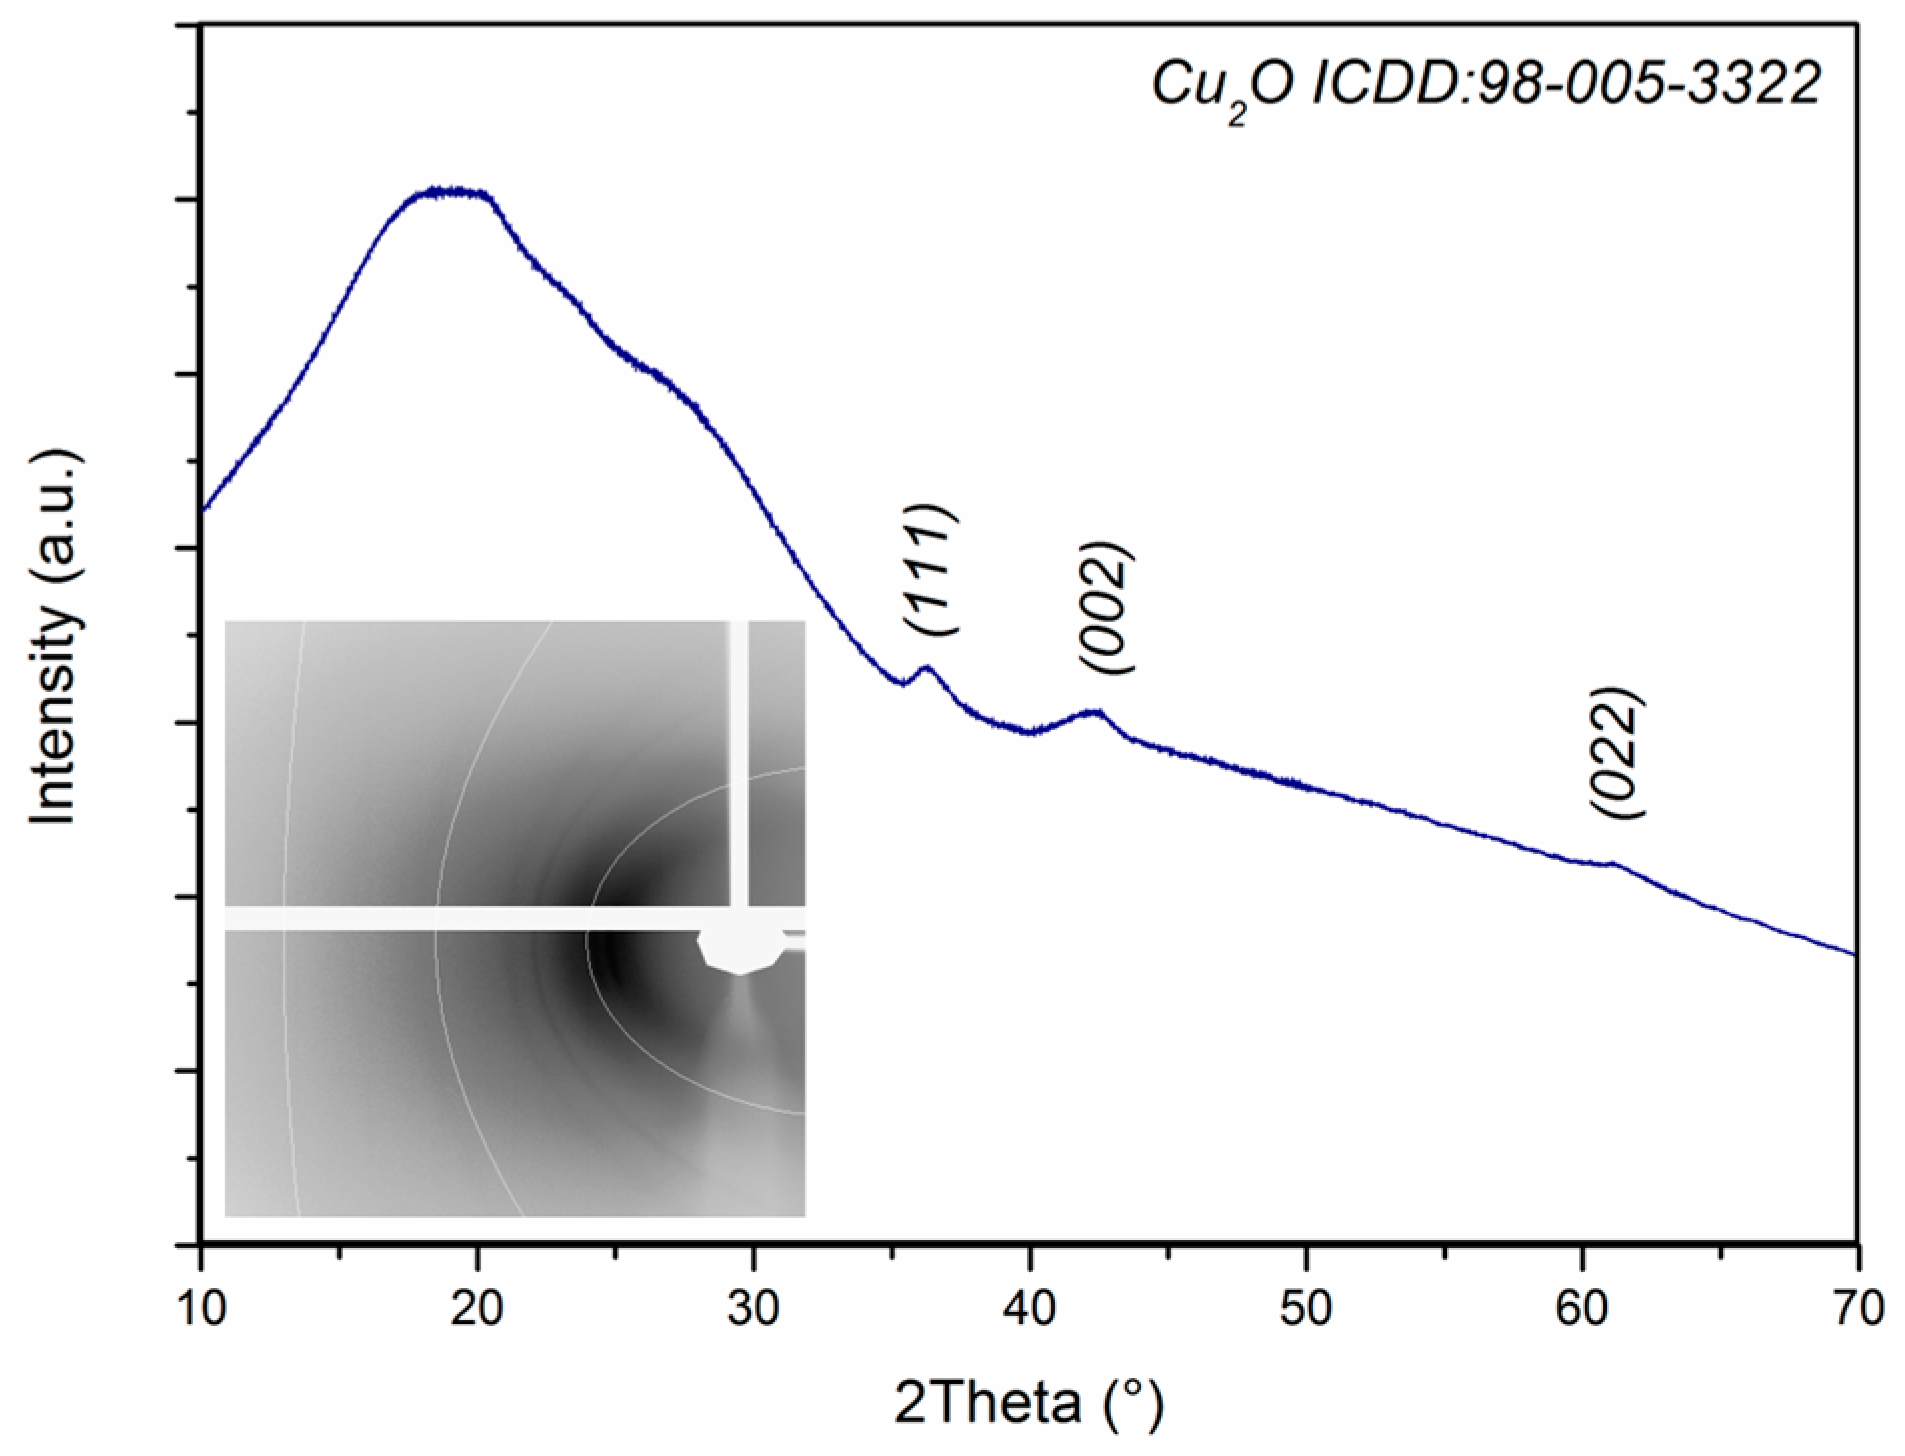
In order to analyze the core composition, XRD analysis was performed and the corresponding XRD pattern is shown in Figure 8.
The XRD powder pattern in Figure 8 indicates that the oxygen as-drawn YBCO core is mainly amorphous with minor quantities of crystalline cuprite, implying the silica-rich precipitations inside the core are amorphous. We note that the silica-rich precipitations have a particle size of around 200–300 nm, i.e., of sufficient size to preclude the possibility of the particles being crystalline, but unobserved due to particle size line-broadening.
3.1.3. Phase Separation Analysis of As-Drawn YBCO Glass Fibers
The formation of silica-rich precipitations has been observed previously in glass-forming systems and is explained in terms of the existence of a miscibility gap [19,20,21,22,23,24]. The literature shows that the formation of silica-rich precipitations is attributed to a liquid-liquid phase separation mechanism in silicate melts as the temperature cools. However, the dominant phase separation mechanism (spinodal phase separation versus nucleation and growth) can be difficult to identify [19,20,21,22,23,24]. Miscibility gaps are reported for the CuO–SiO2 system [25], the BaO–SiO2 [20,21,22] and the Y2O3–SiO2 [26,27] system, but no in-depth phase and morphology studies were performed for the CuO–SiO2 and Y2O3–SiO2 system. Moreover, no ternary or quaternary phase and morphology studies are reported for the Y2O3–BaO–Cu2O–SiO2 system. For the soda–lime–silica glass system [19,28], the oxygen diffusion is reported to be the rate controlling factor in the phase separation process, which corroborates the conclusion that oxygen increases the silica-rich precipitation formation.
Table 3 illustrates the morphology change of the cores of the vacuum and oxygen as-drawn YBCO glass fibers with respect to the change in silica content in the core. The first column of Table 3 shows that the center of the core of the vacuum drawn fiber contains no silica-rich precipitations, which implies that the composition lies outside of the miscibility gap. Column 2 shows precipitations at the interface region of the vacuum as-drawn fibers, which implies that its composition lies within the binodal curve. Columns 3–5 illustrate the precipitation formation with respect to the silica concentration for the oxygen drawn fiber over the center region of the core, at the interface region and at the interface edge towards the cladding, respectively. In all three cases, the composition lies within the binodal curve. Based on the results in Table 3, the occurrence of a miscibility gap for the Y2O3–BaO–Cu2O–SiO2 system, which exists for temperatures above the lower eutectic temperature of the Y2O3–SiO2 system of around 1660 °C [29], can be concluded. This emphasizes that the silica-rich precipitation formation occurs when the composition lies inside the metastable binodal curve. The kinetic mechanism of the formation of those silica-rich precipitations stems from a nucleation and growth process. In fact, the silica-rich precipitations are not likely to result from spinodal phase separation due to their small scale. The spinodal phase separation morphology at the core/cladding interface, as it is shown for the oxygen drawn fiber section in the two rightmost columns of Table 3, can be due to entering an unstable spinodal region inside the miscibility gap or caused by a coalescence of the spherical silica-rich precipitations as part of a nucleation and growth process.
Attempts to analyze the nucleation and growth process were not successful due to the occurrence of crystallization processes, which will be further discussed in Section 3.2. The crystallization occurs at the interface between the silica-rich precipitations and the amorphous silicate matrix phase, which is energetically favorable due to the lower energy barrier at the interface region. This crystallization at the interface region is shown through the formation of the so-called co-precipitations, which were identified in our previous work in [14]. This explains why the oxygen as-drawn YBCO fibers show cuprite inside the core, as shown in Figure 8, while the vacuum as-drawn YBCO fibers have an amorphous core. As such, the increased formation of new interfaces with the increase in the number of silica-rich precipitations inside the oxygen as-drawn YBCO fiber core promotes the recrystallization of the cuprite phase upon quenching.
Overall, these results are the first to show the occurrence of a phase separation mechanism in the YBCO–SiO2 system, and the first to demonstrate the change in morphology depending on the silica content inside the core.
3.2. Results and Characterization of Heat-Treated Vacuum As-Drawn YBCO Glass Fibers
In order to investigate the possibility of restoring the superconductive YBCO phase and further analyze the reactions within YBCO glass fibers, heat-treatment studies on as-drawn YBCO fiber sections were performed at elevated temperatures in air atmosphere. ESEM analyses and a cross-polarized light study on the heat-treated fiber sections were discussed in our previous work in [14]. Here, we focus on analyzing the heat-treated as-drawn YBCO glass fiber cores using XRD analysis and Raman spectroscopy to perform a more comprehensive quantitative analysis.
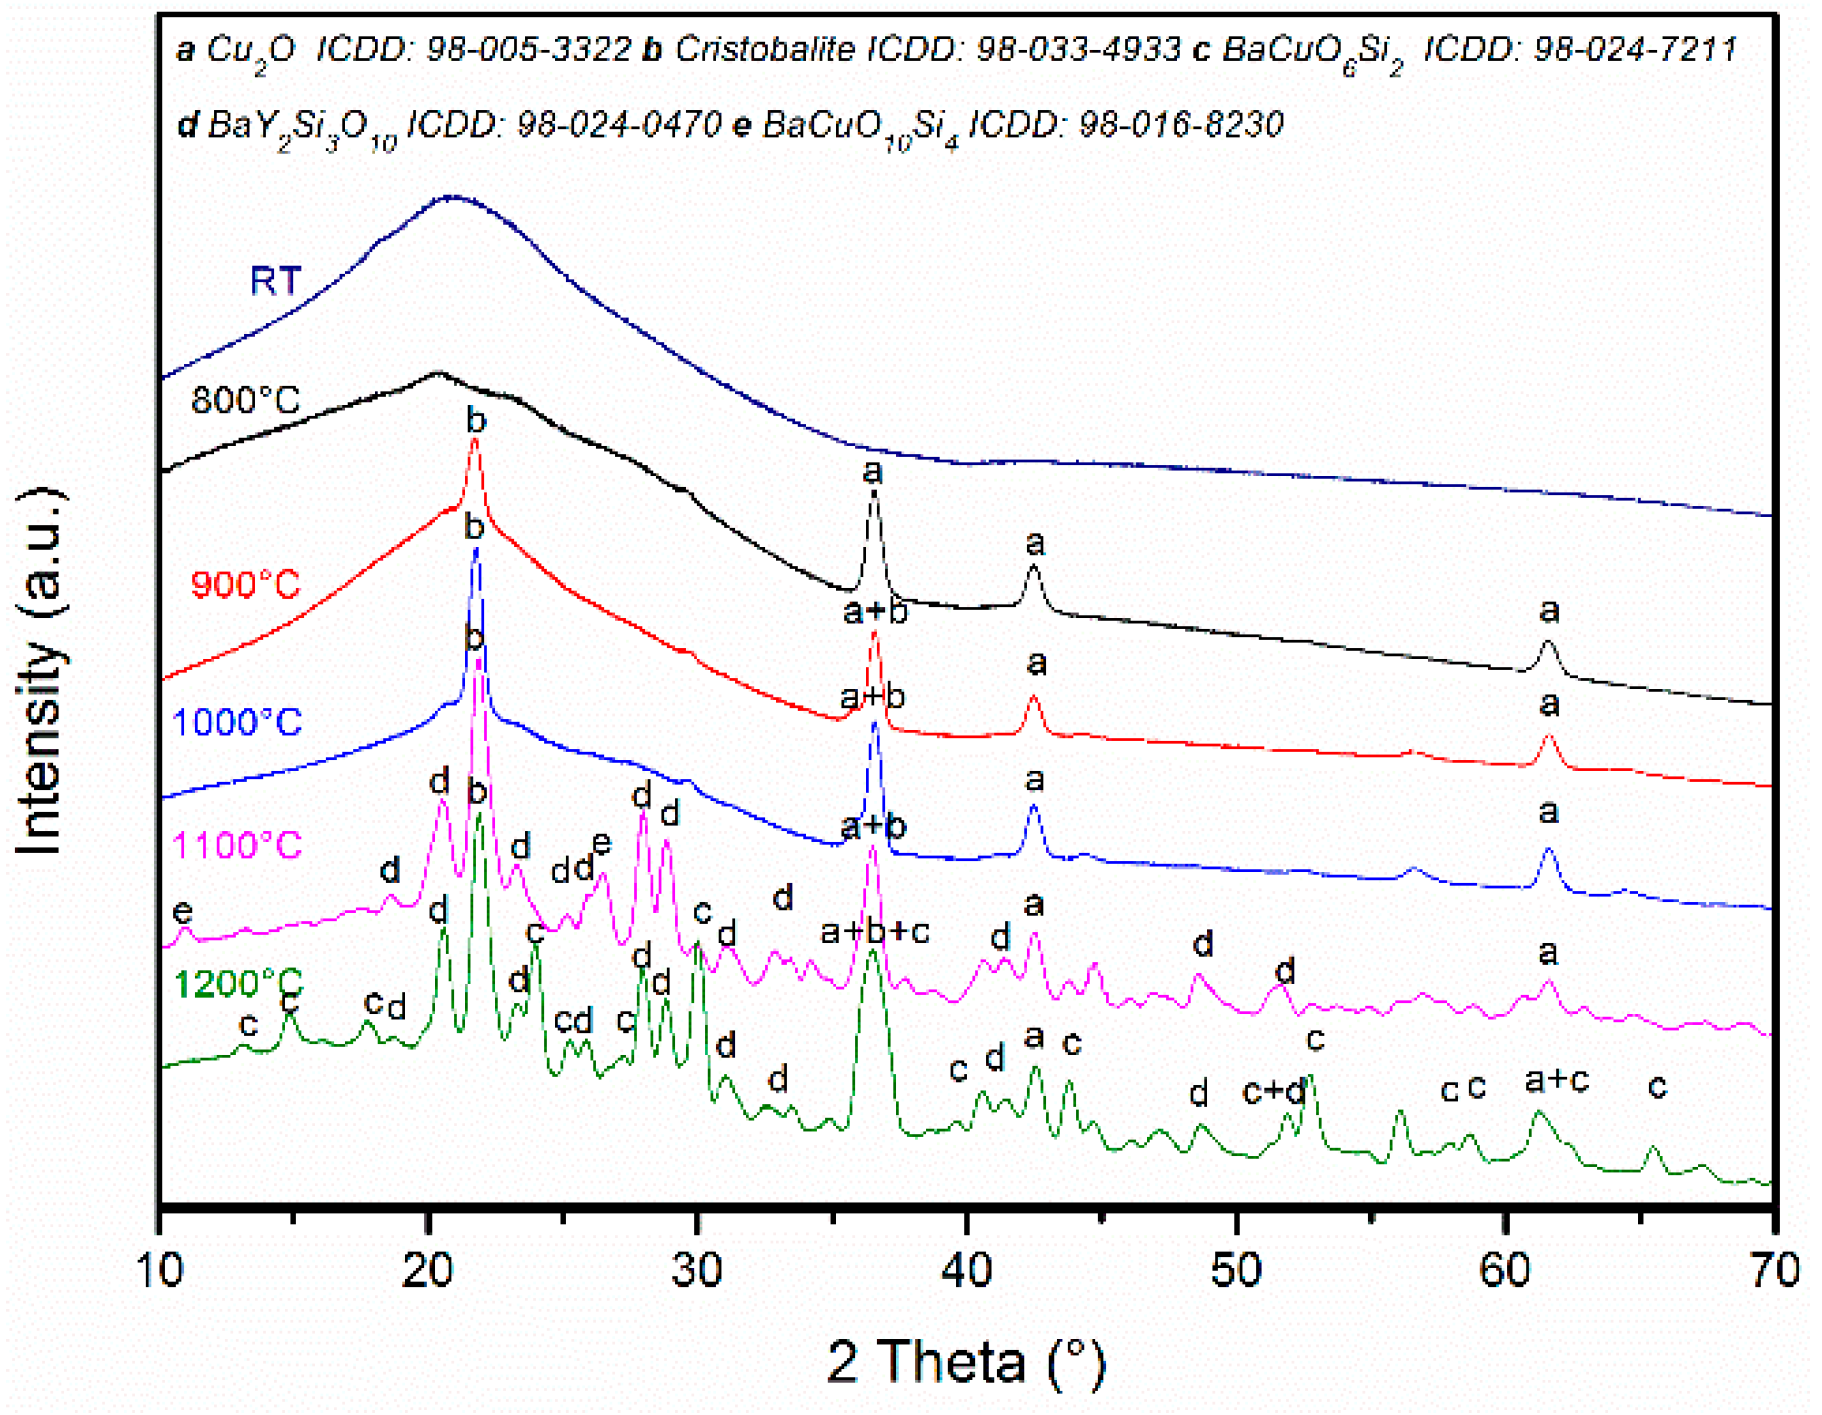
For the heat-treatments, a temperature range of 800 °C to 1200 °C was chosen due to its relevance to the processing of the melt-textured growth of YBCO [30]. The XRD patterns for the heat-treated fiber sections at 800 °C to 1200 °C are shown in Figure 9. Taking into account the EDS results and the cross-polarized light study in [14], we can predict the crystalline phases present in the XRD patterns. At 800 °C, a minor cuprite phase forms (peaks labeled a in Figure 8). At 900 °C, both cuprite and cristobalite (peaks labeled b) are observed. No additional crystalline phases form at 1000 °C. At the highest temperatures, peaks are observed that are consistent with the crystalline phases of barium copper silicates (BaCuSi4O10 at 1100 °C, peaks labeled e, and BaCuSi2O6 at 1200 °C, peaks labeled c) and yttrium barium silicate (BaY2Si3O10, peaks labeled d). Figure 9 also shows that an amorphous phase remains present even at 1200 °C. Because of the persistent amorphous phase, the broadness of the peaks from the crystalline phase, and the number of phases present at the higher temperatures, Rietveld refinements to obtain phase ratios were not possible.
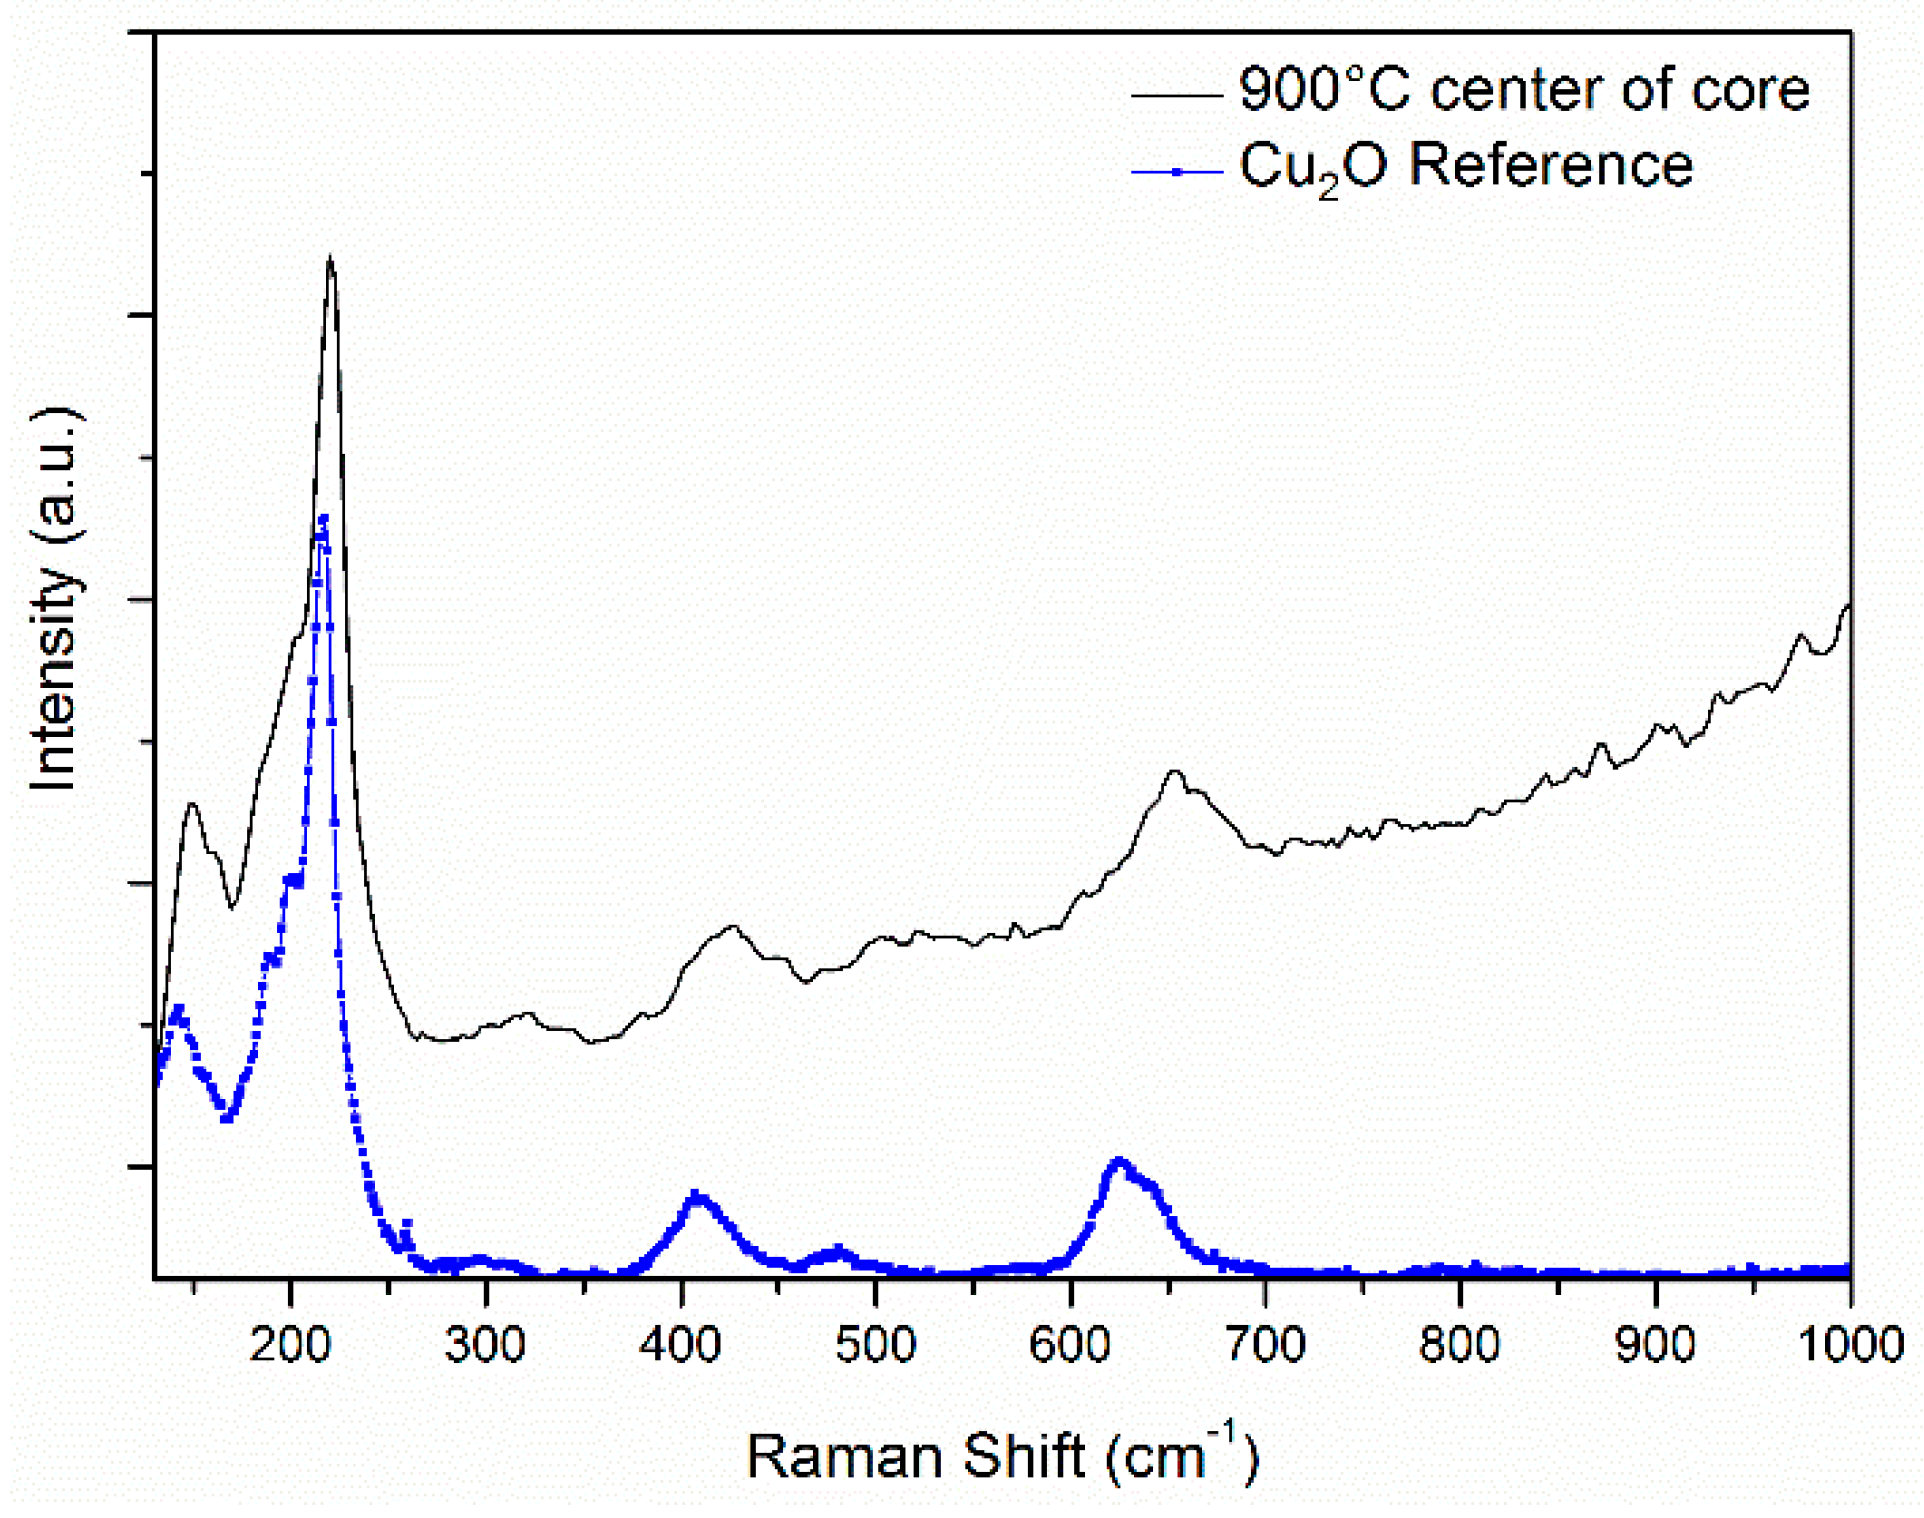
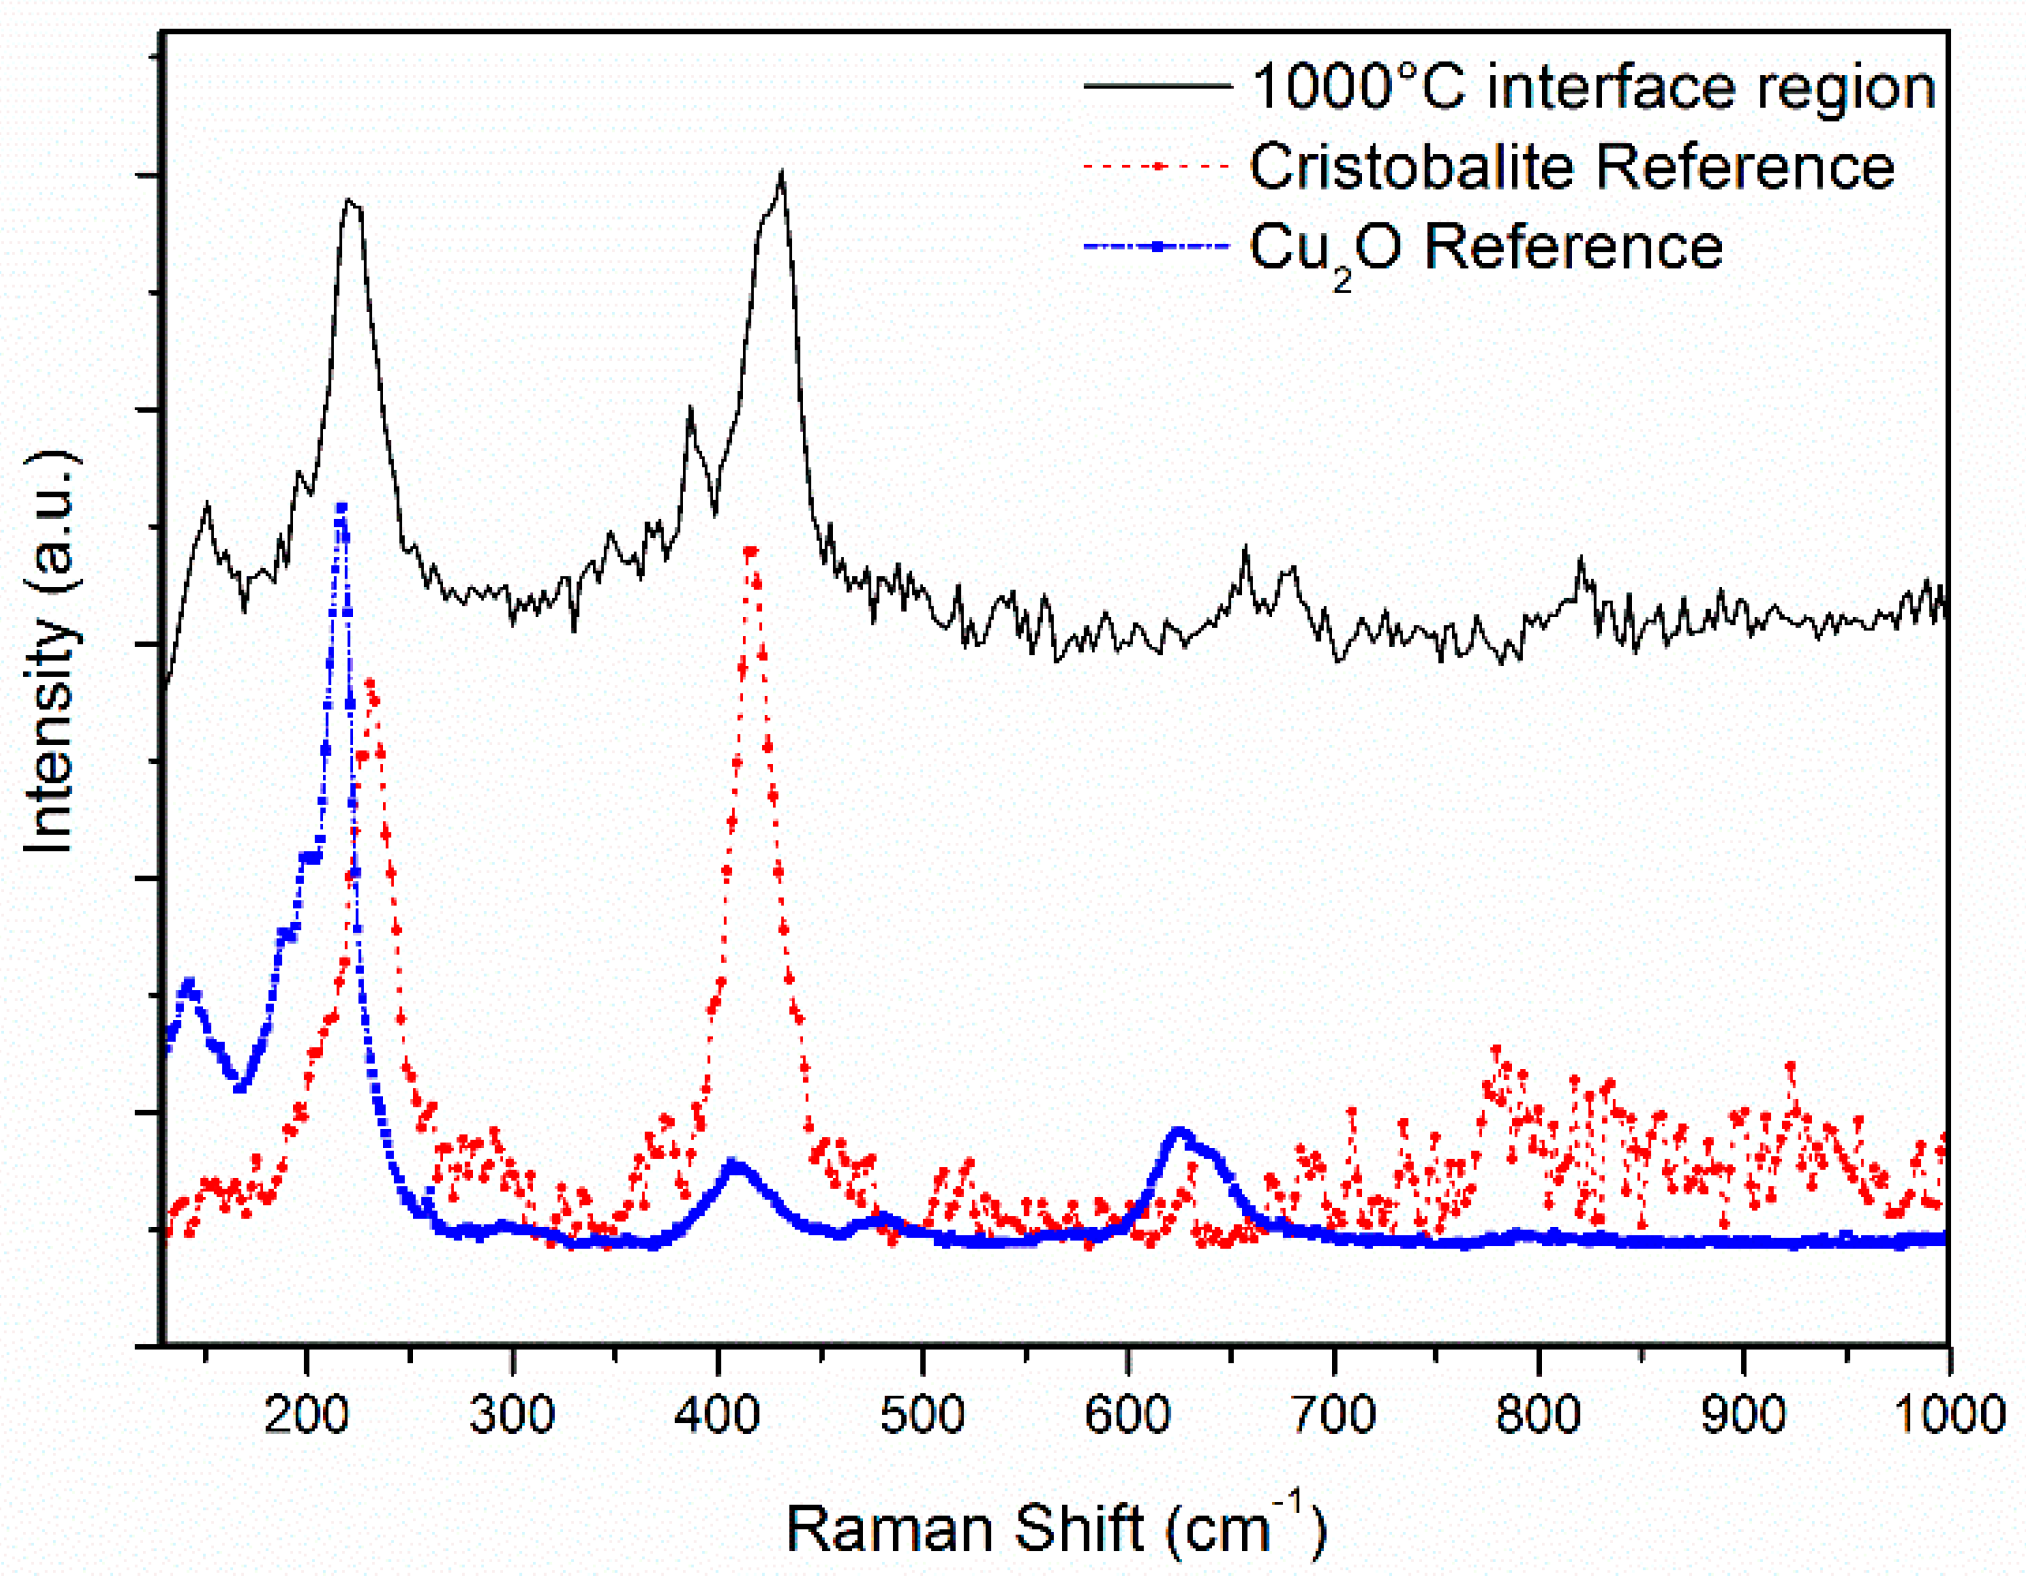
In order to determine the origin of the cristobalite phase, which is present starting at 900 °C inside the core, Raman measurements were performed on the 900 °C and 1000 °C heat-treated YBCO fiber cores. The corresponding Raman spectra are shown in Figure 10 and Figure 11, respectively. The Raman spectrum in Figure 10, obtained from measurements performed on the center of the YBCO core heat-treated at 900°C, only shows Raman modes originating from the cuprite phase. In Figure 11, the YBCO fiber core/cladding interface heat-treated at 1000 °C shows both cuprite and cristobalite modes.
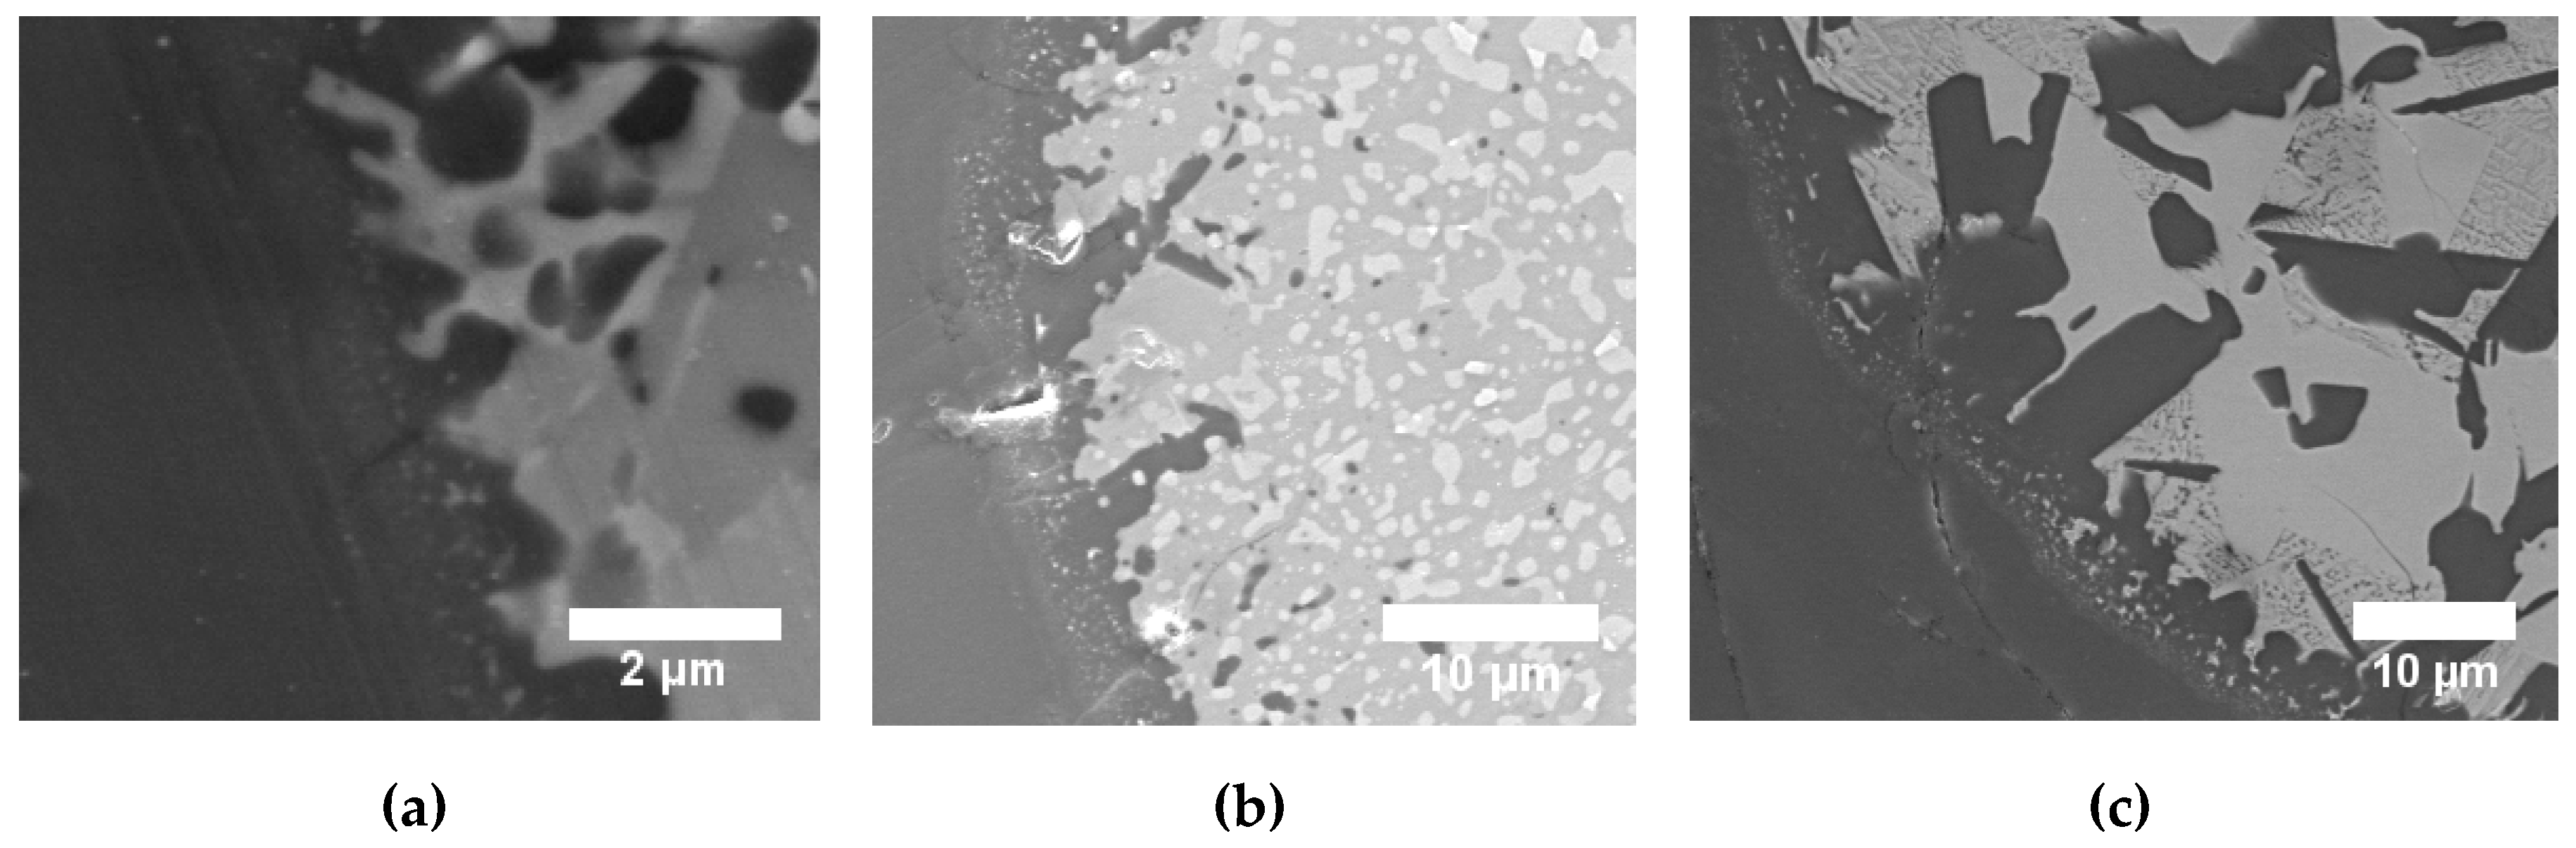
Figure 12 shows BSE images of the core/cladding interface region for the heat-treated YBCO fiber sections at 1000 °C, 1100 °C, and 1200 °C. The work in [29] describes the formation of cristobalite in the interface region of liquid silicon and vitreous silica. The morphology features of the core/cladding interface region in the BSE images in Figure 12a–c show close similarity to the interface structure presented in [32]. This, hence, further suggests that cristobalite forms at the interface region.
In summary, the results for the heat-treated fibers show that cuprite crystallizes onto the surface of the amorphous silica-rich precipitations, forming the co-precipitations. The results also show that cristobalite forms at the core/cladding interface region. Moreover, our results reveal that barium copper silicates and yttrium barium silicates are the stable phases at higher temperatures.
4. Conclusions
This work has shown the occurrence of dissolution and diffusion based reactions between the YBCO core and the fused silica cladding in YBCO glass fibers drawn using the molten-core approach on a fiber draw tower. We have provided an in-depth analysis of these reactions and presented a novel phase separation analysis within the glass-forming YBCO–SiO2 system. The analyses were performed on as-drawn fibers that were drawn under vacuum and in oxygen atmospheres, as well as vacuum as-drawn fibers that were subsequently heat-treated at different temperatures.
We have shown that, during the drawing process, dissolution of the fused silica cladding occurs followed by a subsequent diffusion of silicon and oxygen inside the molten YBCO core. This leads to amorphous silicate and amorphous silica-rich precipitation formation inside the core. In addition, we have shown that the dissolution of the fused silica cladding originates from lower eutectics, which form between yttria, copper oxide, barium oxide and silica, and which reduce the overall softening point of fused silica. Moreover, we have revealed that this dissolution is intensified by the glass modifying properties of yttria, copper oxide and barium oxide. Furthermore, we have demonstrated that a miscibility gap exists within the glass-forming YBCO–SiO2 system, which leads to the silica-rich precipitation formation. The region of the existing miscibility gap was identified based on the morphology of the YBCO core and the silica content inside the core. In this regard, the binodal and spinodal phase lines inside the miscibility gap were predicted as illustrated in Table 3. In addition, we have shown that an increase in oxygen content, which is investigated by drawing YBCO glass fibers in an oxygen-rich environment, leads to an increase in the rate of diffusion of silicon into the molten YBCO core. This, as a result, implies that the oxygen diffusion is the rate-limiting step in the diffusion process, and that an oxygen-rich drawing environment increases the silica-rich precipitations inside the core. Furthermore, recrystallization heat-treatments were performed in air on vacuum as-drawn YBCO fibers in order to investigate the possibility of restoring the superconductive YBCO phase. The heat-treatments have shown the formation of cuprite, cristobalite, yttrium barium silicate, and barium copper silicate. As such, the obtained results have highlighted that the dissolution of the fused silica cladding and the subsequent diffusion of silicon and oxygen into the molten YBCO core lead to phase separation, due to an occurring miscibility gap in the YBCO–SiO2 system, as well as to silicate formation and amorphization of the YBCO core, which prohibits the formation of the superconductive YBCO phase upon annealing.
The dissolution and diffusion based reactions between the fused silica cladding and the molten core are not only relevant to the YBCO–SiO2 system but are also common to the general field of fiber drawing using the molten-core approach; a process that indeed almost always leads to reduced functionality of the drawn fiber due to the hard-to-control stoichiometry of the chemical composition of the core. Hence, the understanding and identification of the reactions occurring at the cladding/core interface and the understanding of the mechanism of silicon and oxygen transport to the molten core, presented in this work, provide valuable insights enabling the identification of the strengths and limitations of the drawing process, which will assist with the future design of more robust systems.
Author Contributions
Conceptualization, H.H., S.Y., D.H. and G.P.; Data curation, H.H.; Formal analysis, H.H., S.Y. and C.S.; Funding acquisition, D.H., C.S., A.W. and G.P.; Investigation, H.H., S.Y., D.H. and C.S.; Methodology, H.H., S.Y., D.H. and G.P.; Project administration, D.H., A.W. and G.P.; Resources, C.S.; Supervision, D.H., A.W. and G.P.; Validation, H.H.; Visualization, H.H.; Writing-original draft, H.H.; Writing–review editing, S.Y., D.H., C.S., A.W. and G.P. All authors have read and agreed to the published version of the manuscript.
Funding
This research was funded using internal funding. We acknowledge the financial support by the National Science Foundation under the grant number CHE-1726077 for funding the purchase of the Rigaku XtaLAB Synergy-S.
Acknowledgments
The authors would like to thank Wei Zou’s group in the ECE department at Virginia Tech for generously allowing us to use their Raman spectrometer, and F. Marc Michel and the Geoscience Department at Virginia Tech for the access to the HighScore Plus software. Furthermore, the authors would like to acknowledge Virginia Tech’s Open Access Subvention Fund for supporting the publication of this article.
Conflicts of Interest
The authors declare no conflict of interest.
References
- Taylor, G.F. A Method of Drawing Metallic Filaments and a Discussion of their Properties and Uses. Phys. Rev. 1924, 23, 655–660. [Google Scholar] [CrossRef]
- Grodkiewicz, W. Fused silica fibers with metal cores. Mater. Res. Bull. 1975, 10, 1085–1090. [Google Scholar] [CrossRef]
- Morris, S.; Hawkins, T.; Foy, P.; Ballato, J.; Martin, S.W.; Rice, R. Cladding Glass Development for Semiconductor Core Optical Fibers. Int. J. Appl. Glass Sci. 2012, 3, 144–153. [Google Scholar] [CrossRef]
- Ballato, J.; Hawkins, T.; Foy, P.; Stolen, R.; Kokuoz, B.; Ellison, M.; Mcmillen, C.; Reppert, J.; Rao, A.M.; Daw, M.; et al. Silicon optical fiber. Opt. Express 2008, 16, 18675–18683. [Google Scholar] [CrossRef]
- Zheng, S.; Li, J.; Yu, C.; Zhou, Q.; Chen, D. Preparation and characterizations of Nd: YAG ceramic derived silica fibers drawn by post-feeding molten core approach. Opt. Express 2016, 24, 24248–24254. [Google Scholar] [CrossRef]
- Morris, S.; Ballato, J. Molten-core fabrication of novel optical fibers. Am. Ceram. Soc. Bull. 2013, 92, 24–29. [Google Scholar]
- Ballato, J.; Mcmillen, C.; Hawkins, T.; Foy, P.; Stolen, R.; Rice, R.; Zhu, L.; Stafsudd, O. Reactive molten core fabrication of glass-clad amorphous and crystalline oxide optical fibers. Opt. Mater. Express 2012, 2, 153–160. [Google Scholar] [CrossRef]
- Ballato, J.; Hawkins, T.; Foy, P.; Kokuoz, B.; Stolen, R.; Mcmillen, C.; Daw, M.; Su, Z.; Tritt, T.M.; Dubinskii, M.; et al. On the fabrication of all-glass optical fibers from crystals. J. Appl. Phys. 2009, 105. [Google Scholar] [CrossRef] [Green Version]
- Auguste, J.L.; Humbert, G.; Leparmentier, S.; Kudinova, M.; Martin, P.O.; Delaizir, G.; Schuster, K.; Litzkendorf, D. Modified Powder-in-Tube Technique Based on the Consolidation Processing of Powder Materials for Fabricating Specialty Optical Fibers. Materials 2014, 7, 6045–6063. [Google Scholar] [CrossRef] [Green Version]
- Ballato, J.; Hawkins, T.; Foy, P.; Yazgan-Kokuoz, B.; Mcmillen, C.; Burka, L.; Morris, S.; Stolen, R.; Rice, R. Advancements in semiconductor core optical fiber. Opt. Fiber Technol. 2010, 16, 399–408. [Google Scholar] [CrossRef]
- Morris, S.; Hawkins, T.; Foy, P.; Hudson, J.; Zhu, L.; Stolen, R.; Rice, R.; Ballato, J. On loss in silicon core optical fibers. Opt. Mater. Express 2012, 2, 1511–1519. [Google Scholar] [CrossRef]
- Zhang, Y.; Sun, Y.; Wen, J.; Lv, S.; Xiao, X.; Ma, Z.; Yang, L.; Bi, G.; Guo, H.; Qiu, J. Investigation on the formation and regulation of yttrium aluminosilicate fiber driven by spontaneous element migration. Ceram. Int. 2019, 45, 19182–19188. [Google Scholar] [CrossRef]
- Cavillon, M.; Dragic, P.; Faugas, B.; Hawkins, T.W.; Ballato, J. Insights and Aspects to the Modeling of the Molten Core Method for Optical Fiber Fabrication. Materials 2019, 12, 2898. [Google Scholar] [CrossRef] [PubMed] [Green Version]
- Heyl, H.; Homa, D.; Pickrell, G. Reaction of YBa2Cu3O7−x (YBCO) and fused silica in YBCO glass fibres. Bull. Mater. Sci. 2019, 42, 1–10. [Google Scholar] [CrossRef] [Green Version]
- CrysAlisPro Software System; v1.171.40.53; Rigaku Corporation: Oxford, UK, 2019.
- Cupid, D.M.; Seifert, H.J. Thermodynamic Calculations and Phase Stabilities in the Y-Si-C-O System. J. Phase Equilib. Diffus. 2007, 28, 90–100. [Google Scholar] [CrossRef]
- Frantz, J.D.; Mysen, B.O. Raman spectra and structure of BaO-SiO2, SrO-SiO2 and CaO-SiO2 melts to 1600 °C. Chem. Geol. 1995, 121, 155–176. [Google Scholar] [CrossRef]
- Xia, L.; Liu, Z.; Taskinen, P.A. Equilibrium study of the Cu–O–SiO2 system at various oxygen partial pressures. J. Chem. Thermodyn. 2016, 98, 126–134. [Google Scholar] [CrossRef]
- James, P.F. Liquid-phase separation in glass-forming systems. J. Mater. Sci. 1975, 10, 1802–1825. [Google Scholar] [CrossRef]
- Seward, T.P.; Uhlmann, D.R.; Turnbull, D. Development of Two-Phase Structure in Glasses, with Special Reference to the System BaO-SiO2. J. Am. Ceram. Soc. 1968, 51, 634–643. [Google Scholar]
- Seward, T.P.; Uhlmann, D.R.; Turnbull, D. Phase Separation in the System BaO-SiO2. J. Am. Ceram. Soc. 1968, 51, 278–285. [Google Scholar] [CrossRef]
- Gueguen, Y.; Houizot, P.; Célarié, F.; Chen, M.; Hirata, A.; Tan, Y.; Allix, M.; Chenu, S.; Roux-Langlois, C.; Rouxel, T. Structure and viscosity of phase-separated BaO-SiO2 glasses. J. Am. Ceram. Soc. 2017, 100, 1982–1993. [Google Scholar] [CrossRef]
- Haller, W. Rearrangement Kinetics of the Liquid—Liquid Immiscible Microphases in Alkali Borosilicate Melts. J. Chem. Phys. 1965, 42, 686–693. [Google Scholar] [CrossRef]
- James, P.F.; Mcmillan, P.W. Quantitative measurements of phase separation in glasses using transmission electron microscopy. Part 2. A study of lithia-silica glasses and the influence of phosphorus pentoxide. Phys. Chem. Glasses 1970, 11, 64–70. [Google Scholar]
- Gadalla, A.M.M.; Ford, W.F.; White, J. Equilibrium Relationships in the System CuO-Cu2O-SiO2. Trans. Br. Ceram. Soc. 1963, 62, 45–66. [Google Scholar]
- Toropov, N.A.; Bondar, I.A. Silicates of the rare earth elements. Russ. Chem. Bull. 1961, 10, 502–508. [Google Scholar] [CrossRef]
- Hageman, V.B.M.; Oonk, H.A.J. Liquid immiscibility in the SiO2+MgO, SiO2+SrO, SiO2+L2O3, and SiO2+Y2O3 systems. Phys. Chem. Glasses 1986, 27, 194–198. [Google Scholar]
- Burnett, D.G.; Douglas, R.W. Liquid-liquid phase separation in the soda-lime-silica system. Phys. Chem. Glasses 1970, 11, 125–135. [Google Scholar]
- Mao, H.; Selleby, M.; Fabrichnaya, O. Thermodynamic reassessment of the Y2O3–Al2O3–SiO2 system and its subsystems. Calphad 2008, 32, 399–412. [Google Scholar] [CrossRef]
- Murakami, M. Melt Processed High-Temperature Superconductors; World Scientific Publishing Co., Pte Ltd.: Singapore, 1992; pp. 21–42. [Google Scholar]
- Lafuente, B.; Downs, R.T.; Yang, H.; Stone, N. The power of databases: the RRUFF project. In Highlights in Mineralogical Crystallography; Armbruster, T., Danisi, R.M., Eds.; W. De Gruyter: Berlin, Germany, 2015; pp. 1–30. [Google Scholar]
- Liu, Z.; Carlberg, T. Reactions between liquid silicon and vitreous silica. J. Mater. Res. 1991, 7, 352–358. [Google Scholar] [CrossRef]
Figure 1.
Energy dispersive spectroscopy (EDS) line-scan across a polished cross-section of the core-cladding region of a vacuum as-drawn YBa2Cu3O7−x (YBCO) glass fiber with a core diameter of 115 µm.
Figure 1.
Energy dispersive spectroscopy (EDS) line-scan across a polished cross-section of the core-cladding region of a vacuum as-drawn YBa2Cu3O7−x (YBCO) glass fiber with a core diameter of 115 µm.

Figure 2.
EDS line-scan across a polished cross-section of the core-cladding region of a vacuum as-drawn YBCO glass fiber with a core diameter of 237 µm.
Figure 2.
EDS line-scan across a polished cross-section of the core-cladding region of a vacuum as-drawn YBCO glass fiber with a core diameter of 237 µm.

Figure 3.
EDS line-scan across a polished cross-section of the core-cladding region of a vacuum as-drawn YBCO glass fiber with a core diameter of 15 µm.
Figure 3.
EDS line-scan across a polished cross-section of the core-cladding region of a vacuum as-drawn YBCO glass fiber with a core diameter of 15 µm.

Figure 4.
XRD pattern of a vacuum as-drawn YBCO core fragment and the corresponding Debye-Scherrer diffraction ring pattern.
Figure 4.
XRD pattern of a vacuum as-drawn YBCO core fragment and the corresponding Debye-Scherrer diffraction ring pattern.

Figure 5.
EDS line-scan across a polished cross-section of the core-cladding region of an oxygen as-drawn YBCO glass fiber with a core diameter of 341 µm.
Figure 5.
EDS line-scan across a polished cross-section of the core-cladding region of an oxygen as-drawn YBCO glass fiber with a core diameter of 341 µm.

Figure 6.
Backscattered electron (BSE) image of the center of an as-drawn YBCO glass fiber in an O2 atmosphere.
Figure 6.
Backscattered electron (BSE) image of the center of an as-drawn YBCO glass fiber in an O2 atmosphere.

Figure 7.
BSE image of the interface region of an as-drawn YBCO glass fiber in an O2 atmosphere.

Figure 8.
XRD pattern of an as-drawn YBCO glass fiber fragment in O2 atmosphere and the corresponding Debye-Scherrer diffraction ring pattern.
Figure 8.
XRD pattern of an as-drawn YBCO glass fiber fragment in O2 atmosphere and the corresponding Debye-Scherrer diffraction ring pattern.

Figure 9.
XRD patterns of as-drawn YBCO fiber cores heat-treated at 800 °C to 1200 °C for a dwelling time of 10 min in air.
Figure 9.
XRD patterns of as-drawn YBCO fiber cores heat-treated at 800 °C to 1200 °C for a dwelling time of 10 min in air.

Figure 10.
Raman spectrum at the center of a vacuum as-drawn YBCO fiber core heat-treated at 900 °C for a dwelling time of 10 min in air; reference from RRUFF database [31]: cuprite (R050384).
Figure 10.
Raman spectrum at the center of a vacuum as-drawn YBCO fiber core heat-treated at 900 °C for a dwelling time of 10 min in air; reference from RRUFF database [31]: cuprite (R050384).

Figure 11.
Raman spectrum at the core/cladding interface region of a vacuum as-drawn YBCO fiber heat-treated at 1000 °C for a dwelling time of 10 min in air; reference from RRUFF database [31]: cristobalite (X050046) and cuprite (R050384).
Figure 11.
Raman spectrum at the core/cladding interface region of a vacuum as-drawn YBCO fiber heat-treated at 1000 °C for a dwelling time of 10 min in air; reference from RRUFF database [31]: cristobalite (X050046) and cuprite (R050384).

Figure 12.
BSE images of the core/cladding interface regions of vacuum as-drawn YBCO glass fibers heat-treated at (a) 1000 °C, (b) 1100 °C, and (c) 1200 °C for a 10 min dwelling time in air.
Figure 12.
BSE images of the core/cladding interface regions of vacuum as-drawn YBCO glass fibers heat-treated at (a) 1000 °C, (b) 1100 °C, and (c) 1200 °C for a 10 min dwelling time in air.


Table 1.
Dependence of the silicon content inside the core on the diameter of the vacuum as-drawn YBCO core.
Table 1.
Dependence of the silicon content inside the core on the diameter of the vacuum as-drawn YBCO core.
| Diameter of YBCO Core | Average Silicon Content Inside the Core (at.-%) |
|---|---|
| 15 µm | 27.6 ± 2.1 |
| 115 µm | 20.6 ± 1.3 |
| 237 µm | 20.2 ± 1.2 |
Table 2.
Increase in silicon content inside the core with an increase in oxygen content in as-drawn YBCO glass fibers drawn in vacuum (Figure 1) and oxygen (Figure 5) atmospheres.
| Atmosphere (Region) | Silicon Content (at.-%) | Oxygen Content (at.-%) |
|---|---|---|
| Vacuum (center of the core) | 20.6 ± 1.3 | 57.5 ± 0.7 |
| Vaccum (interface) | 23.2 ± 0.7 | 59.3 ± 0.3 |
| O2 (center of the core) | 24.7 ± 1.4 | 61.2 ± 1.1 |
| O2 (interface) | 26.4 ± 1.8 | 61.9 ± 1.1 |
| O2 (at the interface edge towards the cladding) | 28.2 ± 0.9 | 63.6 ± 0.1 |
Table 3.
Morphology change depending on mol-% of silica shown for as-drawn YBCO glass fiber sections drawn under vacuum and O2 atmospheres.
Table 3.
Morphology change depending on mol-% of silica shown for as-drawn YBCO glass fiber sections drawn under vacuum and O2 atmospheres.
RT Vacuum Core | RT Vacuum Interface | RT Oxygen Core | RT Oxygen Interface | RT Oxygen Interface Edge | |
| SiO2 | 60.7 ± 3.7 mol-% | 68.6 ± 2.2 mol-% | 74.9 ± 4.2 mol-% | 79.4 ± 5.3 mol-% | 85.5 ± 2.8 mol-% |
| Cu2O | 15.2 ± 1.5 mol-% | 12.1 ± 0.8 mol-% | 12.3 ± 1.2 mol-% | 10.5 ± 1.9 mol-% | 7.7 ± 0.5 mol-% |
| BaO | 13.2 ± 0.8 mol-% | 12.4 ± 0.1 mol-% | 8.5 ± 0.8 mol-% | 7.0 ± 1.0 mol-% | 5.0 ± 0.8 mol-% |
| Y2O3 | 11.0 ± 1.2 mol-% | 6.9 ± 0.8 mol-% | 4.4 ± 0.5 mol-% | 3.1 ± 0.6 mol-% | 1.8 ± 0.2 mol-% |
decrease in SiO2 content | |||||
| Morphology interpretation | Outside the miscibility gap (solid solution) | Inside the binodal region (nucleation and growth) | Inside the binodal region (nucleation and growth) | Close to spinodal line or coalescence of silica-rich precipitations | Close or inside the spinodal line or coalescence of silica-rich precipitations |
 |  |  |  |  | |
© 2019 by the authors. Licensee MDPI, Basel, Switzerland. This article is an open access article distributed under the terms and conditions of the Creative Commons Attribution (CC BY) license (http://creativecommons.org/licenses/by/4.0/).
Share and Cite
MDPI and ACS Style
Heyl, H.; Yang, S.; Homa, D.; Slebodnick, C.; Wang, A.; Pickrell, G. Dissolution and Diffusion-Based Reactions within YBa2Cu3O7−x Glass Fibers. Fibers 2020, 8, 2. https://0-doi-org.brum.beds.ac.uk/10.3390/fib8010002
AMA Style
Heyl H, Yang S, Homa D, Slebodnick C, Wang A, Pickrell G. Dissolution and Diffusion-Based Reactions within YBa2Cu3O7−x Glass Fibers. Fibers. 2020; 8(1):2. https://0-doi-org.brum.beds.ac.uk/10.3390/fib8010002
Chicago/Turabian StyleHeyl, Hanna, Shuo Yang, Daniel Homa, Carla Slebodnick, Anbo Wang, and Gary Pickrell. 2020. "Dissolution and Diffusion-Based Reactions within YBa2Cu3O7−x Glass Fibers" Fibers 8, no. 1: 2. https://0-doi-org.brum.beds.ac.uk/10.3390/fib8010002
Note that from the first issue of 2016, this journal uses article numbers instead of page numbers. See further details here.