Investigation of Flow Behavior and Porous Medium Resistance Coefficients for Metallic-Cloth Fibers


1
Faculty of Engineering and Natural Sciences, Sabanci University, 34956 Istanbul, Turkey
2
SDM Research & Engineering, 34906 Istanbul, Turkey
3
Department of Mechanical Engineering, Kirikkale University, 71450 Kirikkale, Turkey
*
Author to whom correspondence should be addressed.
Fibers 2020, 8(12), 75; https://0-doi-org.brum.beds.ac.uk/10.3390/fib8120075
Submission received: 2 November 2020
/
Revised: 22 November 2020
/
Accepted: 27 November 2020
/
Published: 7 December 2020
Abstract
:The flow through porous metallic-cloth fibers influences the cloth seal leakage performance. Measuring the actual seal leakage proves difficult with challenging turbine operating conditions. A non-Darcian porous medium Computational Fluid Dynamics (CFD) model was employed for the flow within porous metallic-cloth fibers. CFD analyses need leakage data depending on the pressure load to calibrate flow resistance coefficients. A test rig was built to measure leakage with respect to the pressure load and weave orientation in four directions. The Sutherland-ideal gas approach was utilized to determine the flow resistance coefficients for Dutch twill metallic-cloth fibers as a function of pressure load. The results show that metallic-cloth fiber leakage is a linear function of pressure load. The best–worst order for leakage performance was the warp, diagonal, shute, and cross directions. For the best sealing performance, the flow direction in metallic-cloth fibers would be the warp direction. The flow resistance coefficients depend on the evaluation of the pressure level, which changes over the weave flow thickness. This is represented with the pressure constant (Cdown). The best match between the test and CFD leakages was obtained for the weave directions of warp (0.9), shute (0.9), diagonal (0.7), and cross (0.0). Calibrating the resistance coefficients with respect to the pressure and temperature enables performing CFD analyses in turbine conditions.
1. Introduction
Turbomachinery sealing technology is concerned with the crucial tasks of maintaining pressurized regions, leakage control, cooling control, purge flow, and axial force balance. Thus, advances in sealing technology have considerable impact on overall turbomachinery performance, decreasing operational costs and fuel consumption. The demands for gas turbine technology require detailed research on understanding and development for any piece of the turbine. Turbomachinery sealing takes place not only between rotating and stationary components but also between stationary components. Leakage mass flow reduction between stationary components is one of the key objectives for gas turbine performance studies. Some stationary seal locations are shown in Figure 1. Seals applied between stationary components are a metal shim seal (E-type seal, C-type seal, O-type seal, or U-plex seal), rigid strip seal (spline seal, leaf seal, or dogbone seal), cloth seal, rope seal, and foil seal. For sealing between stationary components, the traditional metal shim seals are inadequate to meet the requirements in terms of wear, compliancy, and leakage when adjacent components significantly move in axial and radial directions. Cloth seals, as a new type of stationary seal, have been used as an alternative to metal shim seals to reduce the leakage rate and increase the wear life [1,2,3,4].
In this study, for the first time, a bulk porous medium flow model is presented for cloth seal weave fibers, instead of flow modelling in complex weave voids among fibers. This bulk flow model approach was also utilized by Dogu [5] for flow among brush seal bristles. For flow in a porous medium, there are some suggested relations between pressure drop and leakage as a function of the porous medium characteristics. All the relations are in need of test calibration and governed by utilizing test data of the leakage and pressure load. When the weave type porous medium is concerned, several non-Darcian equations have been developed for the flow resistances of woven cloth [6,7,8], in addition to the basic Darcy porous medium law.
In this study, metallic-cloth fibers were modelled as a porous medium with inertial and viscous resistance coefficients [5]. The flow among weave voids is well represented when both inertial and viscous resistances are considered. The flow resistance coefficients for porous metallic-cloth fibers are mainly affected by the weave geometry, flow direction, working conditions (pressure and temperature), and fluid properties. In order to determine the inertial and viscous resistance coefficients for metallic-cloth fibers as a function of pressure load, the porous medium methodology of the Sutherland-ideal gas approach was employed for Dutch twill metallic-cloth fibers at different pressure loads.
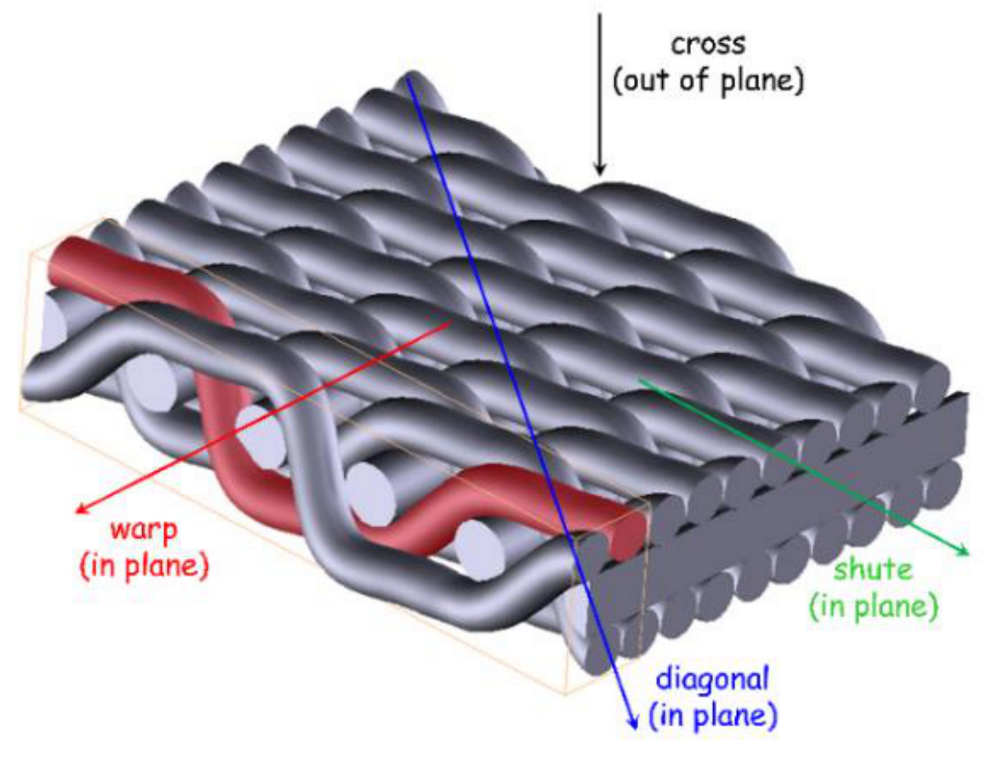
The leakages for metallic-cloth fibers in the following four directions were measured as a function of the pressure load on a test setup:
- Warp (in-plane direction);
- Shute (in-plane direction);
- Diagonal (in-plane direction);
- Cross (out-of-plane direction).
A diagonal direction for the metallic-cloth fibers, which is oriented 45° to the dominant relative motion, increases the wear resistance and helps to maintain the mesh integrity [9]. Therefore, metallic-cloth fiber samples were also cut in the diagonal direction. In addition, Computational Fluid Dynamics (CFD) analyses were employed to calculate the leakages as a function of the pressure load, and the flow resistance coefficients for porous metallic-cloth fibers were determined. The details of the work and findings are explained in the Section 2 and Section 3.
Measuring the actual seal leakage in turbine operating conditions is difficult. This study performed a calibration of the resistance coefficients with respect to the pressure and temperature; therefore, CFD analyses of the cloth seal could be performed with the calibrated resistance coefficients in turbine operating conditions. The leakage rate of the cloth seal could be obtained without leakage tests in turbine operating conditions.
2. Materials and Methods
2.1. Materials
Haynes 25 was selected for the metallic-cloth fiber material. It is a cobalt–nickel alloy that provides good strength and oxidation resistance at high temperature. The specifications of the Haynes 25 material are tabulated in Table 1. The Dutch twill weave type with a 30 × 250 weave density (30 warp fibers per inch of length ×250 shute fibers per inch of length) is reported to be the best metallic-cloth fiber option for sealing purposes [3]. Therefore, a set of static leakage performance tests were performed for the Dutch twill (30 × 250) metallic-cloth fiber samples.
2.2. Methods
2.2.1. Cloth Weave Geometry and Issues
A schematic of a typical cloth seal application and leakage flow paths are plotted in Figure 2. The cloth-wrapped metal shim seal was placed in a slot machined between stationary components. The cloth seal included one or more woven cloth layers and a thin metal shim. Several designs are proposed in the literature, and many patents have been filed [10,11,12,13,14,15]. Cloth seals are shaped by combining thin sheet metals (named shims) and woven cloth metal layers. A single or pack of cloth layers may be placed on the upper side or lower side of the metal shim. The shim and cloth layers are held by spot welds. Metal shims are usually bent to create right and left tabs; therefore, choking flow interfaces occur between the tabs and turbine slots. The shim eliminates direct leakage and provides structural strength, while metallic-cloth fibers (cloth weave) enable additional wear volume without significant stiffness contribution [16]. Due to its softness, the cloth seal can handle more mismatch of the stationary components without sacrificing the leakage performance. The metal cloth protects the soft metal shim against wear while producing a wear resistance layer over the metal shim.
The main design issues in cloth seal applications are the leakage performance, seal temperature, structural strength, wear, and mismatch tolerance. Testing is necessary to determine these issues, and to develop theoretical models and analytical design tools.
A cloth seal delivers 70% leakage reductions in nozzle segments and up to 30% in combustor segments [16]. Nozzle-shroud cloth seals enhance the output performance by 0.5% and decrease the heat rate by 0.25% for an industrial gas turbine [16]. The service life is also extended with flexible cloth seals by at least 50% [17]. Aksit et al. [2] studied cloth seals for raising the leakage performance of both E- and F-type gas turbines. They reported that leakage decreased by 65% in comparison to with a comparable rigid strip seal, and savings increased by up to 77% in offset and mismatch conditions. Gorgun et al. [18] investigated cloth seal leakage performance under varying pressure loads. Their experimental results show that geometric dimensions and pressure significantly influence the leakage rate through the cloth seal. Ongun et al. [4] developed an analytical model characterizing wear behavior of woven structures to estimate the wear life of metal cloth seals. They provided an equation for the total volume lost, which provides the wear rate of metal cloth based on the Archard equation [19,20].
In the literature, experimental studies have been conducted to investigate the permeability of textile fabrics [21,22]. The filtration characteristics of metal fiber felt were investigated with the Computational Fluid Dynamics (CFD)—Discrete Element Method (DEM) coupling simulation method [23]. The researchers obtained a three-dimensional model based on microscopic images of metal fiber felt by using a scanning electron microscope. Yeo et al. [24] reported that the “hydrodynamic resistance” through a bundle consists of two components: one is the “bundle resistance” resulting from lateral flow through the bundle; the other component is “permeate competition” from surrounding fibers. A CFD porous media model was employed to simulate the impact of fiber distance and position on fiber–fiber interaction [25]. The authors imply that if the fiber distance is less than the fiber diameter, the interaction becomes significant due to permeate competition. They emphasize that permeate competition could be neglected, and the bundle resistance becomes important when the fiber distance is equal to the fiber diameter.
There have been several numerical or experimental studies on the flow performance of different seal types [26,27,28,29,30]. Dogu et al. [31] introduced a thermal-flow analysis for a cloth seal placed in a slot for gas turbine shroud applications. They utilized experimental leakage data to determine the clearance between the cloth seal and slot surface. They modeled metallic-cloth fibers as a solid domain with a half reduction in its thermal properties. They determined the flow and temperature fields over the cloth seal. The interesting result is that the metallic-cloth fiber layer acted as a thermal shield protecting the shim from overheating in addition to the known wear shield effect.
As shown in Figure 2, the leakage flow occurs through the throat clearance at the shim tabs, while it passes in complex voids among woven fibers on the upstream and downstream sides of the shim tabs. The throat clearance at the shim tabs is mainly the same as the clearance between the weave fibers and slot downstream surface. The shim tabs and/or woven fibers may touch the slot surface during operation. At the downstream side of the shim tabs, the flow is still subject to throttling through the clearance between the woven fibers and slot surface and through complex voids among the woven fibers. Consequently, the flow inside the metallic-cloth fibers is effective for the leakage in addition to the flow at the tab clearance.
Commonly used weave types are:
- Plain weave;
- Twill weave;
- Dutch weave;
- Plain Dutch weave;
- Reverse Dutch weave;
- Dutch twill weave;
- Dutch twill double weave;
- Stranded weave.
Several high-density weave types are available as shown in Figure 3. Plain weave is the most basic weave form, which is woven by alternating shute fiber under and over warp fiber. In twill woven fibers, shute fiber passes over and under a pair of warp fibers. Plain Dutch woven fibers are woven with smaller fibers in the shute direction and larger fibers in the warp direction. Dutch twill weave is a mixture of twill and Dutch weaving where smaller-diameter shute fibers are woven by alternating two larger warp fibers. In stranded weave, bundles of warp and shute metals pass over and under one another. It increases the contact surface, therefore providing high wear performance.
Chupp et al. [9] emphasizes that the Dutch twill weave type with a 30 × 250 (30 warp fibers per inch of length × 250 shute fibers per inch of length) weave density is the best metallic-cloth fiber option for sealing purposes. Therefore, in this study, a Dutch twill (30 × 250) metallic-cloth fiber sample was selected for investigation, and a set of static leakage performance tests were performed.
A schematic of a typical Dutch twill type metallic-cloth fiber, which is commonly used in cloth seal applications and was used in this study, is plotted in Figure 4. The metallic-cloth fibers involve warp and shute fibers. In Dutch twill weave, warp fibers are placed straight, and shute fibers cross over two and under two warp fibers. Since the leakage through the metallic-cloth fibers affects the overall cloth seal performance, the three-dimensional flow in the metallic-cloth fibers needs to be investigated by testing and with flow modelling tools to constitute a cloth seal design tool. However, modelling the flow through the complex weave voids among each warp and shute fiber involves a very complex flow structure, extensive effort and high CPU time in terms of not only leakage determination but also structural and wear analyses. Therefore, a bulk porous medium flow model was applied to the model cloth seal weave fibers. The details of this study are explained in the Section 2.2.2, Section 2.2.3, Section 2.2.4.
2.2.2. Experimental Setup
In order to obtain the cloth seal leakage performance, the mass flow rate needs to be determined in gas turbine operating conditions. However, it is challenging to set up a test system that works under extreme pressure and temperature levels.
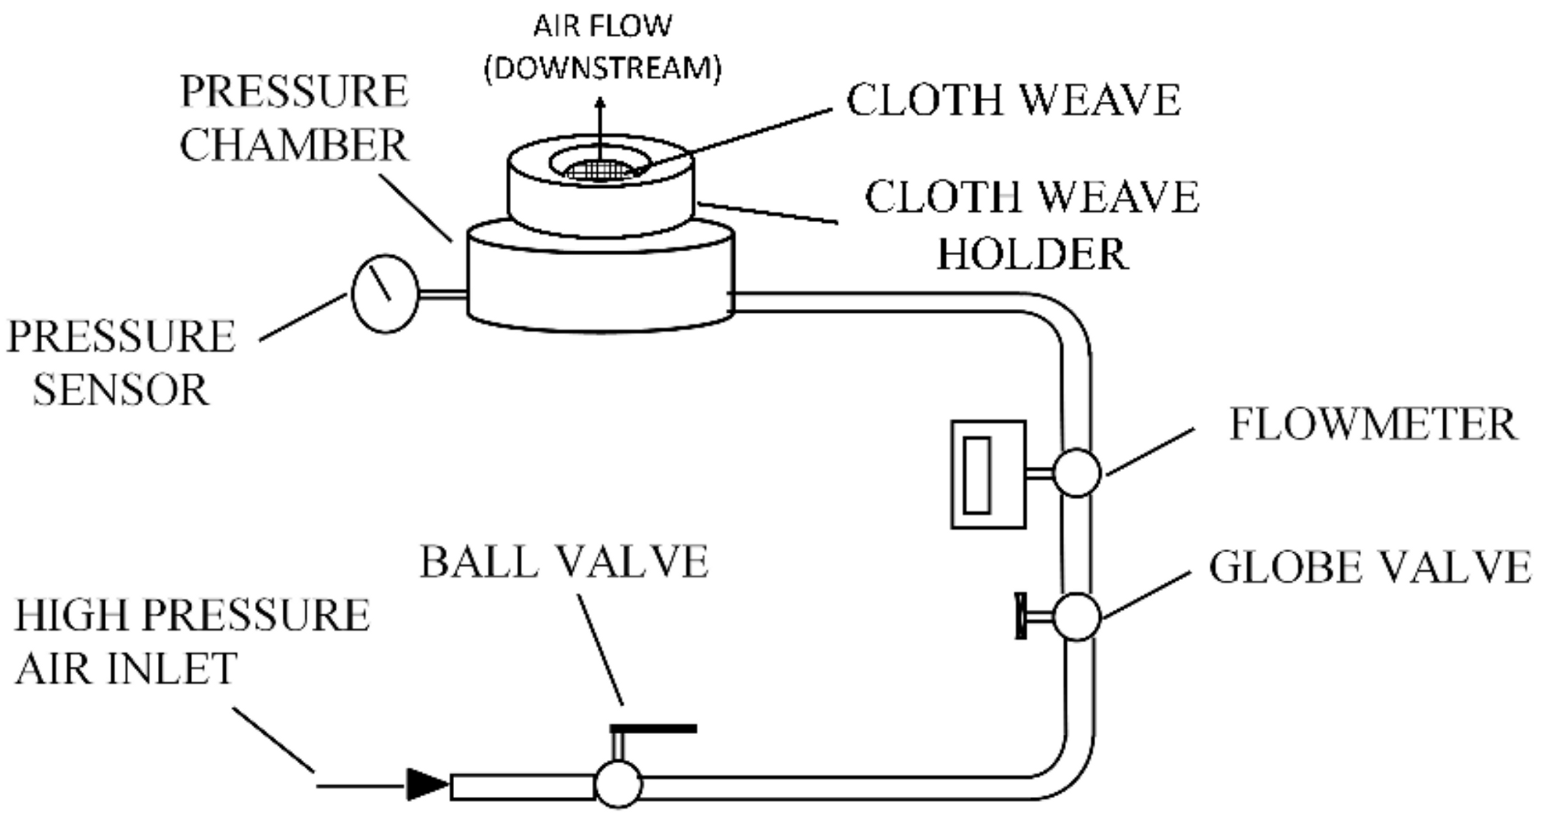
A test rig as shown in Figure 5 was set up to measure the metallic-cloth fiber leakage in the four directions of warp, shute, diagonal, and cross. Metallic-cloth fiber holders were designed to obtain the leakage flow in the determined directions. For this purpose, two different metallic-cloth fiber holders were used. In Figure 5, a cylindrical metallic-cloth fiber holder is shown for an out-of-plane test system. This holder was disassembled, and two side holders were assembled for the in-plane tests. Four cloth samples were prepared for the warp, shute, diagonal, and cross leakage tests. An in-plane metallic-cloth fiber test system was used to obtain the leakage in the warp, shute, and diagonal directions, whereas an out-of-plane test system provided the leakage rate in the cross direction. Similar test rigs were also used in previous works [1,3].
Compressed air was fed into the pipeline through the test chamber. The downstream side of the test rig was open to ambient conditions. The test rig contained the necessary equipment such as upstream pressure adjustment valves, a flowmeter, and pressure sensors.
The test rig operated at a pressure drop between 68.9 and 758.4 kPad (10–110 psid). The air temperature was at room temperature. During the metallic-cloth fiber leakage tests, the pressure difference was increased up to 758.4 kPad (110 psid) and then decreased down to 68.9 kPad (10 psid) incrementally. The leakage flow rate was recorded at any 68.9 kPad (10 psid) increment. The tests were repeated for three cycle times for each direction. Each cycle included increasing and decreasing the pressure and upward and downward leakage measurements. In the ‘Appendix A’ section, an uncertainty analysis is conducted by using leakage measurements and accuracy of the sensor.
2.2.3. The Sutherland-Ideal Gas Approach for Porous Metallic-Cloth Fibers
The main purpose of developing an analytical model for flow in a porous medium is to determine a relation between pressure drop and leakage as a function of effective parameters, especially the pressure and temperature level, fluid properties, and porous medium geometry. The flow in porous medium is subject to additional flow resistances compared to that in the absence of a porous medium.
Many relations have been developed for various types of porous medium. When the weave type porous medium is concerned, several equations have been developed for the flow resistances of metallic-cloth fibers [6,7,8] in addition to the basic Darcy porous medium law.
In this study, a porous medium with inertial and viscous resistance coefficients was applied to model metallic-cloth fibers. The flow among weave voids is well represented when both inertial and viscous resistances are considered. The weave geometry, direction, pressure level and difference, and temperature have an impact on porous medium flow resistance coefficients. In order to determine the inertial and viscous resistance coefficients for metallic-cloth fibers as a function of pressure load, the Sutherland-ideal gas approach was utilized in this study. By using test data of the pressure drop and leakage, this approach was employed to calibrate the inertial and viscous flow resistance coefficients of Dutch twill metallic-cloth fibers at different pressure loads. Since the inertial term is also considered, this approach’s relations are valid for both laminar and turbulent flows. Then, the coefficients were used in the CFD model. In CFD analysis, the leakage is calculated with respect to the pressure drop and compared with the test leakage. The approach was evaluated to accurately represent the weave porous medium model and the test data.
The Sutherland-ideal gas approach includes inertial effects for high Reynolds numbers. An extended version of the linear Darcian model is given in Equation (1), which is called the non-Darcian porosity model, as follows:
where xi refers to orthotropic flow directions, Kperm,i means the permeability of the porous media, Kloss,i is the quadratic loss coefficient, and ui is the superficial velocity in the orthotropic flow direction. The Darcy model involves only the viscous resistance term.
The superficial velocity is a hypothetical fluid velocity that is obtained as the volume flow rate divided by a cross-section of the porous area. ui is expressed in terms of the average velocity (u) and porosity (ε) as (ui = u/ε).
This equation (Equation (1)) can be rearranged in terms of the flow resistance coefficients as follows:
where α/β refers to the inertial/viscous flow resistance coefficient, which is a quadratic/linear function of the velocity in porous metallic-cloth fibers. Equation (2) provides the correlation between the pressure gradient, velocity, and flow resistance coefficients.
For the flow within the porous metallic-cloth fibers, the pressure and temperature vary. The density varies with pressure and temperature, while the viscosity is only a function of temperature. Therefore, the dependency of flow resistance coefficients on pressure and temperature should be considered in the calculation and calibration of α and β.
The inertial flow resistance coefficient (α) is a function of density that varies with pressure and temperature. Therefore, in the calibration of the flow resistance coefficients, the inertial resistance (quadratic) coefficient was correlated with respect to pressure and temperature by using the Ideal Gas equation.
Meanwhile, the viscous flow resistance coefficient (β) is a function of viscosity that varies with temperature. Therefore, the viscous resistance (linear) coefficient was correlated with respect to temperature by applying Sutherland’s Law [32].
Thus, Sutherland’s Law and the Ideal Gas equation were employed in the calibration of the flow resistance coefficients for the porous metallic-cloth fibers. The equations showing the dependency of the inertial/viscous flow resistance coefficient on pressure and temperature are written below:
S refers to the Sutherland temperature. These equations provide a correlation for the resistance coefficients for different pressures and temperatures.
At the end of the calibration procedure, a single number was defined for α and β, while the pressure/temperature dropped from P1/T1 to P2/T2 over the metallic-cloth fibers. P1 and P2 were conducted for various pressure levels as:
Cdown is a pressure constant that enables correlating the resistance coefficients at different pressure levels. Cdown = 1 indicates that the downstream pressure levels are considered in the correlation, whereas the α and β resistance coefficients are correlated with the average pressure levels if Cdown = 0.5.
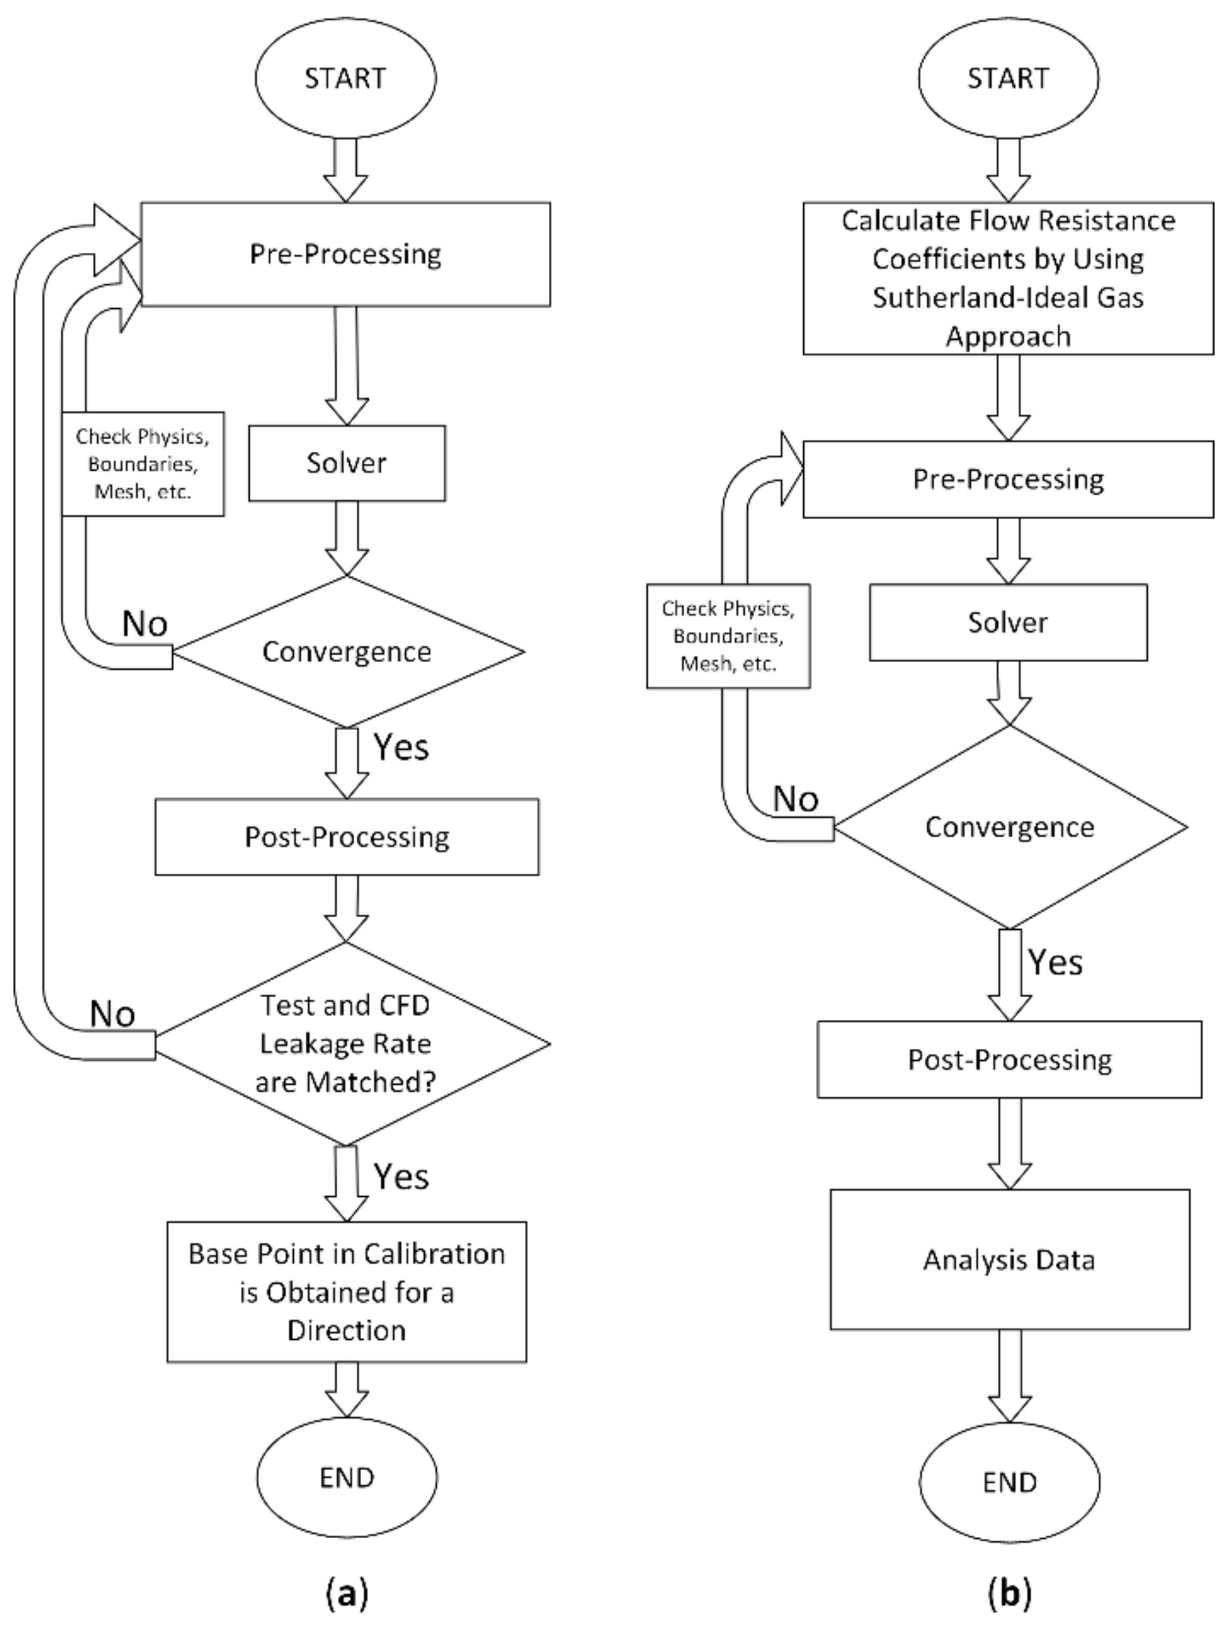
A flowchart that describes the steps of the flow resistance calibration and CFD modelling study is illustrated in Figure 6. Firstly, to reach a base point for each direction, the inertial and viscous resistance coefficients for ΔP = 689.5 kPad (100 psid) were calibrated by matching the test and CFD leakages (Figure 6a). Depending on the value of Cdown, the inertial/viscous flow resistance coefficients were calculated by using the Sutherland-ideal gas approach and test data for each direction of warp, shute, diagonal, and cross. Then, CFD analyses were performed by using these coefficients to determine the best fit with test leakages depending on the Cdown value (Figure 6b).
2.2.4. CFD Model
In order to determine the metallic-cloth fiber flow resistance coefficients that matched with the test leakage, metallic-cloth fiber CFD models were built for each direction of warp, shute, diagonal, and cross. For each direction, CFD analyses were performed with weave flow resistance coefficients calculated by using the Sutherland-ideal gas approach and test data. Then, the CFD leakages were compared with the test leakages.
The CFD model domain and boundary conditions for the in-plane directions of warp, shute, and diagonal are illustrated in Figure 7. The out-of-plane CFD model domain and boundary conditions for the cross flow direction are shown in Figure 8.
CFD analyses were performed using the ANSYS-CFX commercial tool. Upstream and downstream regions were occupied with air flow. The metallic-cloth fiber domain was modelled as the porous medium. The thickness of the metallic-cloth fibers was taken from the tested metallic-cloth fiber sample (0.7 mm).
The CFD modelling details are listed below:
- For in-plane CFD analysis (warp, shute, and diagonal), the CFD model was built in a 3-D cartesian coordinate system (Figure 7). Three cell thicknesses were considered in the third direction. The symmetry boundary conditions were applied on two surfaces to reduce the computational domain and time.
- For the out-of-plane direction of cross flow, a section model with 1° in the 3-D cylindrical coordinate system was used since a circular piece of metallic-cloth fiber was tested in the sample holders (Figure 8).
- The working fluid was air.
- The metallic-cloth fibers were modeled as a porous medium, for which the flow resistance coefficients were prescribed by using the Sutherland-ideal gas approach. The weight and volume of the experimental sample were measured. Then, the porosity was calculated as 0.364 by using the weight, density, and volume of the experimental sample. It was defined to the metallic-cloth fiber domain in CFD analyses.
- Steady-state CFD analyses were performed.
- The flow was compressible and turbulent.
- Static pressure and static temperature values were defined on the inlet boundary. The opening pressure and temperature boundary conditions were utilized for the outlet boundary.
- The smooth wall roughness was defined for static walls. For the smooth wall roughness, the dimensionless sand-grain roughness was between 0 and 5. Adiabatic and no-slip wall conditions were used for the walls. The maximum y+ value reached 5.
- In the porous weave domain, the pressure variation in transverse directions was zero. Therefore, the resistance coefficients were assumed to be isotropic in a CFD analysis for each direction of warp, shute, and diagonal.
- The momentum, mass, and turbulence kinetic energy residuals were set to 10−5 for convergence. Most of the converged CFD cases provided residuals less than 10−8. In some high pressure-ratio CFD cases (Pd/Pu < 0.1), the residuals were between 10−5 and 10−6. For all the CFD cases, several convergence criteria for the velocity, temperature, pressure, turbulence quantities, and inlet and outlet mass flow rates were met.
Five different mesh refinement levels for the warp, shute, and diagonal directions were applied as shown in Table 2. M1 represents the coarsest and M5 is the finest mesh. The number of elements and number of nodes in the height and length directions were changed in order to refine the mesh. The recirculation zones were accurately observed in the M2–M5 meshes. The differences in terms of the leakage rate were higher in M1–M2 and M2–M3. The change in the leakage rate was less than 1% between the M3, M4, and M5 meshes. A similar study was also conducted for the cross direction.
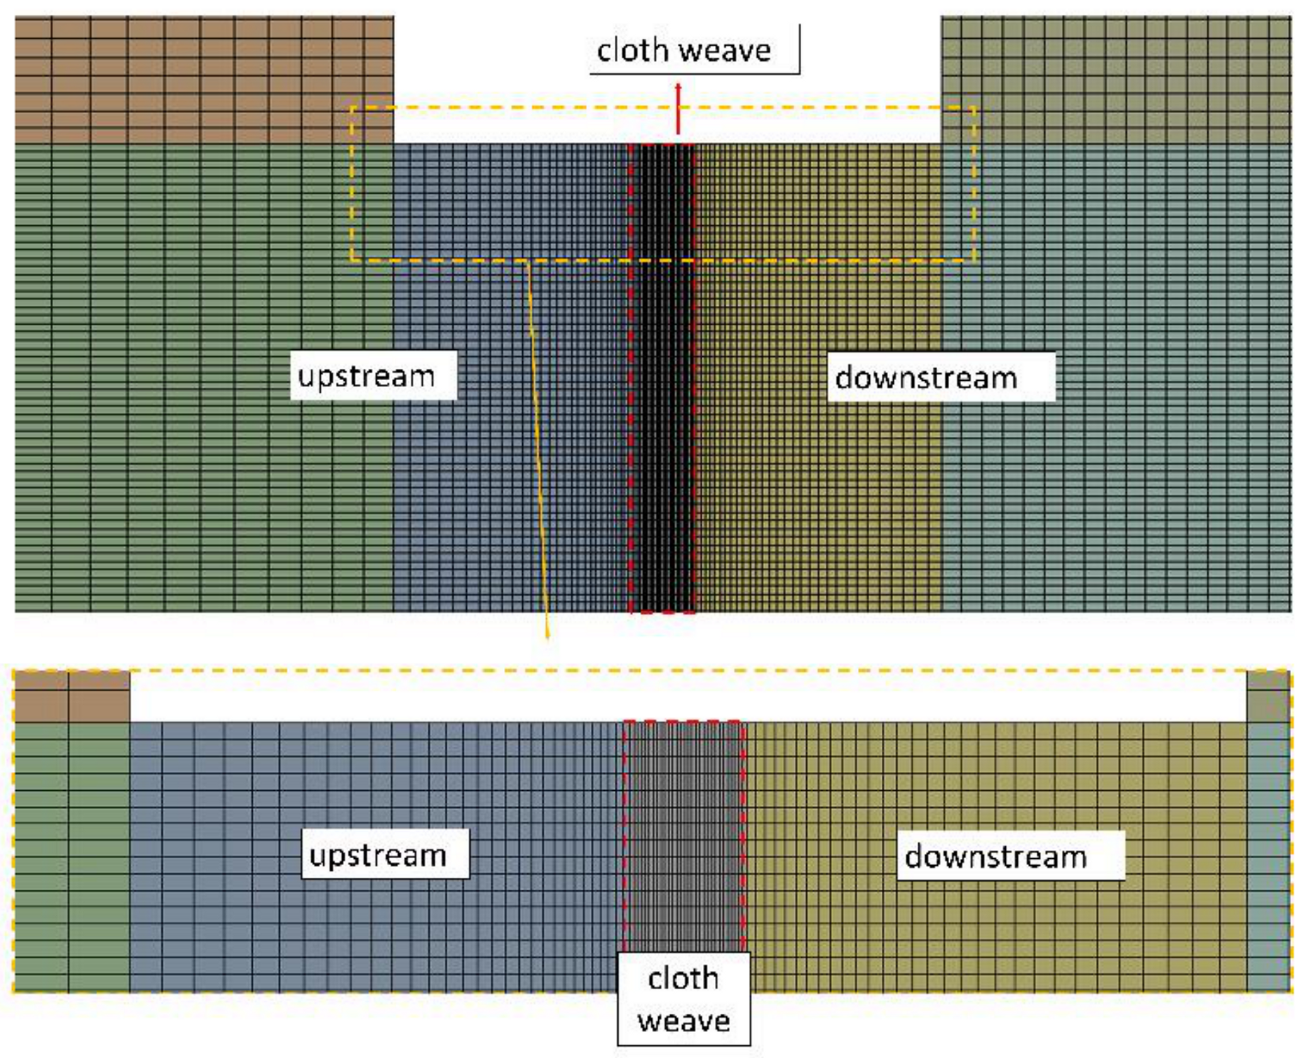
The CFD model for the cross direction included 60,000 hexahedron meshes. The meshes were refined around the metallic-cloth fiber region where the pressure gradients and velocities were high. Since pressure dropped in the metallic-cloth fiber thickness, this thickness had at least 30 meshes in the cross direction. A typical mesh view is shown in Figure 9 and Figure 10 for the in-plane and cross directions, respectively. A similar size of meshes (60,000) was used in all the CFD analyses.
The air flow was assumed to be turbulent and compressible. The reduced Navier–Stokes equations governing the fluid flow in the upstream and downstream regions can be expressed in tensor notation as [33]:
These equations, which express the continuity (Equation (9)), momentum (Equation (10)), and total energy (Equation (12)) equations, respectively, describe the motion of air in both the experimental set up and CFD analysis. In Equation (12), the term represents the work due to viscous stresses, which was neglected. SM represents external momentum sources or sinks acting on the continuum such as gravity, inertial accelerations, and resistive forces. For the porous metallic-cloth fiber domain, the momentum loss through an isotropic porous region (SM in Equation (2)) is added to the right-hand sides of Equations (10) and (12), as an external momentum and energy sink.
2.2.5. Equivalent Gap Calculations
The equivalent gap is a representative gap that decreases with better sealing performance. The equivalent gap is calculated by using the following equations [2,18,34]:
where represents the leakage flow rate, L is the metallic-cloth fiber length, and TU and PU are the upstream temperature and pressure. FF refers to the Flow Function, which is calculated as shown below:
For an unchoked flow:
For a choked flow:
where g is the gravitational acceleration, γ is the specific heat ratio, R is the gas constant, and PR is the pressure ratio.
3. Results and Discussion
The metallic-cloth fiber leakage in the four directions of warp, shute, diagonal, and cross were measured in the test rig. The flow resistance coefficients for porous weave were calculated by using the Sutherland-ideal gas approach. CFD models were run by utilizing these flow resistance coefficients. The results were evaluated in terms of the leakages obtained from the tests and CFD analyses.
3.1. Leakage Tests
Leakage–pressure drop graphs for the warp, shute, diagonal, and cross directions are shown in Figure 11a–d, respectively.
For each direction, the tests were repeated for three upward and downward cycles while increasing and decreasing the pressure difference. The pressure difference over the metallic-cloth fibers was adjusted between 68.9 and 758.4 kPad (10–110 psid) with 68.9 kPad (10 psid) increments. Thus, eleven leakage test points were obtained for each test.
The leakage values were normalized by dividing the leakage of the cross direction at the maximum pressure load of 758.4 kPad (110 psid)’s pressure drop. Figure 11a–d indicate that the leakage measurements were very close to each other for the three test cycles, while the warp direction showed some deviation.
Leakage, first of all, had a linear increasing variation with pressure load for all the metallic-cloth fiber directions. Metallic-cloth fiber leakage was dependent on the pressure load. The average leakage values of three cycles were used in the Sutherland-ideal gas approach and calibration of the resistance coefficients in the CFD analyses.
In order to compare the leakage performance in all the metallic-cloth fiber directions, the parameter of the equivalent gap was employed. Since the areas exposed to leakage flow were different for each metallic-cloth fiber direction, equivalent gap values were calculated and normalized with respect to the weave thickness for the in-plane directions of warp, shute, and diagonal. The normalization was performed by using the flow area for the cross direction.
The flow performance in the warp, shute, diagonal, and cross directions in terms of the normalized equivalent gap are plotted and compared in Figure 12. The present test results are plotted with solid lines, while Dinc et al.’s data [1], which include several weave densities, are plotted with dashed, dotted, and dot-dashed lines. The boundary conditions of the present study and literature are tabulated in Table 3. The present test also included the cross direction and extended the test data for higher pressure ratios.
The test results in Figure 12 indicate that the best leakage performance in terms of the normalized equivalent gap was in the warp direction, followed by the diagonal, shute, and cross directions. These directional best sealing results are compatible with Dinc et al.’s study [1]. Similar to the leakage results for different metallic-cloth fiber densities [1], metallic-cloth fiber leakage is dependent on the pressure load.
While comparing the present test data with Dinc et al.’s data [1], it should be noticed that the weave densities were different for the warp and shute directions. The difference between the present test data and Dinc et al.’s data [1] are minimal for the same weave density (30 × 250) in the diagonal direction, while the present tests measured higher leakages for the warp and shute directions. This could be attributed to the weave density, as the main parameter.
The cross direction had the highest normalized equivalent gap; therefore, it was the worst direction in terms of leakage performance. The normalized equivalent gap for the cross direction was 2–4 times higher than that for the in-plane directions (warp, shute, and diagonal).
As a result, the leakage rate was at a minimum if the flow was in the warp direction. The leakage test results point out that, for the best sealing performance, the metallic-cloth fibers in the cloth seal geometry should be aligned in such a way that the flow direction is in the warp direction. The weave alignment depends on the engine location and working conditions that dictate the flow over the cloth seal.
For all the weave directions, the leakage was also calculated by using porous weave CFD analyses, which are presented below.
3.2. CFD Analyses and Calibration of Metallic-Cloth Fiber Flow Resistance Coefficients
In order to determine the metallic-cloth fiber flow resistance coefficients that matched with the test leakage, metallic-cloth fiber CFD models were built for each direction of warp, shute, diagonal, and cross. For each direction, CFD analyses were performed with weave flow resistance coefficients calculated by using the Sutherland-ideal gas approach and test data. Then, the CFD leakages were compared with the test leakages.
CFD analyses were run under test conditions by using the Sutherland-ideal gas approach. In the calibration of the metallic-cloth fiber flow resistance coefficients, test data at the minimum and maximum pressure loads were excluded, to stay in the minimal test noise range. Thus, the CFD analyses were performed at nine points between ΔP = Pu − Pd = 137.9 and 689.5 kPad (20–100 psid) with 68.9 kPad (10 psid) increments. The ambient temperature was defined on the upstream side, which was measured during the tests.
In comparing the test and CFD leakages, the leakages were normalized by dividing the leakage of the cross direction at the maximum pressure load of 758.4 kPad (110 psid).
All the tests and CFD leakages are compared in Figure 13 for all four directions of warp, shute, diagonal, and cross.
At first, to obtain a base point in the calibration, the inertial and viscous resistance coefficients for ΔP = 689.5 kPad (100 psid) were calibrated by matching the test and CFD leakages.
In the calibration, the CFD analyses utilized the Sutherland-ideal gas approach as stated in Equations (1)–(8). It should be kept in mind that the inertial resistance coefficient varies with pressure and temperature (Equation (3)), whereas the viscous resistance coefficient is only a function of temperature (Equation (4)). In the tests and CFD analyses, the temperature was observed to be nearly constant. That is, the resistance coefficients changed depending on the evaluation of the pressure level, which varied over the weave flow thickness. This was represented with the pressure constant (Cdown) as stated in Equations (7) and (8). Therefore, the CFD analyses were repeated for a range of pressure constants Cdown = 0.5–1.0 for in-plane directions and Cdown = 0.0–1.0 for the cross direction, with 0.1 increments, to determine the best leakage match with the test data.
Figure 13 includes the whole range of pressure constant values for all weave directions.
For the warp and shute directions, the best match between the test and CFD leakages was obtained for Cdown = 0.9, at which the leakage difference between the test and CFD was less than 10% for all pressure loads of ΔP = 137.9–689.5 kPad (20–100 psid).
For the diagonal direction, Cdown = 0.7 gave the minimum leakage difference of 10%.
For the cross direction, Cdown = 0.0 provided the best leakage agreement with the tests, yielding a 0.03% difference.
Thus, the best Cdown values are listed below:
| • Warp | 0.9; |
| • Shute | 0.9; |
| • Diagonal | 0.7; |
| • Cross | 0.0. |
All these tests and this CFD work show that the use of a different set of porous resistance coefficients for different pressure load cases provides better leakage agreement. The result is compatible with the study of Chen et al. [35]. They emphasized that resistance coefficients are related to pressure load.
Flow formation within the weave was visualized by plotting pressure contours, velocity magnitudes, streamlines, and vectors in Figure 14, Figure 15, Figure 16 and Figure 17 for the warp, shute, diagonal, and cross directions, respectively. The pressure was almost constant, except for metallic-cloth fibers, as shown in Figure 14a, Figure 15a, Figure 16a and Figure 17a. The change in color shows that a pressure drop occurred in the region of the metallic-cloth fibers. The pressure gradually reduced through the metallic-cloth fibers from the upstream side to the downstream side. In the metallic-cloth fiber region, the pressure was constant in the radial directions. This supports the assumption that pressure gradients are zero in radial directions, and the values of resistance coefficients in radial directions are not important.
The flow property plots show that the flow is smoothly directed through the region of metallic-cloth fibers from the upstream side for both the in-plane and cross directions, in Figure 14b–d, Figure 15b–d, Figure 16b–d and Figure 17b–d. The figures are mostly plotted with 10 intervals. The diffusing flow into the metallic-cloth fibers accelerated through the cloth weave in the axial direction. The velocity vectors show that the flow strongly moved in the axial direction, and the radial velocity was almost zero in the porous region. Then, the flow extended to the downstream region. The flow velocity reached its maximum value at the downstream side due to expansion. Some recirculation zones formed in the up/downstream regions. The flow velocity distributions were similar in the in-plane directions of warp, shute, and diagonal.
In addition, Figure 18 illustrates the normalized pressure within the porous metallic-cloth fibers in the flow direction. The pressure was normalized with respect to the up/downstream pressures as in p* = (P–Pd)/(Pu–Pd), while the flow direction was normalized with the weave thickness as in z* = z/t. It should be noted that the weave thickness in the flow direction was t = 20 mm for the in-plane directions, while it was t = 0.7 mm for the cross direction.
Figure 18 shows that the pressure gradually dropped over the weave thickness. The pressure variation with the weave thickness is well represented with a polynomial function, at least in the second order. Most of the pressure drop occurred at the downstream side. Of the pressure load, 50% dropped in the first 70% of the weave thickness. Thus, the last 30% of the weave thickness was subject to a 50% pressure drop.
4. Conclusions
Metallic-cloth fiber leakage tests were carried out in the four weave directions of warp, shute, diagonal, and cross. The flow resistance coefficients for flow within the porous metallic-cloth fibers were calculated and calibrated by using the Sutherland-ideal gas approach. A CFD model was built for four weave directions, and analyses were run to determine the best set of flow resistance coefficients. All this work was performed for Dutch twill type metallic-cloth fibers with a 30 × 250 weave density per inch. Some outlines are summarized below.
- Leakage Tests
The leakage test results point out that, for the best sealing performance, the metallic-cloth fibers in the cloth seal geometry should be aligned in such a way that the flow direction is in the warp direction. The weave alignment depends on the engine location and working conditions that dictate the flow over the cloth seal. The conclusions from the leakage tests are listed below:
- The leakage tests show that the metallic-cloth fiber leakage is a linear function of pressure load for all the directions.
- The best–worst order for leakage performance in terms of the normalized equivalent gap was the warp, diagonal, shute, and cross directions.
- The cross direction had the highest normalized equivalent gap; therefore, it was the worst direction in terms of leakage performance. The normalized equivalent gap for the cross direction was 2–4 times higher than that for the in-plane directions (warp, shute, and diagonal).
- The leakage rate was at a minimum if the flow was in the warp direction.
- Metallic-Cloth Fiber Flow Resistance Coefficients
In order to determine the metallic-cloth fiber flow resistance coefficients that matched with the test leakage, metallic-cloth fiber CFD models were built for each direction of warp, shute, diagonal, and cross. For each direction, CFD analyses were performed, with the weave flow resistance coefficients calculated by using the Sutherland-ideal gas approach and test data. The flow resistance coefficients depend on the evaluation of the pressure level, which changes over the weave flow thickness. This is represented with the pressure constant (Cdown). Therefore, the CFD analyses were repeated for a range of pressure constants Cdown = 0.5–1.0 for the in-plane directions and Cdown = 0.0–1.0 for the cross direction, with 0.1 increments, to determine the best leakage match with the test data. The results of this study provide an estimation of the flow resistance coefficients in turbine operating conditions. Therefore, the efficiency of the cloth seal is predicted with the CFD analyses. The conclusions of the metallic-cloth fiber flow resistance coefficient study are listed below:
- For the warp and shute directions, the best match between the test and CFD leakages was obtained for Cdown = 0.9, at which the leakage difference between the test and CFD was less than 10% for all pressure loads of ΔP = 137.9–689.5 kPad (20–100 psid).
- For the diagonal direction, Cdown = 0.7 provided the minimum leakage difference of 10%.
- For the cross direction, Cdown = 0.0 provided the best leakage agreement, with the tests yielding a 0.03% difference.
- Flow Behavior
Flow formation within the weave was visualized by plotting the pressure and velocity fields. The pressure gradually dropped over the weave thickness. The pressure variation with the weave thickness is well represented with a polynomial function, at least in the second order. The conclusions are listed below:
- Most of the pressure drop occurred at the downstream side.
- The flow property plots show that the flow was smoothly directed through the region of metallic-cloth fibers from the upstream side for the in-plane directions.
- The flow velocity reached its maximum value at the downstream side due to expansion.
- Future Work
The porous medium approach for metallic-cloth fibers represents a good correlation when the flow resistance coefficients are calibrated. Further improvements are needed to investigate and correlate the flow resistance coefficients as a function of weave geometry (warp diameter, shute diameter, and weave density) by performing additional tests and analyses. One limitation of this study is that the test rig was not designed to change operating temperature. This needs to be improved in the future studies. The flow resistance coefficients of the metallic-cloth fibers can be calibrated with respect to the porosity and length of the weave by using the Ergun equation [36] if the equivalent spherical diameter is determined.
Author Contributions
Conceptualization, E.G. and Y.D.; methodology, E.G. and Y.D.; software, E.G.; validation, E.G., Y.D., and M.F.A.; formal analysis, E.G.; investigation, E.G. and Y.D.; data curation, E.G.; writing—original draft preparation, E.G.; writing—review and editing, Y.D. and M.F.A.; supervision, Y.D. and M.F.A.; project administration, Y.D.; funding acquisition, E.G. and M.F.A. All authors have read and agreed to the published version of the manuscript.
Funding
This research received no external funding.
Acknowledgments
This work was supported by “SDM Research & Development Company”, Istanbul, Turkey.
Conflicts of Interest
The authors declare no conflict of interest.
Appendix A
- Uncertainty Analysis
The Type A and Type B uncertainty levels for the metallic-cloth fiber leakage tests were studied. The Type A levels were obtained from the repeated measurement results. In addition to the uncertainty of the sensor measurements, Type A also depends on the transient effects coming from the compressor and test conditions. Therefore, it varies with respect to the pressure drop level. A lower Type A uncertainty means less impact due to oscillations.
The arithmetic mean of n results () is expressed in terms of the measurements (xa) and number of measurements (n). The standard deviation (s) was calculated with respect to the variance and number of measurements. The Type A uncertainty (uA) was obtained from the equation expressed below:
Uncertainty calculations without the use of repeated measurements are named Type B uncertainty. For a rectangular distribution, the Type B uncertainty (uB) was calculated from a semi-range between the upper and lower limits (a) of the flowmeter.
The combined uncertainty (uC) was calculated by squaring the Type A and Type B uncertainties, after that, adding them to each other, and then taking the square root of the overall result.
The combined uncertainty provides the uncertainty level equivalent to one standard deviation (68% level of confidence). To raise the level of confidence, the combined uncertainty was multiplied by a coverage factor (k), and this provided the expanded uncertainty. In this study, k = 3 for a confidence level of 99.7%.
The uncertainty levels for the warp, shute, diagonal, and cross direction leakage tests are illustrated in Figure A1 for 68.9–758.4 kPad (10–110 psid) pressure differences. The calculated uncertainties were divided by the arithmetic mean of six corresponding pressure drop leakage results. The Type B/average leakage was dependent on the accuracy of the flowmeter; therefore, it was constant for all cases. The Type A/average leakage varied with respect to the variance between the measurements. The combined and expanded uncertainties followed a similar trend as the Type A uncertainty. The expanded uncertainty/average leakage (k = 3, for a confidence level of 99.7%) was equal to or less than 10% for all the tested cases. The uncertainty analysis addressed random measurement errors due to the compressor, dryer, test rig, etc. No correlation between the error rate and pressure drop level was found.
Figure A1.
Uncertainty analyses for metallic-cloth fiber leakage tests: (a) warp direction, (b) shute direction, (c) diagonal direction, and (d) cross direction.
Figure A1.
Uncertainty analyses for metallic-cloth fiber leakage tests: (a) warp direction, (b) shute direction, (c) diagonal direction, and (d) cross direction.

References
- Dinc, O.S.; Bagepalli, B.S.; Wolfe, C.; Aksit, M.F.; Calabrese, S. A new metal cloth stationary seal for gas turbine applications. In Proceedings of the 33rd AIAA/ASME/SAE/ASEE Joint Propulsion Conference, Seattle, WA, USA, 6–9 July 1997. AIAA Paper 97-2732. [Google Scholar] [CrossRef]
- Aksit, M.F.; Bagepalli, B.S.; Demiroglu, M.; Dinc, O.S.; Kellock, I.; Farell, T. Advanced flexible seals for gas turbine shroud applications. In Proceedings of the 35th AIAA/ASME/SAE/ASEE Joint Propulsion Conference & Exhibit, Los Angeles, CA, USA, 20–24 June1999. [Google Scholar] [CrossRef]
- Aksit, M.F.; Bagepalli, B.S.; Burns, J.; Stevens, P.; Vehr, J. Parasitic Corner Leakage Reduction in Gas Turbine Nozzle-Shroud Inter-Segment Locations. In Proceedings of the 37th AIAA/ASME/SAE/ASEE Joint Propulsion Conference & Exhibit, Salt Lake City, UT, USA, 8–11 July 2001. [Google Scholar] [CrossRef]
- Ongun, R.; Aksit, M.F.; Goktug, G. A simple model for wear of metal cloth seals. In Proceedings of the 40th AIAA/SAE/ASME/ASEE Joint Propulsion Conference & Exhibit, AIAA-2004-3892, Fort Lauderdale, FL, USA, 11–14 July 2004. [Google Scholar] [CrossRef]
- Dogu, Y. Investigation of Brush Seal Flow Characteristics Using Bulk Porous Medium Approach. J. Eng. Gas. Turbines Power 2005, 127, 136–144. [Google Scholar] [CrossRef]
- Amaki, K.; Hasegawa, T.; Narumi, T. Drag Reduction in the Flow of Aqueous Solutions of Detergent Through Mesh Screens. Nihon Reoroji Gakkaishi 2008, 36, 125–131. [Google Scholar] [CrossRef] [Green Version]
- Kolodziej, A.; Lojewska, J. Experimental and Modelling Study on Flow Resistance of Wire Gauzes. Chem. Eng. Process 2009, 48, 816–822. [Google Scholar] [CrossRef]
- Yoshida, Y.; Inoue, Y.; Shimosaka, A.; Shirakawa, Y.; Hidaka, J. Effect of Aperture Structure of Dutch Weave Mesh on Flow Resistivity. J. Chem. Eng. Jpn. 2015, 48, 730–741. [Google Scholar] [CrossRef] [Green Version]
- Chupp, R.E.; Hendricks, R.C.; Lattime, S.B.; Steinetz, B.M.; Aksit, M.F. Turbomachinery Clearance Control. Turbine Aerodynamics, Heat Transfer, Materials, and Mechanics; AIAA: Reston, VA, USA, 2007; pp. 61–188. [Google Scholar] [CrossRef] [Green Version]
- Bagepalli, B.S.; Aksit, M.F.; Farell, T.R. Gas-path Leakage Seal for a Turbine. US Patent No. US5934687, 10 August 1999. [Google Scholar]
- Paprotna, H.E.; Morrision, M.J. Biased Wear Resistant Turbine Seal Assembly. US Patent No. US6733234B2, 11 May 2004. [Google Scholar]
- McMahan, K.W.; Demiroglu, M.; Repikov, T.R. Spring Loaded Seal Assembly for Turbines. US Patent No. US8398090B2, 19 March 2013. [Google Scholar]
- Samudrala, O.; Sarawate, N.N. Cloth Seal for Turbo-Machinery. US Patent No. US8613451B2, 24 December 2013. [Google Scholar]
- Riggi, V.T.; Monshower, B.; Hyslop, J.D. Brazed Turbine Seal. US Patent No. US8696309B2, 15 April 2014. [Google Scholar]
- Sarawate, N.N.; Morgan, V.J.; Weber, D.W. Layered Seal for Turbomachinery. US Patent No. US9188228B2, 17 November 2015. [Google Scholar]
- Chupp, R.E.; Hendricks, R.C.; Lattime, S.B.; Steinetz, B.M. Sealing in Turbomachinery. In Proceedings of the NASA/TM-2006-214341; NASA: Cleveland, OH, USA, 2006. [Google Scholar] [CrossRef]
- Aksit, M.F.; Bagepalli, B.S.; Aslam, S. High performance combustor cloth seals. In Proceedings of the 36th AIAA/ASME/SAE/ASEE Joint Cleveland, Ohio Propulsion Conference & Exhibit, Huntsville, AL, USA, 16–19 July 2000. [Google Scholar]
- Gorgun, E.; Aksit, M.F.; Dogu, Y. A Study of Cloth Seal Leakage Performance Based on Geometry and Pressure Load. Energies 2020, 13, 5884. [Google Scholar] [CrossRef]
- Archard, J.F. Contact and rubbing of flat surfaces. J. Appl. Phys. 1953, 24, 981. [Google Scholar] [CrossRef]
- Archard, J.F.; Hirst, W. The wear of metals under unlubricated conditions. Proc. R. Soc. 1956, 236, 397–410. [Google Scholar]
- May, D.; Aktas, A.; Advani, S.G.; Berg, D.C.; Endruweit, A.; Fauster, E.; Lomov, S.V.; Long, A.; Mitschang, P.; Abaimov, S.; et al. In-Plane Permeability Characterization of Engineering Textiles Based on Radial Flow Experiments: A Benchmark Exercise. Compos. Part A Appl. Sci. Manuf. 2019, 121, 100–114. [Google Scholar] [CrossRef]
- Fauster, E.; Berg, D.C.; May, D.; Blobl, Y.; Schledjewski, R. Robust evaluation of flow front data for in-plane permeability characterization by radial flow experiments. Adv. Manuf. Polym. Compos. Sci. 2018, 4, 24–40. [Google Scholar] [CrossRef] [Green Version]
- Liu, X.; Ding, X.; Chen, C.; An, R.; Guo, W.; Zhang, W.; Nan, H.; Yi Wang, Y. Investigating the filtration behavior of metal fiber felt using CFD-DEM simulation. Eng. Appl. Comput. Fluid Mech. 2019, 13, 426–437. [Google Scholar] [CrossRef] [Green Version]
- Yeo, A.P.S.; Law, A.W.K.; Fane, A.G. Factors affecting the performance of a submerged hollow fiber bundle. J. Membr. Sci. 2006, 280, 969–982. [Google Scholar] [CrossRef]
- Ma, C.; Liu, Y.; Li, F.; Shen, C.; Huang, M.; Wang, Z.; Cao, C.; Zhou, Q.; Sheng, Y.; Sand, W. CFD simulations of fiber-fiber interaction in a hollow fiber membrane bundle: Fiber distance and position matters. Sep. Purif. Technol. 2019, 209, 707–713. [Google Scholar] [CrossRef]
- Dogu, Y.; Bahar, A.S.; Sertcakan, M.C.; Piskin, A.; Arican, E.; Kocagul, M. Computational fluid dynamics investigation of brush seal leakage performance depending on geometric dimensions and operating conditions. J. Eng. Gas. Turbines Power 2016, 138, 032506. [Google Scholar] [CrossRef]
- Li, J.; Qiu, B.; Feng, Z. Experimental and numerical investigations on the leakage flow characteristics of the labyrinth brush seal. J. Eng. Gas Turbines Power 2012, 134, 102509. [Google Scholar] [CrossRef]
- Li, J.; Obi, S.; Feng, Z. The effects of clearance sizes on labyrinth brush seal leakage performance using a Reynolds-averaged Navier-Stokes solver and non-Darcian porous medium model. Proc. Inst. Mech. Eng. Part A J. Power Energy 2009, 223, 953–964. [Google Scholar] [CrossRef]
- Ward, H.A.; Adam, I.G.; Salem, A.B.; Gamaleldin, M.W. Integral pumping rings for dual mechanical seals: Hydraulic performance evaluation using numerical simulations. Eng. Appl. Comput. Fluid Mech. 2020, 14, 923–938. [Google Scholar] [CrossRef]
- Hur, M.S.; Lee, S.I.; Moon, S.W.; Kim, T.S.; Kwak, J.S.; Kim, D.H.; Jung, I.Y. Effect of Clearance and Cavity Geometries on Leakage Performance of a Stepped Labyrinth Seal. Processes 2020, 8, 1496. [Google Scholar] [CrossRef]
- Dogu, Y.; Aksit, M.F.; Bagepalli, B.; Burns, J.; Sexton, B.; Kellock, I. Thermal and flow analysis of cloth-seal in slot for gas turbine shroud applications. In Proceedings of the 34th AIAA/ASME/SAE/ASEE Joint Propulsion Conference and Exhibit, Cleveland, OH, USA, 13–15 July 1998. [Google Scholar] [CrossRef]
- Sutherland, W. The viscosity of gases and molecular force. Philos. Mag. 1893, 36, 507–531. [Google Scholar] [CrossRef] [Green Version]
- ANSYS. ANSYS CFX-Solver Theory Guide; Version 14; ANSYS: Canonsburg, PA, USA, 2011. [Google Scholar]
- Crudgington, P.F. Brush Seal Performance Evaluation. In Proceedings of the 34th AIAA/ASME/SAE/ASEE Joint Propulsion Conference and Exhibit, Cleveland, OH, USA, 13–15 July 1998. [Google Scholar]
- Chen, L.H.; Wood, P.E.; Jones, T.V.; Chew, J.W. An Iterative CFD and Mechanical Brush Seal Model and Comparison with Experimental Results. J. Eng. Gas. Turbines Power 1999, 121, 656–662. [Google Scholar] [CrossRef]
- Ergun, S. Fluid flow through packed columns. Chem. Eng. Prog. 1952, 48, 89–94. [Google Scholar]
Figure 1.
Stationary seal locations in a gas turbine stator.

Figure 2.
Schematic of a typical cloth seal application in a gas turbine.

Figure 3.
Woven fiber options: (a) Plain weave; (b) Plain Dutch weave; (c) Dutch Twill weave; (d) Stranded weave.
Figure 3.
Woven fiber options: (a) Plain weave; (b) Plain Dutch weave; (c) Dutch Twill weave; (d) Stranded weave.

Figure 4.
Metallic-cloth fibers and flow directions.

Figure 5.
Schematic of test setup.

Figure 6.
Flowchart describes the steps for (a) base point and (b) Computational Fluid Dynamics (CFD) cases for different pressure loads.
Figure 6.
Flowchart describes the steps for (a) base point and (b) Computational Fluid Dynamics (CFD) cases for different pressure loads.

Figure 7.
CFD model domain and boundary conditions for in-plane directions of warp, shute, and diagonal.
Figure 7.
CFD model domain and boundary conditions for in-plane directions of warp, shute, and diagonal.

Figure 8.
CFD model domain and boundary conditions for cross direction.

Figure 9.
Mesh views for in-plane directions of warp, shute, and diagonal.

Figure 10.
Mesh views for cross direction.

Figure 11.
Metallic-cloth fiber leakage test results: (a) warp direction, (b) shute direction, (c) diagonal direction, and (d) cross direction.
Figure 11.
Metallic-cloth fiber leakage test results: (a) warp direction, (b) shute direction, (c) diagonal direction, and (d) cross direction.

Figure 12.
Comparison of metallic-cloth fiber flow performance for all directions of warp, shute, diagonal, and cross.
Figure 12.
Comparison of metallic-cloth fiber flow performance for all directions of warp, shute, diagonal, and cross.

Figure 13.
Comparison of CFD and test results for various pressure constant (Cdown) values: (a) warp direction, (b) shute direction, (c) diagonal direction, and (d) cross direction.
Figure 13.
Comparison of CFD and test results for various pressure constant (Cdown) values: (a) warp direction, (b) shute direction, (c) diagonal direction, and (d) cross direction.

Figure 14.
CFD results for warp direction (Cdown = 0.9, ΔP = 137.9 kPad): (a) pressure contours, (b) velocity magnitude contours, (c) velocity streamlines, and (d) velocity vectors.
Figure 14.
CFD results for warp direction (Cdown = 0.9, ΔP = 137.9 kPad): (a) pressure contours, (b) velocity magnitude contours, (c) velocity streamlines, and (d) velocity vectors.

Figure 15.
CFD results for shute direction (Cdown = 0.9, ΔP = 137.9 kPad): (a) pressure contours, (b) velocity magnitude contours, (c) velocity streamlines, and (d) velocity vectors.
Figure 15.
CFD results for shute direction (Cdown = 0.9, ΔP = 137.9 kPad): (a) pressure contours, (b) velocity magnitude contours, (c) velocity streamlines, and (d) velocity vectors.

Figure 16.
CFD results for diagonal direction (Cdown = 0.7, ΔP = 137.9 kPad): (a) pressure contours, (b) velocity magnitude contours, (c) velocity streamlines, and (d) velocity vectors.
Figure 16.
CFD results for diagonal direction (Cdown = 0.7, ΔP = 137.9 kPad): (a) pressure contours, (b) velocity magnitude contours, (c) velocity streamlines, and (d) velocity vectors.

Figure 17.
CFD results of cross direction (Cdown = 0.0, ΔP = 137.9 kPad): (a) pressure contours, (b) velocity magnitude contours, (c) velocity streamlines, and (d) velocity vectors.
Figure 17.
CFD results of cross direction (Cdown = 0.0, ΔP = 137.9 kPad): (a) pressure contours, (b) velocity magnitude contours, (c) velocity streamlines, and (d) velocity vectors.

Figure 18.
Normalized pressure within the porous metallic-cloth fibers in the flow direction (normalized weave thickness (z*) vs. normalized pressure (p*)).
Figure 18.
Normalized pressure within the porous metallic-cloth fibers in the flow direction (normalized weave thickness (z*) vs. normalized pressure (p*)).


Table 1.
Specifications of Haynes 25 material at room temperature.
| Material Property | Value |
|---|---|
| Nominal composition (weight percentage) | Cobalt (51%), nickel (10%), iron (3% max.), chromium (20%), molybdenum (1% max.), tungsten (15%), manganese (1.5%), silicon (0.4% max), carbon (0.1%) |
| Density | 9.07 g/cm3 |
| Melting range | 1330–1410 °C |
| Thermal conductivity | 10.5 W/m- °C |
| Specific heat | 403 J/kg- °C |
| Dynamic modulus of elasticity | 225 GPa |
| Ultimate tensile strength | 1015 MPa |
Table 2.
The details of the mesh dependence study for in-plane directions.
| Mesh Details | M1 | M2 | M3 | M4 | M5 |
|---|---|---|---|---|---|
| Number of elements | 40,000 | 50,000 | 60,000 | 80,000 | 100,000 |
| Number of nodes in height direction (metallic-cloth fiber region) | 15 | 17 | 20 | 24 | 30 |
| Number of nodes in length direction (metallic-cloth fiber region) | 120 | 140 | 160 | 180 | 200 |
Table 3.
Boundary conditions of leakage tests.
| Property | Present Study | Dinc et al. Study [1] |
|---|---|---|
| Temperature | Room temperature | Room temperature |
| Pressure ratio | 0.12–0.42 | 0.07–0.25 |
| Fluid | Air | Air |
Publisher’s Note: MDPI stays neutral with regard to jurisdictional claims in published maps and institutional affiliations. |
© 2020 by the authors. Licensee MDPI, Basel, Switzerland. This article is an open access article distributed under the terms and conditions of the Creative Commons Attribution (CC BY) license (http://creativecommons.org/licenses/by/4.0/).
Share and Cite
MDPI and ACS Style
Gorgun, E.; Dogu, Y.; Aksit, M.F. Investigation of Flow Behavior and Porous Medium Resistance Coefficients for Metallic-Cloth Fibers. Fibers 2020, 8, 75. https://0-doi-org.brum.beds.ac.uk/10.3390/fib8120075
AMA Style
Gorgun E, Dogu Y, Aksit MF. Investigation of Flow Behavior and Porous Medium Resistance Coefficients for Metallic-Cloth Fibers. Fibers. 2020; 8(12):75. https://0-doi-org.brum.beds.ac.uk/10.3390/fib8120075
Chicago/Turabian StyleGorgun, Erdem, Yahya Dogu, and Mahmut Faruk Aksit. 2020. "Investigation of Flow Behavior and Porous Medium Resistance Coefficients for Metallic-Cloth Fibers" Fibers 8, no. 12: 75. https://0-doi-org.brum.beds.ac.uk/10.3390/fib8120075
Note that from the first issue of 2016, this journal uses article numbers instead of page numbers. See further details here.