
Natural-Fibrous Lime-Based Mortar for the Rapid Retrofitting of Heritage Masonry Buildings


1
Department of Civil, Construction and Environmental Engineering, University of L’Aquila, 67100 L’Aquila, Italy
2
Department of Civil, Environmental and Chemical Engineering, University of Genoa, 16145 Genoa, Italy
*
Author to whom correspondence should be addressed.
Fibers 2021, 9(11), 68; https://0-doi-org.brum.beds.ac.uk/10.3390/fib9110068
Submission received: 19 July 2021
/
Revised: 25 September 2021
/
Accepted: 15 October 2021
/
Published: 30 October 2021
(This article belongs to the Special Issue Sustainable High Performance Fiber-Reinforced Cementitious Composites (HPFRCCs) and Fiber-Reinforced Polymers (FRPs))
Abstract
:The present work aims to define the mechanical behavior of a new composite material for the preservation and enhancement of the vast historical and architectural heritage particularly vulnerable to environmental and seismic actions. The new composite represents a novelty in the landscape of the fibrous mortars and consists of natural hydraulic lime (NHL)-based mortar, strengthened by Sisal short fibers randomly oriented in the mortar matrix. The developed mortar ensures the chemical-physical compatibility with the original features of the historical masonry structures (especially in stone and clay) aiming to pursue the effectiveness and durability of the intervention. The use of vegetal fibers (i.e., the Sisal one) is an exciting challenge for the construction industry considering that they require a lower level of industrialization for their processing, and therefore, their costs are considerably lower, as compared to the most common synthetic/metal fibers. Samples of Sisal-composite are tested in three-point bending, aiming to estimate both their bending stress and fracture energy. Tensile and compressive tests were also performed on the composite samples, while water retention and slump test were performed on the fresh mix. At last, the tensile tests on the Sisal strand were performed to evaluate the tensile stress of both strand and wire. An original mechanical interpretation is proposed to explain two interesting phenomena that arose from the analysis of experimental data. The comparison among the performances of unreinforced and reinforced mortar suggests that the use of short fibers is recommendable as coating in the retrofitting interventions alternatively to the long uni or bi-directional fiber strands adopted in the classic fibrous reinforcement (i.e., FRCM). The proposed composite also ensures mix-independent great workability, excellent ductility, and strength, and it can be considered a promising alternative to the classic fiber-reinforcing systems. As final remarks, the use of fiber F1 (length of 24 mm) with respect to fiber F2 (length of 13 mm) is more recommendable in the retrofitting interventions of historical buildings, ensuring higher strength and/or ductility for the composite.

1. Introduction
Masonry structures constitute a significant part of the most important existing historical and artistic property heritage around the world. These structures are particularly vulnerable to environmental and seismic actions, as highlighted during recent calamities (e.g., Kashmir 2005, L’Aquila 2009, Christchurch 2011, Emilia 2012, Amatrice 2016). Under earthquake excitation, masonry structures are subjected to multi-directional ground motions, which causes in-plane and out-of-plane loads and eventually provokes their collapse [1,2,3,4,5,6,7,8]. In the last decade, there has been a growing demand in protecting masonry heritages because of decades of studies and investments in this field as well as the necessity to maintain and to pass them on to future generations.
Nowadays, fiber-based strengthening systems are commonly adopted for the repair and reinforcement of historic masonry structures as an alternative to traditional systems (i.e., reinforced drilling or steel-reinforced concrete plaster). Despite the development of the fiber-based strengthening system, which began in the 1960s [9], this technology has been commonly adopted for masonry only in the last decade because of the increasingly strict rules required by conservation committees for heritage preservation. Indeed, the efficiency of the strengthening system is now required in combination with low invasiveness of the strengthening solution and high compatibility with the original structures.
Among modern and innovative intervention techniques on existing structures, composite materials, such as Fiber Reinforced Polymers (FRP) [10], Fiber Reinforced Cementitious Matrix (FRCM) [11,12], or Texture Reinforced Mortar (TRM) [13,14], have been increasingly considered for the strengthening of both modern and historic masonry constructions - such as buildings, bridges, towers - and individual structural components, such as walls, arches and vaults, pillars and columns. These technologies comprise the use of composites material characterized by the location of fibers along one or two main direction, mutually orthogonal. These materials have proven their effectiveness in increasing the load-carrying capacity of masonry elements and improving their strength through a reduction of critical brittle failure modes. It is important to underline the fact that the strength increase is obtained with a lower increment of the self-weight, as compared to the traditional ones (e.g., steel-reinforced concrete plaster). For the global strengthening of historical masonry, the use of the FRCM is more adequate than the use of FRP because of the irregular surface of the masonry substratum and the typical disaggregation failure of that structure [14,15,16,17,18] as well as the issues of the FRP related to the use of epoxy adhesives (incompatibility with the original constituent material of the masonry structure, reversibility of the intervention, durability) [19,20].
A common disadvantage of both the FRCMs and FRPs is the orientation of the fibers in specific directions: the FRCMs are characterized by fiber strands oriented in two directions mutually orthogonal; having the FRPs a prior defined fiber direction, they are usually arranged along the diagonal and the edges of the walls, depending on the collapse mechanism. It is worth noting that fibers activate their excellent tensile properties when loads act along the wrapping direction of the strand, whereas they have negligible properties in the other directions (e.g., [21]). However, a stress field induced by seismic forces change moment by moment and therefore it is not possible to identify only a main direction; therefore, the classic fiber-based systems may not be very efficient.
Other effective techniques consisting in different approaches to preserve the in-plane and out-of-plane capacity against the seismic actions have been specifically developed for the masonry infills walls [22,23]; some of them can also be extended to load-carrying masonry walls [24].
The present work is part of a larger research program for the development of repair/strengthening systems for the historical and architectural masonry heritage through sustainable composite materials by replacing: (i) the cementitious nature of the classic strengthening system with the lime-based material; (ii) the most used inorganic or synthetic fibers with organic natural ones. This mix represents an original proposal in the landscape of the fibrous mortars; in particular, the new composite was developed by using a NHL mortar, strengthened by short Sisal fibers randomly oriented in the mortar mix.
The use of NHL-based mortar aims to ensure the chemical-physical compatibility with the original characteristics of the historical masonry structures (especially in stone and clay) to follow both the effectiveness and durability of the intervention [25,26,27]. Indeed, the NHL-based mortar is considered a very hopeful alternative to cement materials when the preservation of the historical substrates is a stringent requirement and therefore the high compatibility is mandatory. The proposed composite is conceived to be applied as a coating on masonry surfaces, presenting greater advantages in terms of easiness and time application in situ, as compared to the other classical fiber-systems. Suffice it to say that it can be applied in a unique phase, consisting of the application of a single layer of the product to the masonry surface. This would consistently reduce the cost and the impact of seismic and energy retrofit of built heritage.
Incorporation of fibers into mortar/concrete materials significantly improves the tensile strength, ductility, toughness, and durability of the material by delaying the fracture and limiting the propagation of cracks [27], thanks to the fiber bridging mechanism.
Furthermore, the introduction of short fibers reduces the use of the cement/lime materials with a consequent reduction in production (and soil consumption) and energy consumption. Indeed, the cement and lime production processes are energy-intensive and produce plenty of CO2.
The mechanical behavior of lime-based mortar (reproducing the compositions of a historical one), reinforced by randomly oriented short glass fibers, was investigated in [28]. The results obtained with various types/content of fibers in binders highlighted that composites ensure increased strength, excellent ductility, and fracture energy, thus making them a promising alternative to traditional (long) fiber strengthening systems, even for ancient constructions.
The use of fibers of different natures (steel, carbon, aramid, plastic, glass, cast iron, polypropylene, polyacrylonitrile, polyolefin, etc.) is usually adopted for high-performance applications, such as automobiles and aircraft industries, and is greatly increased for civil structures made by concrete (e.g., industrial concrete slabs, precast elements for structural and nonstructural applications, and tunnel jacketing) [29].
However, the high-performance of composites with metallic/synthetic fibers have a high impact on the environment since the required energy to recycle the basic materials causes a high carbon footprint. This has often led to unsatisfactory disposal of those materials, which has a vast environmental impact [30,31]. Furthermore, it is worth noting that these materials are non-renewable resources.
The academic and industrial world is continuously engaging to develop new materials that can offer efficient alternatives to conventional construction materials and improve the energy-efficiency in buildings or to repair and protect existing structures [32,33]. This new generation of materials, before full entry in the building business, needs to be carefully analyzed, especially for their long-term performance.
Using vegetable fibers in the mortar (or concrete) is an exciting challenge for building-related industries since they require only a low level of industrialization for their processing and therefore, they are cheaper than the conventional metallic/synthetic fibers. Furthermore, the advantage of using natural fibers is that it is readily available and environmentally friendly.
Natural fiber-reinforced composites are emerging very quickly thanks to the great number of research programs throughout the world, the main goal being to overcome the durability limitations imposed by conventional composites, as treatments and coating systems [34,35,36]. Natural fibers can replace conventional metallic/synthetic fibers in several applications [37,38,39,40,41,42,43] although they are mainly adopted for non-structural components such as roofing tiles, masonry blocks made by concrete, slab for roofing, and tanks construction [44,45].
The most used natural fibers in the civil engineering field are Sisal, henequen, coconut, flax, bamboo, hemp, jute, ramie, wood, palm, banana, and pineapple. In particular, natural fiber composites show good mechanical properties and ductility, as well as high values of fracture energy, implying reduced thickness and low weight.
The low elasticity modulus of natural fiber improves the energy absorption of composites in the post-cracking behavior. Indeed, randomly distributed short fibers in quasi-brittle matrices (i.e., mortar or concrete) can substantially improve the response to impact force due to the enormous ability to dissipate dynamic energy [46,47]. The main differences observed for the various natural fibers are well described in [48], in terms of: (i) hygric, chemical, and mechanical structure; (ii) fiber-cement composite properties and performance; (iii) enhancement of the properties of plant-based fiber reinforced cement composites.
In the present work, the Sisal fibers were adopted, aiming to improve the mechanical properties of the lime-based reinforcing mortar.
Sisal is a hard fiber extracted from the leaves of the Sisal Aloe plant (Agave Sisalana). Though native to tropical and subtropical North and South America, the Sisal Aloe plant is now widely grown in the West Indies, tropical countries of Africa, and the Far East. Almost 4.5 Sisal fiber million tons are produced every year throughout the world, with Tanzania and Brazil at the forefront [49]. In general, a Sisal Aloe plant produces about 200–250 leaves and each leaf (weighing about 600 g) contains about 1000 fiber bundles (about 3% by weight; it is worth noting that 90% is water) [50]. It is worth noting that the cost of Sisal fibers per unit weight is about 90% less than the cost of glass fiber, although the mechanical properties of Sisal fiber are clearly lower than glass fiber [51].
Regarding the mechanical characterization of Sisal fibers, a study [52] concluded that no significant variation of mechanical properties was observed in the tensile test by varying the fiber diameter. However, both the tensile strength and the ultimate elongation decrease while Young’s modulus increases with fiber length. In that research, the dependency of the mechanical behavior of the Sisal to the test speed was also highlighted. Indeed, for high strain rates (500 mm/min) one can observe a sudden fall in tensile strength due to the presence of imperfections in the fiber that cause immediate failure. On the contrary, very slow test speeds show a viscous behavior of the fiber because of its internal microstructure. The test speed effect on the mechanical properties of the fibers was also found in [53] for other natural fibers (i.e., the sun hemp one).
The mechanical properties of Sisal fibers were studied from different ages at three different temperatures [54]. Results showed a decrease of the tensile strength, modulus, and toughness values of the Sisal fiber for increasing temperature and mainly attributed to the higher intense removal of water and/or other volatile components present in the fibers at the tests starting time, which otherwise act as plasticizers in the cellulose macromolecule chains.
Other authors have subjected the Sisal fiber to accelerated aging by immersion in a PH12 solution for 28 days. The results showed a decrease of up to 50% in the tensile strength of Sisal [45]. Hence, to avoid aging effects in the composites, some approaches should be adopted, such as an application of a protective coating, high casting compaction for providing matrix carbonation (with the addition of silica fume if necessary), and use of clow alkaline binders based on blast furnace slag and fly ash (e.g., [55]). In [45], the effect of various treatments on the composite properties is described well.
Furthermore, several researchers investigated the properties of composites reinforced by Sisal fibers. In [56] a cementitious matrix reinforced with untreated bi-directional fabrics of Sisal fibers was mechanically characterized by tensile tests performed on both single yarns and composite strips. Results showed good adhesion of those fibers with the mortar matrix, demonstrating an appreciable ductile behavior and moderate tensile strength for such composites.
Cement-based composites reinforced with long unidirectional aligned Sisal fibers under both direct tensile and bending tests aiming to define the first crack, toughness and post-peak strength of the composites were investigated in [57]. Results showed the potential of the use of that fiber type for semi-structural and structural applications. Furthermore, it was highlighted that drying shrinkage in the mortar can increase with the presence of Sisal fibers, as the greater porosity of the fiber, from the microstructure point of view, created more moisture paths into the matrix and therefore to higher drying shrinkage.
The mechanical behavior of cement mortar reinforced by Sisal fiber with different lengths was investigated in [58]. The results indicated that the introduction of the fibers leads to a decrease in compressive strength and an increase of the fracture toughness (the latter proportional to the fiber length), as compared to the plain cement mortar.
From another research [59], it was also highlighted that the addition of short Sisal fibers to cement matrices causes the decrease of elastic modulus, strain at failure, and peak stress of the matrix, while the only parameters increase is the toughness. Furthermore, the elastic properties of the composites reinforced with Sisal fiber that were 50 mm long, such as elastic modulus, peak stress, and peak strain, were smaller than those obtained with fibers that were 25 mm long. On the other hand, the toughness index was less affected by the increase in the fiber length.
A strengthening of the matrix with Sisal fibers yarns, impregnated with a water-based resin and included in an inorganic matrix based on natural lime, was tested under both tensile and single-lap shear tests [38]. The results of the tests carried out on the mechanical characterization of the composite with impregnated yarns, showed an elastic-brittle behavior with a higher tensile strength with respect to dry fibers yarns (a difference of about 15%), caused by a greater uniform stress distribution among the fibers. In single-lap shear tests, a progressive tensile failure of the yarns was always attained, without any sliding mechanisms at the masonry–mortar interface. This behavior was due to the adequate bond length (260 mm) that avoided debonding or sliding failures.
Cement-based composite (with partial replacement of Portland cement by 20% of calcined waste crushed clay brick and 30% of metakaolin to improve the durability) reinforced by long Sisal fibers was investigated in [60]. The mechanical response of the composites was measured under both tensile and bending tests. The composites showed high modulus (more than 30 GPa) at linear-elastic zones ranges and ultimate stresses of 12 and 25 MPa under tensile and bending tests, respectively.
A comparison between Sisal, jowar, and bamboo fibers embedded in a polyester resin matrix, tested under both tensile and bending tests, was proposed in [61]. In that research, better performance of the jowar fibers was observed, suggesting the idea to propose a comparison for mortar-based composite as well, instead of the polyester resin one in future research.
The mechanical characterization of the proposed composite, defined by a lime-based mortar strengthened by short Sisal fibers randomly diffused in the mortar matrix, was experimentally performed and discussed in this paper. Beams with dimensions of 160 × 40 × 40 mm3 were submitted to three-point bending tests, aiming to evaluate both the fracture energy and the bending strength of the composite material. Then, compression tests were conducted using 80 × 40 × 40 mm3 prismatic mortar specimens obtained from the two-half specimens tested in three-point bending.
2. Test Campaign
In this study, Sisal fibers derived from Aloe plants were employed as dispersed fibers in beams sizing 160 × 40 × 40 mm3 with a central notch. They have been tested in different ways, included the three-point bending, aiming to evaluate both fracture energy and bending strength. In particular, the ratio between the length and the fibers average diameter and fiber content on both the compressive and tensile strength, as well as the mixture workability, were investigated. The authors paid special attention to the fiber selection, chosen on the base of their length lf. In fact, it is known from the literature that the mechanical properties of the mixture and the workability respectively increase and decrease when the length fiber is higher; in particular, the negative effects of the long fibers occur in the mixing phase and especially when the mixture is applied with spraying technique on the masonry surface (almost the unique possible application of this kind of product).
Following their recent work on the reinforced lime-base mortar with glass fibers [28], the authors have defined two sets of tests with two different fiber lengths, 24 mm and 13 mm, respectively named F1 and F2. At the time, the low spread of these kinds of fibers does not allow for industrial development such as to provide the fibers according to the needs of the user. Therefore, almost all companies who work in this field provide the Sisal wires in the shape of a spiral strand in woven fabric or wrapped in reels, as shown in Figure 1.
In this experimental campaign, the strengthening of the mortar was made using a spiral strand wrapped in reels (Figure 1b, named RM2 in the water retention test of Section 3.1), whilst the second type of the fibers under the shape of woven fabric (Figure 1a, named RM1 in the water retention test of Section 3.1) were used just in the water retention test. The spiral strand with 2 mm diameter is carefully cut to the predefined length (24 mm and 13 mm) and unwrapped so to obtain single fibers with an effective diameter equal to 0.028 mm, measured via stereo microscope as shown in the picture of Figure 2.
As opposed to the results found in [28] regarding the glass fibers, here the Sisal fibers would not be treated with any impregnation, at least for visual and tactile inspection.
Geometrical and mechanical parameters are summarized in the following Table 1, where is the fiber length, is the diameter of the single yarn, is the diameters of the strand, is the density, is the modulus of Young, is the ultimate tensile strength and is the ultimate strain. The first two parameters and have been directly evaluated on the fibers and from a technical datasheet, while the density is taken from literature. It is worth noting that the ultimate tensile strength evaluated by testing, matches the values from the literature.
Four components have been used to realize the dry mortar: binders, chemicals, fibers and aggregates, exactly mixed following the same order; water was added as the last component during the mixing phase. The sieve curve for aggregates includes sand with sizes ranging from 0.1 mm to 1.2 mm. The mixture ratio design is given in Table 2.
Once the mixing phase with the mixer was finished, the mortar was tested via slump test and immediately after casted in the three-gang prism mold, measuring 160 mm in length and 40 mm for both height and thickness each and vibrated in compliance with the standard code EN 1015-11 [62]. As the final step, the three samples were subjected to the slump test (Section 3.1) to evaluate the workability. For the next 48 h the samples were kept moist on the shelves in a conservation room where the temperature is kept under steady condition (20 ± 2°) and the relative humidity is kept above 95% by atomization. At the end of this first step, the molds were removed and the specimens were left in laboratory condition for 26 days with room temperature and relative humidity of 20° and 60%, respectively. After 28 days the specimens were subjected to the three-point bending test (Section 3.3) and each couple of broken sample pieces were used to evaluate tensile stress (Section 3.4) and compressive stress (Section 3.5) The testing procedure is fully explained in the next paragraph.
The test campaign engaged a total of 53 mortar samples, 3 unreinforced and 50 strengthened with Sisal fibers (9 samples for each 3-fiber content for both lengths, except for the set with a fiber content of 0.75% and fiber type F1 where 5 specimens have been done).
Starting from the woven fabric shown in Figure 1, fibers were unwrapped and cut. Figure 3 shows the work steps through which fibers were obtained.
To investigate in more depth the effect of the fibers on the mechanical properties of the mortar, as done in their previous work [28], the authors decided to keep the limit of lime at 30% with the goal to reduce the dispersion of the data. Indeed, it is noted from the literature that the natural hydraulic lime (NHL) is affected by the higher variability of its mechanical properties with respect to the cement. Consequently, the mixture obtained is more properly defined as “lime-based”, rather than “pure-lime mortar”.
The effect on the mechanical properties of the mixture was studied using different fiber density, in particular, three percentages of fibers were taken: 0.6%, 0.75%, and 1.00%, of the total weight of the product. Table 3 summarizes the aspect ratio of the fibers compared with the total weight and volume of the single specimen.
It is worth noticing that unreinforced specimens with the same mix design of the reinforced ones have been made. Therefore, any increase of mechanical properties of the fibrous mortar is due only to the fiber content.
3. Performances Appraisal Methods
Tests are conducted on the fresh and hardened mortar in reinforced and unreinforced configuration with fibers RM2 of Figure 1b and with fibers of 24 and 13 mm in length, respectively named F1 and F2, as reported in Table 3. Tensile tests are also conducted on the Sisal fibers, taken from the reel of Figure 1b in the form of strands, with 2 mm diameter. The last paragraph only refers to the Sisal fibers, while the other paragraphs refer to the mortar in the mentioned configurations.
3.1. Water Retention Test
The fiber acts as a structural strengthening for quasi-brittle materials, since they work as a transferring stress bridge in the cracks that may occur in the mortar matrix. However, the use of fibers has a negative effect on the fluidity of the material and this can reduce the workability of the mixture in the fresh state. Among other reasons, the workability reduction is due to the fact that the fibers partially absorb the water present in the mortar mixture. Thus, understanding the amount of water retained by the fibers when they are dispersed in the mortar matrix is fundamental. With this aim, the water retention test, regulated by the UNI-EN 459-2 [63], is a powerful methodology that can be adopted.
Specifically, in this section, two water retention tests are performed on: (i) an unreinforced lime-based mortar, and (ii) the same lime-based mortar reinforced with natural dispersed fibers. Expressing the water retention (wr) as the water percentage which remains in the mortar mixture after short suction time, the difference between the water retention of the fiber-reinforced mortar and the water retention of the unreinforced mortar corresponds to the amount of water retained by the fibers.
Technical Procedure
The testing setup consists of two glass plates of 200 mm × 200 mm × 5 mm3, one filter paper plate of 190 mm × 190 mm × 2 mm3, a 185 mm non-woven tissue in diameter, a 140 mm smaller conical plastic ring and 150 mm larger inside diameter and height equal to 12 mm. It is worth noting that the temperature and the relative humidity of both the apparatus and the test room was verified to be about 20 °C and more than 50%, respectively.
For the determination of the water retention, the water fraction W1 of the mixture has been set to 20%. First, one glass plate was weighted (m1). Second, the weight of the dry filter plate together with the glass plate was measured (m2). Thus, the non-woven tissue was placed on top of the assembly dry filter/glass plate and they were weighed together (m3). Then, the smaller opening of the downward facing plastic ring was put on top of the aforementioned assembly and the total weight was pointed out (m4). At this point, the mortar was placed in the plastic ring quickly and uniformly and the assembly was weighed (m5) and covered with a glass plate. Finally, the test arrangement was inverted and the filter plate was weighed (m6). The mass of the water absorbed by the filter is given by the difference between m7 = m6 − (m2 − m1). The mass of the absorbed water was measured at times t1 = 3 min, t2 = 10 min, t3 = 60 min. Three procedures were carried on for: the unreinforced mortar (UR), the mortar reinforced with natural fibers Type 1 in the amount of 0.75% of the total weight (RM1) and the mortar reinforced with natural fibers Type 2 in the amount of 0.75% of the total weight (RM2).
3.2. Evaluation of the Workability
The fresh properties of concrete and mortar are generally tested using a slump test, the most common way to assess the workability of mixture of normal consistency (where the slump is ranging from 10 mm to 200 mm).
When the expected values are close to the upper bound, the flow table test represents the best method to check the consistency of the mortar.
More specifically, both methods aim to assess the consistency of freshly made mortar immediately before to cast the batch in the mold, measuring its tendency to flow.
3.3. Three-Points Bending Test
Three-points bending tests (3PBT) were performed on 53 specimens of 160 mm in length and 40 mm for both height and thickness. A notch with thickness and depth a equal to 2 mm and 6 mm, respectively, was realized on the mortar sample, resulting in a notch to beam depth ratio a/d equal to 0.15 [28]. Figure 7 illustrates the scheme of the load and the boundary conditions related to the beam under 3PBT.
The supports of the specimen were at 100 mm distance, while width d and thickness b were 40 mm. The force P, prescribed in displacement control conditions, was applied at the midspan of the beam. Two rollers at the bottom corresponded to the assigned boundary condition and allowed for free horizontal movement.
The aim of the 3PBT is to determine the peak bending stress σf and the fracture energy Gf. Several approaches exist to determine the Gf, but the most widely valid formulation is the one recommended by RILEM, according to which the total energy Gf is given by the following expression:
where is the area subtended by the load-deflection curve, m is the weight limited to the part between the supports, computed as beam weight multiplied by 1/L, g is the acceleration of gravity, is the beam deformation at the failure condition, d is the beam width, a is the notch-depth.
Next, the bending stress was computed according to the following equations:
It is worth noting that for , the previous equation gives the bending strength .
As already mentioned, all the tests were performed in displacement control condition by a hydraulic testing machine (Zwick Roell) in the Laboratorio Prove Materiali e Strutture (LPMS) in L’Aquila University. The samples were subjected to a vertical displacement imposed by setting a constant velocity of 0.5 mm/min. During the test, both the Force P and deflection d time histories were automatically recorded by the testing machine.
3.4. Tensile Test
In this section, the splitting tests are illustrated aiming to measure the tensile stress of the samples. The splitting test procedure, also called Brazilian tests (BT), is an indirect way of measuring the tensile properties of materials. Better than other direct ways of measuring the tensile capacity of the specimens, the splitting procedure has the advantage that it can easily be performed on the specimens, the scattering of data is very low, and the suitable shapes of the samples can have a large variety of configurations, as cylinders, prisms, cubes. In BTs, the sample is compressed with a concentrated load acting in a pair of opposite points. In this way, tensile stresses are induced perpendicularly to the applied load, with a magnitude proportional to the applied load.
When the internal stresses exceed the tensile stress, a crack triggers at the sample geometric center, in accordance with the Griffith criterion [66]. If the fracture trigger does not happen in the geometrical center of the specimen, the BT cannot be accepted as being representative of the tensile capacity of the sample. Moreover, BT provides the fracture to be vertical and should be included within the two compressed points where the external load is applied.
In this study, BT is performed on 40 mm × 40 mm × 80 mm3 prismatic mortar specimens obtained from the two-half specimens representing the broken pieces of the 3PBT, as shown in Figure 8.
The specimens were loaded with a constant displacement rate equal to 0.5 mm/min. The tests were carried on at LPMS of L’Aquila University. The force P and the vertical displacement δ were directly recorded by the Zwick Roell software with which the machine set up.
Then, the tensile stress can be computed by using the following equation:
In the previous expression, when the load P reaches the maximum value (PMAX), the tensile strength can be computed.
3.5. Compression Test
This section shows the compressive tests carried out on the fiber reinforced mortar specimens aiming to determine their compressive performance. The dimensions of the prisms were 40 mm × 40 mm × 80 mm3, and this sample was one of the two-half specimens resulting from the 3PBT.
The detail of the test apparatus, the loading configuration and the assigned boundary conditions are illustrated in Figure 9.
The top side of the specimens was loaded with the distributed force P on a square area of 40 mm × 40 mm, while the bottom side of the specimens was placed on a square area of 40 mm × 40 mm. The compressive tests were carried out in displacement control conditions with a constant displacement rate equal to 1 mm/min.
The compressive stress is computed using the following equation:
When P = PMAX the compressive stress represents the compressive strength . Moreover, using the following equation it is possible to compute the vertical strain ,
3.6. Tensile Test of Sisal Strands
This section shows the tensile tests carried out on the Sisal fibers strands, in order to define the tensile stress. Fiber samples that were 50 cm in length and 3 mm in diameter were used to determine the tensile stress of the Sisal.
Specimens were tested for the evaluation of tensile stress and elastic strains using the Zwick Roell test machine. The results were recorded and stored using a dedicated software linked to the Zwick Roell machine in Newton and millimeter units. The average diameter of specimens was measured using micrometer, while their gauge length (clearly of anchorages) were measured by means of a tape measure. The first tests failed because the pressure required to avoid the wire sliding induced fiber tearing and thus the cut in correspondence to the machine clamps.
To overcome these drawbacks, two pieces of wood were used to fix the specimen ends; they were obtained cutting a wood stocky beam sizing 50 × 50 × 100 mm3 and in which a pocket was made. The two pockets were later filled with epoxy adhesive and finally glued along the surfaces where the Sisal strand was fixed, giving the result shown in Figure 10. This treatment avoids the fiber tearing in absence of any tricks, ensuring that the tensile failure happens before the sliding one. This adjustment allowed to carry out a representative number of tests reaching the tensile failure of the fibers, therefore characterizing its tensile strength.
4. Test Results, Discussion, and Further Development
The results of the water retention tests are presented in following three tables and Figure 11, regarding two types of fibers extracted from the woven fabric and reels, hereinafter briefly called RM1 and RM2, respectively. This test was performed on a total number of 27 specimens, 3 each considered time, t3, t10, and t30 and each type of mortar, unreinforced and reinforced with fiber types RM1 and RM2. In particular, Table 4 shows the results for the water retention test performed on one unreinforced mortar specimen (UR), Table 5 provides the results of the water retention test performed on one reinforced mortar specimen with fiber type RM1 and Table 6 reports the results of the water retention test performed on one reinforced mortar specimen with fiber type RM2. Finally, Figure 11 depicts the average values of the water retention tests and the fiber water absorbed corresponding to the three time intervals in which the data were recorded.
Figure 11 shows that the unreinforced mortar (UR) is characterized by a lower water retention than the mortar reinforced with both dispersed natural fibers, RM1 and RM2. In particular, the UR water retention is lower with respect to RM1 and RM2 for all the considered times (t1 = 3 min, t2 = 10 min, t3 = 60 min). Moreover, the two reinforced mortars, RM1 and RM2, appear to retain a similar amount of water at times t1 and t2, whereas at time t3 the mortar RM1 seems to retain more water than RM2. Focusing the attention on the fibers behaviors, the graph on the right of Figure 11 shows that the RM2 fibers (named FRM2 in this graph) are characterized by a slightly greater water absorption than the RM1 fibers (named FRM1 in this graph) at the initial times t1 and t2, whereas at time t3 F1 shows the highest water absorption (2.8 % vs. 2.5 %).
Figure 12 shows the slump test results carried out on the mortar specimens reinforced with F1 and the F2 fibers. Three percentages have been used in the analysis of fresh mortar, starting from 0.6%; for this reason, a linear variation of the slump values was assumed (represented by dotted lines) between the cases of unreinforced mortar (F = 0%) and reinforced mortar with the lowest fibers content (0.6%), as in that range (0–0.6%) no tests were carried out.
The curve trend in Figure 12 shows the first part between 0 and 0.6% where the workability of the fresh mortar gets worse for both fibers by increasing the fiber content but is more evident for fiber F1. For fiber F2, it is observed that no substantial difference occurs in terms of slump comparing the cases unreinforced (0% of fibers) and strengthened with 0.6% fibers content.
In the range of 0.6–0.75% the slope of both curves inverts the sign, therforethe workability increases in a considerably manner and then go back to decrease for fiber content greater that 0.75%.
As a general remark, one can note that the variation for all fiber contents ranging from 0 to 1.0% is characterized by a very small reduction of the slump for both types of fibers; in particular, we denote 3% for the type F1 and 7% for the type F2, against other types of fibers, for example the glass one for which the variation reaches 20%.
For the case of fresh mix strengthened by synthetic fibers, one can note a constant decrease of the slump test values, relating to the compaction induced by the increasing of fibers percentage; in the present work where the natural fibers have been used, the greater water retention may have mitigated the compaction effect.
For the range 0.6–0.75% the increase for both fibers could depend on the greater effect on the mix viscosity by the water absorption of the fibers with respect to the compaction effect induced by the increase of the fiber content; beyond 0.75% the second one influences more than the first.
Moreover, the constant relative difference between the two fibers F1 and F2 may depend on their different aspect ratios. In fact, the aspect ratio is inversely proportional to the number of fibers, so the parity of fiber content F, the higher aspect ratio leads to a lower fiber number of the fresh mixture per unit volume, as reported in Table 3. Hence, in the case of natural fibers, a lower workability of the product is related to a lower number of fibers. Since the F1 fiber is characterized by a higher aspect ratio, as compared to the F2 fiber, one can observe a lower workability of the fibrous mortar.
This behavior can certainly be of interest, but for it to be extended as a general rule it must be investigated further.
However, it is also worth noting that the variation found for the slump values is certainly affected by scattering, which can be strongly reduced by a larger test campaign. Because of these remarks, we can assume that the workability of mortar mixed with natural fibers can be substantially independent from the fiber content.
The following Figure 13 shows the relation between the Bending stress and the deflection of the prismatic specimen subjected to three-point bending tests (3PBT) with different fiber contents: it is recalled that nine specimens are tested for each fiber content and both fibers F1 and F2. For the unreinforced case and the fiber content 0.75% with fibers type F1, 3 and 5 specimens are tested, respectively, for a total amount of specimens equal to 53.
In particular, Figure 13a illustrates the results of three tests on three unreinforced mortar specimens, with the mean value of the maximum bending stress equal to 3.62 MPa. Moreover, the post peak behavior is characterized by a sharp brittle failure, as one would expect from the unstrengthened mortar.
Conversely, Figure 13b–d depict the performances of the prismatic specimens in the reinforced configuration, by using two fibers (F1 and F2) and three different fiber contents, according to the order of 0.6%, 0.75%, and 1.0%.
With a fiber content of 0.6%, one can see that the fiber-reinforced mortar, already with the lower content of fibers, gives an important performance increase in both bending strength and ductility, especially for fiber F1. It is worth noting the high level of the residual bending stress after the peak, roughly equal to 50% and 30% of the peak for fiber types F1 and F2, respectively.
With a fiber content of 0.75%, the two types of fibers show no strong differences in terms of bending stress, meanwhile the ductility remains substantially equal and the peak stress shows a significantly difference between the two fibers, decreasing in the case of fiber F1 and increasing for fiber F2, for what regard the fiber content of 0.6%.
Regarding the fiber content of 1.0%, one can see that the highest increase of both bending stress and ductility performances, especially for fiber F1, shows a very small decrease of the residual bending stress after the peak, estimated equal to only 10% and then goes on up to the final displacement with a small decrease of stresses.
From the remarks of these results, it can be deduced that: (i) the increase in fiber content increases the peak of the bending stress of the shorter fiber F2 and the ductility of fiber F1; (ii) the highest values of fiber content reduce the brittle behavior of the mortar reinforced with fiber F1 by a lot; (iii) although the fiber F1 has fewer fibers per unit volume and one would expect less bending stress, it shows the highest value of bending stress. This may be due to the greater superposition of the longer fibers that better cover the length of the specimen, ensuring a greater number of fibers in the cracked section with respect to the smaller ones.
Further information to better understand the influence of both fiber content and fiber type on the bending strength of the strengthened mortar are shown in Figure 14. In particular, Figure 14a allows evaluating the benefit of the reinforcement in terms of bending performance (average values of maximum stresses) with respect to the fiber content, by using the Equation (2) for P = Pmax.
Despite many uncertainties that affect the scattering of the results (mixing time, failure mechanism, the order with which the components are added in the mix), the improvement in bending stress is clear.
Moreover, Figure 14b shows the trend of the fracture energy (average values of the maximum fracture energy), as the fiber content F varies. is computed by using Equation (1), which considers the amount of energy dissipated to generate cracks per unit area, until the bending stress is reduced to almost zero.
Fracture energy measures the fracture toughness (traceable to the ductility in the field of structural engineering), i.e., the ability of materials to resist fracture. High values of fracture energy indicate a high capacity of the material to dissipate energy, hence high ductility. For the tested specimens under 3PBT, the fracture energy shows no strong difference between the two fibers F1 and F2 for the large part of fiber percentage content. As depicted in Figure 14b, the fracture energy starts from a value close to zero for the UR specimens and goes up to about 1 N/mm and 0.6 N/mm for fiber types F1 and F2, respectively, for 0.6% of the fiber content. After this threshold, fiber F2 only shows the consistent increase of fracture energy up to 0.75% of the fiber content, whilst the fiber F1 maintains the same trend. For a fiber content greater than 0.75%, the trend for both fibers starts to change greatly: the F1 fibers begin to provide an ever-greater fracture energy, reaching almost 2.5N/mm, whilst for the F2 fibers their capacity to dissipate energy decreases, reaching a lower value than the previous one, equal to 1.3 N/mm. For fiber content equal to 1.0% the fracture energy computed for the F1 fibers is equal to 1.85 times the one computed for the F2 fibers. It is worth noting the following experimental piece of evidence: (i) the slope of the curve related to fiber F1 shows a slope significantly greater than the one of the fiber type F2; (ii) the curves in the two graphs of Figure 14 have two intersections in the same fiber content range.
The following Table 7 shows the statistical data of the 3PBTs. The last column on the right shows the coefficient of variation (CV), which gives important information about the relative variability of a parameter. In this case one can observe a variability of the standard deviation (st.dev) ranging from a minimum of 7% up to 19% of the mean value. It is worth noting that the greater dispersions are related to the mortar reinforced with fiber type F1.
The following Figure 15 shows the relationship between tensile stress and deflection for the unstrengthened and strengthened mortar specimens subject to the Brazilian Test (BT).
It is recalled that these tests were performed on one of the two half parts in which the specimens were broken from the previous 3PBTs; the final number of the specimens is 53 (half specimens).
For the unreinforced case of Figure 15a, the average value of the tensile strength is equal to 1.75 MPa. If compared with bending strength computed for the 3PBTs, this is 2.07 times the tensile strength.
As already denoted for the unreinforced specimens under the 3PBTs, the failure behavior is also in this case brittle, even it shows a greater displacement capacity. This phenomenon may be due to different engagements of the section, partialized in the 3PBT and fully reactive for the tensile one.
Again, in this case we can see the greater strength of the specimens with fiber F1, thus with the lower number of fibers per unit volume. This result matches the one obtained in the case of 3PBT and may confirm the hypothesis previously done.
Further information for better understanding the influence of both fiber content and fiber type on the tensile stress of the strengthened mortar are shown in Figure 16. In particular, this graph allows evaluating the benefit of the strengthening in term of tensile strength (average value of peak tension strength) with respect to the fiber content, computed by using the Equation (3) for P = Pmax.
The following Table 8 shows the statistical data of the BTs. From the values of the column related to the CV, one can observe a variability of the standard deviation ranging from a minimum of 8% up to 23% of the mean value. As in the previous case of the 3PBTs, it is worth noting that the greater dispersions are related to the mortar reinforced with fiber type F1.
Compared with the 3PBT at the same fiber content, the bending stress is 3.25 times the tensile stress.
Regarding the fiber F2, one can observe a decrease in the tensile strength, although not marked, up to achieve 1.43 MPa for F = 0.60%; from here the tensile strength goes up suddenly to 2.04 MPa for F = 0.75%, then it stays almost constant to achieve 2.00 MPa for F = 1.0%.
By comparing the previous result with the one obtained for bending strength for equal fiber content (F = 1.0%), one can see the same difference found for the previous fiber content of 0.75% (indeed is 3.3 times ).
Once again from Figure 16, one can see the same trend of Figure 14a: the F1 fiber type leads to a higher performance with respect to fiber F2. It is worth noting that this result is reached with the shorter fiber and lower aspect ratio, as compared to the F2 fiber. This result seems to be against the trend of mortar strengthened by synthetic fibers, for which the shorter fiber usually gives better tensile strength (which also seems logical since the shorter fibers are almost twice of the longer ones, reaching higher distribution of the fibers over the entire specimen and thus a higher number of fibers where the crack opens).
Since this trend is clear for both bending and tensile stress for all fiber contents, the phenomenon might be specific for the natural fibers and it may be attributed to the trend of fibers to agglomerate; this implies that the effective number of fibers drastically decreases, because just a part is in contact with the mortar on the surface and can thus exploit the maximum adhesion.
To support this hypothesis, we can observe the trend of fiber F1 in Figure 14a and Figure 16: from the fiber content equal to 0.75% the longer ones begin to significantly decrease their performance for the decrease of the effective number of fibers (binder effect).
A greater quantity of fluidizer (now equal to 0.2%, see Table 3) may improve the dispersion of the fibers decreasing the binder effect, but this may worsen the workability.
The results for the unstrengthened and strengthened mortar specimens subject to Compression Tests (CT), are depicted as relationship between the compressive stress and the vertical strain in the following Figure 17.
The plots of Figure 17a refer to six specimens. In this case the average value of the compressive strength is 12.76 MPa and one can also see a sudden drop of the strength after reaching the peak, which is typical for quasi-brittle materials.
Figure 17b–d shows the relationship between and obtained for the strengthened mortar specimens subject to the Compression Test (CT) for the three fiber contents, F.
The tests on strengthened configuration have been caried out on nine specimens, except for the set concerning fiber F1 with a fiber content equal to 0.75%, for which five specimens were tested. For all the sets of tested specimens, one can observe an enhancement of the compressive stress, even if limited by comparing the contribution given by the fibers in the other mechanical properties. Moreover, on the contrary to the same test conducted on mortar strengthened with synthetic fibers, one can observe a limited scattering, especially for fiber F1 with a fiber content of 0.6% and 0.75%.
As already remarked for the results in the previous tests, the higher value of fiber content seems to lead to lower efficiency due to the lower number of fibers engaged in the resistant mechanism.
Further information for better understanding of the influence of both fiber content and fiber type on the compressive stress of the strengthened mortar are shown in Figure 18. Here, the variation of the average compressive strength is calculated by using the Equation (4) for P = Pmax, considering three different fiber contents F.
The results obtained in the CTs confirm the trend given by the bending and tensile strength tests.
In particular, tensile and compressive tests almost have the same shape, to the point of being almost overlapping in all fiber content range.
In the case of compressive tests, the trend is a bit different, as depicted in Figure 18 (where the average values are illustrated). In fact, the more the fiber content increases, the more the compressive stress increases, except for fiber content equal to 0.75% where the stress decreases for fiber F1 and remains constant for fiber F2.
An important phenomenon that is worth noting is the better performance for fiber F1. Indeed, bending, tensile, and compressive stress are significantly higher in this case and only the slump test leads to better workability, but with a quite difference, for the fiber F2. This means a substantial independence from the fiber content, suggesting the fiber type F1 with a fiber content equal to 0.75% representing the best balance among the investigated combinations.
The following Table 9 shows the statistical data of the CTs. From the values of the column related to the CV, one can observe a variability of the standard deviation ranging from a minimum of 3% up to 26% of the mean value. As the two previous tests, it is worth noting that the greater dispersions are related to the mortar reinforced with fiber type F1.
From the analysis of the collected statistical data, one can observe that the fiber F2, the shorter one, with a fiber percentage of 0.75% has the lower dispersion of ultimate strength, no matter which test type. The following Figure 19 summarizes the results obtained by the 3PBTs, the BTs and the CTs. This figure shows a significant increase for all investigated mechanical properties, bending strength , compressive strength , tensile strength and fracture energy , with respect to what was obtained in the un-strengthened case.
In terms of absolute value, the best benefit obtained by introducing fibers inside the mortar mixture is achieved in the fracture energy spent to open the crack in the specimens reinforced with fibers type F1 and fiber content equal to 1.0%.
This means that this type of fiber gives the highest ductility, coupled with high bending stress, as depicted in Figure 19.
As already underlined in the previous notes, the fibers F1 generally have better performances in terms of strength, especially for the fiber content equal to 0.75%, i.e., when the agglomerate of the fibers is limited, allowing to engage the maximum number of fibers.
On the contrary, the specimens reinforced with fiber F2 with a lower fiber content, showed a worsening of the tensile and compressive strength, although not in a substantial manner.
After analyzing all the results and comparing the different combinations, neglecting the well-known sources of uncertainties (cross-section irregularity, micro-cracks presence, samples misalignment respect to their mid-thickness, differences in specimens thickness, non-homogeneousness of material properties), we can observe that the variability of the results in the case of the mortar reinforced by natural fibers may be due in particular to: (i) the spatial orientation of the fibers, which could help the longer fibers to intercept the crack position with higher probability; (ii) the tendency of natural fibers to agglomerate more easily, reducing the number of effective fibers; (iii) the higher water absorption that allows better workability but less mechanical strength.
As a final remark, the use of fiber F1 is more recommendable as the coating in the retrofitting interventions, while the percentage of fiber content should be chosen according to the strength and/or ductility that one would require.
The following Figure 20 shows the last tests carried out on the Sisal strand, with the aim to assess the ultimate strength of both wires and strands.
Tests were carried out under displacement control on two specimens, with a displacement rate set to 0.1 mm/s, a fast speed enough to catch the failure of the single wire, with which evaluate, from a theoretical point of view, the contribution of the fibers in the tests performed in the present work.
Two tensile tests on the Sisal strand provided results very close to the ultimate strength given by technical datasheet and literature.
After the peak force, one can see that the strength decrease proceeds by small jumps and it is possible to check that they refer to the failure of single yarn, thanks also to direct view of the phenomenon. Hence, analyzing the data of the testing specimens for displacement greater than 6 mm, it was possible to evaluate the average failure tensile force for a single wire equal to 8 N. With the nominal area of the single yarn equal to 0.06 mm2 (taken from Table 3), one can evaluate the ultimate tensile stress equal to 133 MPa, very close to both literature (130 MPa) and technical datasheet values (127 MPa). Obviously, this value is affected by strong intrinsic uncertainties (fibers diameter, for example), but the obtained results can be judged amazing if we think that they came from just two tests.
For the purpose of an analytical evaluation of the contribution of the fibers, which can also help to better understand the effective number of the fibers that cross the crack, the following simplified procedure is shown.
As an example, we consider the case of the tensile test, whose results are summarized in Figure 16.
For the UR case the tensile strength is equal to 1.75 MPa, while for the strengthened mortar with fiber F1 and fiber content 0.75 the tensile strength is equal to 2.61 MPa.
This means that the contribution of the fibers is 0.86 MPa (i.e., the difference between the previous values). The total tensile force taken by the fibers can be evaluated as = 1376N. Considering the experimental ultimate tensile strength of the fiber equal to 8N, the number of the effective fibers that cross the crack is 172.
Assuming the same number of fibers for any section where the crack opens (uniform distribution hypothesis) and a small overlapping among the fibers (equal to 1.5 lf for both ends), the expected value of the total number for the mortar mix with fiber F1 and fiber content equal to 0.75 is 2752, which is very close to the real one, as compared with the values of Table 3.
The following Figure 21 shows different specimens after the 3PBT, highlighting the fibers that cross the crack.
One can observe that the specimens with fibers type F2 (Figure 21a,b) have a greater number of fibers, as compared to the ones with fiber type F1 (Figure 21c,d).
Sometimes, by direct observation, greater fiber concentrations in the center part of the specimens have been found. It could be interesting to investigate the possible correlations among the design parameters and this phenomenon.
5. Conclusions
This work presents a study on the use of the Sisal natural fibers, extracted from Aloe plants, in the strengthening of stone and brick-masonry structures, especially when the intervention regards architectural heritage. Indeed, here the attention to the preservation of the ancient structures is very high and poses important limitations in terms of strategies and materials that can be used.
This work has the aim to investigate the mechanical properties of the reinforced mortar with three fiber contents—0.6%, 0.75%, 1.0%—and two types of fiber, named F1 and F2, 13 mm and 24 mm in length, respectively.
A total of 53 specimens have been tested at the LPMS of L’Aquila with the Zwick Roell machine; specimens were tested under displacement control and subjected to 3PBTs, BTs, CTs. Two Sisal strands were pulled with the same machine under displacement control, with the aim to compare the experimental ultimate tensile strength of strand and yarn with both literature and technical data provided by manufacturer.
Regarding the workability, the slump test highlighted a substantial independence from the fibers content of the mortar mixed with Sisal. Indeed, the variation between the lowest and the highest value of the slump test was 3% and 7% for fiber type F1 and F2, respectively. As expected, the experimental results on the specimens at the end of 28 days aging, showed that the addition of short fiber in the mortar provides a great increase of the mechanical properties, especially for what regards the ductility, measured by the fracture energy spent to open the cracks. Indeed, one can see the highest increase among all performed tests, up to 1200% in the case of mortar with fiber F1 and fiber content equal to 1.0%, as compared with UR case.
The same type of fiber gives again the better performances for bending, tensile, and compressive strength for almost all fiber contents, especially for the 0.75%. Furthermore, the fiber type F2 and fiber percentage (0.75%) shows ever the lower dispersion of the ultimate strength, no matter the test type. Future works may investigate the possible relations among the CV and the maximum performance in term of bending, tensile, and compressive strength.
Conversely, the specimens characterized by fiber F2 with a lower fiber content did not show an improvement of both the tensile and the compressive behaviors, although the decrease of both the tensile and compressive strength was not substantial. This phenomenon can be due to the tendency of the Sisal fiber to agglomerate when the number of fibers becomes greater; the observed agglomeration can be the cause for the decreasing in the number of effective fibers and the overall lower strength.
The results also gave important information about the mechanical behavior of the specimens reinforced with Sisal, highlighting particular phenomena mainly attributable to the use of Sisal natural fibers.
After analyzing all the results and comparing the different combinations to each other, neglecting the well-known sources of uncertainties (i.e., cross-section irregularity, micro-cracks presence, samples misalignment with respect to their mid-thickness, differences in specimens thickness, non-homogeneousness of material properties), one can observe that the variability of the results in the case of the mortar reinforced by natural fibers may be due in particular to: (i) the spatial orientation of the fiber, which could help the longer fibers to intercept the crack position with higher probability; (ii) the tendency of natural fibers to agglomerate more easily, reducing the number of effective fibers. This affects especially the mix with a higher fiber content; (iii) the higher water absorption, which allows better workability but lower mechanical strength.
For what concerns the tensile behavior, the performed tests have shown a significant increase for both the tensile strength and ductility and it is worth underlying that this result is remarkable, since this type of retrofitting for masonry structures mostly aims to carry tensile stresses.
Moreover, the tested material ensures the full compatibility from physical and chemical points of view with the original material of the ancient buildings.
As for the final remarks, the use of fiber F1 is more recommendable as the coating in the retrofitting interventions of historical buildings, while the percentage of fiber content should be chosen according to the strength and/or ductility that one would want to reach.
Given the importance of the use of green technology to reduce the carbon footprint in the world of building, the authors will focus their next researches on geocomposites and other green technologies that uses waste material to improve the earthquake performance of structures, as well as further investigate some phenomena that emerged in this study and remain unclear, (i) the tendency of natural fibers to agglomerate, (ii) the spatial orientation of the fibers. To deepen this interesting topic, the scanning electron microscope (SEM) and the 3D X-ray microtomography (XRM) could give important contributions. In fact, the natural fibers are naturally composed of organic components (carbon linked to other elements), and their physical properties and the spatial location inside the specimen will be clearly in contrast with the inorganic matrix of the mortar, different from the case of the inorganic fibers where the chemistry is not so different to the matrix.
Author Contributions
Conceptualization, methodology, software, validation, formal analysis, investigation, data curation, writing-original draft preparation, visualization, M.V.; investigation, data curation, validation, M.M.; methodology, writing-review and editing, M.A.; validation, supervision, project administration, funding acquisition, A.G. All authors have read and agreed to the published version of the manuscript.
Funding
This research was carried out thanks to the funding PON research and innovation 2014–2020.
Institutional Review Board Statement
Not applicable.
Informed Consent Statement
Not applicable.
Data Availability Statement
The data presented in this study are available on request from the corresponding author.
Acknowledgments
The authors gratefully acknowledge the support of the “Aquilaprem S.r.l.” company (L’Aquila, Italy) for the concession of materials as well as Paolo Dacci and Eng. Daniele Martini for the development of the mix-design of the product.
Conflicts of Interest
The authors declare no conflict of interest. The funders had no role in the design of the study; in the collection, analyses, or interpretation of data; in the writing of the manuscript; nor in the decision to publish the results.
References
- Silva, B.; Dalla Benetta, M.; da Porto, F.; Modena, C. Experimental assessment of in-plane behaviour of three-leaf stone masonry walls. Constr. Build. Mater. 2014, 53, 149–161. [Google Scholar] [CrossRef]
- Vailati, M.; Monti, G.; Khazna, M.J.; Realfonzo, R.; De Iuliis, M. Probabilistic seismic response analysis of existing masonry structures. In Proceedings of the 16th International Brick and Block Masonry Conference, Padova, Italy, 26–30 June 2016; pp. 2489–2497. [Google Scholar]
- Calderini, C.; Cattari, S.; Lagomarsino, S. In-plane strength of unreinforced masonry piers. Earthq. Eng. Struct. Dyn. 2009, 38, 243–267. [Google Scholar] [CrossRef]
- Menegotto, M.; Monti, G.; Salvini, S.; Vailati, M. Improvement of Transverse Connection of Masonry Walls through AFRP Bars. In Advances in FRP Composites in Civil Engineering; 2011; pp. 947–950. [Google Scholar]
- Ricci, P.; Di Domenico, M.; Verderame, G.M. Experimental assessment of the in-plane/out-of-plane interaction in unreinforced masonry infill walls. Eng. Struct. 2018, 173, 960–978. [Google Scholar] [CrossRef]
- Mercuri, M.; Pathirage, M.; Gregori, A.; Cusatis, G. Computational modeling of the out-of-plane behavior of unreinforced irregular masonry. Eng. Struct. 2020, 223, 111181. [Google Scholar] [CrossRef]
- Khan, N.A.; Monti, G.; Nuti, C.; Vailati, M. Effects of infills in the seismic performances of an RC factory building in Pakistan. Buildings 2021, 11, 276. [Google Scholar] [CrossRef]
- Mercuri, M.; Pathirage, M.; Gregori, A.; Cusatis, G. On the collapse of the Medici masonry tower: An integrated discrete-analytical approach. SPREE Intern. Rep. 2021, 246, 113046. [Google Scholar]
- Zhan, Y.; Meschke, G. Multilevel computational model for failure analysis of steel-fiber–reinforced concrete structures. J. Eng. Mech. 2016, 142, 04016090. [Google Scholar] [CrossRef]
- Krevaikas, T.D.; Triantafillou, T.C. Masonry confinement with fiber-reinforced polymers. J. Compos. Constr. 2005, 9, 128–135. [Google Scholar] [CrossRef]
- Corradi, M.; Borri, A.; Castori, G.; Sisti, R. Shear strengthening of wall panels through jacketing with cement mortar reinforced by GFRP grids. Compos. Part B Eng. 2014, 64, 33–42. [Google Scholar] [CrossRef] [Green Version]
- Angiolilli, M.; Gregori, A.; Cattari, S. Performance of Fiber Reinforced Mortar coating for irregular stone masonry: Experimental and analytical investigations. Constr. Build. Mater. 2021, 294, 123508. [Google Scholar] [CrossRef]
- Furtado, A.F.; Rodrigues, H.; Arêde, A.; Melo, J.; Varum, H. The use of textile-reinforced mortar as a strengthening technique for the infill walls out-of-plane behaviour. Compos. Struct. 2020, 255, 113029. [Google Scholar] [CrossRef]
- Kouris, L.A.S.; Triantafillou, T.C. State-of-the-art on strengthening of masonry structures with textile reinforced mortar (TRM). Constr. Build. Mater. 2018, 188, 1221–1233. [Google Scholar] [CrossRef]
- Borri, A.; Corradi, M.; De Maria, A. The Failure of Masonry Walls by Disaggregation and the Masonry Quality Index. Heritage 2020, 3, 1162–1198. [Google Scholar] [CrossRef]
- Angiolilli, M.; Gregori, A. Triplet test on rubble stone masonry: Numerical assessment of the shear mechanical parameters. Buildings 2020, 10, 49. [Google Scholar] [CrossRef] [Green Version]
- Sisti, R.; Di Ludovico, M.; Borri, A.; Prota, A. Damage assessment and the effectiveness of prevention: The response of ordinary unreinforced masonry buildings in Norcia during the Central Italy 2016–2017 seismic sequence. Bull. Earthq. Eng. 2019, 17, 5609–5629. [Google Scholar] [CrossRef]
- Borri, A.; Corradi, M.; Castori, G.; Sisti, R.; De Maria, A. Analysis of the collapse mechanisms of medieval churches struck by the 2016 Umbrian earthquake. Int. J. Archit. Herit. 2019, 13, 215–228. [Google Scholar] [CrossRef]
- Bakis, C.E.; Bank, L.C.; Brown, V.; Cosenza, E.; Davalos, J.F.; Lesko, J.J.; Machida, A.; Rizkalla, S.H.; Triantafillou, T.C. Fiber-reinforced polymer composites for construction—State-of-the-art review. J. Compos. Constr. 2002, 6, 73–87. [Google Scholar] [CrossRef] [Green Version]
- Papanicolaou, C.G.; Triantafillou, T.C.; Karlos, K.; Papathanasiou, M. Textile-reinforced mortar (TRM) versus FRP as strengthening material of URM walls: In-plane cyclic loading. Mater. Struct. 2007, 40, 1081–1097. [Google Scholar] [CrossRef]
- Valluzzi, M.R. Strengthening of masonry structures with fibre reinforced plastics: From modern conception to historical building preservation. Struct. Anal. Hist. Constr. 2008, 1, 33–45. [Google Scholar]
- Vailati, M.; Monti, G.; Di Gangi, G. Earthquake-Safe and Energy-Efficient Infill Panels for Modern Buildings. In Earthquake Engineering and Structural Dynamics in Memory of Ragnar Sigbjörnsson; Rupakhety, R., Ólafsson, S., Eds.; ICESD 2017. Geotechnical, Geological and Earthquake Engineering; Springer: Cham, Germany, 2018; Volume 44. [Google Scholar] [CrossRef]
- Vailati, M.; Monti, G. Earthquake-Resistant and Thermo-Insulating Infill Panel with Recycled-Plastic Joints. In Earthquakes and Their Impact on Society. Springer Natural Hazards; D’Amico, S., Ed.; Springer: Cham, Germany, 2016. [Google Scholar] [CrossRef]
- Furtado, A.; Rodrigues, H.; Arêde, A.; Varum, H. Experimental tests on strengthening strategies for masonry infill walls: A literature review. Constr. Build. Mater. 2020, 263, 120520. [Google Scholar] [CrossRef]
- Lanas, J.; Alvarez-Galindo, J.I. Masonry repair lime-based mortars: Factors affecting the mechanical behavior. Cem. Concr. Res. 2003, 33, 1867–1876. [Google Scholar] [CrossRef] [Green Version]
- Alecci, V.; De Stefano, M.; Focacci, F.; Luciano, R.; Rovero, L.; Stipo, G. Strengthening masonry arches with lime-based mortar composite. Buildings 2017, 7, 49. [Google Scholar] [CrossRef] [Green Version]
- Bentur, A.; Mindess, S. Fibre Reinforced Cementitious Composites; CRC Press: Boca Raton, FL, USA, 2006. [Google Scholar]
- Angiolilli, M.; Gregori, A.; Vailati, M. Lime-based mortar reinforced by randomly oriented short fibers for the retrofitting of the historical masonry structure. Materials 2020, 13, 3462. [Google Scholar] [CrossRef]
- Díez-Pascual, A.M. Carbon-Based Polymer Nanocomposites for High-Performance Applications. Polymers 2020, 12, 872. [Google Scholar] [CrossRef] [Green Version]
- Henshaw, J.M.; Han, W.; Owens, A.D. An overview of recycling issues for composite materials. J. Thermoplast. Compos. Mater. 1996, 9, 4–20. [Google Scholar] [CrossRef]
- Conroy, A.; Halliwell, S.; Reynolds, T. Composite recycling in the construction industry. Compos. Part A Appl. Sci. Manuf. 2006, 37, 1216–1222. [Google Scholar] [CrossRef]
- Pisello, A.L.; Castaldo, V.L.; Rosso, F.; Piselli, C.; Ferrero, M.; Cotana, F. Traditional and Innovative Materials for Energy Efficiency in Buildings. KEM 2016, 678, 14–34. [Google Scholar] [CrossRef]
- Bournas, D.A. Concurrent seismic and energy retrofitting of RC and masonry building envelopes using inorganic textile-based composites combined with insulation materials: A new concept. Compos. Part B Eng. 2018, 148, 166–179. [Google Scholar] [CrossRef]
- Santos, S.F.D.; Tonoli, G.H.D.; Mejia, J.E.B.; Fiorelli, J.; Savastano, H., Jr. Non-conventional cement-based composites reinforced with vegetable fibers: A review of strategies to improve durability. Mater. Construcción 2015, 65, 041. [Google Scholar]
- Tolêdo Filho, R.D.; Scrivener, K.; England, G.L.; Ghavami, K. Durability of alkali-sensitive Sisal and coconut fibres in cement mortar composites. Cem. Concr. Compos. 2000, 22, 127–143. [Google Scholar] [CrossRef]
- Fidelis, M.E.A.; De Andrade Silva, F.; Toledo Filho, R.D. The influence of fiber treatment on the mechanical behavior of jute textile reinforced concrete. Key Eng. Mater. 2014, 600, 469–474. [Google Scholar] [CrossRef]
- Ramamoorthy, S.K.; Skrifvars, M.; Persson, A. A review of natural fibers used in biocomposites: Plant, animal and regenerated cellulose fibers. Polym. Rev. 2015, 55, 107–162. [Google Scholar] [CrossRef]
- de Carvalho Bello, C.B.; Boem, I.; Cecchi, A.; Gattesco, N.; Oliveira, D.V. Experimental tests for the characterization of Sisal fiber reinforced cementitious matrix for strengthening masonry structures. Constr. Build. Mater. 2019, 219, 44–55. [Google Scholar] [CrossRef] [Green Version]
- Cristaldi, G.; Latteri, A.; Recca, G.; Cicala, G. Composites based on natural fibre fabrics. Woven Fabr. Eng. 2010, 17, 317–342. [Google Scholar]
- Wambua, P.; Ivens, J.; Verpoest, I. Natural fibres: Can they replace glass in fibre reinforced plastics? Compos. Sci. Technol. 2003, 63, 1259–1264. [Google Scholar] [CrossRef]
- Ticoalu, A.; Aravinthan, T.; Cardona, F. A review of current development in natural fiber composites for structural and infrastructure applications. In Proceedings of the Southern Region Engineering Conference (SREC 2010), Toowoomba, Australia, 10–12 November 2010; pp. 113–117. [Google Scholar]
- Begum, K.; Islam, M.A. Natural fiber as a substitute to synthetic fiber in polymer composites: A review. Res. J. Eng. Sci. 2013, 2, 46–53. [Google Scholar]
- Razak, H.A.; Ferdiansyah, T. Toughness characteristics of Arenga pinnata fibre concrete. J. Nat. Fibers 2005, 2, 89–103. [Google Scholar] [CrossRef]
- Roma, L.C., Jr.; Martello, L.S.; Savastano, H., Jr. Evaluation of mechanical, physical and thermal performance of cement-based tiles reinforced with vegetable fibers. Constr. Build. Mater. 2008, 22, 668–674. [Google Scholar] [CrossRef]
- Savastano, H., Jr.; Agopyan, V.; Nolasco, A.M.; Pimentel, L. Plant fibre reinforced cement components for roofing. Constr. Build. Mater. 1999, 13, 433–438. [Google Scholar] [CrossRef]
- Al-Oraimi, S.K.; Seibi, A.C. Mechanical characterisation and impact behaviour of concrete reinforced with natural fibres. Compos. Struct. 1995, 32, 165–171. [Google Scholar] [CrossRef]
- Ramakrishna, G.; Sundararajan, T. Impact strength of a few natural fibre reinforced cement mortar slabs: A comparative study. Cem. Concr. Compos. 2005, 27, 547–553. [Google Scholar] [CrossRef]
- Onuaguluchi, O.; Banthia, N. Plant-based natural fibre reinforced cement composites: A review. Cem. Concr. Compos. 2016, 68, 96–108. [Google Scholar] [CrossRef]
- Fajrin, J. Mechanical Properties of Natural Fiber Composite Made of Indonesian Grown Sisal. Natural fiber composites for structural applications. J. Info Tek. 2016, 17, 69–84. [Google Scholar]
- Li, Y.; Mai, Y.W.; Ye, L. Sisal fibre and its composites: A review of recent developments. Compos. Sci. Technol. 2000, 60, 2037–2055. [Google Scholar] [CrossRef]
- Bisanda, E.T.N.; Ansell, M.P. Properties of Sisal-CNSL composites. J. Mater. Sci. 1992, 27, 1690–1700. [Google Scholar] [CrossRef]
- Mukherjee, P.S.; Satyanarayana, K.G. Structure and properties of some vegetable fibres. J. Mater. Sci. 1984, 19, 3925–3934. [Google Scholar] [CrossRef]
- Chand, N.; Satyanarayana, K.G.; Rohatgi, P.K. Mechanical characteristics of sunhemp fibres. Indian J. Text. Res. 1986, 1, 86–89. [Google Scholar]
- Chand, N.; Hashmi, S.A.R. Mechanical properties of Sisal fibre at elevated temperatures. J. Mater. Sci. 1993, 28, 6724–6728. [Google Scholar] [CrossRef]
- Soroushian, P.; Shah, Z.; Won, J.P. Aging effects on the structure and properties of recycled wastepaper fiber cement composites. Mater. Struct. 1996, 29, 312–317. [Google Scholar] [CrossRef]
- Olivito, R.S.; Cevallos, O.A.; Carrozzini, A. Development of durable cementitious composites using Sisal and flax fabrics for reinforcement of masonry structures. Mater. Des. 2014, 57, 258–268. [Google Scholar] [CrossRef]
- De Andrade Silva, F.; Toledo Filho, R.D.; de Almeida Melo Filho, J.; Fairbairn, E.D.M.R. Physical and mechanical properties of durable Sisal fiber–cement composites. Constr. Build. Mater. 2010, 24, 777–785. [Google Scholar] [CrossRef]
- Fujiyama, R.; Darwish, F.; Pereira, M.V. Mechanical characterization of Sisal reinforced cement mortar. Theor. Appl. Mech. Lett. 2014, 4, 061002. [Google Scholar] [CrossRef] [Green Version]
- Lima, P.R.; Toledo Filho, R.D.; Melo Filho, J.A. Compressive stress-strain behaviour of cement mortar-composites reinforced with short Sisal fibre. Mater. Res. 2014, 17, 38–46. [Google Scholar] [CrossRef] [Green Version]
- De Andrade Silva, F.; Mobasher, B.; Toledo Filho, R.D. Cracking mechanisms in durable Sisal fiber reinforced cement composites. Cem. Concr. Compos. 2009, 31, 721–730. [Google Scholar] [CrossRef]
- Prasad, A.R.; Rao, K.M. Mechanical properties of natural fibre reinforced polyester composites: Jowar, Sisal and bamboo. Mater. Des. 2011, 32, 4658–4663. [Google Scholar] [CrossRef]
- c. Methods of test for mortar for masonry—Part. 11: Determination of flexural and compressive strength of hardened mortar.
- UNI-EN 459-2:2010. Building lime—Part. 2: Test methods.
- EN 1015-3:1999. Methods of test for mortar for masonry—Part 3: Determination of consistence of fresh mortar.
- ASTM C1437-20. Standard Test Method for Flow of Hydraulic Cement Mortar.
- Griffith, A.A. The phenomena of rupture and flow in solids. Phil. Trans. R. Soc. 1920, 221, 582–593. [Google Scholar]
Figure 1.
The two most common shapes of fibers commercially available: (a) woven fabric; (b) reels. They are briefly named RM1 and RM2, respectively, in the water retention test.
Figure 1.
The two most common shapes of fibers commercially available: (a) woven fabric; (b) reels. They are briefly named RM1 and RM2, respectively, in the water retention test.

Figure 2.
A 40× magnification of Sisal wire with Leica stereo microscope. Scale in micrometer (1 μm = 0.001 mm).
Figure 2.
A 40× magnification of Sisal wire with Leica stereo microscope. Scale in micrometer (1 μm = 0.001 mm).

Figure 3.
Fibers preparation steps: (a) unwrapped of spiral strand; (b) 13 mm short fibers after cutting.
Figure 3.
Fibers preparation steps: (a) unwrapped of spiral strand; (b) 13 mm short fibers after cutting.

Figure 4.
Typical test arrangement for determining the water retention of fresh mortar.

Figure 5.
From the right: glass plate (GP), GP and filter paper plate (GFP), GFP and non-woven tissue (GFPT), GFPT and plastic ring (GFPTR), GFPTR with the fresh mortar placed.
Figure 5.
From the right: glass plate (GP), GP and filter paper plate (GFP), GFP and non-woven tissue (GFPT), GFPT and plastic ring (GFPTR), GFPTR with the fresh mortar placed.

Figure 6.
Slump test on fresh mortar. (a) The specimen just removed from the mold; (b) the two orthogonal diameters measured after the table was shaken.
Figure 6.
Slump test on fresh mortar. (a) The specimen just removed from the mold; (b) the two orthogonal diameters measured after the table was shaken.

Figure 7.
3PBT carried out at the LPMS of L’Aquila. (a) Notch geometry adopted in the tests; (b) setup of a specimen with the Zwick Roell hydraulic machine used for applying the load under displacement control.
Figure 7.
3PBT carried out at the LPMS of L’Aquila. (a) Notch geometry adopted in the tests; (b) setup of a specimen with the Zwick Roell hydraulic machine used for applying the load under displacement control.

Figure 8.
BT carried out at LPMS of L’Aquila. (a) First one-half specimen adopted in the tests; (b) setup of the specimen for the tensile test carried out with the Zwick Roell machine under displacement control.
Figure 8.
BT carried out at LPMS of L’Aquila. (a) First one-half specimen adopted in the tests; (b) setup of the specimen for the tensile test carried out with the Zwick Roell machine under displacement control.

Figure 9.
CT carried out at LPMS of L’Aquila. (a) Second one-half specimen adopted in the tests; (b) setup of the specimen for the compressive test carried out with the Zwick Roell machine under displacement control.
Figure 9.
CT carried out at LPMS of L’Aquila. (a) Second one-half specimen adopted in the tests; (b) setup of the specimen for the compressive test carried out with the Zwick Roell machine under displacement control.

Figure 10.
Setup of the tensile test of the strands carried out with the Zwick Roell machine under displacement control at the LPMS of L’Aquila. (a) The wooden ends protecting the strands by tearing due to the pressure of the clamps; (b) typical tensile failure of the strands.
Figure 10.
Setup of the tensile test of the strands carried out with the Zwick Roell machine under displacement control at the LPMS of L’Aquila. (a) The wooden ends protecting the strands by tearing due to the pressure of the clamps; (b) typical tensile failure of the strands.

Figure 11.
On the (left): average values of the water retention test performed on the mortar reinforced with RM1 and RM2 dispersed fibers. On the (right): average values of the fiber water absorbed by the two fibers.
Figure 11.
On the (left): average values of the water retention test performed on the mortar reinforced with RM1 and RM2 dispersed fibers. On the (right): average values of the fiber water absorbed by the two fibers.

Figure 12.
Slump test results for the fibers, F1 and F2, by varying the fiber content, F.

Figure 13.
Bending stress vs. vertical displacement in the 3PBTs for: (a) Un-strengthened case (UR). Strengthened cases with two fiber types (F1 and F2) and three fiber contents, F: (b) 0.6%; (c) 0.75%; (d) 1.0%.
Figure 13.
Bending stress vs. vertical displacement in the 3PBTs for: (a) Un-strengthened case (UR). Strengthened cases with two fiber types (F1 and F2) and three fiber contents, F: (b) 0.6%; (c) 0.75%; (d) 1.0%.

Figure 14.
(a) Average bending strength and (b) average fracture energy calculated in the 3PBT for the fibers, F1 and F2, and three different fiber contents, F.
Figure 14.
(a) Average bending strength and (b) average fracture energy calculated in the 3PBT for the fibers, F1 and F2, and three different fiber contents, F.

Figure 15.
Tensile stress vs. vertical displacement in the BTs for: (a) Un-strengthened case (UR). Strengthened cases with two fiber types, F1 and F2, and three fiber contents, F: (b) 0.6%; (c) 0.75%; (d) 1.0%.
Figure 15.
Tensile stress vs. vertical displacement in the BTs for: (a) Un-strengthened case (UR). Strengthened cases with two fiber types, F1 and F2, and three fiber contents, F: (b) 0.6%; (c) 0.75%; (d) 1.0%.

Figure 16.
Average tensile strength calculated in the BTs for the fibers, F1 and F2, and three fiber contents, F.
Figure 16.
Average tensile strength calculated in the BTs for the fibers, F1 and F2, and three fiber contents, F.

Figure 17.
Compressive stress vs. vertical strain in the CTs for: (a) un-strengthened case (UR). Strengthened cases for the fibers, F1 and F2, and three fiber contents, F: (b) 0.6%; (c) 0.75%; (d) 1.0%.
Figure 17.
Compressive stress vs. vertical strain in the CTs for: (a) un-strengthened case (UR). Strengthened cases for the fibers, F1 and F2, and three fiber contents, F: (b) 0.6%; (c) 0.75%; (d) 1.0%.

Figure 18.
Average compressive strength in the CTs for fibers F1 and F2 and three fiber contents, F.
Figure 18.
Average compressive strength in the CTs for fibers F1 and F2 and three fiber contents, F.

Figure 19.
Increase of the mechanical properties in the case of, (a) bending strength ; (b) fracture energy ; (c) tensile strength and, (d) compressive strength , with respect to the unstrengthened case for the three fiber contents F. The bars are coupled by type of fiber and are distinguished by color, black and red for the fibers F1 and F2, respectively, to simplify the comparison.


Figure 20.
Tensile force F measured in the Sisal strand tensile tests for two specimens.

Figure 21.
Cracks after the 3PBTs. (a) Fibers F2, 0.6%; (b) Fibers F2, 1.0%; (c) Fibers F1, 0.6%; (d) Fibers F1, 1.0%.
Figure 21.
Cracks after the 3PBTs. (a) Fibers F2, 0.6%; (b) Fibers F2, 1.0%; (c) Fibers F1, 0.6%; (d) Fibers F1, 1.0%.


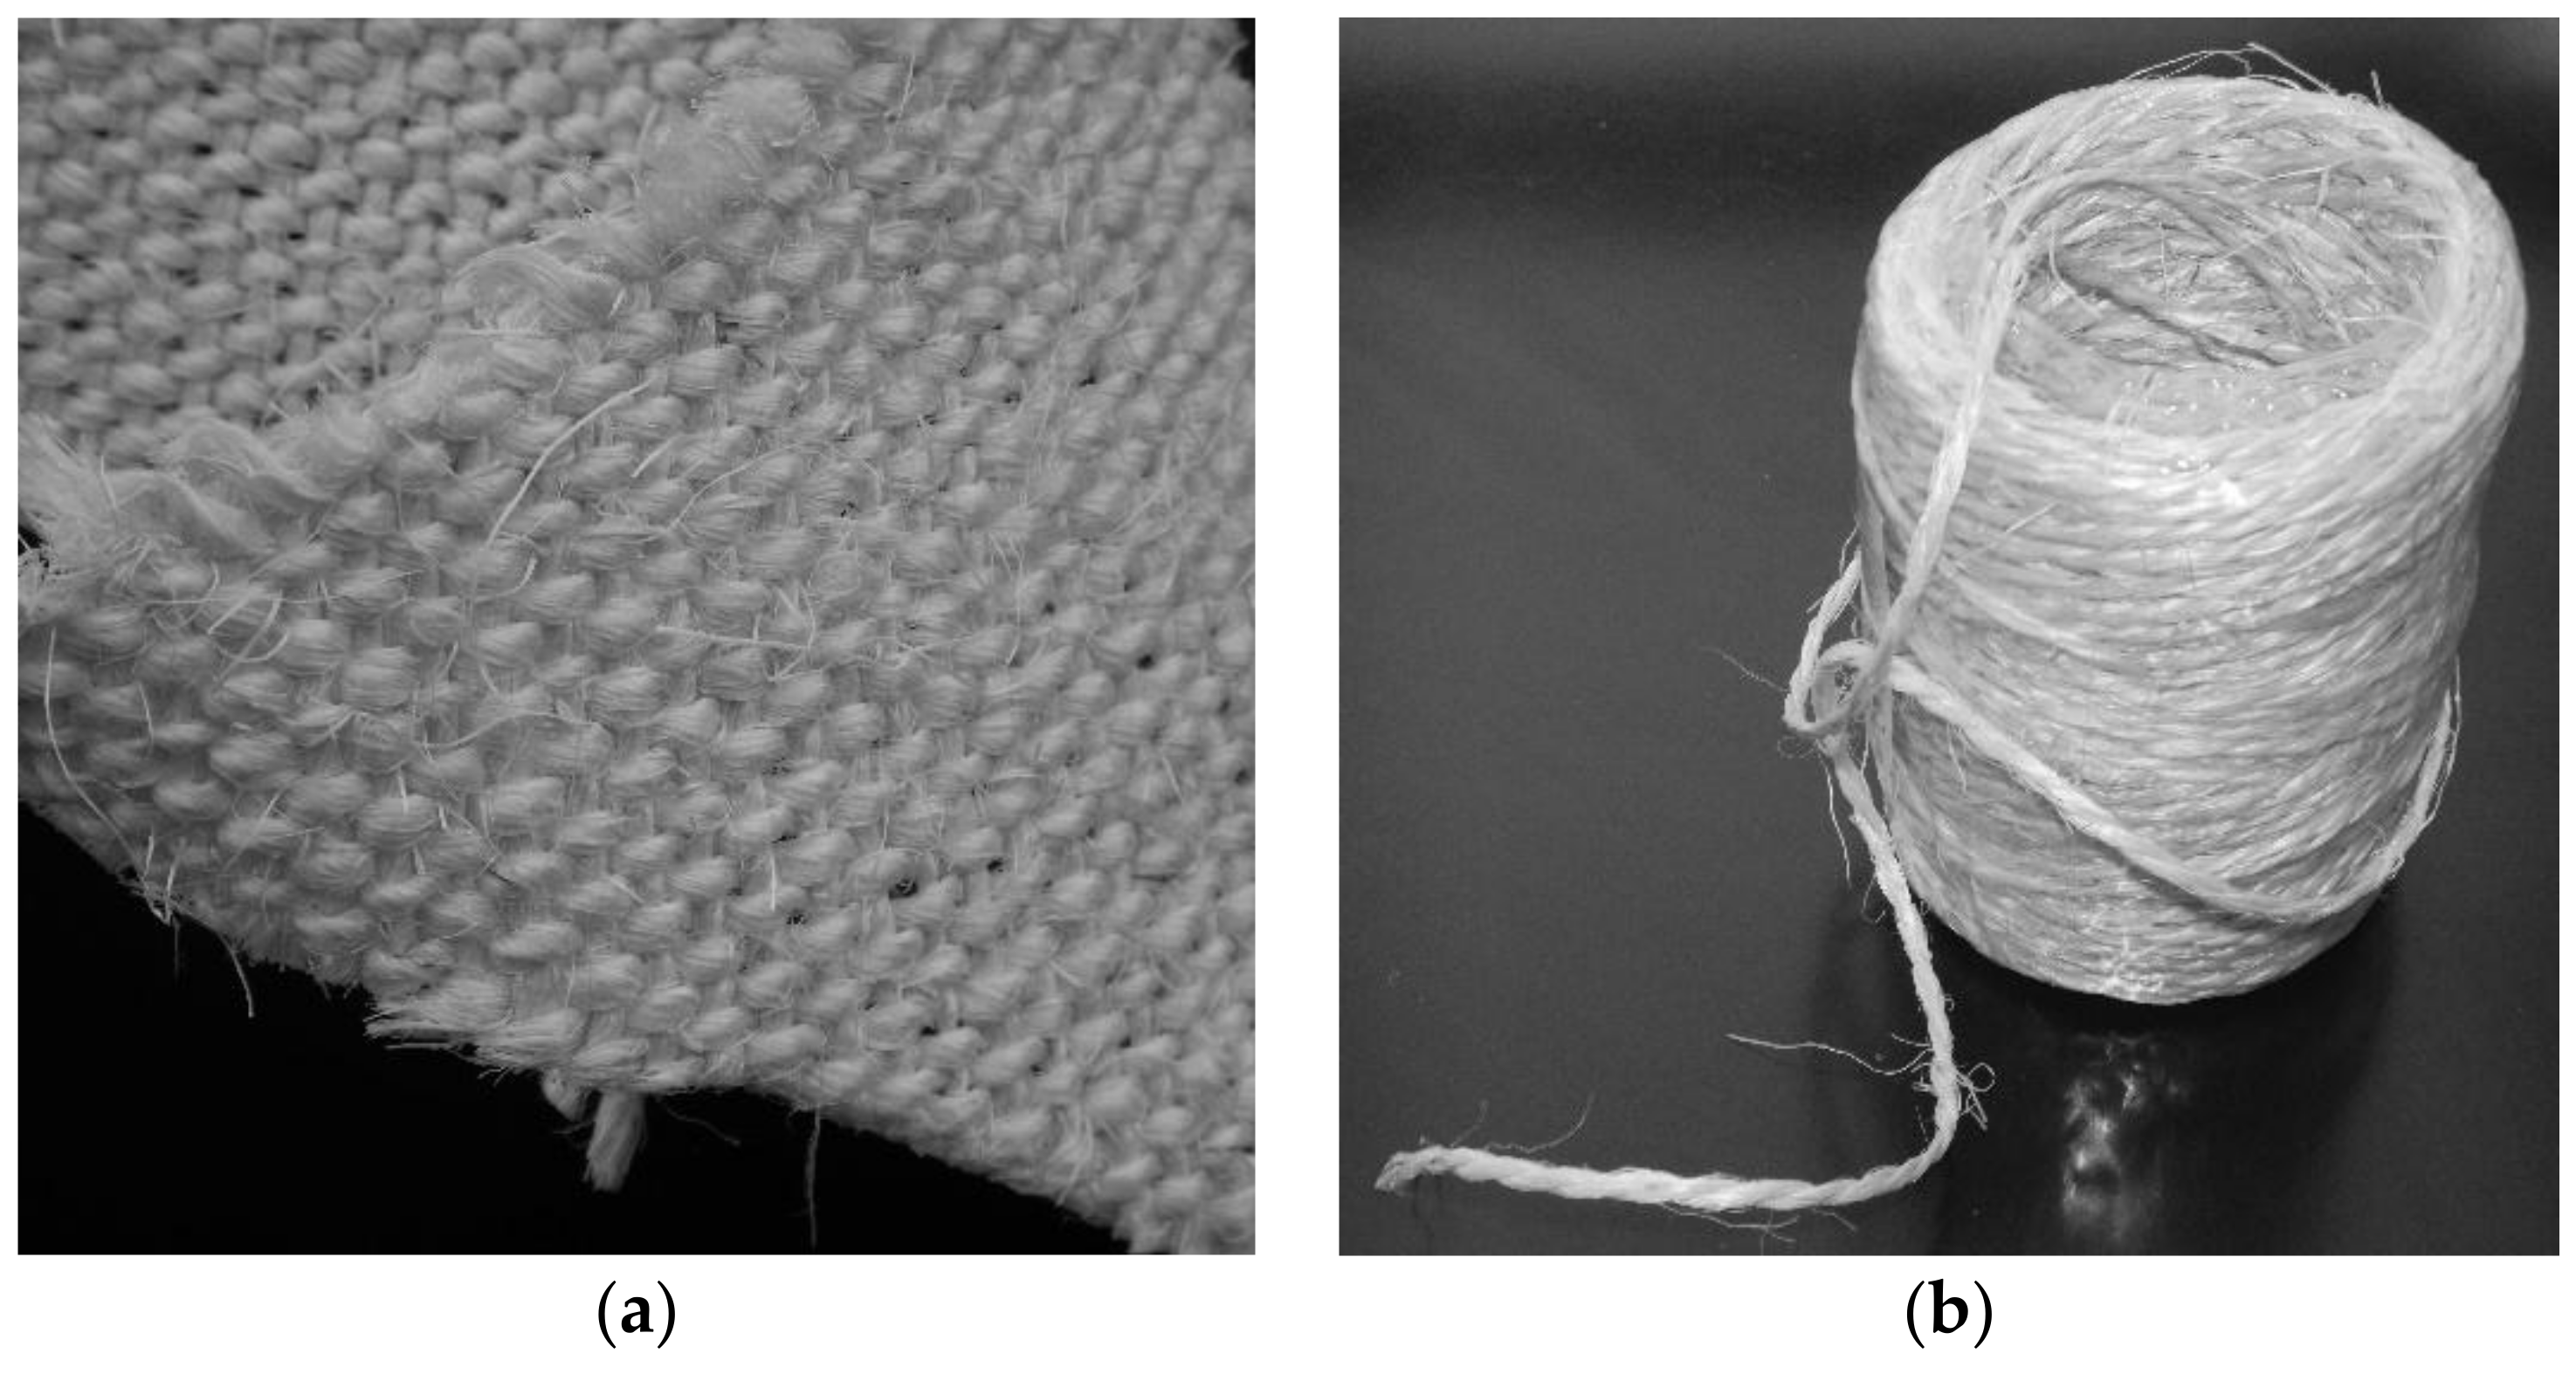
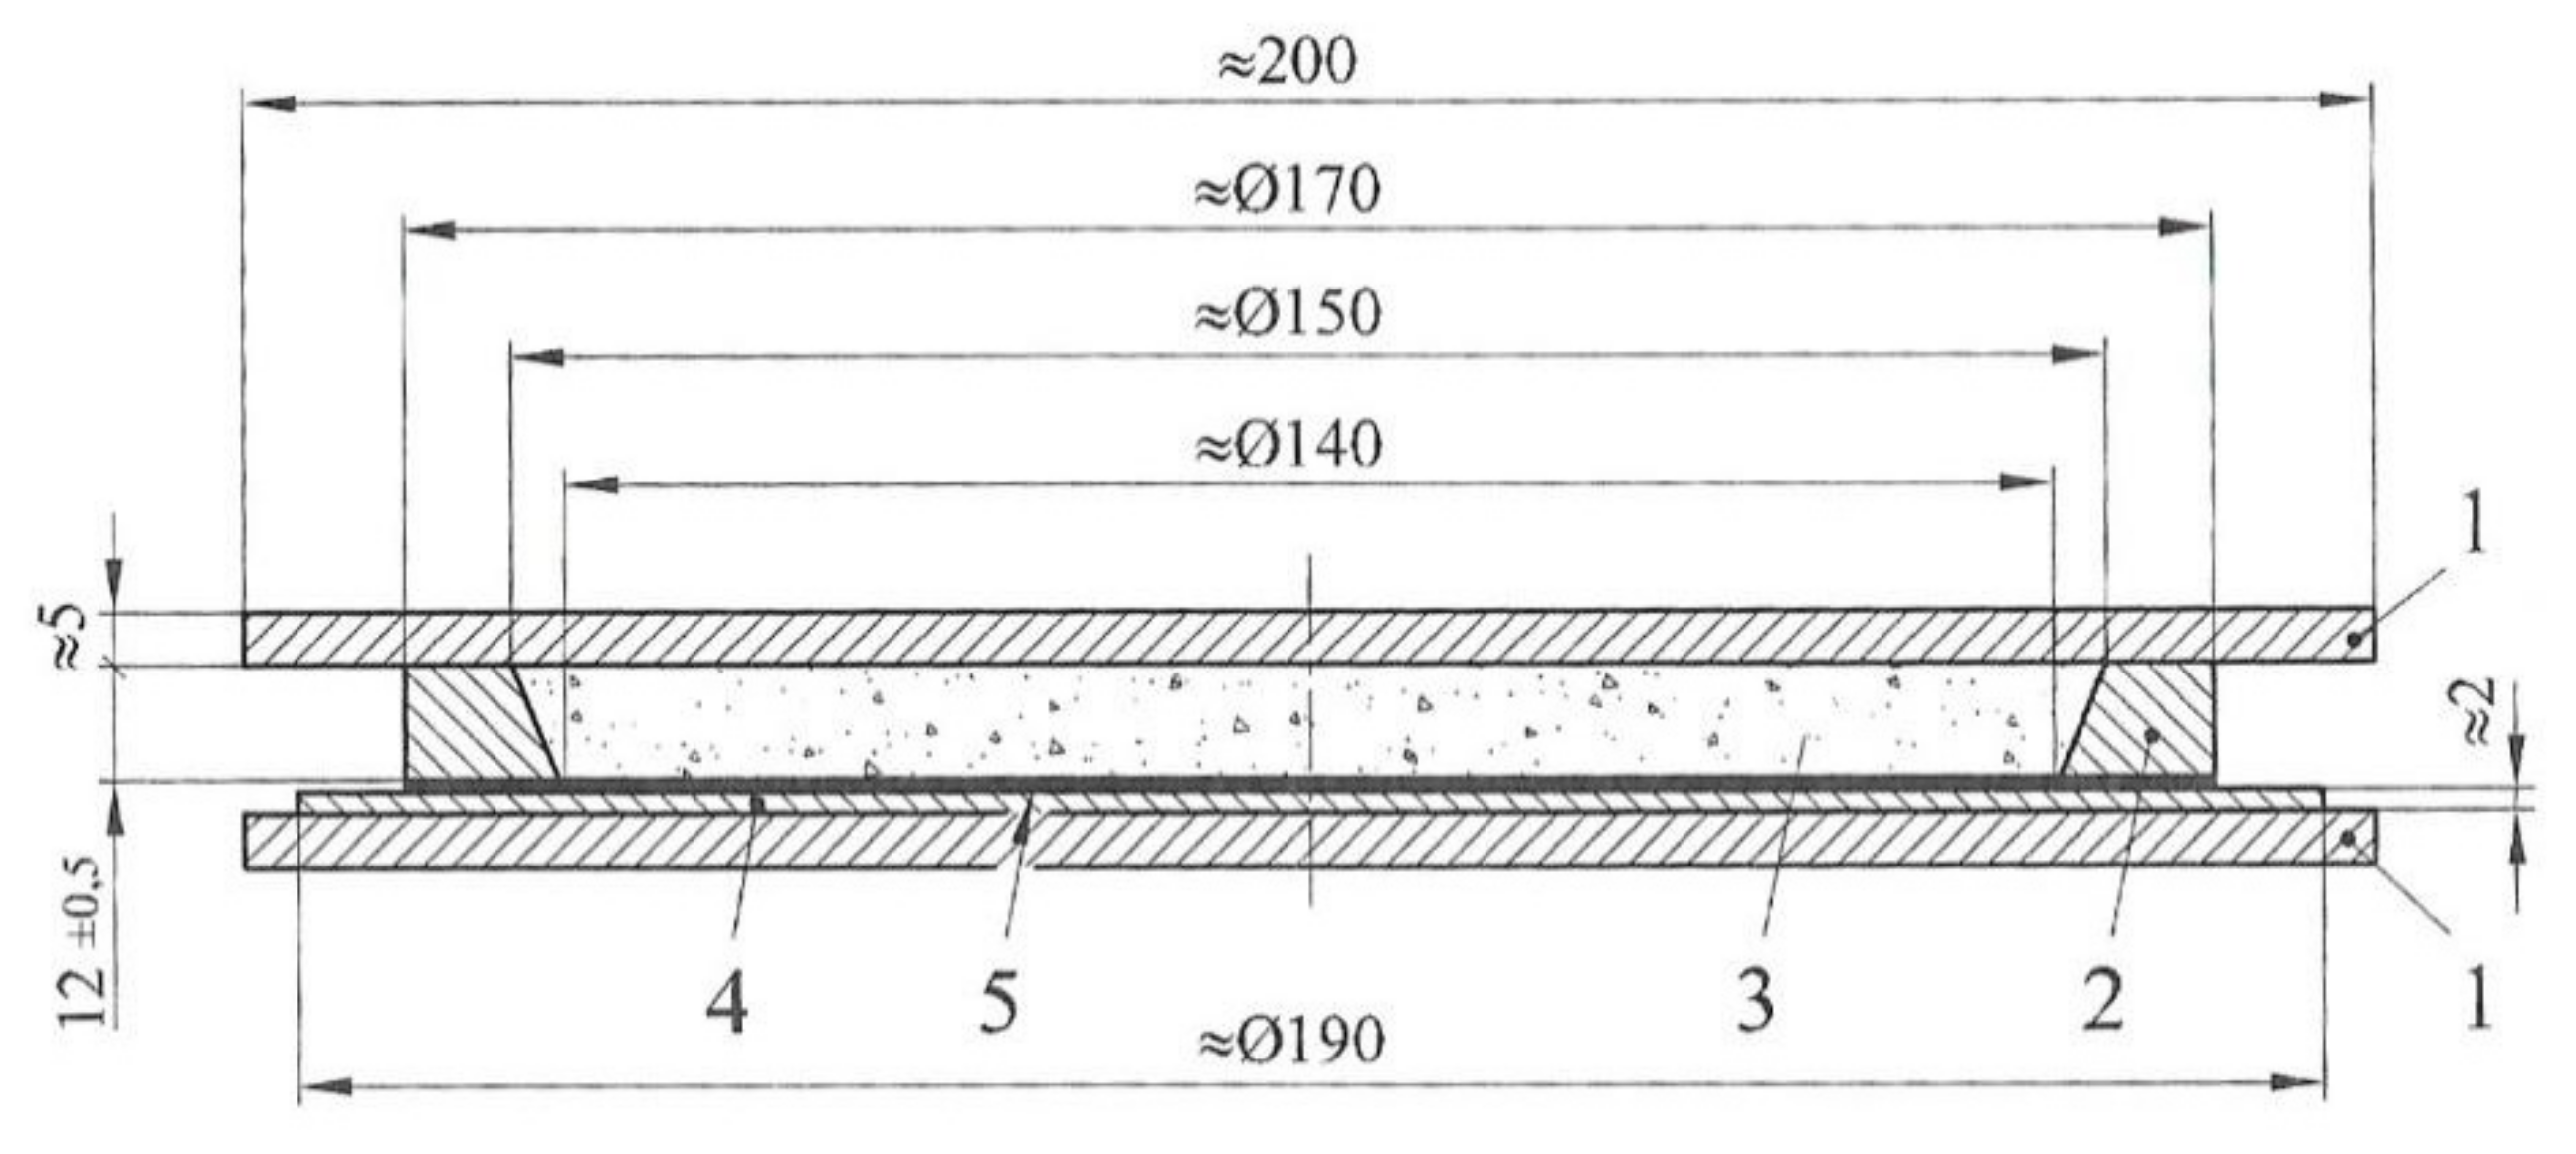
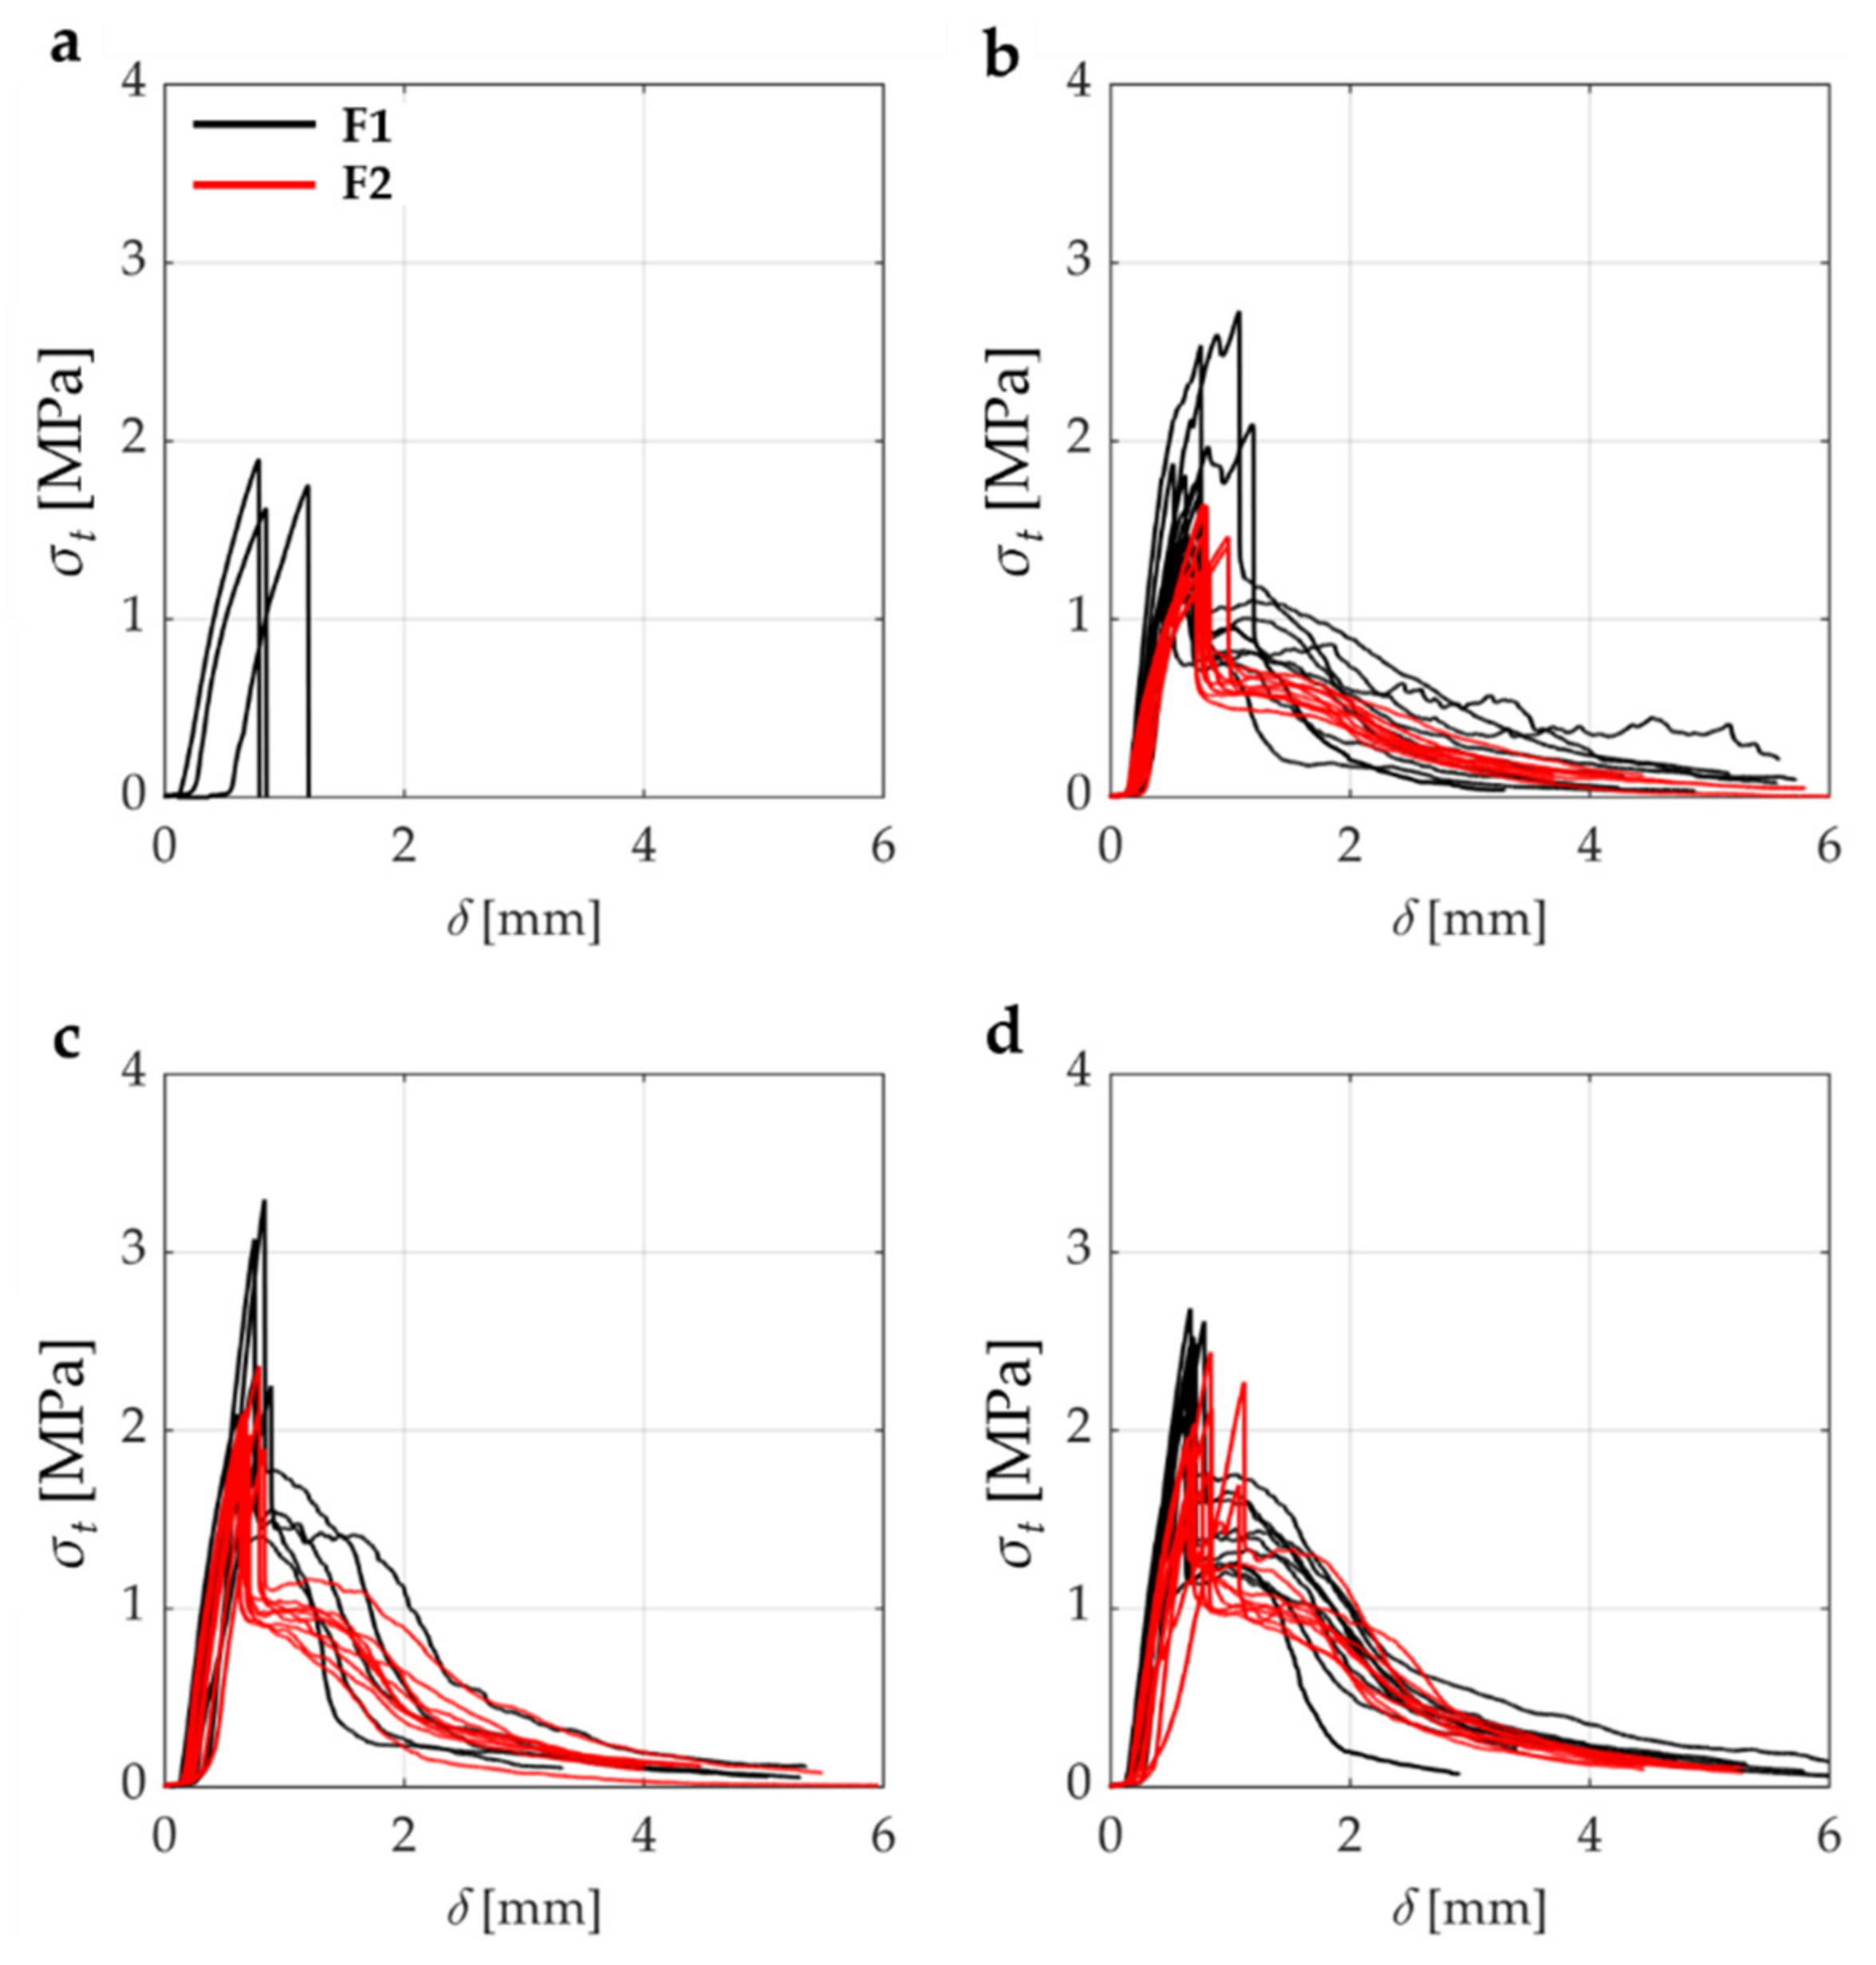
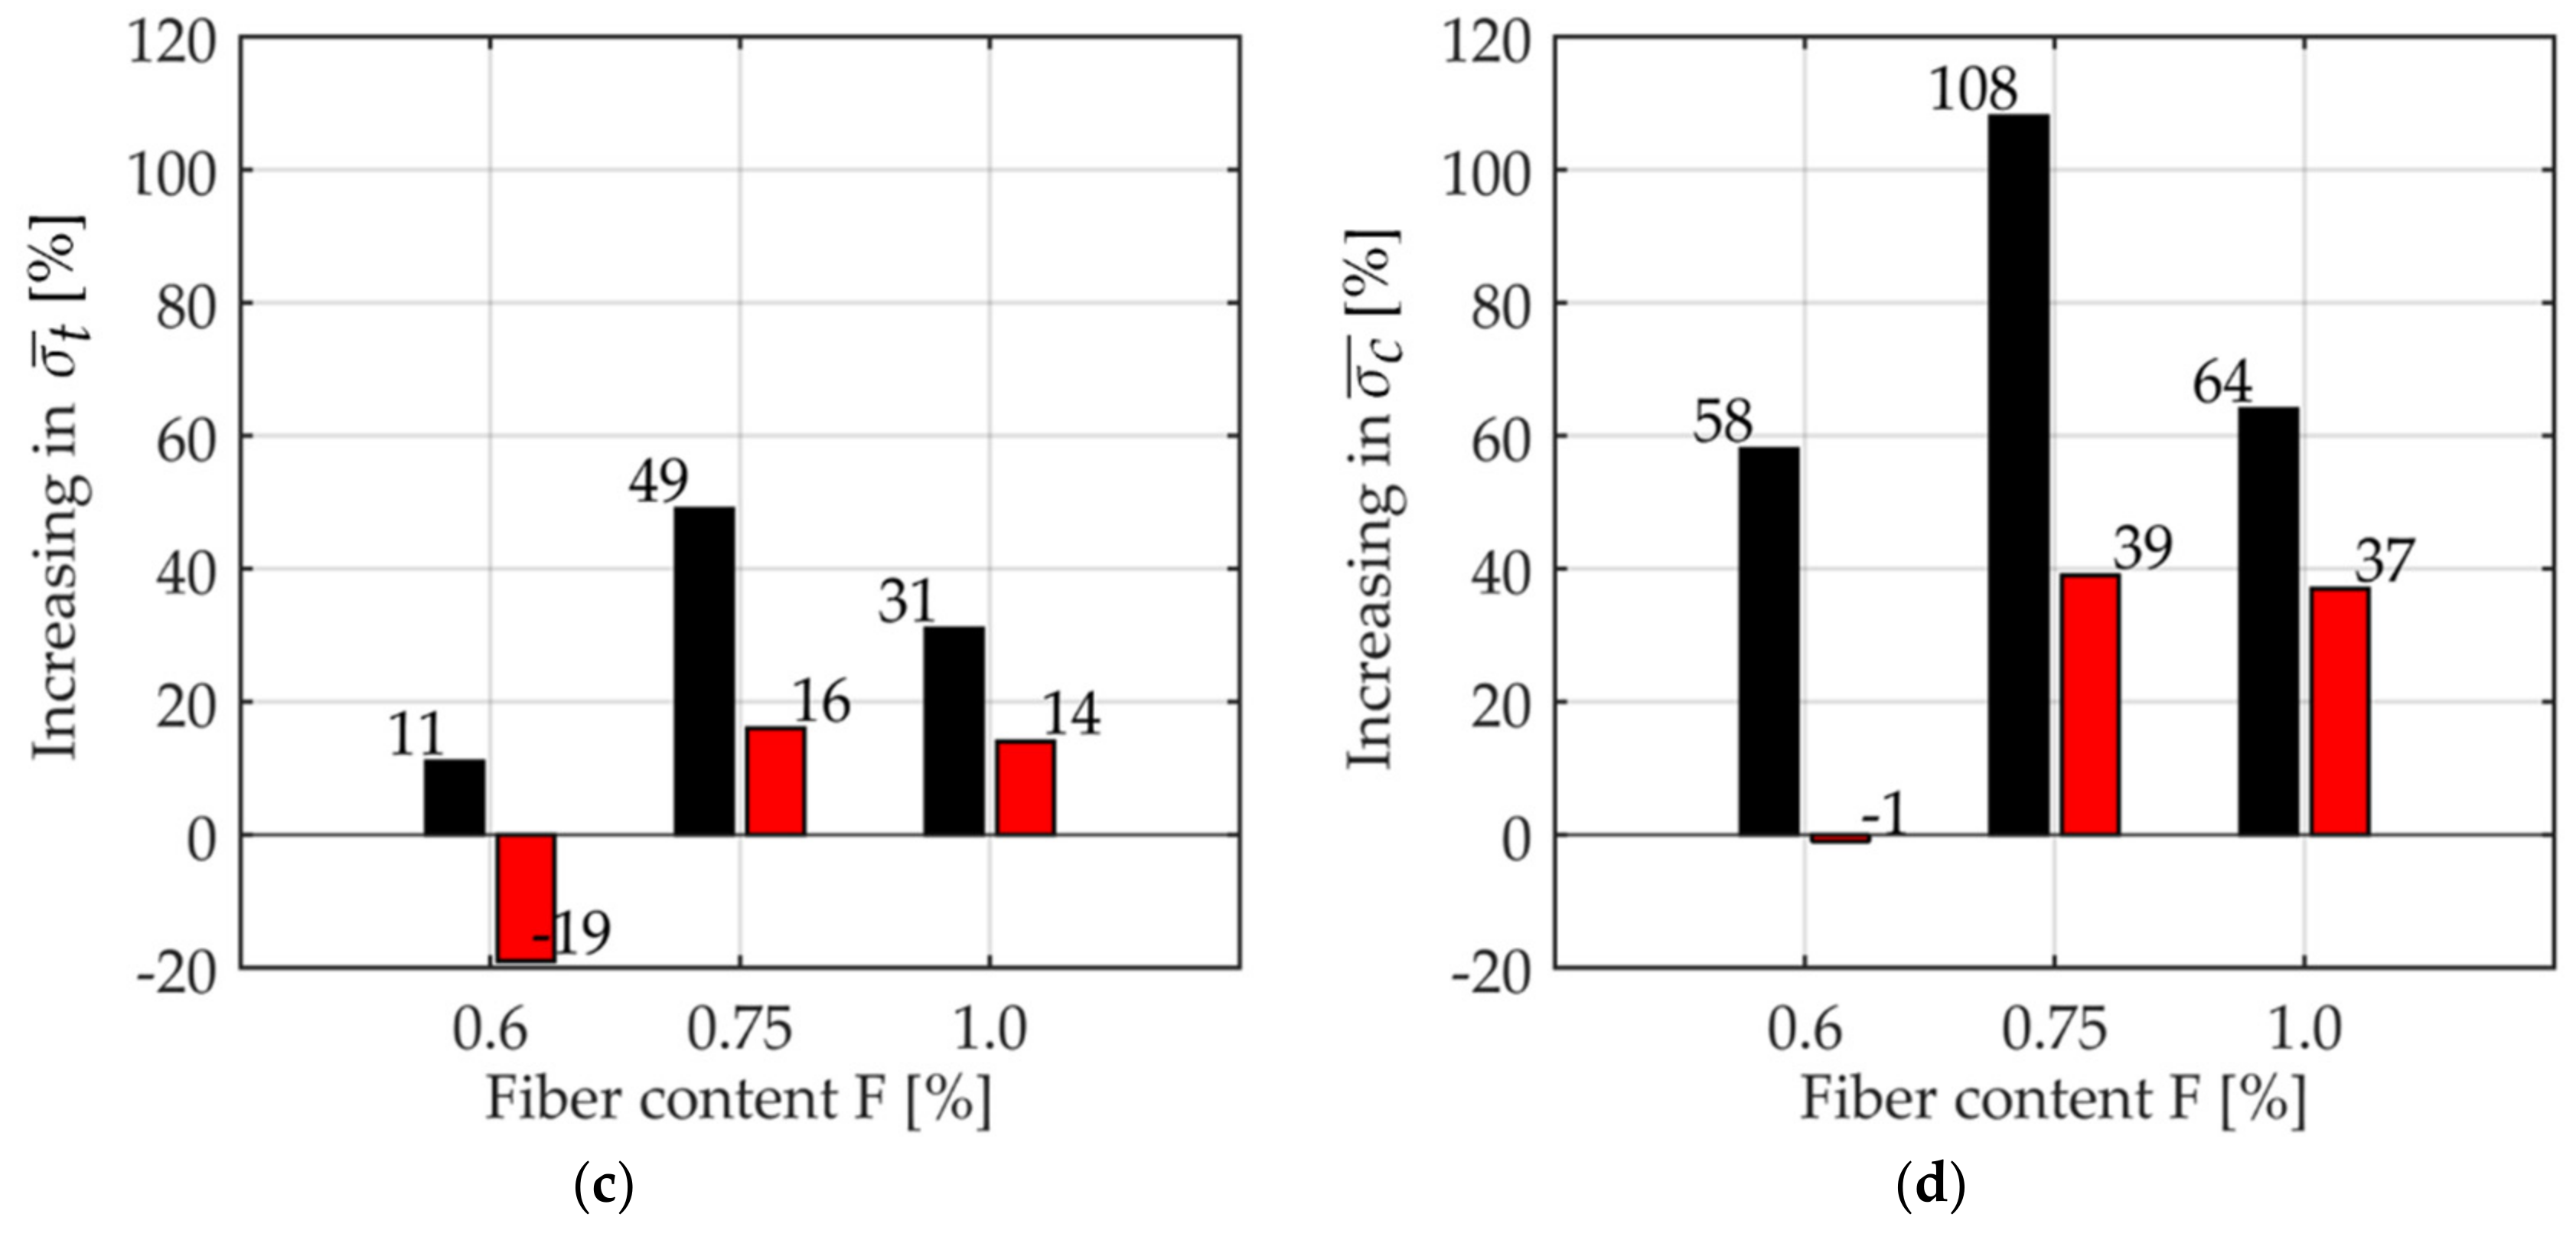
Table 1.
Geometry and mechanical properties of the Sisal fibers used in the experiments.
| Name | lf [mm] | df [mm] | d*f [mm] | ρfib [kN/m3] | |
|---|---|---|---|---|---|
| F1 | 24 | 0.28 | 2.0 | 10.6 | 130 |
| F2 | 13 |
Table 2.
Mixture ratio of the mortar.
| Family | Component | % |
|---|---|---|
| Binders 1 | Lime | 30 |
| Portland cement | 70 | |
| Chemicals 2 | Fluidizer | 0.2 |
| Resin | 0.1 | |
| Fibers 2 | Sisal | 0.6, 0.75, 1.00 |
| Aggregates 2 | Sand | 65 |
| - | Water | 20 2 (80) 2 |
1 The total weight of the binder. 2 The total weight of the product.
Table 3.
Fibers aspect ratio compared with a mortar specimen of dimensions 40 × 40 × 160 mm.
| Name | lf [mm] | % The Total Weight | Fibers Number | Fibers Volume [mm3] | % The Total Volume |
|---|---|---|---|---|---|
| F1 | 24 | 0.60 | 1965 | 2830 | 1.0 |
| 0.75 | 2457 | 3538 | 1.3 | ||
| 1.00 | 3276 | 4717 | 1.7 | ||
| F2 | 13 | 0.60 | 3627 | 2829 | 1.0 |
| 0.75 | 4534 | 3537 | 1.3 | ||
| 1.00 | 6045 | 4715 | 1.7 | ||
| Fiber weight and volume of 13 mm length: 8.27 × 10⁻⁴ g/0.78 mm3 Fiber weight and volume of 24 mm length: 15.26 × 10⁻⁴ g/1.44 mm3 | |||||
Table 4.
Results of the water retention test performed on one unreinforced mortar specimen.
| m1 [g] | m2 [g] | m3 [g] | m4 [g] | m5 [g] | m6 [g] | m7 [g] | wr [%] | |
|---|---|---|---|---|---|---|---|---|
| t3 | 578.76 | 600.69 | 601.35 | 686.49 | 998.22 | 23.00 | 1.07 | 96.66 |
| t10 | 589.03 | 611.71 | 612.38 | 697.81 | 1030.67 | 24.59 | 1.91 | 95.35 |
| t60 | 581.25 | 603.62 | 604.34 | 689.99 | 1051.61 | 25.75 | 3.38 | 93.20 |
Table 5.
Results of the water retention test performed on one mortar specimen reinforced with RM1 dispersed fibers.
Table 5.
Results of the water retention test performed on one mortar specimen reinforced with RM1 dispersed fibers.
| m1 [g] | m2 [g] | m3 [g] | m4 [g] | m5 [g] | m6 [g] | m7 [g] | wr [%] | |
|---|---|---|---|---|---|---|---|---|
| t3 | 578.72 | 601.14 | 601.77 | 686.91 | 1012.89 | 22.75 | 0.33 | 98.23 |
| t10 | 589.02 | 611.04 | 611.73 | 697.18 | 1024.90 | 22.61 | 0.59 | 97.66 |
| t60 | 590.26 | 612.35 | 613.01 | 698.66 | 1006.49 | 23.43 | 1.34 | 96.10 |
Table 6.
Results of the water retention test performed on one mortar specimen reinforced with RM2 dispersed fibers.
Table 6.
Results of the water retention test performed on one mortar specimen reinforced with RM2 dispersed fibers.
| m1 [g] | m2 [g] | m3 [g] | m4 [g] | m5 [g] | m6 [g] | m7 [g] | wr [%] | |
|---|---|---|---|---|---|---|---|---|
| t3 | 581.07 | 603.78 | 604.48 | 689.58 | 1042.45 | 23.01 | 0.30 | 98.30 |
| t10 | 590.06 | 612.58 | 613.28 | 698.68 | 1059.00 | 23.15 | 0.63 | 97.79 |
| t60 | 578.58 | 600.48 | 601.16 | 686.77 | 1031.52 | 23.67 | 1.77 | 95.74 |
Table 7.
Statistical data of the 3PBTs. CV is the coefficient of variation.
| Mean | Min | Max | St.dev. | CV | |
|---|---|---|---|---|---|
| UR | 3.62 | 2.86 | 4.01 | 0.66 | 0.18 |
| F1-0.6% | 7.56 | 5.54 | 9.56 | 1.45 | 0.19 |
| F1-0.75% | 6.22 | 5.30 | 7.16 | 0.86 | 0.14 |
| F1-1.0% | 7.47 | 6.40 | 8.60 | 0.81 | 0.11 |
| F2-0.6% | 5.48 | 5.03 | 6.06 | 0.38 | 0.07 |
| F2-0.75% | 6.31 | 5.69 | 7.04 | 0.46 | 0.07 |
| F2-1.0% | 6.64 | 5.39 | 7.97 | 0.79 | 0.12 |
Table 8.
Statistical data of the BTs. CV is the coefficient of variation.
| Mean | Min | Max | St.dev. | CV | |
|---|---|---|---|---|---|
| UR | 1.75 | 1.62 | 1.89 | 0.14 | 0.08 |
| F1-0.6% | 1.94 | 1.44 | 2.73 | 0.44 | 0.23 |
| F1-0.75% | 2,61 | 2.09 | 3.30 | 0.54 | 0.21 |
| F1-1.0% | 2.29 | 1.70 | 2.68 | 0.33 | 0.14 |
| F2-0.6% | 1.43 | 1.27 | 1.64 | 0.14 | 0.10 |
| F2-0.75% | 2.04 | 1.86 | 2.36 | 0.15 | 0.07 |
| F2-1.0% | 1.99 | 1.69 | 2.44 | 0.26 | 0.13 |
Table 9.
Statistical data of the CTs. CV is the coefficient of variation.
| Mean | Min | Max | St.dev. | CV | |
|---|---|---|---|---|---|
| UR | 12.77 | 8.95 | 14.02 | 1.91 | 0.15 |
| F1-0.6% | 20.12 | 14.79 | 28.42 | 5.24 | 0.26 |
| F1-0.75% | 26.61 | 20.97 | 31.75 | 4.23 | 0.16 |
| F1-1.0% | 20.99 | 18.67 | 23.41 | 1.76 | 0.08 |
| F2-0.6% | 12.58 | 11.21 | 14.84 | 1.53 | 0.12 |
| F2-0.75% | 17.79 | 16.67 | 18.52 | 0.55 | 0.03 |
| F2-1.0% | 17.50 | 12.85 | 21.52 | 2.82 | 0.16 |
Publisher’s Note: MDPI stays neutral with regard to jurisdictional claims in published maps and institutional affiliations. |
© 2021 by the authors. Licensee MDPI, Basel, Switzerland. This article is an open access article distributed under the terms and conditions of the Creative Commons Attribution (CC BY) license (https://creativecommons.org/licenses/by/4.0/).
Share and Cite
MDPI and ACS Style
Vailati, M.; Mercuri, M.; Angiolilli, M.; Gregori, A. Natural-Fibrous Lime-Based Mortar for the Rapid Retrofitting of Heritage Masonry Buildings. Fibers 2021, 9, 68. https://0-doi-org.brum.beds.ac.uk/10.3390/fib9110068
AMA Style
Vailati M, Mercuri M, Angiolilli M, Gregori A. Natural-Fibrous Lime-Based Mortar for the Rapid Retrofitting of Heritage Masonry Buildings. Fibers. 2021; 9(11):68. https://0-doi-org.brum.beds.ac.uk/10.3390/fib9110068
Chicago/Turabian StyleVailati, Marco, Micaela Mercuri, Michele Angiolilli, and Amedeo Gregori. 2021. "Natural-Fibrous Lime-Based Mortar for the Rapid Retrofitting of Heritage Masonry Buildings" Fibers 9, no. 11: 68. https://0-doi-org.brum.beds.ac.uk/10.3390/fib9110068
Note that from the first issue of 2016, this journal uses article numbers instead of page numbers. See further details here.