
Cation–Anionic Interactions of Dyes in Aqueous Solutions: Bromocresol Purple in the Processes of Dissimilar Association


Research Institute of Chemistry, V. N. Karazin Kharkiv National University, Svobody sq. 4, 61022 Kharkiv, Ukraine
Colorants 2022, 1(1), 5-19; https://0-doi-org.brum.beds.ac.uk/10.3390/colorants1010003
Submission received: 31 October 2021
/
Revised: 11 December 2021
/
Accepted: 14 December 2021
/
Published: 22 December 2021
Abstract
:The interaction between single- or double-charged anions of bromocresol purple (BP) and cyanine cations (quinaldine blue, QB, or quinaldine red, QR) at concentrations of dyes 5.0·10−7–4.0·10−5 mol/L has been investigated by vis-spectroscopy. The thermodynamic constants of dissimilar associations (Kas) have been studied. Comparison of the values of lg Kas shows that QB− associates of BP− are more stable (6.61 ± 0.07) than QR associates (4.84 ± 0.06); a similar phenomenon is observed for associates of the BP2− anion. Semi-empirical calculations (PM3 method) are in agreement with the vis-spectroscopy data and indicate that the association of dye into an associate is possible. The standard enthalpies of formation of associates (ΔfHo) and energy diagrams have been determined. The ΔfHo data indicate that the formation of an associate between dye ions is an energetically favourable process. The gain in energy significantly exceeds the systematic error of semi-empirical calculations and increases from 157 kJ/mol (associate ”BP− + QB+”) to 729 kJ/mol (associate “BP2− + QR+”). The most probable structures of dissimilar associates are presented. The study of the dissimilar association develops the concept of intermolecular interactions in solutions.
1. Introduction
Sulfonephthalein dyes have a wide range of applications, from acid–base or metallochromic indicators to analytical reagents for spectral determination of a number of organic substances [1,2,3]. The bromine derivatives attract attention due to favorable specific features, such as the stability of protolytic forms, weak dimerization, good diversity of absorption bands of single- and double-charged anions, and high contrast of color reactions [3,4]. In particular, they are used in technologies for determining the acidity of pure and natural waters [5,6,7] and are also the basis of sensitive elements of optical pH sensors, fiber optic biosensors, and chips [8,9,10,11]. Quantitative determination of components in bio- and pharmaceuticals is one of the most promising areas of their application as analytical reagents: Antimicrobial, antihistamines, bactericidal, antidepressants, and others [12,13,14,15,16,17,18,19,20,21,22,23,24,25,26].
The effective use of 3,3′-dimethyl-5,5′-dibromophenolsulfonephthalein (BP) in technologies is expanding [27,28,29,30,31,32,33,34,35,36,37,38,39,40,41,42,43,44,45,46,47,48,49]. It includes sensitive gas sensors [27,28], electrochemical DNA biosensors to the antitumor drug [39], highly efficient extraction of heavy metals from industrial effluents by adsorption on a modified zeolite surface [40], lysine decarboxylase analysis [41], the adsorption of hydrophobic molecules on the membrane of erythroleukemia cells [42], and evaluation of the properties of serum albumin [38,43,44,45,46,47,48] and extracellular lactase [49]. It is noteworthy that many applications are based on the formation of dissimilar associates between the anionic form of sulfonephthalein and the analyte. In some cases, associates are able to be extracted into the organic phase (chloroform, dichloromethane [12,13,15,16,17,18,19,21,24,26]).
Studies of the dissimilar association of sulfonephthaleines and other dyes are becoming practical. They provide information on the nature of physicochemical interactions and the role of both chromophore fragments and functional groups. For example, it was found that the “dye + counterion” associates and the binding of each of them with biochemical receptors (with DNA [50,51] or proteins [52,53,54]) affect the action of medicinal agents; this problem has also been studied in the interaction of antibiotics with aromatic molecules (polyphenols, methylxanthines such as caffeine, etc.) [55]. Therefore, the dissimilar association is directly related to improving the effectiveness of pharmaceuticals. The analysis of publications indicates the need for in-depth study of cation–anionic interactions that cause the formation of associates, which include anions (HAn−, An2−) of BP or other sulfonephthalein dyes.
Various instrumental methods are used to study the association. At concentrations of interacting particles of 1·10−5 mol/L or more, it is known to use conductometry; however, this method is suitable for media with low dielectric constants. The most “sensitive” method is vis-spectroscopy (fluorimetry), which makes it possible to study the interactions of colored particles at concentrations 1·10−7–1·10−4 mol/L.
The facts of the interaction of sulfonephthalein anions with cations (Ct+) of some dyes (rhodamines, cyanines) have been discussed previously [56,57,58]. However, the most probable structure of BP associates and their energy characteristics, in particular, the standard enthalpy of formation (ΔfH°), have not been studied. In this report, using the results of spectrophotometric measurements and quantum chemical calculations, we analyzed the cation–anion interactions that lead to the formation of stoichiometric associations between single or double-charged anions of BP and single-charged cations of polymethine dyes.
A systematic study of association in aqueous solution implies the use of such dyes that have satisfactory solubility and the ability to change light absorption upon association. Among the “standard” dyes that meet these requirements, attention is drawn to quinadine blue (QB) and quinadine red (QR). QB has a developed vibrational structure and a three-band absorption spectrum in water or organic solvents. Even a slight effect on the chromophore system, which has a counterion, changes its spectrum. A redistribution of the intensities of the absorption bands occurs, and frequency shifts appear. Such unique spectral properties have found application in methods for the qualitative and quantitative determination of a number of metals, in the study of the properties of polyelectrolytes, DNA, surfactants, and metal complex systems [3]. The observed spectral changes can also be linked to a certain type of formed particles in the process of heterogeneous association. However, the disadvantage of QB is the instability of its aqueous solutions. On the contrary, QR is more stable, although it does not have a developed vibrational structure. The advantage of QR is also the possibility to study the association in a wide range of concentrations since it is not as prone to self-association as QB.
2. Materials and Methods
Disodium salts of sulfonephthaleins were used: QB was in the form of chloride salt, and QR was in the form of iodide salt (trademark “Merck KGaA”, Darmstadt, Germany; the content of the basic component was not less than 95%). The proper qualification of the chemical purity of the preparations of each of the dyes was verified spectrophotometrically, taking into account the known values of the molar absorption coefficient (εmax, L/(mol·cm)) and the maximum absorption band (λmax) for the most intensely colored of protolytic form. The acidity of the medium was created with phosphate, borate, acetate buffer solutions, and in some cases, hydrochloric acid or sodium hydroxide. Additional observations have shown that the addition of buffer solutions does not significantly affect the light absorption of dyes and association processes. The pH was monitored with a glass electrode. The ionic strength (I) of the solutions did not exceed 0.004 mol/L. Distilled water was used to prepare the solutions with an electrical conductivity of no more 4·10–6 S. The values of the optical density, which are the basis for the calculations of the equilibrium constants of the association (Kas), were checked for compliance with the basic law of light absorption. The absorption spectra were measured on the upgraded spectrophotometer “Hitachi U3210”, Hitachi, Inc., Tokio, Japan (at room temperature) with an error value in determining the absorption wavelength of no more than ± 0.5 nm. It is experimentally verified that temperature fluctuations within 2–3 degrees practically do not affect the spectral properties of the studied dyes.
The methods of preparation of mixtures of dyes and the calculation of spectral and equilibrium characteristics of associates are covered in [56,57,58]. To calculate the standard enthalpies of the formation of dye ions and their associates, as well as to establish their structure, the semi-empirical quantum chemical method PM3 was used. The method is integrated into the software packages “HyperChem 8.0”, Hupercube, Inc., New York, NY, USA (evaluation version) and “MOPAC 2009”, Stewart Computational Chemistry, Colorado Springs, CO, USA. The principles of calculations for the structures of dyes and their ionic associates have been described in more detail previously [3,56,59,60].
3. Results
3.1. Dyes in the Aqueous Solution
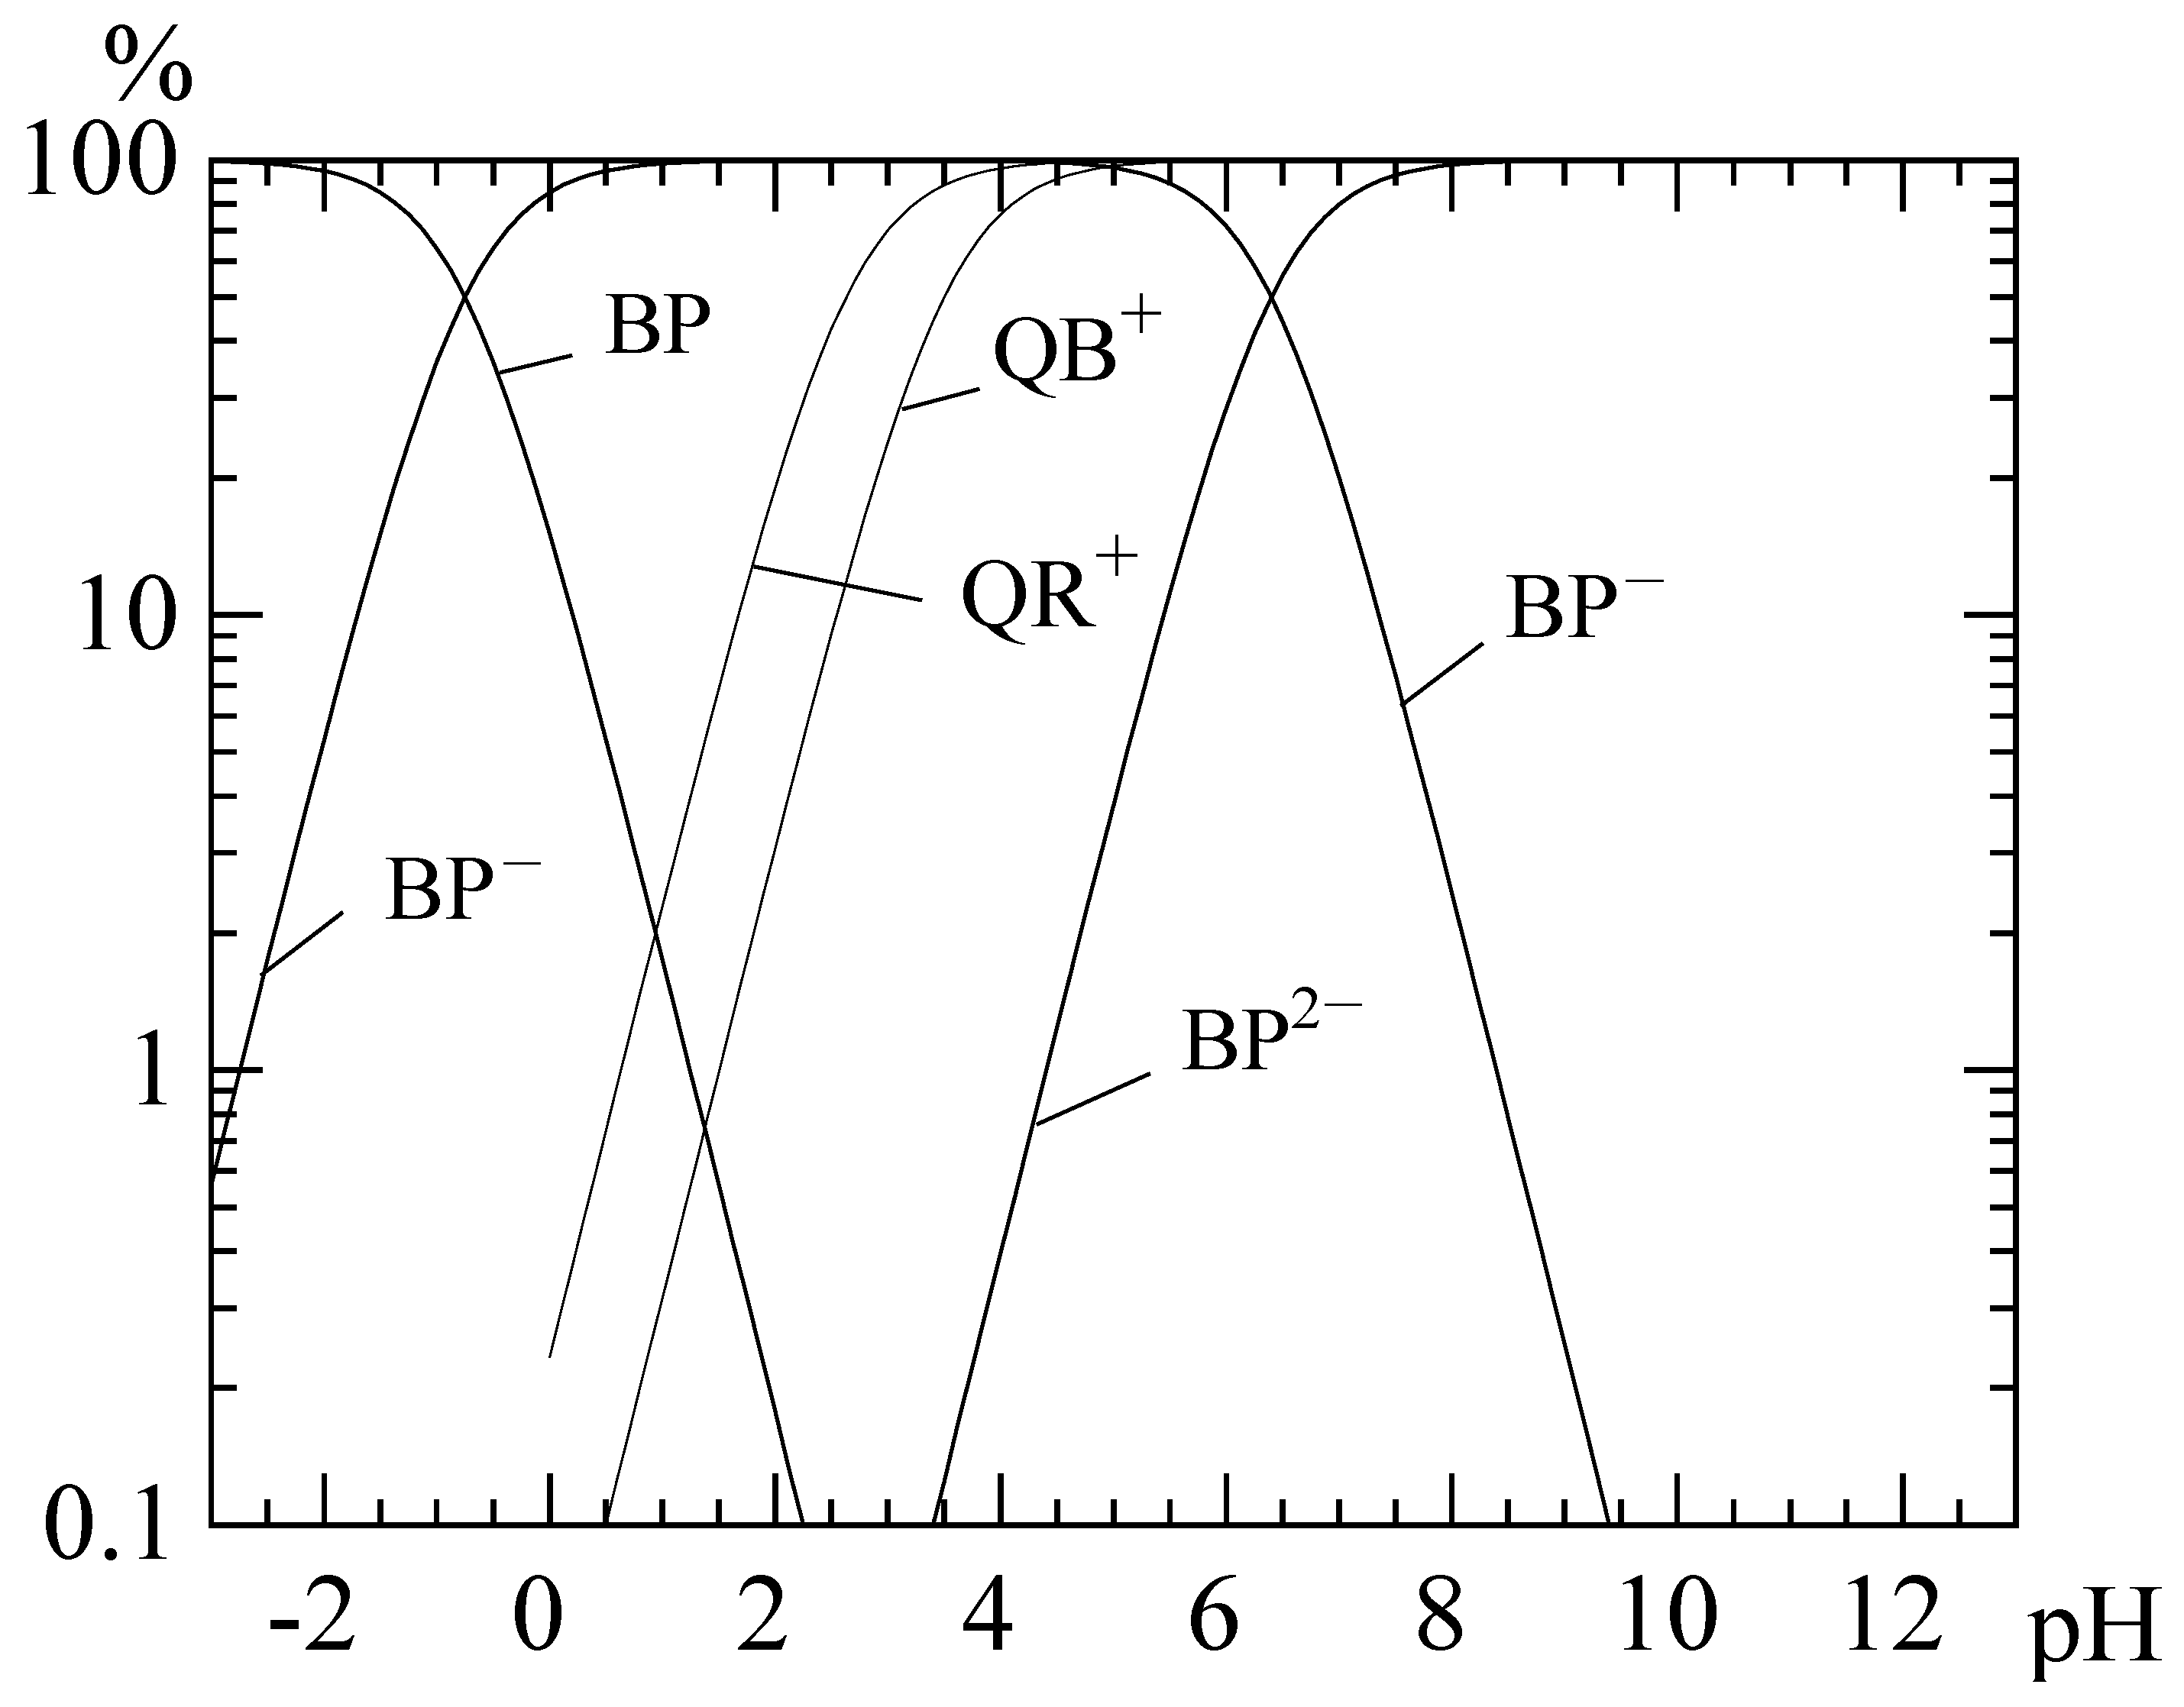
Under the study of the interaction of HAn− (or An2−) with Ct+, we adhered to the acidity of the solution, which would ensure the coexistence of the corresponding ionic forms (Figure 1). Otherwise, the interpretation of spectral changes is difficult due to possible interactions involving mixtures of proprietary dye forms.
Upon creating the optimal acidity of the solution, the values of pKa1 and pKa2 were taken into account (see Table 1; the characteristics of BP and cyanine dyes are given for I → 0 according to [61,62]; the error of pKa values is ±(0.03–0.08); the values of pKa1 for QB and QR refer to the process of dissociation of the HCt2+ cation).
3.2. Spectral Properties of the Dyes
Features of BP and the cyanines are the following: (1) Dyes form stable protolytic forms in aqueous solutions; (2) dyes are able to associate at concentrations not exceeding their solubility in water; (3) ionic forms have a sufficient color intensity and the ability to significantly change the light absorption during association, which allows the study of quite small concentrations of interacting particles.
Interpretation of spectral changes from the standpoint of the equilibrium approach (using the law of active masses) implies compliance with the basic law of light absorption by protolytic forms of interacting dyes. The absorption spectra of aqueous BP solutions were investigated in the concentration range of 4.96·10−6 to 4.96·10−5 mol/L using a buffer solution and without the addition of salt additives or an organic solvent. The Savitsky–Goley procedure was used to smooth the electronic spectra [63,64]. The dependence of Aλ on the BP concentration for λmax = 431 nm is a line passing through the origin. The linear regression equation has the form:
A431 = 0.00047(0.0043) + 24798.1(139.8) × CBP.
The correlation coefficient is equal to 0.99, and its standard deviation is 0.0038. The free term of the regression equation (in parentheses) is statistical zero. This nature of the dependence obeys the basic law of light absorption and gives one reason to believe that in the studied range of concentrations, the single-charge BP anion is not prone to dimerization. It is experimentally set that this also applies to the double-charged ion BP.
Sulfonephthalein dyes are characterized by a number of protolytic transformations: H3An+ ⇄ H2An0 ⇄ HAn− ⇄
An2−. Cationic and neutral protolytic forms exist only in a strongly acidic environment. Anions, especially An2−, have the most intense color; the light absorption bands of HAn− and An2- forms are well spectrally spaced (λmax (HAn−) = 430 nm, λmax (An2−) = 588 nm with molar absorption coefficients εmax (HAn−) = 24,900 L/(mol·cm), εmax (An2−) = 67,200 L/(mol·cm)). This contributes to the experimental study of the ionic association of dyes at particle concentrations at the level of 5·10−6 mol/L. It is
noteworthy that the coefficient of the linear regression equation practically coincides in value with the given εmax (HAn−). This indicates that only one protolytic form of BP exists at a certain acidity of the solution in the aqueous solution. In turn, significant differences in the
values of pKa1 and pKa2 (see Table 1) allow for regulating the acidity of the solution to create conditions under which the existence of only a single- or double-charged anion is possible.
The linear regression equation has the form in the concentration range of 1.0·10−6–1.0·10−4 mol/L for QR [59]:
A528 = −0.0038(0.015) + 3.37·104(324) × CQR.
The correlation coefficient is equal to 0.99(0.03). The value of the free regression term is statistical zero as in the case of BP anions.
For QB, in contrast to other dyes, the basic law of light absorption is fulfilled only at relatively low (not more than 3·10-6 mol/L) concentrations because QB is very prone to self-association [65]. It is spectrally manifested by a weakening of the absorption of the α-band and an increase in the intensity of the β-band (see Table 1).
Aqueous solutions of single-charged cyanines are markedly discolored due to the processes of protonation (the formation of HCt2+ particles in acidic conditions) and hydrolysis (the occurrence of CtOH and the appearance of turbidity in an alkaline solution).
4. Discussion
4.1. Spectral and Equilibrium Properties of Dissimilar Associates
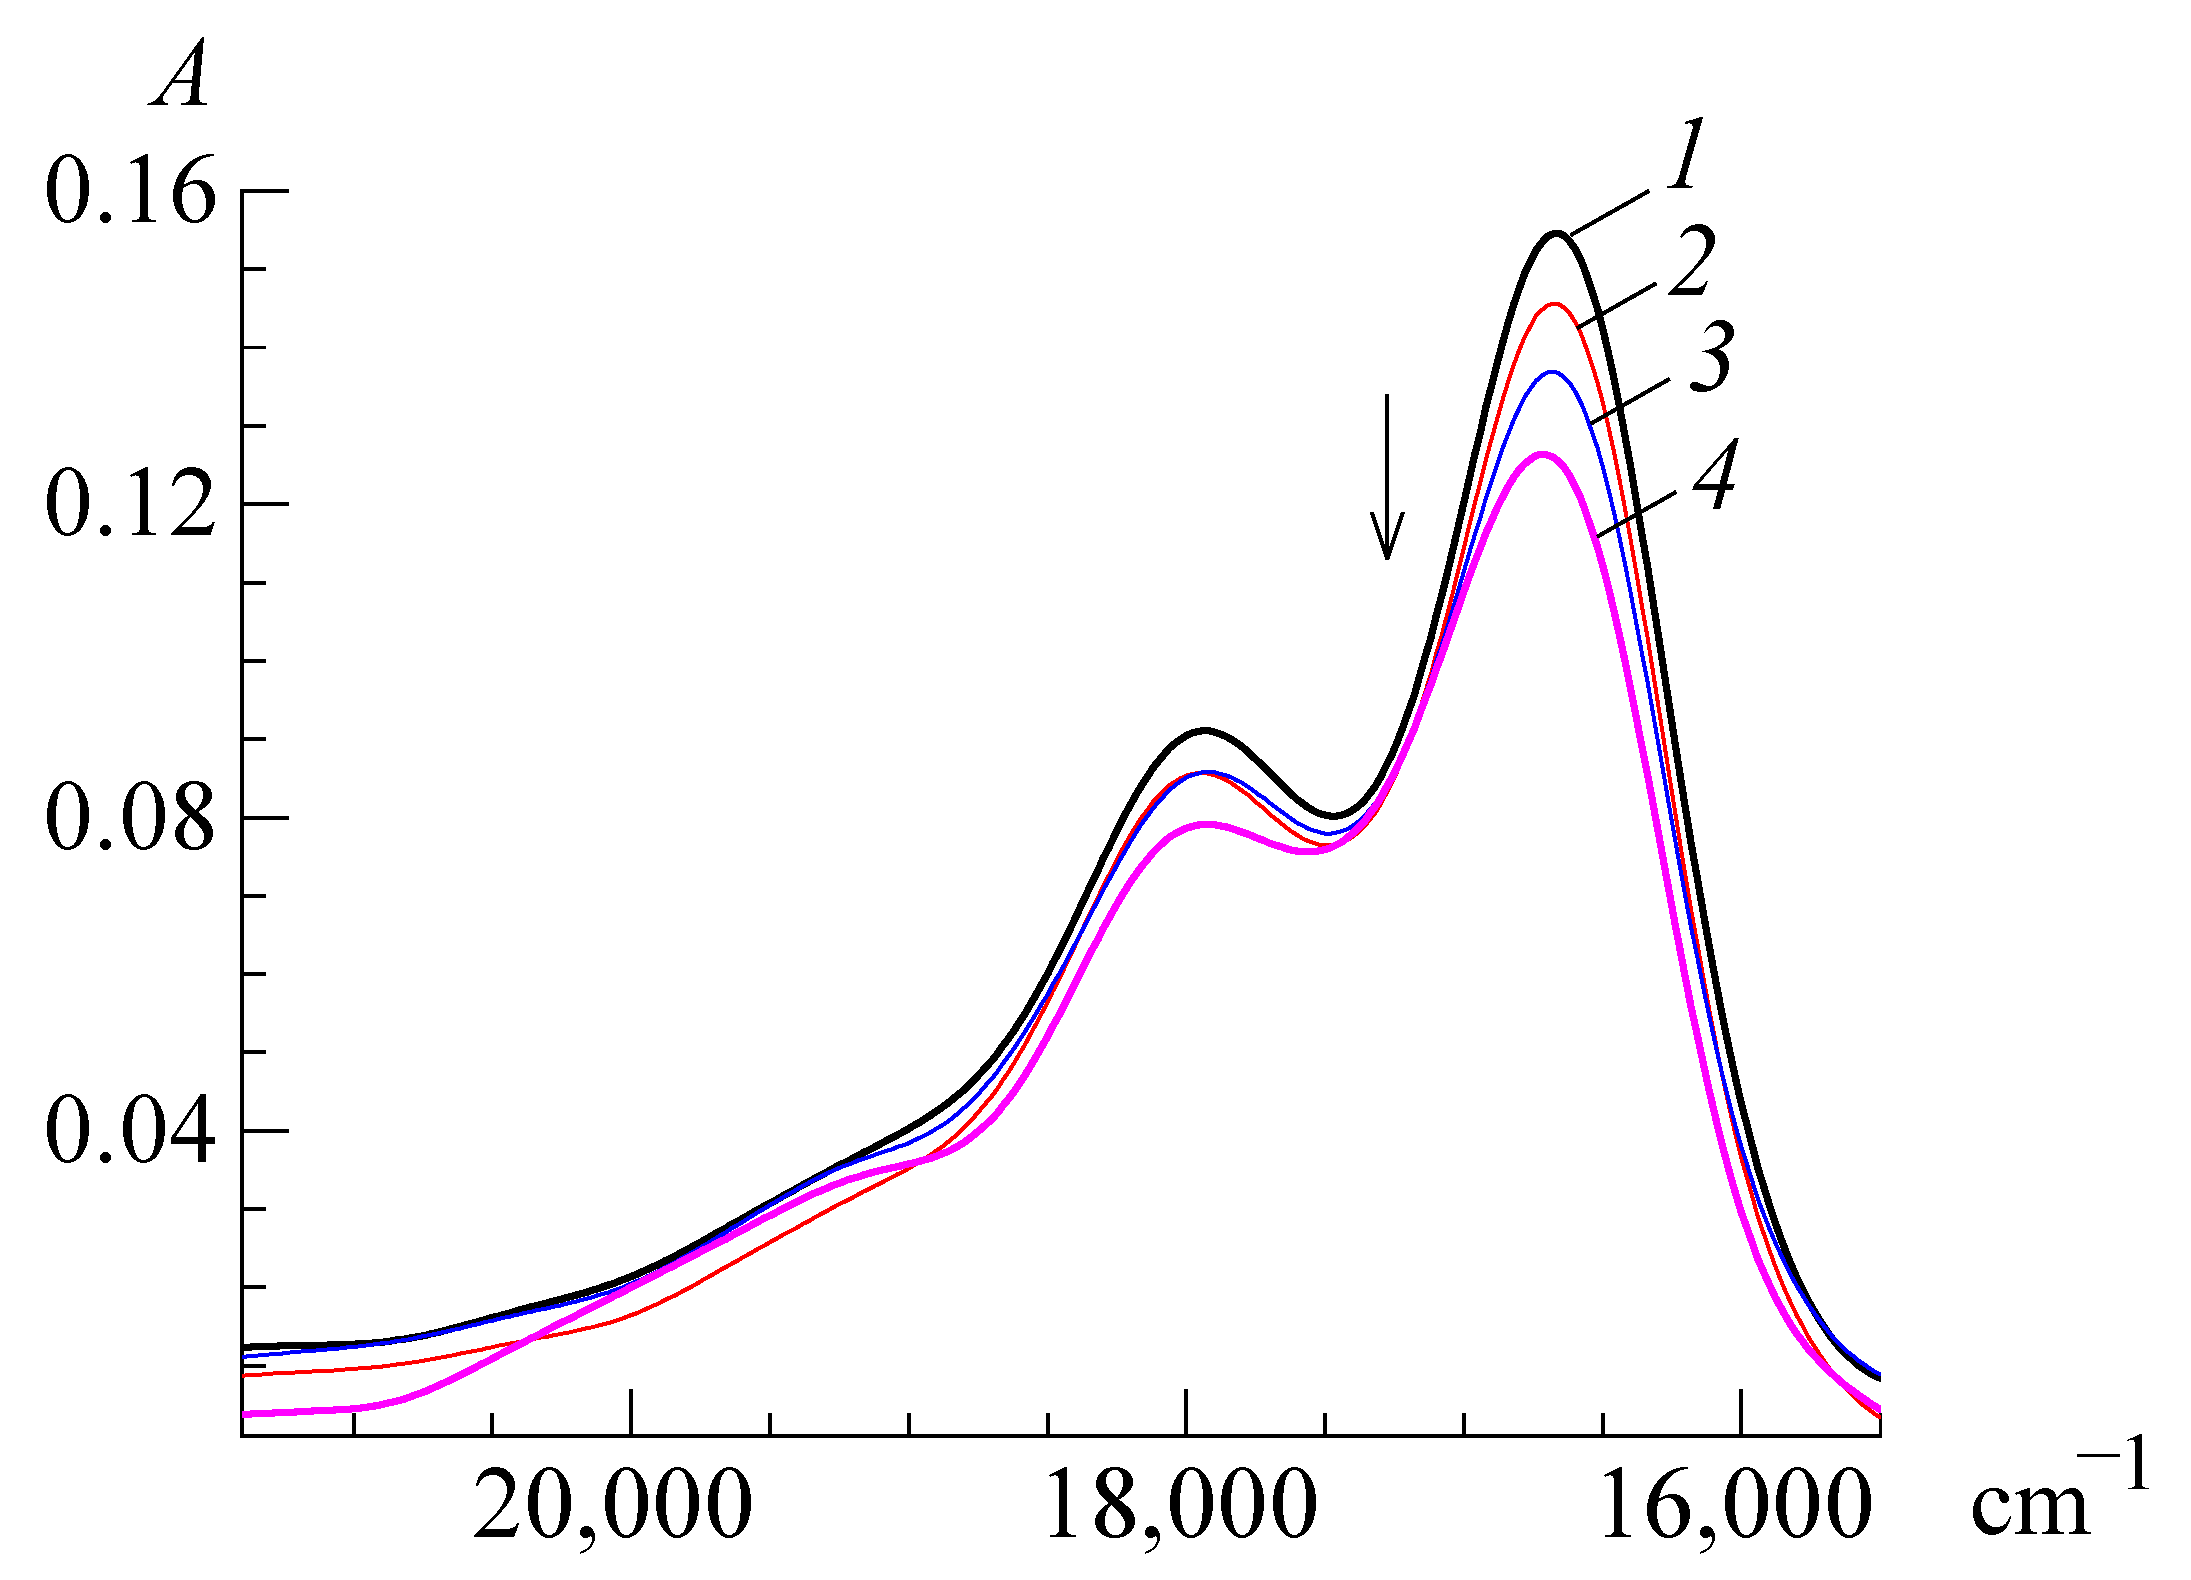
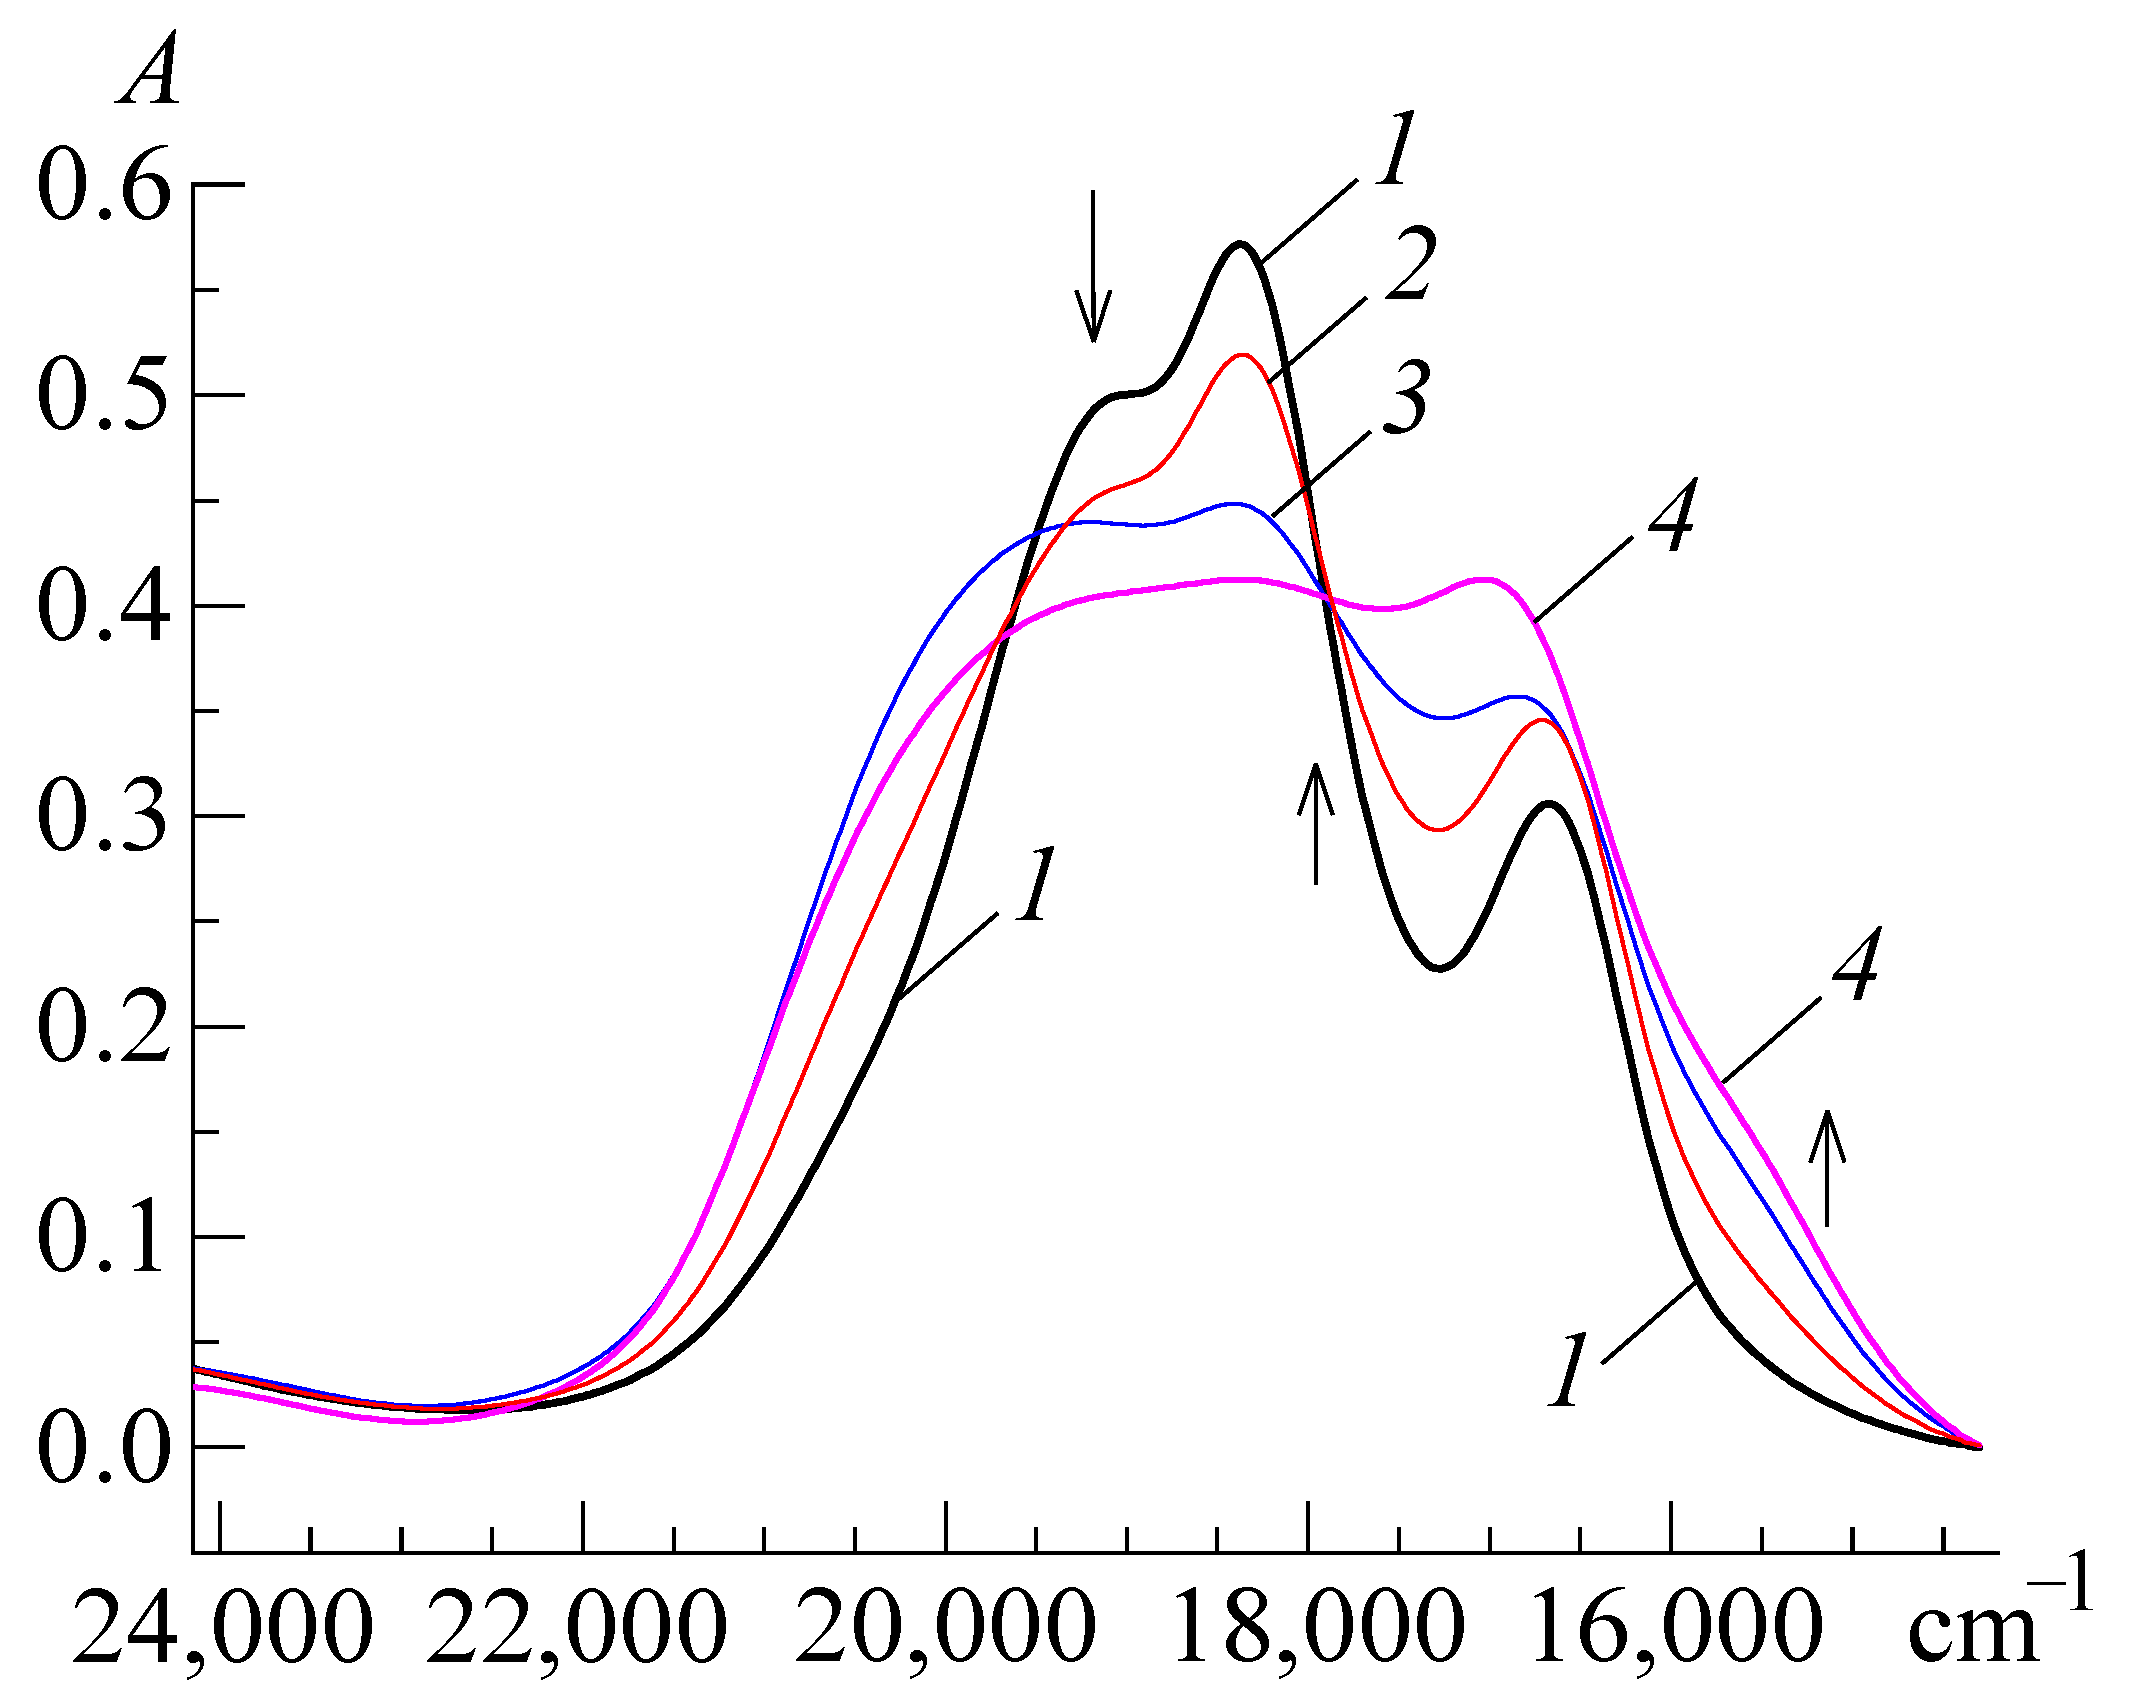
A significant decrease in the intensity of the light absorption bands is a characteristic feature of the formation of cation–anionic associates. It is most clearly observed if increasing amounts of BP are added to the constant content of cyanine dye and the light absorption is measured against a solution containing the same concentration of BP as in the dye mixture. An analysis of changes in the electronic absorption spectra of mixtures of Ct+ with HAn− and Ct+ with An2− leads to the conclusion that the principle of additivity of light absorption is violated. The absorption intensity (A) of the mixture of interacting counterions becomes less than the total light absorption of individual dye ions. This phenomenon occurs regardless of the initial concentrations of anions or cations (in the above ranges), as shown in Figure 2 and Figure 3. The intensity of the α-band is greater than the β-band for QB in Figure 2. However, the situation is the opposite (see Figure 3), where the concentration of QB is much more (“Ct+ + An2−” system). Such spectral shifts of the absorption bands in the absence of new or the splitting of existing bands suggest a solvate-separated type of dissimilar associate structure (in accordance with the general features of spectral shifts for dye associate systems [3,66]).
Using methods for estimating the stoichiometric composition (similar to studies [12,13,56,60]), it was found that under certain conditions (such as initial concentrations of counterions and their molar ratios), anions of BP can form Ct+ associates of the composition Ct+∙HAn− and (Ct+)2∙An2−. From the experimental data, it can be concluded that for dissimilar associates of BP, the stoichiometric ratio of QB: counterion is 1:1 for the case of the anion HAn−, and it is 2:1 for the case of An2−. For equilibria of type jCt+ + Anj− ⇄ (Ct+)j·Anj−, the association constants (Kas) were calculated taking into account the ratios of the stoichiometric coefficients. The concentration constant of the association practically does not differ from the thermodynamic one because I ≤ 0.004 in all experiments:
where CCt+ is the initial molar concentration of the cationic dye (which does not change within the series); CAnj− is the initial molar concentration of the anion; [(Ct+)j·Anj−] is the equilibrium molar concentration of the associate (as):
The last value was calculated on the principle of additivity of optical density A of a mixture of colored particles in the solution by the equation:
where l is the thickness of the absorbing layer, cm.
A = ACt + AAn + Aas at a fixed wavelength λ.
ACt = [Ct]×εCt×l = (CCt − j×[(Ct+)j·Anj–])×εCt×l,
AAn = [An]×εAn×l = (CAn − [(Ct+)j·Anj–])×εAn×l,
Aas = [(Ct+)j·Anj–]×εas×l,
For l = 1 cm, it turns out:
In general, it is possible to use different ratios of cation and anion concentrations. However, when one of the dyes is susceptible to dimerization, then it is necessary to measure the optical density of the mixture at a constant concentration of this dye (for example, QB) and a varying concentration of the second dye (BP). In fact, the cationic dye is “titrated” by the anion, and then CCt × εCt × l = const. If the absorption bands of the cation and the anion are well separated (Δλmax = |λmax Ct − λmax An| ≥ 80…100 nm), then the light absorption of the anion, AAn, at the selected wavelength λmax Ct barely differs from zero, since εAn ~ 0. Then:
where A is the measured value of the optical density of the dye mixture.
Data for Kas were obtained at CCt+ ≈ 6·10–7 mol/L for several CAnj− values and at three wavelengths (see Table 2).
The obtained data on the logarithmic values of the
association constant are in good agreement with the values of Kas,
which were defined earlier by us [59] (QB: 6.67
± 0.05 (Ct+·HAn−), 11.07 ± 0.10 ((Ct+)2·An2−);
QR: 4.78 ± 0.06 and 8.23 ± 0.04, respectively) for slightly different
concentration ranges of Ct+ and BP. This fact confirms the validity
of considering the indicated stoichiometry of a dissimilar association from the
position of an equilibrium model. However, it should be noted that turbidity
may appear in more concentrated solutions of mixtures of dyes. This phenomenon
indicates the formation of associates of more complex stoichiometry, which are
sparingly soluble in water: (Ct+)j·Anj−
+ kAnj− (Ct+)j·(Anj−)k+1.
Thus, it is possible to form associates of complex composition by a cooperative
mechanism, when the counterion interacts not only with the dye, but with the dissimilar
associate. Similar facts were set earlier for tetraphenylborate anion by
spectrophotometrically [67] and for
“daunomycin + ethidium bromide” [68] or
“acridine orange + caffeine” [69] by 1H
NMR spectroscopy.
Comparison of the values of lg Kas (see Table 2) show that QB associates of BP are more stable than QR associates. This is probably due to the lower hydrophobicity of QR compared to QB. The octanol–water partition ratio is the most common way of expressing the hydrophobicity of a compound (P), and it is defined as the ratio of the concentration of a solute in a water-saturated octanolic phase to its concentration in an octanol-saturated aqueous phase. The correlation between hydrophobicity and activity has provoked the extensive use of the octanol–water partition ratio, among others, as a descriptor in quantitative structure–activity/property relationships [70,71,72,73]. The higher the P parameter, the more hydrophobic the molecule is. Indices of hydrophobicity are log PQR = 5.15 ± 0.12 and log PQB = 5.69 ± 0.12 according to [74]. So, the manifestation of hydrophobic interactions in QR associates is reduced. In addition, the positive charge is localized mainly on the heteroatom of the nitrogen-containing heterocycle in QR, while the positive charge is delocalized in QB.
The formation of associates in solutions is more characteristic for dyes with a flat molecule shape and developed π-electronic fragments, which enhances the component of noncovalent interactions. Such properties have some thiacyanines, porphyrins, spiropyrans and squaraines [75,76,77,78]. However, sulfonephthaleins do not have a flat structure in contrast to these structures. However, the cation–anionic interactions for BP are significantly expressed as they follow from the determined values of Kas. Based on experimental data on stoichiometry, it can be assumed that the polymethine cation coordinates with the single-charge BP anion (or two cations coordinate with one double-charged BP anion). Using quantum chemical calculations, we considered the energy state (value of the standard enthalpy of formation, ΔfHo) of each of the counterions and associates in more detail, and also determined their most probable structure.
4.2. Energy and Structural Properties of Dissimilar Associates
The semi-empirical PM3 method was used to estimate ΔfHo values of ions and dissimilar associates. The parameters of this method most correctly reproduce the experimental values of ΔfHo of organic compounds. It should be noted that ΔfHo calculations for organic molecules by non-empirical methods lead to errors exceeding 100 kJ/mol even for small molecules, while the average error of the PM3 method in calculating ΔfHo is only 25 kJ/mol [79,80]. In advance, the geometry of all structures was optimized by the method of molecular mechanics MM+ (by the minimum value of the total energy E). This significantly simplified the further determination of ΔfHo by the semi-empirical method.
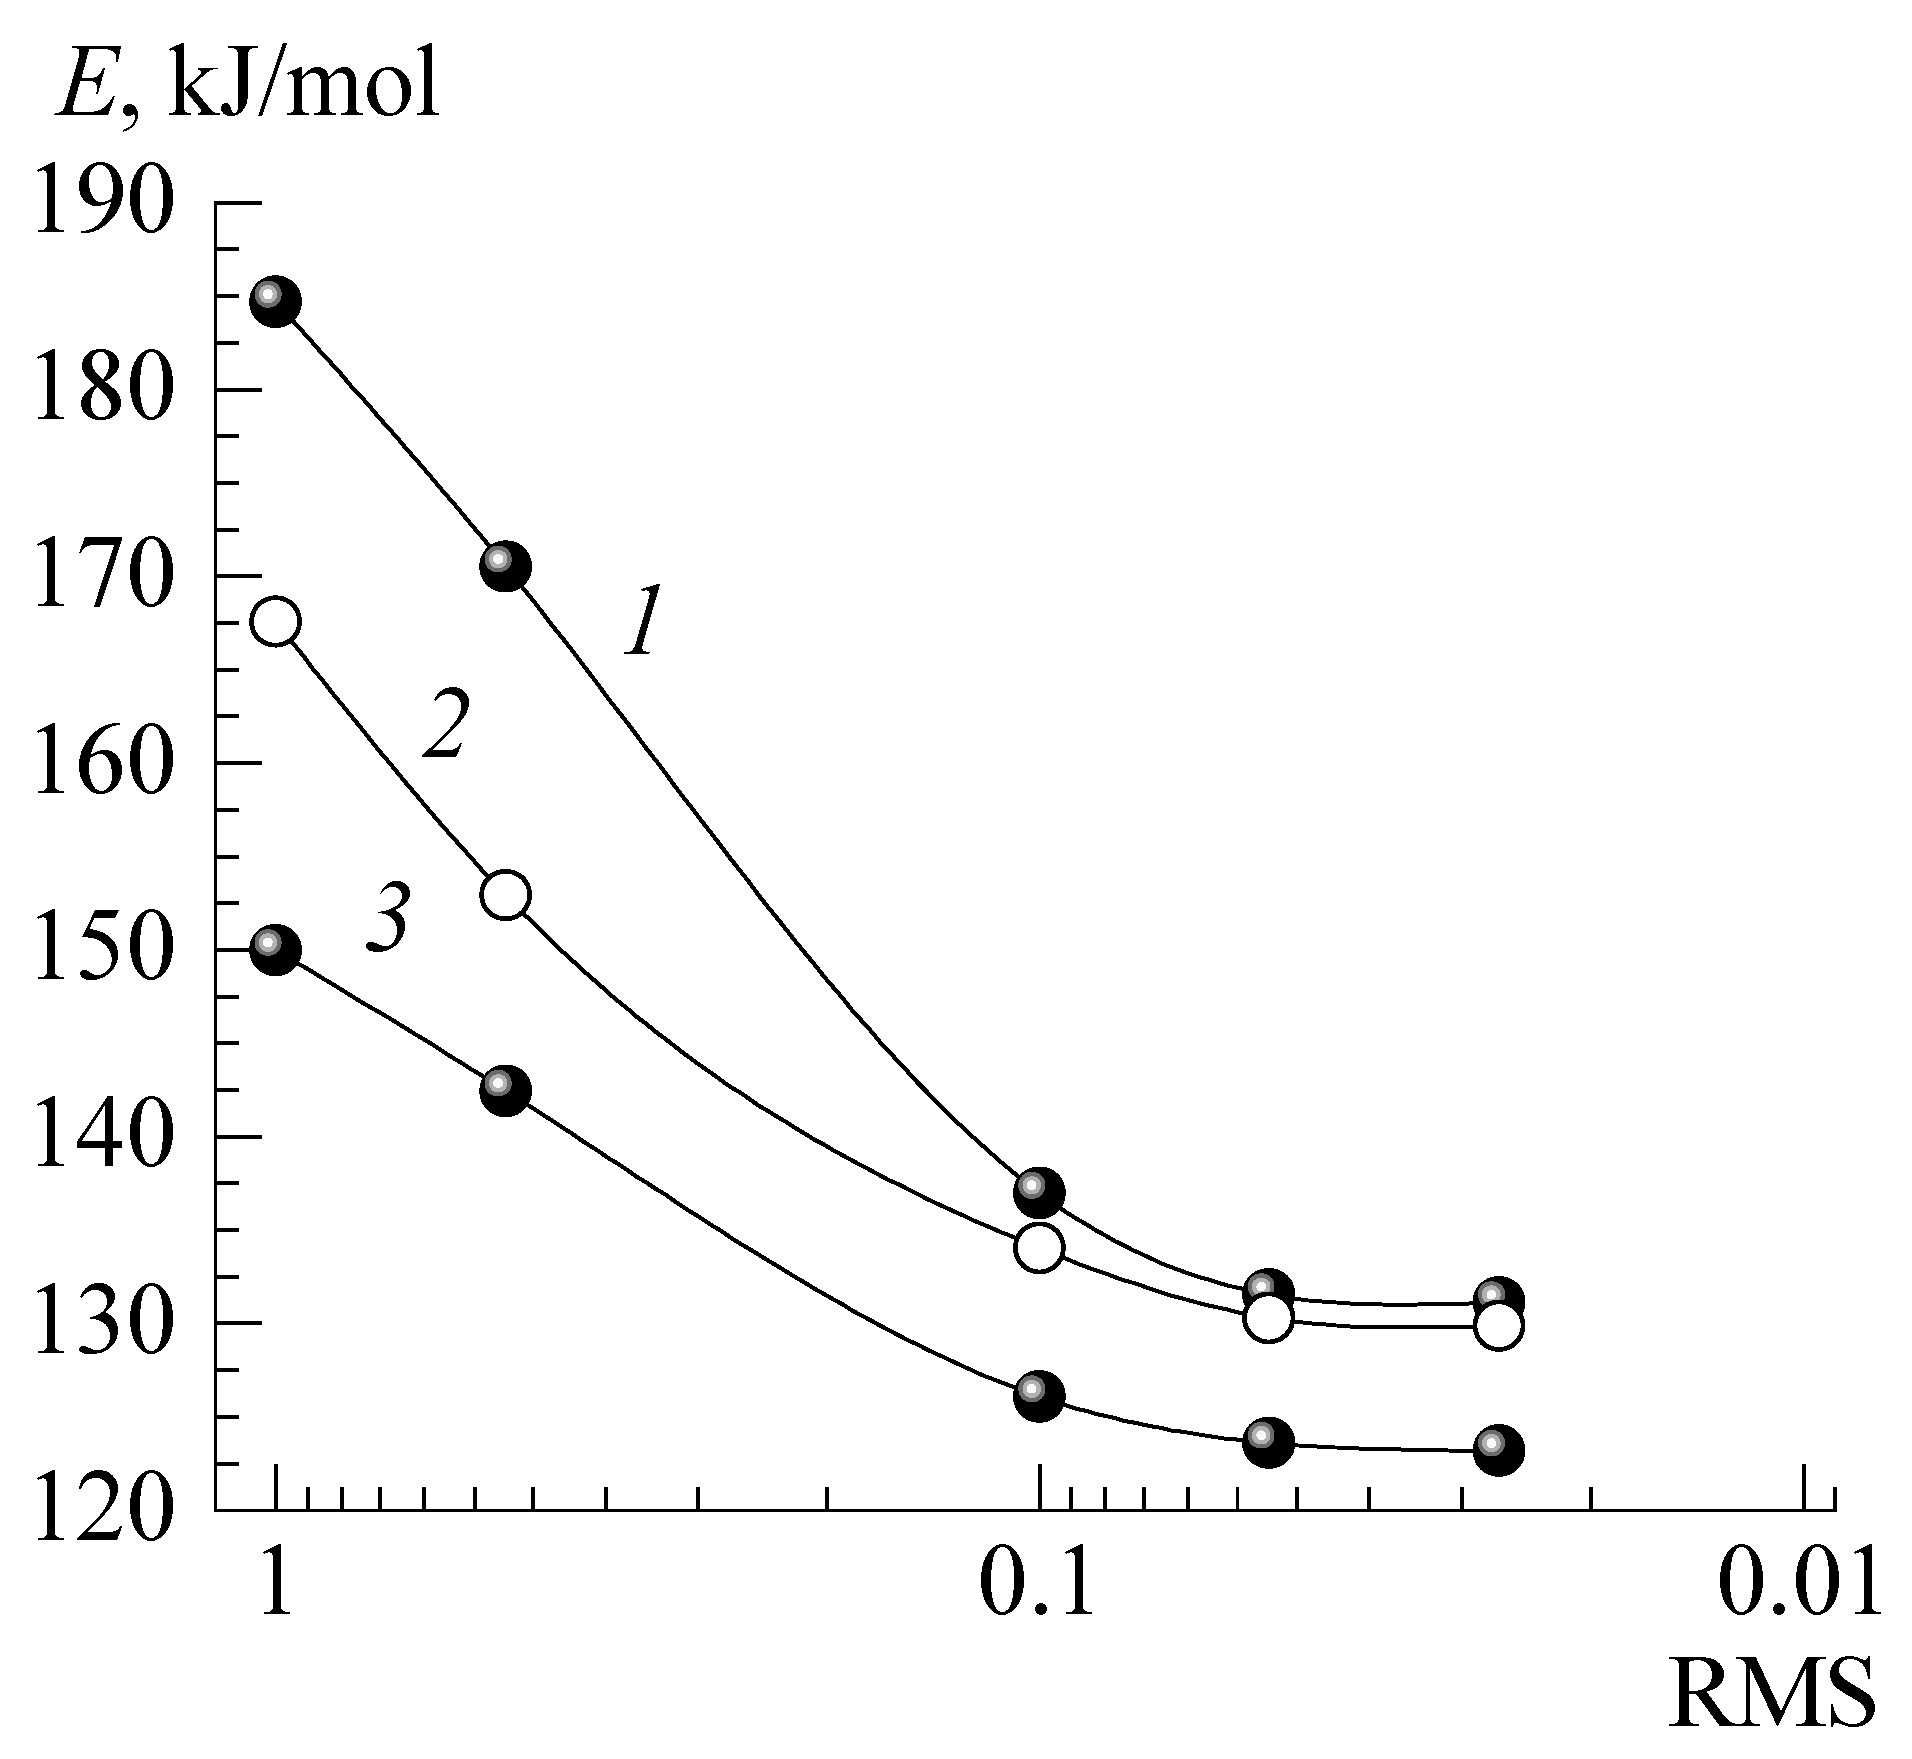
It is important to find the global energy minimum from a set of local minima to obtain the correct values of ΔfHo. To do this, we tested several different starting locations (more often 5–6) of counterions in the associate. From the received calculated set of energy minima, the smallest was chosen; the energy of this structure corresponded to the global energy minimum. For example, Figure 4 shows three variants of the initial location of the two-charged ion in the association of An2− with two cations of QR.
Different (1 and 2) starting positions of ions in an associate can lead to practically identical optimized values of E. However, in comparison with curve 3, this indicates that only a local energy minimum has been achieved, since in case 3 the energy results in being even lower. Thus, curve 3 corresponds to the variant with the energy of the global minimum E = 123 kJ/mol.
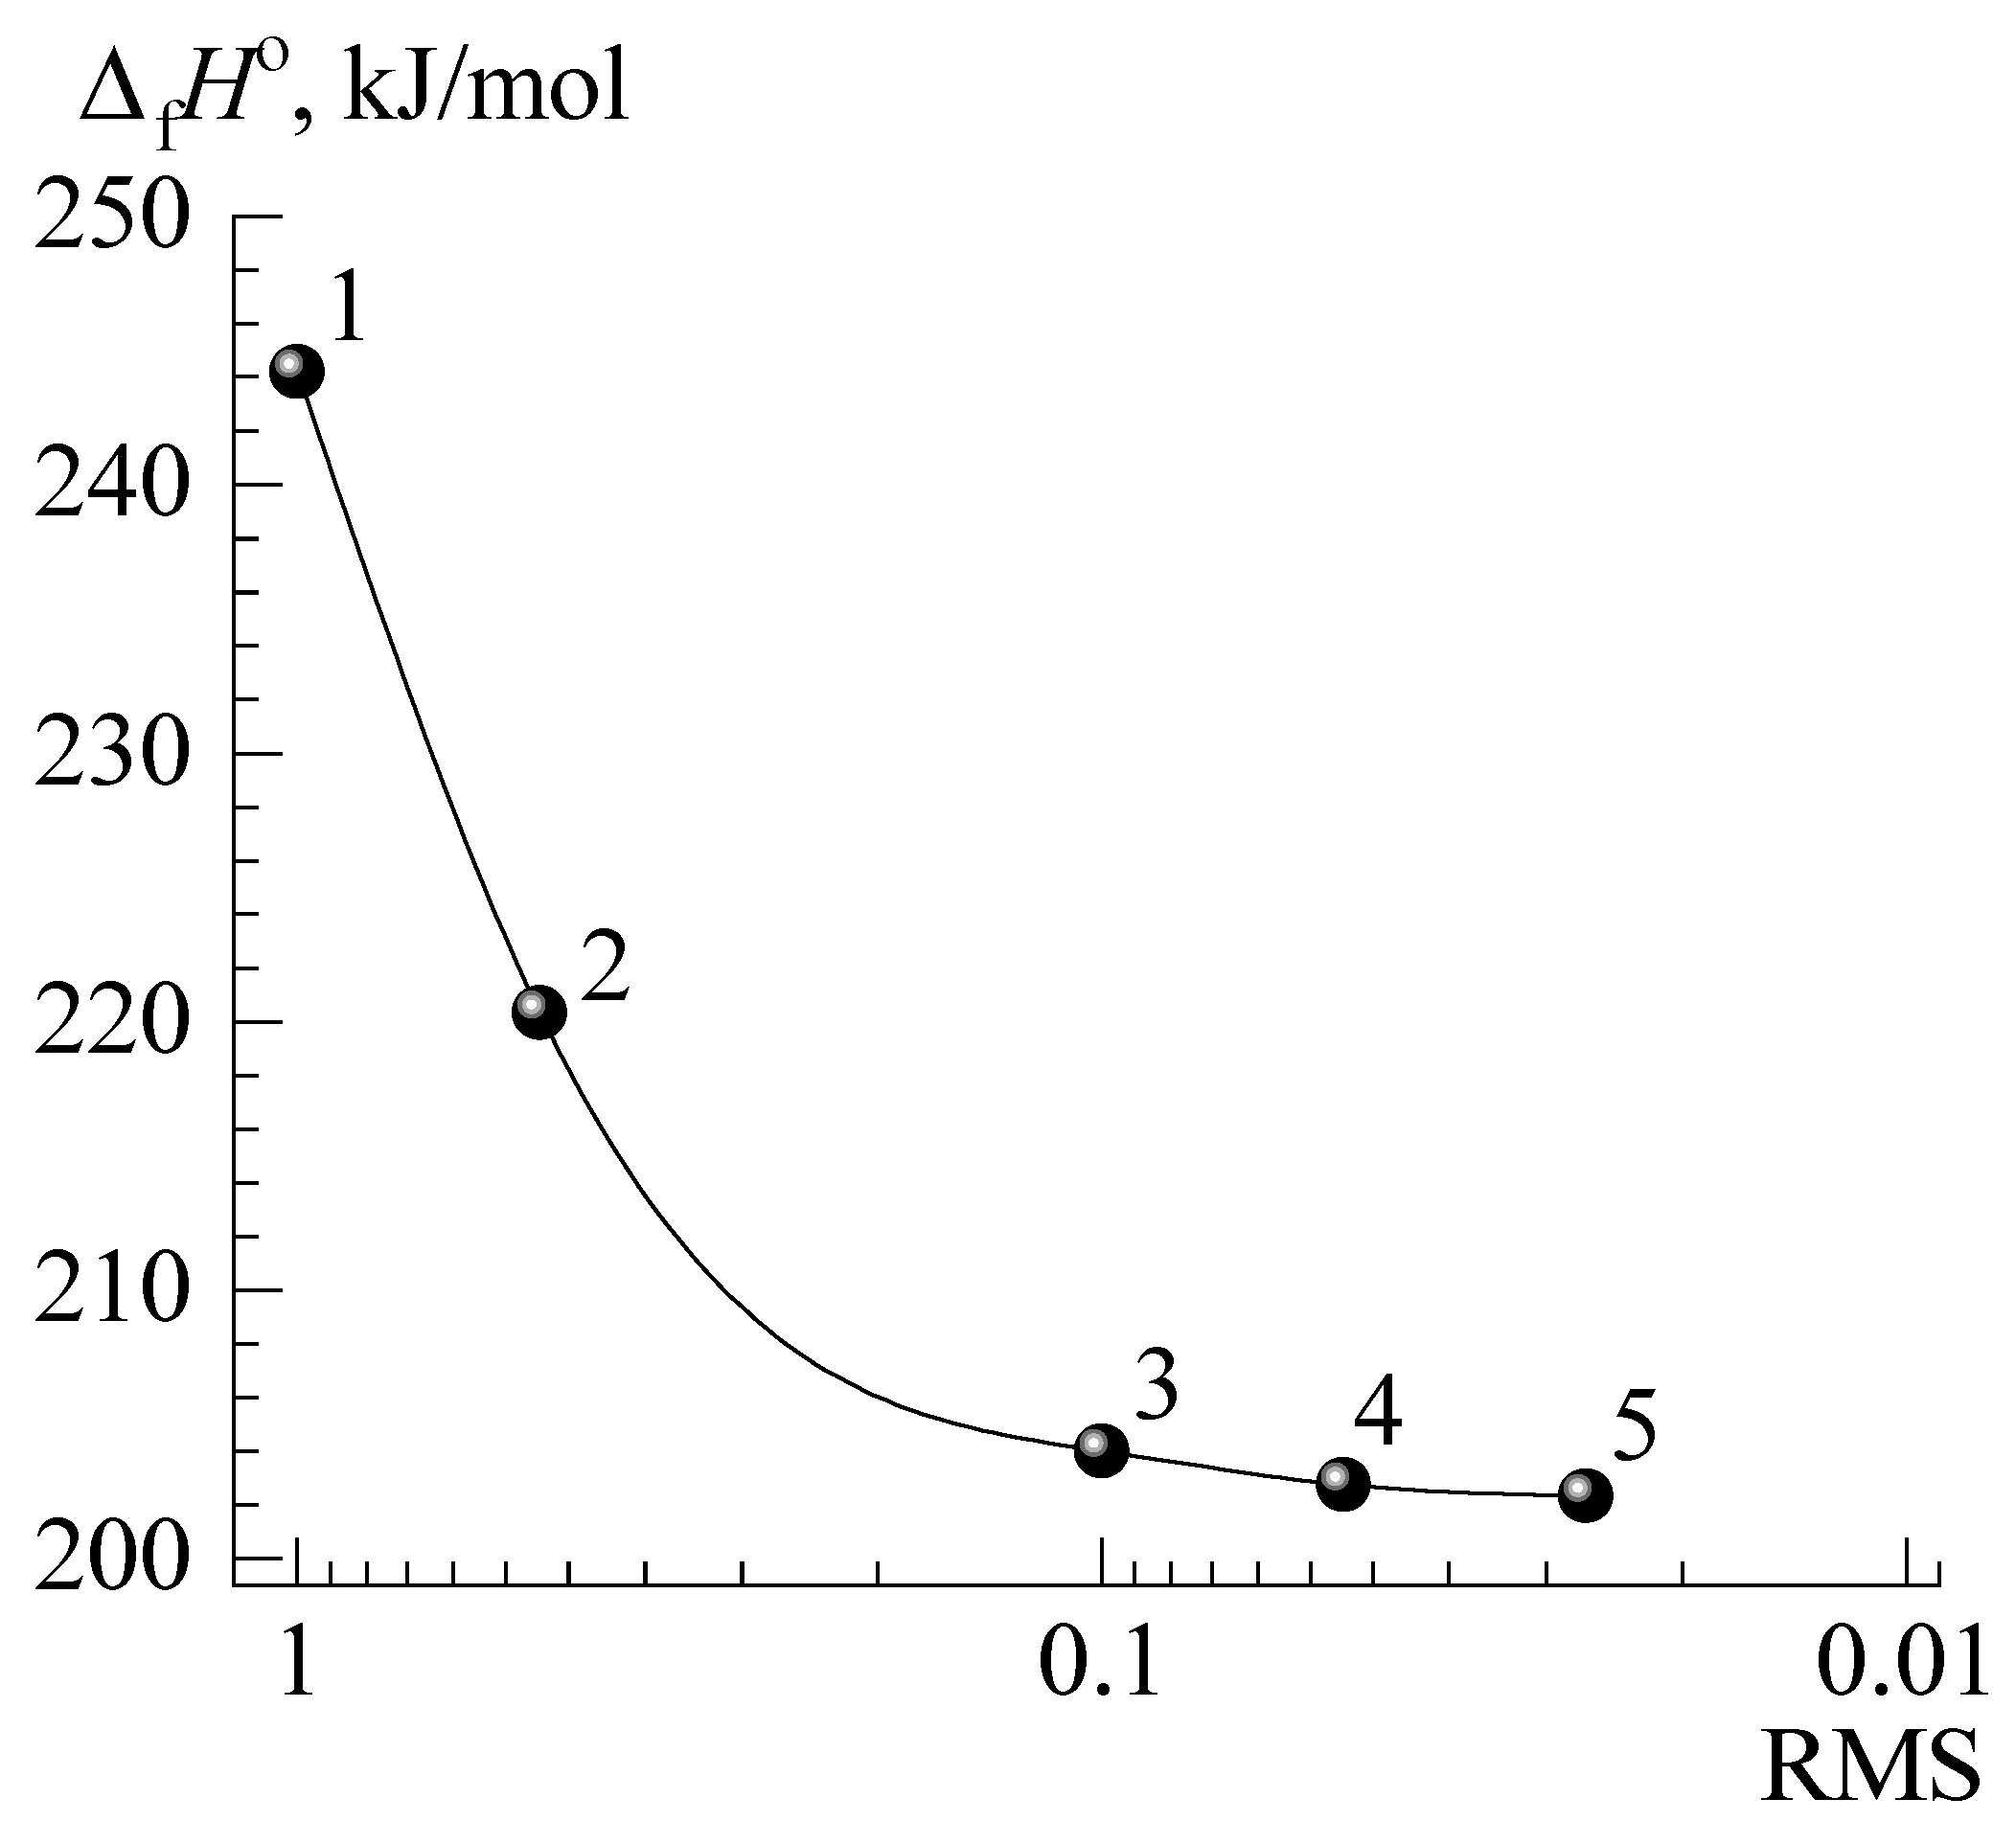
Note that the total energy gradient is calculated as a root mean square (RMS, kJ/(mol·Å)) value. The gradient is the rate of change (first derivative) of total energy (E) with respect to the displacement of each atom in the x, y, and z directions; the local minimum of the potential energy of the structure is considered reached when RMS = 0. The process of finding the optimized variant of the associate structure was considered complete when the E or standard enthalpy of formation ΔfHo ceased to depend on the RMS values. This is indicated by the flatness of the area of the corresponding graphical dependence (Figure 5).
Table 3 shows the dependence of ΔfHo on RMS values, as well as changes in the location of ions during the optimization process (the numbers on the curve, Figure 5, correspond to the location of dyes from initial 1 to final 5 state; stereo images are presented, and 1, 2, 3 are the directions of the coordinate axes; the position of BP (BP is over) is conditionally fixed for clarity).
The optimization process is accompanied by a decrease in the distance between the dyes (the distance between the ions along the axis 1 is from 6.8 Å (initial state 1) to 4.2 Å (final state 5), a certain deformation π-electronic dye system, and is almost finalized with ΔfHo = 202 kJ/mol at RMSmin = 0.025.
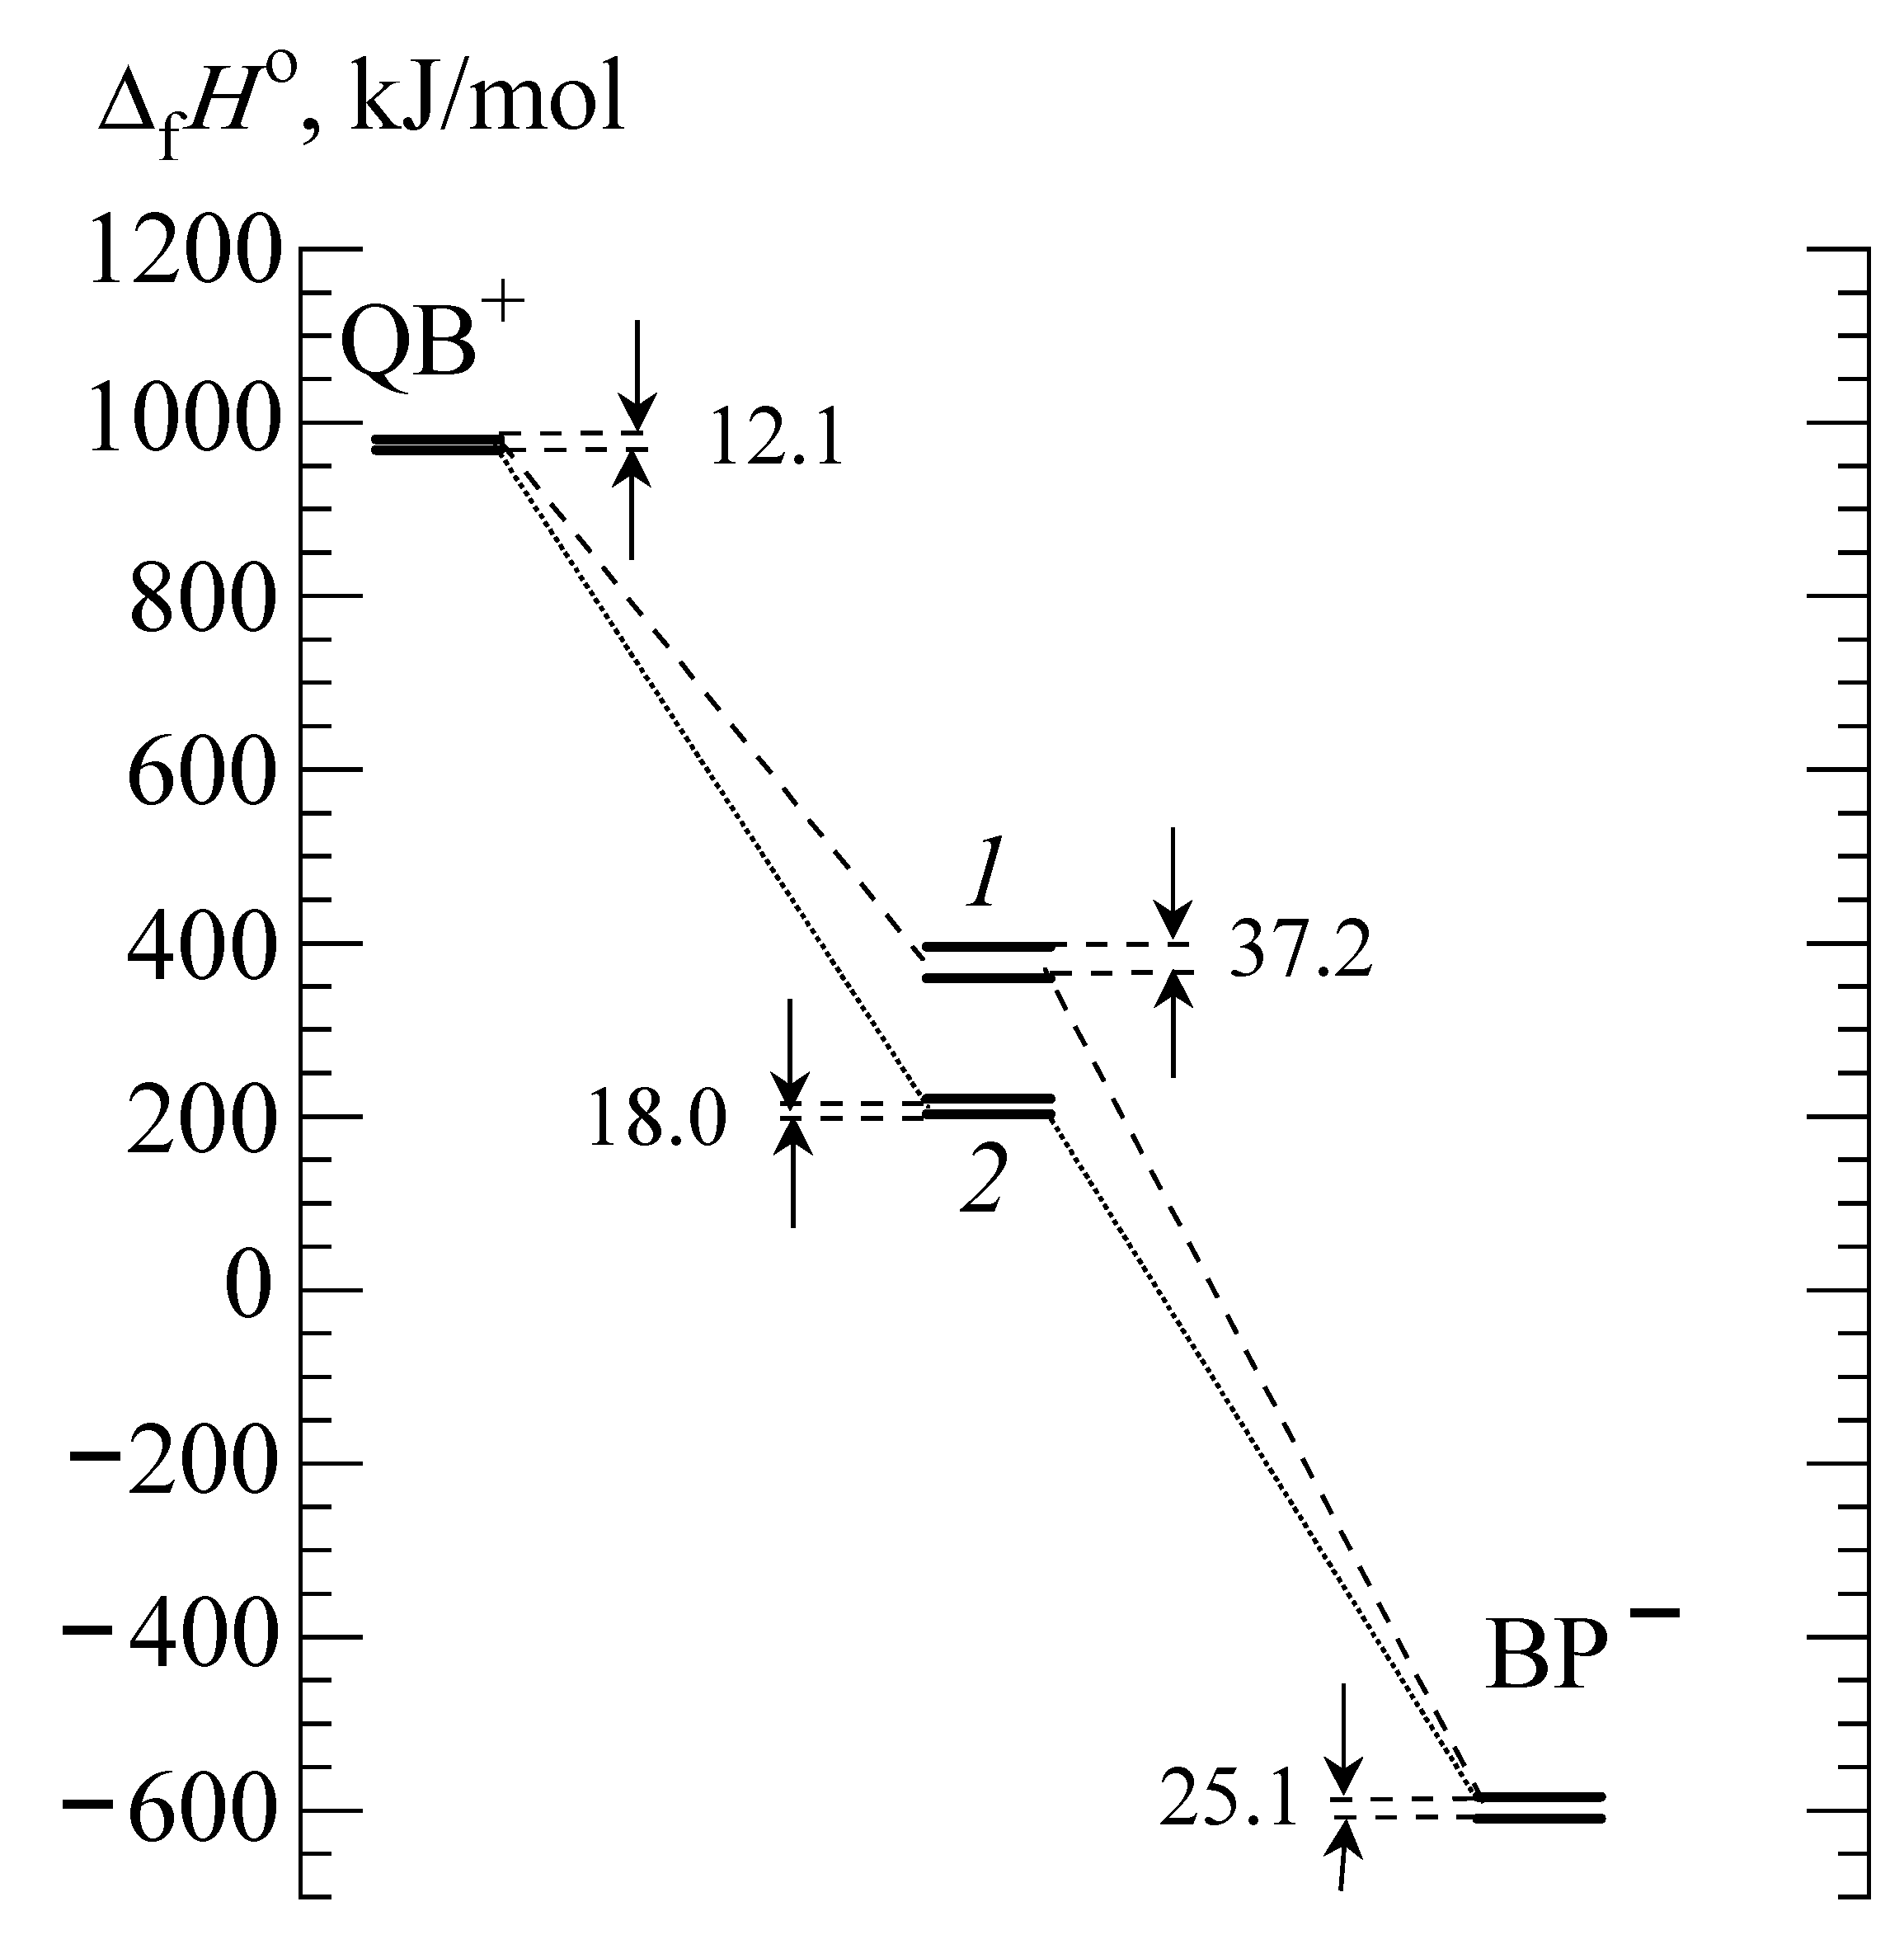
The obtained data make it possible to build energy diagrams. The properties of the associate of the HAn− anion with the QB cation are considered in Figure 6 as an example (numbers near the arrows indicate the range of variation of the values of ΔfHo, kJ/mol).
The values of ΔfHo 980.8…968.7 kJ/mol and −584.5…−609.6 kJ/mol correspond to Ct+ and HAn− ions. Their algebraic sum (Σ) can take values from 980.8 − 584.5 = 396.3 kJ/mol to 968.7 − 609.6 = 359.1 kJ/mol, that is it varies within 396.3 − 359.1 = 37.2 kJ/mol (level 1). The values of ΔfHo for the Ct+∙HAn– associate (level 2) are 220.4…202.4 kJ/mol, that is these values differ by 18.0 kJ/mol (level 2). The differences between levels 1 and 2 are from 359.1 − 220.4 = 138.7 kJ/mol to 396.3 − 202.4 = 193.9 kJ/mol, which significantly exceeds the above systematic error of semi-empirical calculations. In this case, the relative error (δ) of the ΔfHo estimate is no more than (193.9 − 138.7)·100%/193.9 ≈ 28%. These data indicate that the formation of an associate between dye ions is an energetically favorable process.
The ΔfHo and δ values are given for all dissimilar associates in Table 4 (rounded values).
The analysis of the results leads to an important conclusion. The value of ΔfHo for associates of bromine-containing dyes is systematically higher in comparison with associates that do not contain bromine. For example, in the case of an associate of cresolsulfonephthalein (CS) with these polymethines, the lg Kas values are 4.59 ± 0.03 (associate QB+∙CS−) and 10.96 ± 0.10 (associate (QB+)2∙CS2−), and in the case of thymolsulfonephthalein (TS) they are 4.1 ± 0.1 (associate QR+∙TS−) and 5.9 ± 0.1 (associate (QR+)2∙TS2−) [57,60]. Obviously, bromine atoms, located in the plane of benzene rings, have virtually no effect on the geometry of BP, but significantly enhance the non-Coulomb component of intermolecular interactions, primarily the hydrophobicity of the molecule [81,82]. Thus, the introduction of halogen atoms into the structure of sulfonephthalein promotes the formation of cation –anionic associates between dyes.
5. Conclusions
The interaction between single- or double-charged anions of BP and cyanine cations has been investigated at dye concentrations of 5.0·10−7–4.0·10−5 mol/L. The obtained results indicate that the processes of dye association are accompanied by a rather complex combination of different interactions, including non-Coulomb and π-electronic. The study of these processes is appropriate in terms of comparing the results of spectrophotometric measurements with computer simulation data.
Semi-empirical PM3 simulations are in agreement with the spectrophotometric data and indicate that the association of dye into an associate is possible and accompanied by a significant gain in energy. The study of the cation–anion association develops the concept of intermolecular interactions in solutions and creates a basis for further practical use of the spectral and equilibrium properties of associates.
Further study of the dissimilar association of dyes is aimed at finding the relationship between the structure of the dye and its ability to associate with organic ions. There is a need to develop theoretical provisions on the basis of which it would be possible to predict the stability (Kas values) of associates and their spectral properties based on the structure of interacting ions. Dye associates can be very useful for chemical analysis; the regulation of the completeness of the association can be considered an effective means of changing the absorption characteristics of solutions.
Funding
This research received no external funding.
Institutional Review Board Statement
Not applicable.
Informed Consent Statement
Not applicable.
Conflicts of Interest
The author declares no conflict of interest.
References
- Bishop, E. Observations on the theory of action of visual indicators. Analyst 1971, 96, 537–549. [Google Scholar] [CrossRef]
- Yamamoto, K.; Adachi, K. Interaction between sulfonephthalein dyes and chitosan in aqueous solution and its application to the determination of surfactants. Anal. Sci. 2003, 19, 1133–1138. [Google Scholar] [CrossRef] [PubMed] [Green Version]
- Shapovalov, S. Association Processes with the Participation of Dyes in Solutions: Thermodynamic and Equilibrium Characteristics of Nanosystems; Academic Publishing of European Union, OmniScriptum Publishing Group: Riga, Latvia, 2021; 124p, ISBN 978-620-2-92204-3. [Google Scholar]
- Balderas-Hernández, P.; Ramírez-Silva, M.; Romero-Romo, M.; Palomar-Pardavé, M.; Roa-Morales, G.; Barrera-Diaz, C.; Rojas-Hernández, A. Experimental correlation between the pKa value of sulfonphthaleins with the nature of the substituents groups. Spectrochim. Acta A Mol. Biomol. Spectrosc. 2008, 69, 1235–1245. [Google Scholar] [CrossRef]
- Yao, W.; Byrne, R. Spectrophotometric determination of freshwater pH using bromocresol purple and phenol red. Environ. Sci. Technol. 2001, 35, 1197–1201. [Google Scholar] [CrossRef] [PubMed]
- Yuan, S.; DeGrandpre, M.D. Evaluation of indicator-based pH measurements for freshwater over a wide range of buffer intensities. Environ. Sci. Technol. 2008, 42, 6092–6099. [Google Scholar] [CrossRef] [PubMed]
- Martz, T.; Carr, J.; French, C.; DeGrandpre, M.D. A submersible autonomous sensor for spectrophotometric pH measurements of natural waters. Analyt. Chem. 2003, 75, 1844–1850. [Google Scholar] [CrossRef] [PubMed]
- Maruyama, H.; Arai, F.; Fukuda, T. On-chip pH measurement using functionalized gel-microbeads positioned by optical tweezers. Lab Chip 2008, 8, 346–351. [Google Scholar] [CrossRef]
- Kuswandi, B.; Fikriyah, C.I.; Gani, A.A. An optical fiber biosensor for chlorpyrifos using a single sol–gel film containing acetylcholinesterase and bromothymol blue. Talanta 2008, 74, 613–618. [Google Scholar] [CrossRef]
- Zaggout, F.R. Encapsulation of bromothymol blue pH-indicator into a sol-gel matrix. J. Dispers. Sci. Technol. 2006, 27, 175–178. [Google Scholar] [CrossRef]
- Beshir, W.B.; Eid, S.; Ebraheem, S. Use of bromocresol green dyed poly(vinyl butyral) film for dosimetric applications. Int. J. Polym. Mater. 2007, 56, 1067–1077. [Google Scholar] [CrossRef]
- Erk, N. Spectrophotometric determination of indinavir in bulk and pharmaceutical formulations using bromocresol purple and bromothymol blue. Pharmazie 2004, 59, 183–186. [Google Scholar] [PubMed]
- Süslü, I.; Tamer, A. Spectrophotometric determination of enoxacin as ion-pairs with bromophenol blue and bromocresol purple in bulk and pharmaceutical dosage form. J. Pharm. Biomed. Anal. 2002, 29, 545–554. [Google Scholar] [CrossRef]
- Amin, A.; El-Fetouh Gouda, A.A.; El-Sheikh, R.; Zahran, F. Spectrophotometric determination of gatifloxacin in pure form and in pharmaceutical formulation. Spectrochim. Acta A Mol. Biomol. Spectrosc. 2007, 67, 1306–1312. [Google Scholar] [CrossRef] [PubMed]
- Süslü, İ.; Tamer, A. Application of bromophenol blue and bromocresol purple for the extractive-spectrophotometric determination of ofloxacin. Analyt. Lett. 2003, 36, 1163–1181. [Google Scholar] [CrossRef]
- Amin, A.S.; El-Mossalamy, M.; Killa, H.M.; Saber, A.L. Three spectrophotometric methods for the determination of oxomemazine hydrochloride in bulk and in pharmaceutical formulations using bromocresol green, congo red, and methyl orange. Analyt. Lett. 2008, 41, 80–89. [Google Scholar] [CrossRef]
- Abdellatef, H.E. Extractive-spectrophotometric determination of disopyramide and irbesartan in their pharmaceutical formulation. Spectrochim. Acta A Mol. Biomol. Spectr. 2007, 66, 1248–1254. [Google Scholar] [CrossRef] [PubMed]
- Rahman, N.; Ahmad Khan, N.; Hejaz Azmi, S.N. Extractive spectrophotometric methods for the determination of nifedipine in pharmaceutical formulations using bromocresol green, bromophenol blue, bromothymol blue and eriochrome black T. Farmaco 2004, 59, 47–54. [Google Scholar] [CrossRef] [PubMed]
- Kumar, R.S.; Manjunatha, D.Y.; Shaikh, S.M.T.; Seetharamappa, J.; Harikrishna, K. Sensitive extractive spectrophotometric methods for the determination of trazodone hydrochloride in pharmaceutical formulations. Chem. Pharm. Bull. 2006, 54, 968–971. [Google Scholar] [CrossRef] [Green Version]
- Onal, A.; Kepekci, S.E.; Cetin, M.; Ertuk, S. Spectrophotometric determination of certain antidepressants in pharmaceutical preparations. J. Assoc. Off. Anal. Chem. 2006, 89, 966–971. [Google Scholar]
- Aydoğmuş, Z.; Inanli, I. Extractive spectrophotometric methods for determination of zolmitriptan in tablets. J. Assoc. Off. Anal. Chem. 2007, 90, 1237–1241. [Google Scholar]
- Mabrouk, M.M.; Gouda, A.A.; El-Malla, S.F.; Abdel Haleem, D.S. Sensitive spectrophotometric determination of vardenafil HCl in pure and dosage forms. Ann. Pharm. Franç. 2021, 79, 16–27. [Google Scholar] [CrossRef] [PubMed]
- Xiong, Y.; Pei, K.; Wu, Y. Colorimetric ELISA based on glucose oxidase-regulated the color of acid–base indicator for sensitive detection of aflatoxin B1 in corn samples. Food Control. 2017, 78, 317–323. [Google Scholar] [CrossRef]
- Nagib Qarah, A.S.; Basavaiah, K.; Swamy, N. Ion-pair extractive spectrophotometric assay of terbinafine hydrochloride in pharmaceuticals and spiked urine using bromocresol purple. Zurn. Priklad. Spektrosk. 2016, 83, 667(1)–667(9). [Google Scholar]
- Rehman, F.; Gul, S.; Hussain, S.; Khan, S. New spectrophotometric method for the determination of mirtazapine in pharmaceutical formulations. J. Chilean Chem. Soc. 2016, 61, 2913–2915. [Google Scholar] [CrossRef]
- Erçağ, E.; Sarioğlu, G.; Üzer, A.; Bora, T.; Apak, R. Extractive-spectrophotometric determination of amine-type stimulants and antidepressants with anionic indicator dyes. J. Anal. Chem. 2013, 68, 583–589. [Google Scholar] [CrossRef]
- Néill, C.N.; Akdağ, M.; Betts, A.J.; Cassidy, J.F. An ammonia sensor using an unadorned bromocresol layer. Int. J. Environ. Anal. Chem. 2020. [Google Scholar] [CrossRef]
- Khattab, T.A.; Dacrory, S.; Abou-Yousef, H.; Kamel, S. Development of microporous cellulose-based smart xerogel reversible sensor via freeze drying for naked-eye detection of ammonia gas. Carbohyd. Polym. 2019, 210, 196–203. [Google Scholar] [CrossRef]
- Nasimov, A.M.; Isakulova, M.; Tashpulatov, K.S.; Buronov, A.O.; Mirzaev, S.E.; Toshpulatov, D.T. Photochemical studies of bromocresol purple in sol-gel membrane. J. Adv. Res. Dynam. Control Syst. 2020, 12, 1156–1159. [Google Scholar]
- Gavrilenko, N.A.; Fedan, D.A.; Saranchina, N.V.; Sukhanov, A.V. Reversible pH-sensitive element based on bromocresol purple immobilized into the polymethacrylate matrix. Mend. Commun. 2018, 28, 450–452. [Google Scholar] [CrossRef]
- Al-Hossainy, A.A. Combined experimental and TDDFT-DFT computation, characterization, and optical properties for synthesis of keto-bromothymol blue dye thin film as optoelectronic devices. J. Elec. Mater. 2021, 50, 3800–3813. [Google Scholar] [CrossRef]
- Alamdari, N.E.; Aksoy, B.; Jiang, Z.; Aksoy, M.; Beck, B.H. A novel paper-based and pH-sensitive intelligent detector in meat and seafood packaging. Talanta 2021, 224, 121913. [Google Scholar] [CrossRef]
- Ludden, M.D.; Ward, M.D. Outside the box: Quantifying interactions of anions with the exterior surface of a cationic coordination cage. Dalton Trans. Int. J. Inorg. Chem. 2021, 50, 2782–2791. [Google Scholar] [CrossRef] [PubMed]
- Kari, N.; Koxmak, S.; Wumaier, K.; Nizamidin, P.; Abliz, S.; Yimit, A. Application of bromocresol purple nanofilm and laser light to detect mutton freshness. Spectrochim. Acta A. Mol. Biomol. Spectr. 2021, 244, 118863. [Google Scholar] [CrossRef]
- Pastrello, B.; dos Santos, G.C.; Silva-Filho, L.C.D.; de Souza, A.R.; Ximenes, V.F.; Morgon, N.H.; Ximenes, V.F. Novel amino-quinoline-based solvatochromic fluorescence probe: Interaction with albumin, lysozyme and characterization of amyloid fibrils. Dyes Pigm. 2020, 173, 107874. [Google Scholar] [CrossRef]
- Tabaraki, R.; Sadeghinejad, N. Biosorption of six basic and acidic dyes on brown alga Sargassum ilicifolium: Optimization, kinetic and isotherm studies. Water Sci. Technol. 2017, 75, 2631–2638. [Google Scholar] [CrossRef] [PubMed]
- Włodarczyk, E.; Zarzycki, P.K. Chromatographic behavior of selected dyes on silica and cellulose micro-TLC plates: Potential application as target substances for extraction, chromatographic, and/or microfluidic systems. J. Liq. Chromatogr. Rel. Technol. 2017, 40, 259–281. [Google Scholar] [CrossRef]
- Logt, A.; Rijpma, S.; Vink, C.; Prudon-Rosmulder, E.; Wetzels, J.F.; van Berkel, M. The bias between different albumin assays may affect clinical decision-making. Technic. Notes 2019, 95, 1514–1517. [Google Scholar]
- Zeybek, D.K.; Demir, B.; Zeybek, B.; Pekyardımcı, Ş. A sensitive electrochemical DNA biosensor for antineoplastic drug 5-fluorouracil based on glassy carbon electrode modified with poly(bromocresol purple). Talanta 2015, 144, 793–800. [Google Scholar] [CrossRef]
- Aljerf, L. High-efficiency extraction of bromocresol purple dye and heavy metals as chromium from industrial effluent by adsorption onto a modified surface of zeolite: Kinetics and equilibrium study. J. Environ. Manag. 2018, 225, 120–132. [Google Scholar] [CrossRef]
- Kim, Y.H.; Sathiyanarayanan, G.; Kim, H.J.; Bhatia, S.K.; Seo, H.-M.; Kim, J.-H.; Song, H.-S.; Kim, Y.-G.; Park, K.; Yang, Y.-H. A liquid-based colorimetric assay of lysine decarboxylase and its application to enzymatic assay. J. Microbiol. Biotechnol. 2015, 25, 2110–2115. [Google Scholar] [CrossRef]
- Zeng, J.; Eckenrode, H.; Dai, H.; Wilhelm, M.J. Adsorption and transport of charged vs. neutral hydrophobic molecules at the membrane of murine erythroleukemia (MEL) cells. Coll. Surf. B Biointerf. 2015, 127, 122–129. [Google Scholar] [CrossRef]
- Thompson, S.; Ding, L.-E. Underestimation of the serum ascites albumin gradient by the bromocresol purple method of albumin measurement. Int. Med. J. 2018, 48, 1412–1413. [Google Scholar] [CrossRef]
- Moreira, V.G.; Vaktangova, N.B.; Gago, M.D.M.; Gonzalez, B.L.; Alonso, S.G.; Rodriguez, E.F. Overestimation of albumin measured by bromocresol green vs bromocresol purple method: Influence of acute-phase globulins. Lab. Med. 2018, 49, 355–361. [Google Scholar]
- Le Reun, E.; Leven, C.; Lapègue, M.; Kerspern, H.; Rouillé, A.; Carré, J.-L.; Padelli, M. Évaluation des performances du kit DiAgam pour le dosage immunoturbidimétrique de l’albumine plasmatique : Étude comparative. Ann. Biol. Clin. 2018, 76, 477–479. [Google Scholar]
- Delanghe, S.; Biesen, W.; Velde, N.; Eloot, S.; Pletinck, A.; Schepers, E.; Glorieux, G.; Delanghe, J.R.; Speeckaert, M.M. Binding of bromocresol green and bromocresol purple to albumin in hemodialysis patients. Clin. Chem. Lab. Med. 2018, 56, 436–440. [Google Scholar] [CrossRef] [PubMed]
- Pan, W.; Lau, W.; Mattman, A.; Kiaii, M.; Jung, B. Comparison of hypoalbuminemia-corrected serum calcium using BCP albumin assay to ionized calcium and impact on prescribing in hemodialysis patients. Clin. Nephrol. 2018, 89, 34–40. [Google Scholar] [CrossRef]
- Ueno, T.; Hirayama, S.; Sugihara, M.; Miida, T. The bromocresol green assay, but not the modified bromocresol purple assay, overestimates the serum albumin concentration in nephrotic syndrome through reaction with α2-macroglobulin. Ann. Clin. Biochem. 2016, 53, 97–105. [Google Scholar] [CrossRef] [PubMed] [Green Version]
- Chmelová, D.; Ondrejovič, M. Purification and characterization of extracellular laccase produced by Ceriporiopsis subvermispora and decolorization of triphenylmethane dyes. J. Basic Microbiol. 2016, 56, 1173–1182. [Google Scholar] [CrossRef] [PubMed]
- Davies, D.B.; Veselkov, D.A.; Djimant, L.N.; Veselkov, A.N. Hetero-association of caffeine and aromatic drugs and their competitive binding with a DNA. Eur. Biophys. J. 2001, 30, 354–366. [Google Scholar] [CrossRef] [PubMed]
- Davies, D.B.; Veselkov, D.A.; Veselkov, A.N. NMR determination of the hetero-association of phenanthridines with daunomycin and their competitive binding to a DNA oligomer. Eur. Biophys. J. 2002, 31, 151–162. [Google Scholar]
- Uversky, V.N.; Winter, S.; Löber, G. Self-association of 8-anilino-1-naphthalene-sulfonate molecules: Spectroscopic characterization and application to the investigation of protein folding. Biochim. Biophys. Acta 1998, 1388, 133–142. [Google Scholar] [CrossRef]
- Javadpour, M.M.; Barkley, M.D. Self-assembly of designed antimicrobial peptides in solution and micelles. Biochemistry 1997, 36, 9540–9549. [Google Scholar] [CrossRef]
- Shi, X.; Ma, W.; Sun, C.; Wu, S. The aggregation behavior of collagen in aqueous solution and its property of stabilizing liposomes in vitro. Biomaterials 2001, 22, 1627–1634. [Google Scholar] [CrossRef]
- Davies, D.B.; Veselkov, D.A.; Evstigneev, M.P.; Veselkov, A.N. Self-association of the antitumour agent novatrone (mitoxantrone) and its hetero-association with caffeine. J. Chem. Soc. Perkin Trans. 2001, 2, 61–67. [Google Scholar] [CrossRef]
- Shapovalov, S.A.; Koval, V.L.; Chernaya, T.A.; Pereverzev, A.Y.; Derevyanko, N.A.; Ishchenko, A.A. Association of indopolymethine cyanine cations with anions of sulfonephthalein and xanthene dyes in water. J. Braz. Chem. Soc. 2005, 16, 232–240. [Google Scholar] [CrossRef] [Green Version]
- Shapovalov, S.; Kiseliova, Y. Association of thymolsulfonephthalein and cresolsulfonephthalein anions with cationic cyanines in aqueous solution. Chem. Chem. Technol. 2010, 4, 271–276. [Google Scholar] [CrossRef]
- Shapovalov, S. Association of quinaldine red cation in an aqueous solution: The interaction with anionic dyes. AASCIT J. Nanosci. 2017, 3, 35–40. [Google Scholar]
- Shapovalov, S.; Kiseliova, Y. Heteroassociation of the bromine-containing anions of sulfophthaleins in aqueous solution. Russ. Chem. Bull. 2010, 59, 1317–1326. [Google Scholar] [CrossRef]
- Shapovalov, S.A. Association of anions of phenolsulfonephthalein and its alkyl-substituted derivatives with single-charged cations of polymethines. Russ. Chem. Bull. 2011, 60, 465–473. [Google Scholar] [CrossRef]
- Das Gupta, D.; Read, J.B. First pKa values of some acid-base indicators. J. Pharm. Sci. 1970, 11, 1683–1685. [Google Scholar] [CrossRef] [PubMed]
- Herz, A. Protonation equilibria of cyanines of solution and at AgBr surfaces. Photogr. Sci. Eng. 1974, 18, 207–215. [Google Scholar]
- Savitzky, A.; Golay, M. Smoothing and differentiation of data by simplified least squares procedures. Analyt. Chem. 1964, 36, 1627–1639. [Google Scholar] [CrossRef]
- Paris, Q. The dual of the least-squares method. Open J. Statist. 2015, 5, 658–664. [Google Scholar] [CrossRef] [Green Version]
- Shapovalov, S.A.; Samoilov, E.A. Regularities of homo- and heteroassociation of the pinacyanol cation in aqueous solution. Russ. Chem. Bull. 2008, 57, 1405–1415. [Google Scholar] [CrossRef]
- Ishchenko, A.A.; Shapovalov, S.A. Heterogeneous association of the ions of dyes in solutions (review). J. Appl. Spectrosc. 2004, 71, 605–629. [Google Scholar] [CrossRef]
- Shapovalov, S.A.; Svishcheva, Y.A. The peculiarities of the association between pinacyanol cations and anions in aqueous solution. Kharkov Univ. Bull. Chem. Ser. 2000, 5, 112–116. (In Russian) [Google Scholar]
- Veselkov, D.A.; Evstigneev, M.P.; Kodintsev, V.V.; Djimant, L.N.; Davies, D.; Veselkov, A.N. Investigation of the heteroassociation of daunomycin and ethidium bromide molecules in aqueous solution by 1H NMR spectroscopy. J. Phys. Chem. 2001, 75, 879–884. (In Russian) [Google Scholar]
- Veselkov, D.A.; Sigaev, V.A.; Vysotskii, S.A.; Djimant, L.N.; Davies, D.; Veselkov, A.N. Investigation of the heteroassociation of caffeine with acridine orange dye in aqueous solution by 1H NMR spectroscopy. J. Struct. Chem. 2000, 41, 86–96. (In Russian) [Google Scholar] [CrossRef]
- Sangster, J. Octanol-water partition coefficients of simple organic compounds. J. Phys. Chem. Ref. Data 1989, 18, 1111–1229. [Google Scholar] [CrossRef]
- Miller, M.M.; Wasik, S.P.; Huang, G.L.; Shiu, W.Y.; Mackay, D. Relationships between octanol-water partition coefficient and aqueous solubility. Environ. Sci. Technol. 1985, 19, 522–529. [Google Scholar] [CrossRef]
- Isac-García, J.; Dobado, J.A.; Calvo-Flores, F.G.; Martínez-García, H. Determining physical and spectroscopic properties. Experim. Org. Chem. 2016, 145–175. [Google Scholar] [CrossRef]
- Amézqueta, S.; Subirats, X.; Fuguet, E.; Rosés, M.; Ràfols, C. Octanol-water partition constant. Liquid-Phase Extr. 2020, 183–208. [Google Scholar] [CrossRef]
- Shapovalov, S.A. Interaction of cationic forms of pinacyanol with organic anions in aqueous solutions: Estimation of structural factor. Ukr. Chem. J. 2004, 70, 25–29. (In Russian) [Google Scholar]
- Peyratout, C.; Daehne, L. Aggregation of thiacyanine derivatives on polyelectrolytes. Phys. Chem. Chem. Phys. 2002, 4, 3032–3039. [Google Scholar] [CrossRef]
- Rubires, R.; Farrera, J.-A.; Ribo, J.M. Stirring effects on the spontaneous formation of chirality in the homoassociation of deprotonated meso-tetraphenylsulfonato porphyrins. Chem. Eur. J. 2001, 7, 436–446. [Google Scholar] [CrossRef]
- Uznanski, P. From spontaneously formed aggregates to J-aggregates of photochromic spiropyran. Synth. Metals 2000, 109, 281–285. [Google Scholar] [CrossRef]
- Tian, M.; Furuki, M.; Iwasa, I.; Sato, Y.; Pu, L.S.; Satoshi, T. Search for squaraine derivatives that can be sublimed without thermal decomposition. J. Phys. Chem. B 2002, 106, 4370–4376. [Google Scholar] [CrossRef]
- Dewar, M.J.S.; Storch, D.M. Development and use of quantum molecular models. 75. Comparative tests of theoretical procedures for studying chemical reactions. J. Am. Chem. Soc. 1985, 107, 3898–3902. [Google Scholar] [CrossRef]
- Stewart, J.J.P. Optimization of parameters for semiempirical methods II. Applications. J. Comput. Chem. 1989, 10, 221–264. [Google Scholar] [CrossRef]
- Korenman, Y.I. Extraction of Phenols; Gor’kii, USSR; Volgo-Vyatka Publishing House: Volgo-Vyatka, Russia, 1973; 216p, ISBN 986-250-3-73314-3. (In Russian) [Google Scholar]
- Molchanova, N.; Nielsen, J.E.; Sørensen, K.B.; Prabhala, B.K.; Hansen, P.R.; Lund, R.; Barron, A.E.; Jenssen, H. Halogenation as a tool to tune antimicrobial activity of peptoids. Sci. Rep. 2020, 10, 14805. [Google Scholar] [CrossRef] [PubMed]
Figure 1.
The relative content of protolytic forms of dyes depending on the pH of the aqueous solution.
Figure 1.
The relative content of protolytic forms of dyes depending on the pH of the aqueous solution.

Figure 2.
Absorption spectra in the system “BP + QB”. Concentrations, mol/L, QB: 4.9·10−7 (1–4); BP: 0 (1), 2.30·10−6 (2), 8.30·10−6 (3), 4,51·10−5 (4). The thickness of the absorbing layer (l) is 5.00 cm, pH 9.2. Comparison solutions: Water (1), BP solution in the appropriate concentration (2–4).
Figure 2.
Absorption spectra in the system “BP + QB”. Concentrations, mol/L, QB: 4.9·10−7 (1–4); BP: 0 (1), 2.30·10−6 (2), 8.30·10−6 (3), 4,51·10−5 (4). The thickness of the absorbing layer (l) is 5.00 cm, pH 9.2. Comparison solutions: Water (1), BP solution in the appropriate concentration (2–4).

Figure 3.
Absorption spectra in the system “BP + QB”. Concentrations, mol/L, QB: 4.8·10−5 (1–6); BP: 0 (1), 1.1·10−5 (2), 2.2·10−5 (3), 3.03·10−5 (4). The thickness of the absorbing layer (l) is 0.20 cm, pH 9.2. Comparison solutions: Water (1), BP solution in the appropriate concentration (2–4).
Figure 3.
Absorption spectra in the system “BP + QB”. Concentrations, mol/L, QB: 4.8·10−5 (1–6); BP: 0 (1), 1.1·10−5 (2), 2.2·10−5 (3), 3.03·10−5 (4). The thickness of the absorbing layer (l) is 0.20 cm, pH 9.2. Comparison solutions: Water (1), BP solution in the appropriate concentration (2–4).

Figure 4.
Energy dependences on the RMS value for three variants (1–3) of different locations of ions in the (Ct+)2·An2− associate.
Figure 4.
Energy dependences on the RMS value for three variants (1–3) of different locations of ions in the (Ct+)2·An2− associate.

Figure 5.
Changes in ΔfHo from RMS values for Ct+·HAn− associate of BP with QB, PM3 method.

Figure 6.
The value of ΔfHo for ions (QB+, BP−) and the Ct+·HAn− associate.


Table 1.
Spectral and protolytic characteristics of dyes.
| Dye | pKa1 (λmax, nm HAn− or Ct+) | pKa2 (λmax, nm An2−) |
|---|---|---|
| 3,3-bis(3-bromo-4-hydroxy-5-methylphenyl)- 3H-2,1λ⁶-benzoxathiole-1,1-dione (BP) CAS 115-40-2  | −0.75 | 6.40 |
| 1-ethyl-2-[3-(1-ethyl-1,2-dihydroquinolin-2-ylidene) prop-1-en-1-yl]quinolin-1-ium chloride (QB+) CAS 2768-90-3  | 3.5 (600, α-band; 550, β-band) | – |
| 2-(-(4-dimethylamino)styryl)-1-ethylquinolinium iodide (QR+) CAS 117-92-0  | 2.63 (528) | – |
Table 2.
The lg Kas values of BP associates.
| Cation | lg Kas | |
|---|---|---|
| Ct+·HAn− | (Ct+)2·An2− | |
| QB | 6.61 ± 0.07 | 11.16 ± 0.11 |
| QR | 4.84 ± 0.06 | 8.29 ± 0.05 |
Table 3.
Dependence of ΔfHo on RMS values and change of mutual arrangement of BP and QR dyes in Ct+·HAn− associate.
Table 3.
Dependence of ΔfHo on RMS values and change of mutual arrangement of BP and QR dyes in Ct+·HAn− associate.
| State | Arrangement of BP and QB Ions |
|---|---|
| 1 |  |
| 2 |  |
| 3 |  |
| 4–5 |  |
Table 4.
Values of ΔfHo, Σ − ΔfHo and δ for BP dissimilar associates.
| An Associate | Σ, kJ/mol | ΔfHo, kJ/mol | Σ − ΔfHo, kJ/mol/δ, % |
|---|---|---|---|
| QB+∙BP− | 359 | 202 | 157/28 |
| QR+∙BP− | 303 | 107 | 194/14 |
| (QB+)2∙BP2− | 1367 | 703 | 664/6 |
| (QR+)2∙BP2− | 1254 | 525 | 729/7 |
Publisher’s Note: MDPI stays neutral with regard to jurisdictional claims in published maps and institutional affiliations. |
© 2021 by the author. Licensee MDPI, Basel, Switzerland. This article is an open access article distributed under the terms and conditions of the Creative Commons Attribution (CC BY) license (https://creativecommons.org/licenses/by/4.0/).
Share and Cite
MDPI and ACS Style
Shapovalov, S.A. Cation–Anionic Interactions of Dyes in Aqueous Solutions: Bromocresol Purple in the Processes of Dissimilar Association. Colorants 2022, 1, 5-19. https://0-doi-org.brum.beds.ac.uk/10.3390/colorants1010003
AMA Style
Shapovalov SA. Cation–Anionic Interactions of Dyes in Aqueous Solutions: Bromocresol Purple in the Processes of Dissimilar Association. Colorants. 2022; 1(1):5-19. https://0-doi-org.brum.beds.ac.uk/10.3390/colorants1010003
Chicago/Turabian StyleShapovalov, Serghey A. 2022. "Cation–Anionic Interactions of Dyes in Aqueous Solutions: Bromocresol Purple in the Processes of Dissimilar Association" Colorants 1, no. 1: 5-19. https://0-doi-org.brum.beds.ac.uk/10.3390/colorants1010003