Article

Comparative Transcriptome Analysis Reveals the Molecular Immunopathogenesis of Chinese Soft-Shelled Turtle (Trionyx sinensis) Infected with Aeromonas hydrophila

1
Hunan Engineering Technology Research Center of Featured Aquatic Resources Utilization, Hunan Agricultural University, Changsha 410128, China
2
School of Oceanography, Shanghai Jiao Tong University, Shanghai 200240, China
*
Author to whom correspondence should be addressed.
Submission received: 12 October 2021 / Revised: 18 November 2021 / Accepted: 19 November 2021 / Published: 22 November 2021
(This article belongs to the Special Issue Transcriptome and Genome Analyses Applied to Aquaculture Research)

Abstract

:

Simple Summary

The Chinese soft-shelled turtle (Trionyx sinensis) is an important cultured reptile in East Asia. Hemorrhagic sepsis caused by Aeromonas hydrophila infection is the dominant disease in the aquaculture of Chinese soft-shelled turtles, while the molecular pathology is far from clear due to the lag of research on turtle immunology. It has been reported in mammals and fish that the dysfunction of immune responses to pathogen infections causes host tissue hemorrhagic sepsis. In this study, two groups of turtles with different susceptibility to A. hydrophila infection are found. A comparative transcriptome strategy is adopted to examine the gene expression profiles in liver and spleen for these two phenotypes of turtles post A. hydrophila infection, for the first time revealing the full picture of immune mechanisms against A. hydrophila, which provides new insight into the molecular pathology during A. hydrophila infection in T. sinensis. The findings will promote further investigations on pathogenic mechanisms of hemorrhagic sepsis caused by A. hydrophila infection in T. sinensis, and also will benefit their culture industry.

Abstract

Although hemorrhagic sepsis caused by Aeromonas hydrophila infection is the dominant disease in the aquaculture of Chinese soft-shelled turtle, information on its molecular pathology is seriously limited. In this study, ninety turtles intraperitoneally injected with A. hydrophila exhibited two different phenotypes based on the pathological symptoms, referred to as active and inactive turtles. Comparative transcriptomes of liver and spleen from these two groups at 6, 24, and 72 h post-injection (hpi) were further analyzed. The results showed that cytokine–cytokine receptor interaction, PRRs mediated signaling pathway, apoptosis, and phagocytosis enriched in active and inactive turtles were significantly different. Pro-inflammatory cytokines, the TLR signaling pathway, NLR signaling pathway, and RLR signaling pathway mediating cytokine expression, and apoptosis-related genes, were significantly up-regulated in inactive turtles at the early stage (6 hpi). The significant up-regulation of phagocytosis-related genes occurred at 24 hpi in inactive turtles and relatively lagged behind those in active turtles. The anti-inflammatory cytokine, IL10, was significantly up-regulated during the tested periods (6, 24, and 72 hpi) in active turtles. These findings offer valuable information for the understanding of molecular immunopathogenesis after A. hydrophila infection, and facilitate further investigations on strategies against hemorrhagic sepsis in Chinese soft-shelled turtle T. sinensis.

1. Introduction

Chinese soft-shelled turtle (Trionyx sinensis) is an important reptile in East Asia and has been taken as a food resource for a long time in these areas, especially in China and Japan. In ancient Chinese medicine descriptions, consumption of turtles may bring about positive effects for human health, including strengthening immunity, anti-aging, and curing cardiocerebrovascular diseases [1]. The excellent nutriment and medical values mean the turtles have become one of the most critical freshwater aquaculture reptiles, and the annual production is over 325,000 tons in China. However, infectious diseases caused by bacteria and viruses have resulted in severe losses to the aquaculture of turtles [2,3]. It is noteworthy that there are more than 15 kinds of diseases caused by Aeromonas hydrophila infection, such as red neck disease, septicemia, furunculosis, etc., accounting for about 60% of the total disease cases in turtles [4,5]. The histopathology of Chinese soft-shelled turtles infected by A. hydrophila has been previously described. In general, the pathogenic processes undergo the adhesion of bacteria adhesion factors, and the destruction of host liver, respiratory, and digestive organs by virulence factors such as exotoxin and extracellular enzymes, which finally leads to serious tissue hemorrhagic sepsis and the death of turtles [6,7]. Nevertheless, the molecular pathology of hemorrhagic sepsis caused by A. hydrophila infection is far from being elucidated in Chinese soft-shelled turtles.
It has been reported in mammals and fish that the dysfunction of host immune responses to pathogen infections causes tissue hemorrhagic sepsis [8,9,10]. The immune system generally serves as the security guard for hosts, which holds an immune network composed of many immune cells [11]. The cells of the innate immune system consisting of neutrophils, monocytes, macrophages, dendritic cells, and natural killer cells recognize pathogens, produce cytokines, and engulf pathogens through phagocytosis, which are the first line of host defense against pathogens [12]. These innate immune cells rely on pattern recognition receptors (PRRs) including toll-like receptors (TLRs), nucleotide-binding domain (NOD)-like receptors (NLRs), and retinoic acid-inducible gene I-like receptors (RLRs) to recognize various microbial invaders and produce cytokines that further activate the innate as well as adaptive immune cells [13]. Under normal immune response, immune cells moderately produce and release cytokines, including interleukins (ILs), chemokines, and tumor necrosis factors (TNFs), which can contact more immune cells to participate in the battle between the host and foreign pathogens [14]. When immune cells produce excessive cytokines, especially pro-inflammatory cytokines such as IL1, IL6, IL18, and TNFs (“cytokine storm”), the host immune system is overactivated and attacks self-tissues or cells, causing systemic inflammation, tissue hemorrhagic sepsis, and even death [15,16].
Although the research of turtle immunology lags behind that of mammals and fish, the unique evolutionary status as secondary aquatic reptiles has recently aroused wide concern on the distinct immune response mechanism against pathogens in turtles [17,18,19,20]. Fifteen candidate TLR family genes have been identified in T. sinensis [21]. After A. hydrophila infection, TLR2 and TLR4 are significantly up-regulated in the spleen, indicating the immune response of TLR signaling pathway during bacterial infection in T. sinensis [21]. Zhou et al. identified an IL8 homolog from T. sinensis and confirmed that IL8 mRNA expression shows significant up-regulation in various tissues, including liver, spleen, kidney, heart, intestine, and blood, after A. hydrophila infection [22]. Zhang et al. also investigated the mRNA expression changes of pro-inflammatory cytokines such as IL1β, TNFα, IL6, IL8, and IL12 in T. sinensis during acute cold stress, revealing that acute cold stress increases the expression of pro-inflammatory cytokines in the spleen and intestine to withstand A. hydrophila infection [23]. These above studies may help us understand the mRNA expression profiles and function of several immune molecules in T. sinensis. However, the evidence on the immune response mechanism in T. sinensis so far is too scattered and limited, which largely hinders the studying of pathogen–host immunity interaction and the molecular pathology during A. hydrophila infection in Chinese soft-shelled turtles.
RNA-sequencing (RNA-Seq) using next-generation sequencing is one of the most useful methods to survey the character of a transcriptome because it offers the whole data on gene expression. To date, transcriptome profiling using next-generation sequencing technologies has provided new insights into pathogen–host immunity interaction in many aquaculture fish species, such as Nile tilapia (Oreochromis niloticus) [24], Gold fish (Carassius auratus L.) [25], Ussuri catfish (Pseudobagrus ussuriensis) [26], Yellow catfish (Pelteobagrus fulvidraco) [27], and Atlantic salmon (Salmo salar) [28]. More and more studies have used this high-throughput sequencing approach to identify the expression differences of immune molecules between the resistant and susceptible fish to pathogen infection. For example, Moraleda et al. analyzed the comparative transcriptomes of resistant/susceptible salmons with different immune responses to Piscirickettsia salmonis infection and revealed that the gene networks involved in the apoptotic, cytoskeletal reorganization, bacterial invasion, and intracellular trafficking processes are tightly associated with disease resistance/susceptibility [29]. We are originally inspired by the previous research results in mammals and fish that the dysfunction of host immune responses to pathogen infections causes tissue hemorrhagic sepsis. In the present study, therefore, a comparative transcriptome strategy is adopted to reveal the immune gene expression profiles in two phenotypes of Chinese soft-shelled turtles with different susceptibility to A. hydrophila infection at different time periods (6, 24, and 72 hpi), and to clarify which immune process abnormalities may be related to the occurrence of hemorrhagic sepsis. The results depict the full picture of immune mechanisms in response to A. hydrophila infection, suggesting that the dysfunction of cytokine–cytokine receptor interaction, PRRs mediated signaling pathways, phagocytosis, and apoptosis may cause hemorrhagic sepsis during A. hydrophila infection in Chinese soft-shelled turtles. This study, for the first time, reveals the host immunity–pathogen infection interaction and molecular immunopathogenesis during A. hydrophila infection by comparative transcriptomes, which may contribute to the development of novel management strategies for disease control and prevention in Chinese soft-shelled turtles.

2. Materials and Methods

2.1. Experimental Animals and Bacteria Strain

Experimental turtles (T. sinensis) with an average weight of 16.45 ± 1.28 g were obtained from a breeding farm (111°97′ E, 28°90′ N) in Changde City, Hunan Province, China. All the turtles were acclimated in 50 L aquarium with aerated freshwater in a constant temperature laboratory room at 30 °C for two weeks before processing and were fed with a commercial diet (Kesheng Feed Stock Co., Ltd., Hangzhou, Zhejiang, China) twice a day. The animal experiments were according to the rules of the Animal Care and Use Committee of Hunan Agricultural University (Changsha, China; Approval Code: 201903297; Approval Date: 11 October 2019).
The bacteria A. hydrophila, isolated from the spleen of clinically diseased turtles, was provided by Professor Zhipeng Gao from the College of Animal Science and Technology, Hunan Agricultural University, China. A. hydrophila was cultured in Luria Bertani (LB) medium at 30 °C with the shaking at 200 rpm. After 18 h culturing, the bacteria were harvested by centrifugation, and suspended with sterile phosphate buffer saline (PBS). The bacteria concentration was adjusted to 1.39 × 10⁹ CFU/mL with PBS, which was previously proved as the medium lethal concentration for turtles during A. hydrophila infection.

2.2. Experimental Treatments, Pathological Observation, and Sampling

For the A. hydrophila challenge, 90 turtles were intraperitoneally injected with bacteria suspension (100 μL per turtle, designated as the treatment group). After bacteria injection, the turtles in the treatment group could be divided into two subgroups based on their pathological symptoms and behavior activities. One subgroup of turtles showed weaker ability to feed and move, with significant hemorrhagic symptoms on the body surface and swelling and congestion on viscera after anatomy, which was designated as the inactive subgroup. The other subgroup of turtles exhibited no obvious pathological symptoms, which was designated as the active subgroup. Ten turtles, injected with 100 μL of PBS, were set up as the control group.
To investigate the expressional profiles of immune-related genes during A. hydrophila infection in active and inactive turtles, important immune-related tissues including spleen and liver from the active subgroup turtles (N = 3) and inactive subgroup turtles (N = 3) were sampled post-injection of A. hydrophila at 6, 24, 72 h, respectively. Spleen and liver tissues from the control group turtles (N = 3) with PBS injection at 0 h were sampled as the control for the gene expression comparison with those from active subgroup turtles or from inactive subgroup turtles. Each sample was taken three times, and the sampled tissues were stored in liquid nitrogen before RNA extraction.

2.3. RNA Extraction, Library Preparation, and RNA Sequencing (RNA-Seq)

Total RNA from each sampled tissue was isolated by using RNeasy mini kit (QIAGEN, Germantown, MD, USA) and treated with RNase-free DNase I (QIAGEN, Germantown, MD, USA) at 37 °C for 1 h to remove residual genomic DNA. RNA quality and concentration were determined using Agilent Bioanalyser 2100 (Agilent Technologies, Santa Clara, CA, USA) and NanoDrop-1000 (NanoDrop Technologies, Wilmington, DE, USA), respectively. Five micrograms of RNA were used to construct RNA-seq library according to the instruction of Illumina mRNA-Seq Prep Kit (Illumina, San Diego, CA, USA), and the libraries were sequenced by paired-end sequencing on the Illumina HiSeq 2500 sequencing platform (Illumina, San Diego, CA, USA). The quality of RNA-Seq raw reads were assessed with FastQC (version 0.10.1; http://www.bioinformatics.bbsrc.ac.uk/projects/fastqc/ accessed on 11 March 2019), and were cleaned by removing adapter sequences, poly-N sequences, and low-quality sequences. The clean reads were then aligned to the published T. sinensis genome using HISAT2 [30]. In total, 291.16 GB clean data were produced, and the average of 20.4~36.3 GB clean reads were obtained from samples. About 80% of the clean reads were mapped to the reference genome by using StringTie software (Center for Computational Biology, Johns Hopkins University, Baltimore, MD, USA) [31], and the Q30 was >92.86%. The general information of RNA-Seq data is listed in Table S1.

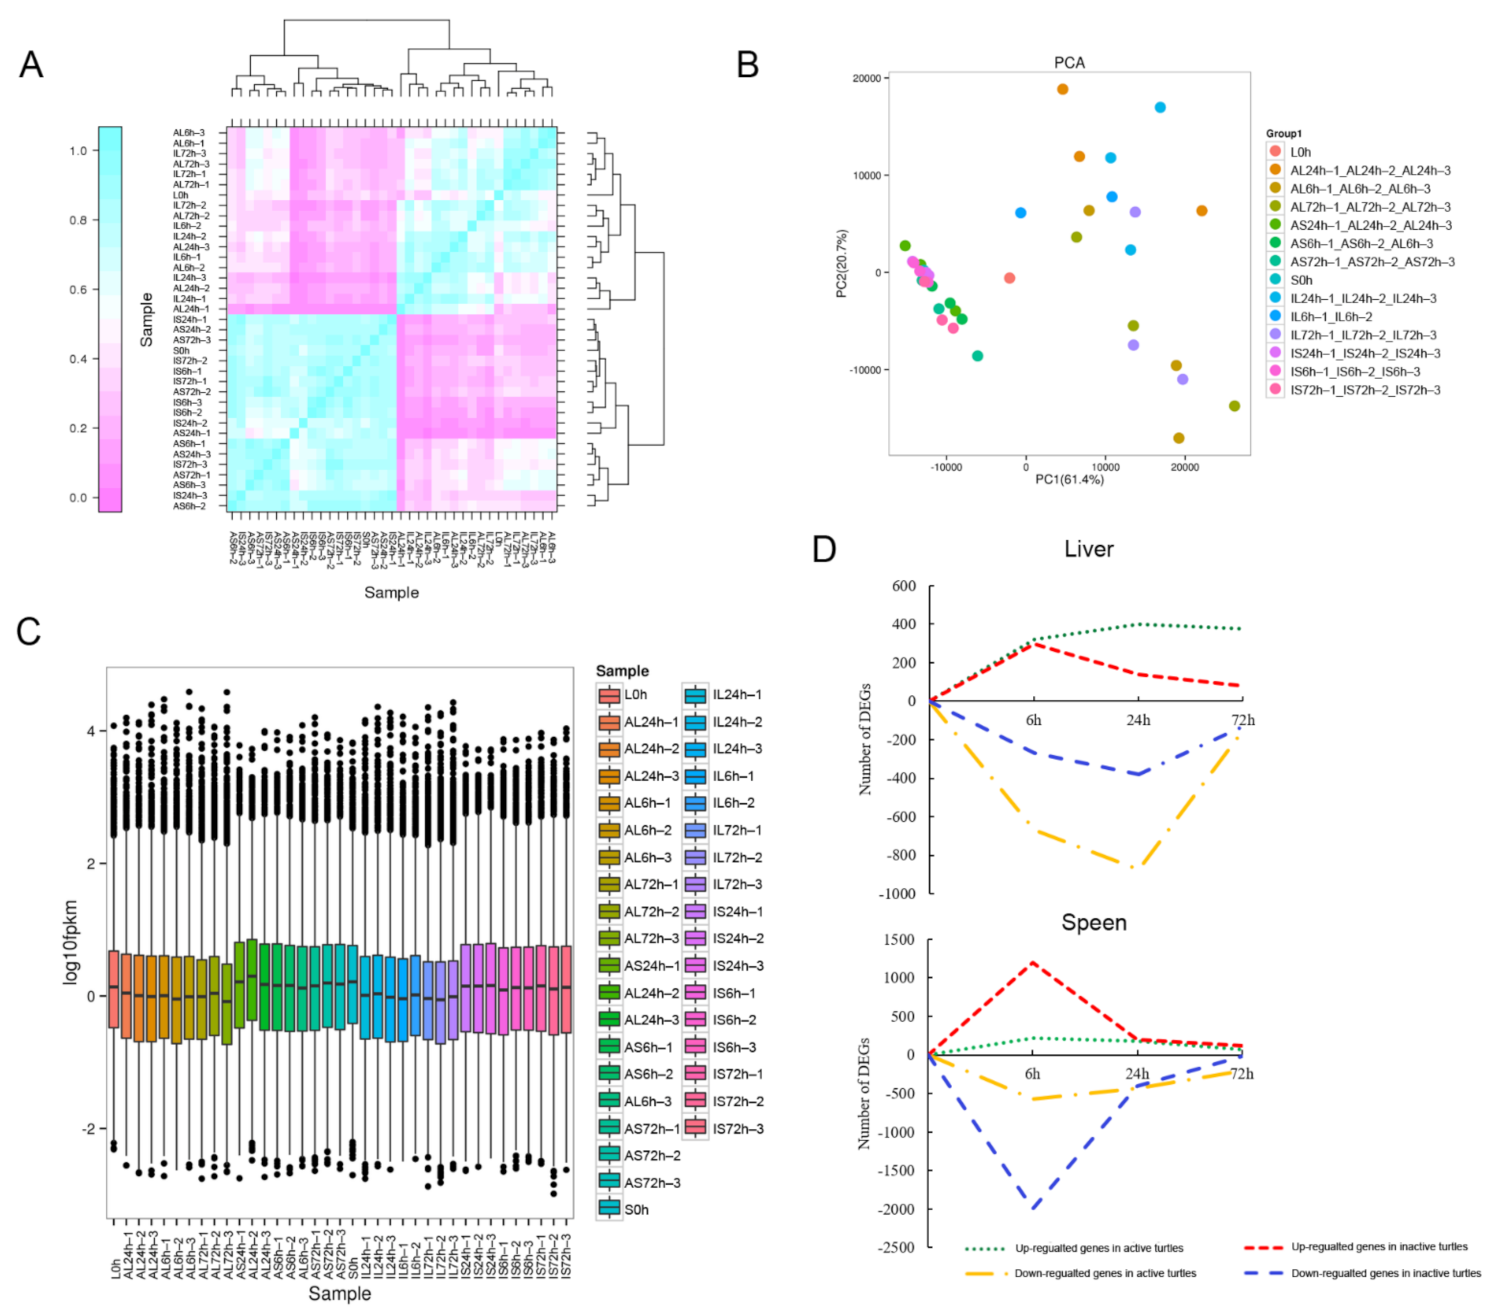
2.4. Identification of the Differentially Expressed Genes (DEGs)

The relative transcript abundances in tissues (liver and spleen) from active and inactive subgroup turtles at different time periods of A. hydrophila infection compared to the control turtles were, respectively, estimated by using StringTie software with expectation maximization method, based on fragments per kilobase of exon per million fragments mapped (FPKM) [31]. Differential expression analysis was performed by using the DESeq R package with default parameters [32]. Benjamini and Hochberg’s approach was used to control the false discovery rate (FDR) by resulting P-values adjustment [33]. Genes with an adjusted P-value (or q-value) < 0.05 found by DEGSeq were assigned as the differentially expressed.

2.5. KEGG Pathway Enrichment Analysis

Significantly enriched signal transduction pathways represented by DEGs were determined using KEGG pathway enrichment analysis, compared with the whole genome background [34]. The statistical enrichment of DEGs in KEGG pathways was tested using the software KOBAS, with a P-value < 0.05 [34]. The significantly enriched KEGG pathways are listed in Tables S2–S5.

2.6. Gene Expression Validation Using Quantitative PCR (qPCR)

To validate RNA-seq data and gene expression profiles, nine DEGs were randomly selected to perform qPCR. Specific primers were designed using Primer 5 based on the coding sequences of identified genes from the turtle genome; the sequences of primers are listed in Table S6. Primer specificity was ascertained using the following steps: PCR amplification, sequencing of PCR products, and BLAST analysis in the NCBI database.
The RNA samples used for qPCR amplifications were the same as those used to construct the RNA-Seq library mentioned above. The qPCR was performed using the LightCycler®480 Real-Time PCR System (Roche, Basel, Switzerland) with SYBR Green I Master. The reaction mixture (10 μL) comprised 2.5 μL cDNA, 0.5 μL (10 nM) forward primer and 0.5 μL (10 nM) reverse primer, 1.5 μL PCR grade water, and 5 μL Master Mix. Each reaction was performed in triplicate under the following conditions: 95 °C for 10 min, 40 cycles of 95 °C for 15 s, 55 °C for 15 s, and 72 °C for 30 s. The relative expression level of each gene was calculated according to the 2−△△Ct method [35] and normalized to the endogenous control genes of β-actin and GAPDH.

3. Results

3.1. Symptom Description of the Turtles Challenged with A. hydrophila

Ninety Chinese soft-shelled turtles were injected with A. hydrophila (1.39 × 10⁹ CFU/mL), and the pathological symptoms of turtles were observed. There were no obvious pathological symptoms on the body surface of turtles, and only six turtles showed behavior abnormality with slow-moving action at 6 hpi (post-injection of 6 h). At 24 hpi, the food intake and movement of turtles was overall reduced, and seven turtles died (accounting for about 8%), with the pathological symptom of abdominal congestion. At 72 hpi, 34 turtles (accounting for about 38%) died. The pathological symptoms on the body surface of diseased turtles were obvious, with white spots near the axillae, swelling, and congestion in chest and abdomen (Figure 1A,B). After anatomizing the diseased turtles, pathological symptoms of turtle viscera were easily observed (Figure 1C). The liver and spleen were swelling and congestive, with the tendency to decay, and the color of liver was yellow (Figure 1C). The intestines were filled with no food debris, and the color was white (Figure 1C). There were 13 turtles (accounting for about 14%) without any obvious pathological symptoms at 72 hpi (Figure 1D). During the whole experiment within 72 h, 10 turtles in the control group showed no obvious pathological symptoms and were aggressive and active in feeding and moving (data not shown).
According to pathological symptoms, the Chinese soft-shelled turtles challenged with A. hydrophila could be divided into two subgroups, including the active and inactive turtles. The liver and spleen were important immune organs in turtles, and both carried obviously pathological symptoms after A. hydrophila infection. Therefore, liver and spleen samples from active and inactive subgroup turtles were taken at 6, 24, and 72 hpi, respectively, and transcriptome sequencing was performed to reveal the differences of gene expression profiles between active and inactive turtles infected by A. hydrophila.
Pearson’s correlation coefficients were first used to test for biologically repeated correlations between samples (Figure 2A). The generated cluster dendrogram was used to observe the overall correlation of the transcriptomes from the AL group (liver in active turtles), the IL group (liver in inactive turtles), the AS group (spleen in active turtles), and the IS group (spleen in inactive turtles) at different time periods (6, 24, and 72 hpi) (Figure 2A). Three biological replicates of liver and spleen samples from each time period and the transcriptome data both exhibited good correlation (Figure 2A). The similarity test between the three biological replicates required the use of a principal component analysis (PCA) (Figure 2B). Using the first principal component (PC1) and second principal component (PC2), a dimensionality reduction analysis was used to analyze the similarity between each replicate (Figure 2B). Figure 2B showed that biological replicates of samples overall exhibited good similarity. The generated box plot presented the dispersion degree of the gene expression level in a single liver or spleen sample, and intuitively revealed the whole gene expression level difference among all samples (Figure 2C). The results showed that the gene expression level in the spleen was overall higher than that in the liver (Figure 2C).
Totals of 4092 and 5793 DEGs were obtained in the liver and spleen transcriptomes, respectively (Figure 2D). In the AL group, 321, 401, and 378 genes were significantly up-regulated, and 671, 874, and 151 genes were significantly down-regulated at 6, 24, and 72 hpi, respectively (Figure 2D). In the IL group, the numbers of significantly up-regulated genes were 298, 138, and 79; the numbers of significantly down-regulated genes were 268, 381, and 132 at 6, 24, and 72 hpi, respectively (Figure 2D). In the AS group, 219, 176, and 65 genes were significantly up-regulated, and 576, 437, and 206 genes were significantly down-regulated at 6, 24, and 72 hpi, respectively (Figure 2D). In the IS group, the numbers of significantly up-regulated genes were 1193, 203, and 117; the numbers of significantly down-regulated genes were 1996, 401, and 204 at 6, 24, and 72 hpi, respectively (Figure 2D). The results revealed that the number of DEGs in the spleen transcriptomes was more than that in the liver transcriptomes, and the molecular response peaked at 24 hpi in liver, while it peaked at 6 hpi in spleen (Figure 2D).

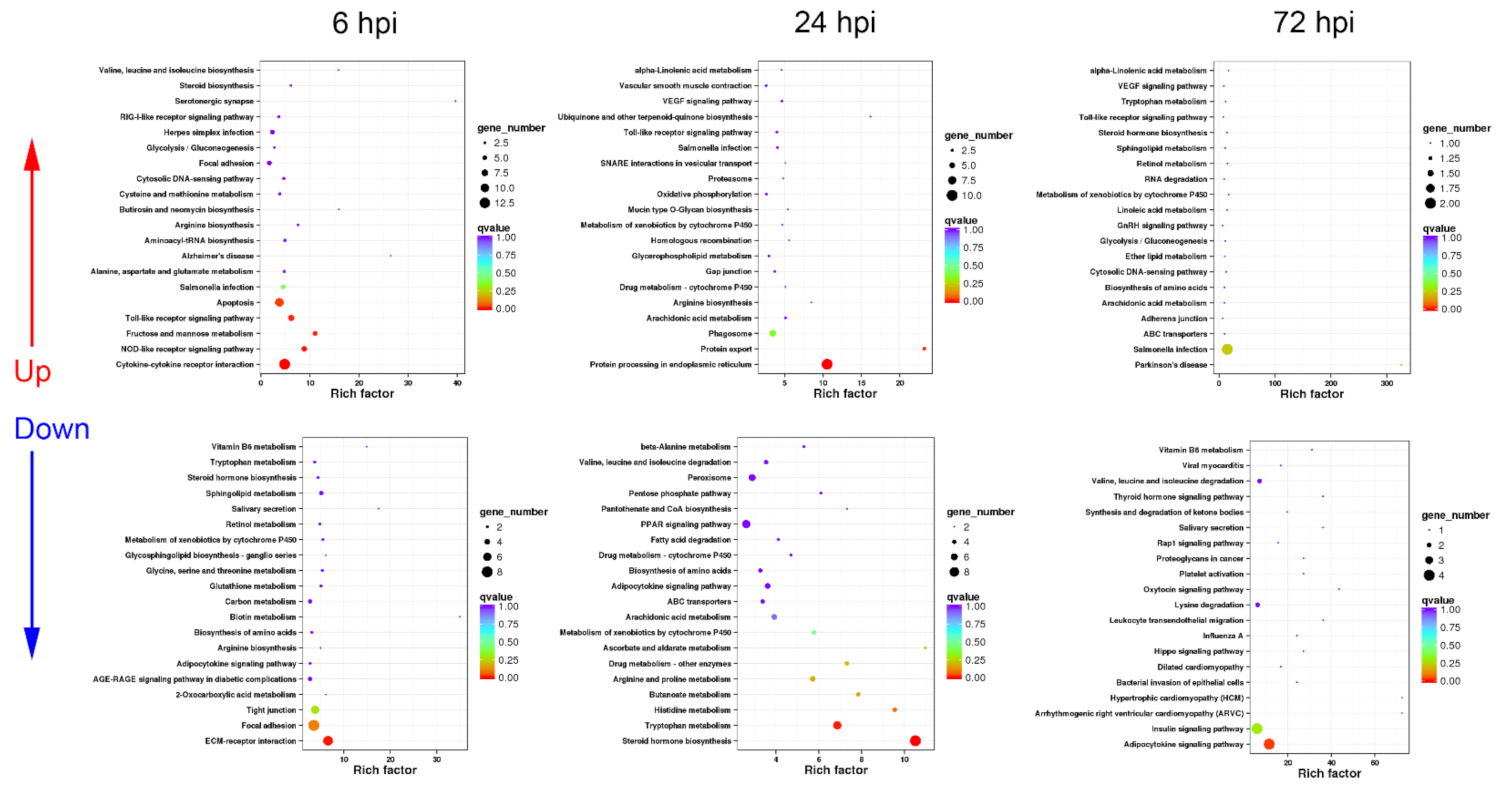
3.2. Functional Classification of DEGs in Turtle Liver Transcriptomes by KEGG

In order to investigate the different molecular response mechanisms against A. hydrophila infection in livers from active and inactive turtles, the functional classification of DEGs in AL and IL group transcriptomes at different time periods (6, 24, and 72 hpi) were analyzed by KEGG enrichment analysis, and the results are summarized as follows.

3.2.1. Sequential Changes of KEGG Enrichment in AL Group Turtles

In AL group, the up-regulated DEGs were mainly enriched in immune-related pathways including “cytokine–cytokine receptor interaction”, phagocytosis-associated processes including “phagosome”, “protein processing in endoplasmic reticulum”, and “protein export”, and pathogen infection-related pathways, while the down-regulated DEGs were intensively involved in 17 metabolism pathways and three cell adhesion-related processes at 6 hpi (Figure 3).
At 24 hpi, the majority of up-regulated DEGs were also annotated into immune-related pathways including “cytokine–cytokine receptor interaction”, “phagosome”, “protein processing in endoplasmic reticulum”, “proteasome”, and “protein export” (Figure 3). In addition, cytokine expression-mediating pathways including “toll-like receptor signaling pathway” and “NOD-like receptor signaling pathway” were significantly up-regulated (Figure 3). Similar to the response at 6 hpi, the down-regulated DEGs were mainly involved in a series of metabolism and cell adhesion pathways (Figure 3).
At 72 hpi, the up-regulated DEGs could be functionally classified into “toll-like receptor signaling pathway” and “RIG-I-like receptor signaling pathway”, pathogen infection-related pathways, “apoptosis”, and several metabolism-related pathways (Figure 3), while the down-regulated DEGs mainly participated in important metabolism-related pathways such as “insulin signaling pathway” and “adipocytokine signaling pathway” (Figure 3).

3.2.2. Sequential Changes of KEGG Enrichment in IL Group Turtles

Unlike the KEGG enrichment in AL group at 6 hpi, the up-regulated DEGs were mainly enriched in cytokine expression-mediating pathways including “toll-like receptor signaling pathway”, “NOD-like receptor signaling pathway”, and “RIG-I-like receptor signaling pathway” and “apoptosis”, besides “cytokine–cytokine receptor interaction”, pathogen infection-related pathways; while phagocytosis-associated processes were not listed in the top 20 up-regulated KEGG pathways in IL group at 6 hpi (Figure 4). The down-regulated DEGs were functionally annotated into cell adhesion-related pathways such as “ECM–receptor interaction” and “focal adhesion”, and energetic metabolism pathways (Figure 4).
At 24 hpi, the term of “cytokine–cytokine receptor interaction” was not listed in the top 20 up-regulated KEGG pathways, while the up-regulated DEGs were mainly involved in phagocytosis-associated processes such as “phagosome”, “protein processing in endoplasmic reticulum”, “proteasome”, and “protein export” (Figure 4). Additionally, “toll-like receptor signaling pathway” was significantly up-regulated (Figure 4). For the down-regulated DEGs, most of them were associated with hormone synthesis and amino acid metabolism (Figure 4).
At 72 hpi, immune-related terms including “toll-like receptor signaling pathway” and “cytosolic DNA-sensing pathway” were listed in the top 20 up-regulated KEGG pathways (Figure 4). The down-regulated DEGs were mainly enriched in energetic metabolism pathways such as “insulin signaling pathway” and “adipocytokine signaling pathway” (Figure 4).

3.2.3. Expression Difference Analysis of Cytokine, Phagocytosis, and Apoptosis-Related Genes between AL and IL Group Turtles

The KEGG pathways related to immune processes including cytokine–cytokine receptor interaction, phagocytosis, and apoptosis enriched in AL and IL group turtles challenged with A. hydrophila were quite different (Table 1, Table 2 and Table 3). Therefore, the fold changes of differentially expressed cytokine, phagocytosis, and apoptosis-related genes were further analyzed.
The results showed that the sharpest response of cytokines occurred at 24 hpi in the AL group, with the up-regulation of two cytokine and two cytokine receptor genes (Table 1). Among three cytokine expression-mediating pathways, only the response of toll-like receptor signaling pathway was relatively intense, with five up-regulated genes, also at 24 hpi in the AL group (Table 1), while in IL group, the sharpest response of cytokines occurred at 6 hpi, with the up-regulation of five cytokine and two cytokine receptor genes, and few cytokines were differentially expressed at 24 or 72 hpi (Table 1). Moreover, the up-regulation of differentially expressed cytokine genes at 6 hpi in IL group was overall higher than those in AL group at any time periods (Table 1). Nevertheless, IL10, an anti-inflammatory cytokine, was not differentially expressed at any time periods in the IL group, while it was up-regulated at all the time periods in the AL group (Table 1). In addition, the up-regulations of both NOD-like receptor signaling pathway and RIG-I-like receptor signaling pathway genes were intense in the IL group at 6 hpi (Table 1).
Notably, the sharpest response of phagocytosis-related gene occurred at 6 hpi in the AL group, with the up-regulation of 10 DEGs, and lasted until 24 hpi (Table 2). While in the IL group, at 24 hpi, the phagocytosis activity seemed to just start, with five up-regulated phagocytosis-related DEGs (Table 2). In addition, the most intense response of apoptosis-related genes occurred at 6 hpi in the IL group, with the up-regulation of six DEGs, while in the AL group, the apoptosis seemed to just start at 24 hpi with the up-regulation of five DEGs (Table 3).

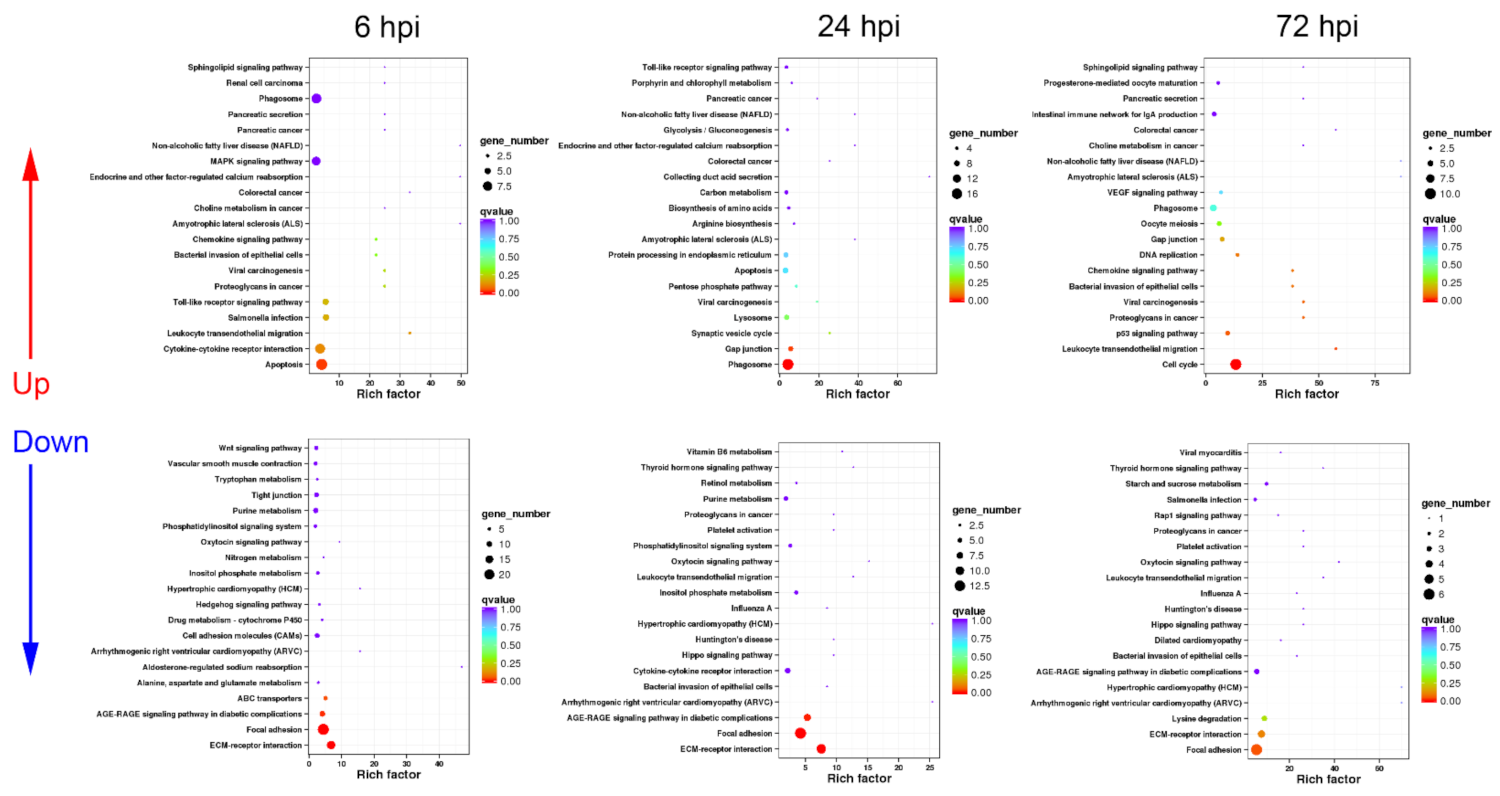
3.3. Functional Classification of DEGs in Turtle Spleen Transcriptomes by KEGG

The functional classification of DEGs in AS and IS transcriptomes at different time periods were also analyzed by KEGG enrichment to further reveal the different immune response mechanisms against A. hydrophila infection in spleens between active and inactive turtles. The results are summarized as follows.

3.3.1. Sequential Changes of KEGG Enrichment in AS Group Turtles

In the AS group, the up-regulated DEGs were functionally associated with immune processes including “cytokine–cytokine receptor interaction”, “chemokine signaling pathway”, “phagosome”, “apoptosis”, “leukocyte transendothelial migration”, “toll-like receptor signaling pathway”, “MAPK signaling pathway”, and pathogen infection-related pathways at 6 hpi (Figure 5), while the down-regulated DEGs were involved in cell adhesion and metabolism pathways at 6 hpi (Figure 5).
At 24 hpi, the up-regulated DEGs were mainly annotated into phagocytosis-related pathways such as “phagosome”, “protein processing in endoplasmic reticulum”, “synaptic vesicle cycle”, and “lysosome”. In addition, “toll-like receptor signaling pathway” was significantly up-regulated (Figure 5). Unlike the response at 6 hpi, the down-regulated DEGs at 24 hpi could be enriched in pathways including “cytokine–cytokine receptor interaction” and “bacterial invasion of epithelial cells”, besides a series of metabolism and cell adhesion pathways (Figure 5).
At 72 hpi, the up-regulated DEGs were functionally classified into apoptosis-related pathways, including “p53 signaling pathway” and “cell cycle”, as well as immune defense processes such as “phagosome”, “chemokine signaling pathway”, and “leukocyte transendothelial migration” (Figure 5), while the down-regulated DEGs mainly participated in important metabolism and cell adhesion pathways (Figure 5).

3.3.2. Sequential Changes of KEGG Enrichment in IS Group Turtles

The strongest immune response of spleen occurred at 6 hpi in the IS group, with 1193 up-regulated and 1996 down-regulated DEGs. Most up-regulated DEGs were enriched in immune-related pathways including “cytokine–cytokine receptor interaction”, “toll-like receptor signaling pathway”, “NOD-like receptor signaling pathway”, and “RIG-I-like receptor signaling pathway”, as well as apoptosis-associated processes (Figure 6), while the down-regulated DEGs were functionally annotated into cell adhesion-related pathways such as “ECM–receptor interaction” and “focal adhesion”, and metabolism pathways (Figure 6).
At 24 hpi, the up-regulated DEGs could be related to phagocytosis such as “phagosome” and “lysosome” (Figure 6). Additionally, “toll-like receptor signaling pathway” was listed in the top 20 up-regulated KEGG pathways (Figure 6). For the down-regulated DEGs, most of them were associated with cell adhesion, hormone synthesis, and amino acid metabolism (Figure 6).
Similar to the response at 72 hpi in the AS group, in the IS group, the up-regulated DEGs mainly participated in apoptosis-related pathways including “p53 signaling pathway” and “cell cycle”, as well as “phagosome” and “chemokine signaling pathway” at 72 hpi (Figure 6), while the down-regulated DEGs were enriched in a series of hormone synthesis, amino acid metabolism, and cell adhesion pathways (Figure 6).

3.3.3. Expression Difference Analysis of Cytokine, Phagocytosis, and Apoptosis-Related Genes between AS and IS Group Turtles

The fold changes of differentially expressed cytokine, phagocytosis, and apoptosis-related genes were also analyzed in AS and IS group turtles (Table 4, Table 5 and Table 6). The results showed that in both AS and IS groups, the sharpest response of cytokines occurred at 6 hpi, while the number of differentially expressed cytokine and cytokine receptor genes in the IS group were overwhelmingly more than that in the AL group (30 up-regulated genes in the IS group vs. seven up-regulated genes in the AS group) (Table 4). Noteworthily, the overall expression of cytokines dramatically decreased at 24 hpi and 72 hpi in the IS group, while gradually decreased in the AS group, and the anti-inflammatory cytokine IL10 was up-regulated at all the time periods in the AS group (Table 4). Consistent with the response of cytokines, the expression of toll-like receptor signaling pathway genes were also relatively intense at 6 hpi, but only with three up-regulated genes in the AS group (Table 4), while in the IS group at 6 hpi, the expressions of three cytokine expression-mediating pathway genes, including toll-like receptor signaling pathway, NOD-like receptor signaling pathway, and RIG-I-like receptor signaling pathway, were overall up-regulated, with 18 up-regulated genes (Table 4).
The intense response of phagocytosis started at 6 hpi in the AS group, with the up-regulation of seven DEGs, and lasted until 24 hpi (six up-regulated DEGs) (Table 5), while in the IS group at 6 hpi, the phagocytosis activity seemed to be inhibited, with 10 down-regulated DEGs, and just started at 24 hpi, with 11 up-regulated phagocytosis-related DEGs (Table 5). Nevertheless, in both the AS and IS groups, the sharpest response of apoptosis-related gene expression occurred at 6 hpi, while the number of up-regulated apoptosis-related genes in the IS group (18 DEGs) was significantly more than that in the AL group (four DEGs) (Table 6).

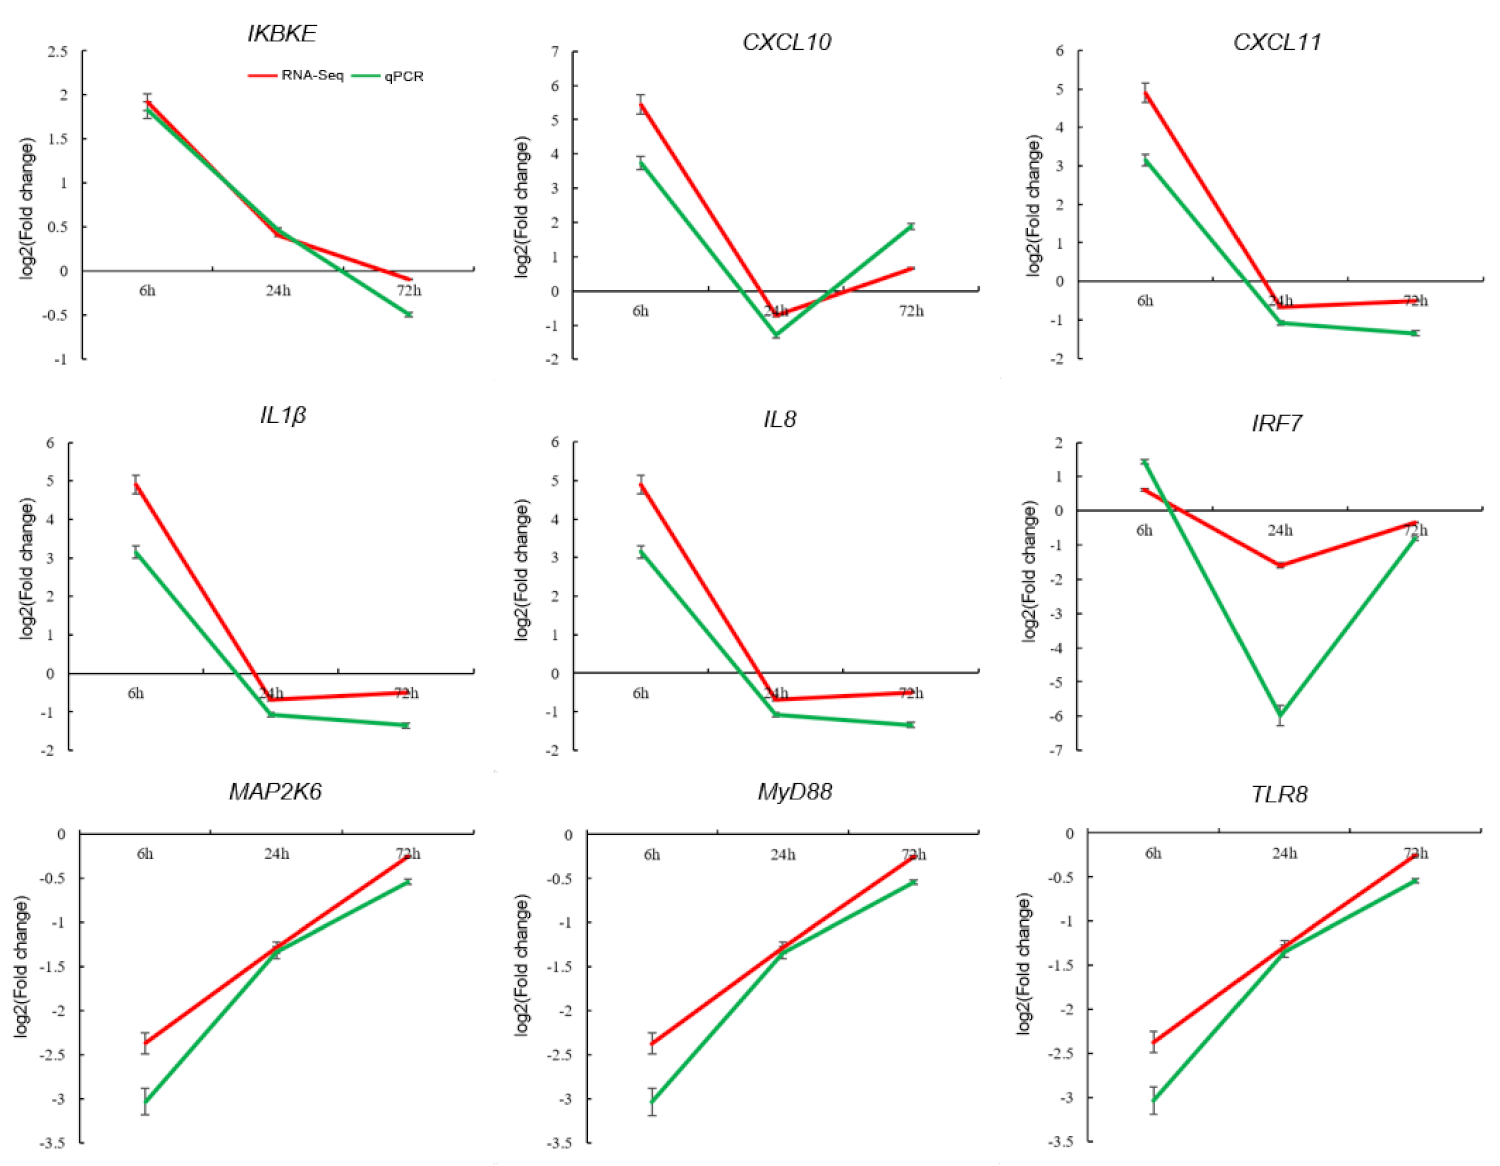
3.4. Validation of DEGs by qPCR

A total of nine DEGs were randomly selected to perform qPCR to validate RNA-Seq data and gene expression profiles (Figure 7). PCR products with expected sizes were successfully amplified with all the nine specific primer pairs, indicating their availabilities for DEG validation (data not shown). The different amplification efficiencies of the nine DEGs between the experimental and control groups were transformed by log2 (fold change) to compare with the results of RNA-Seq. The results showed that the expression patterns of these genes determined by qPCR were similar to those acquired through RNA-Seq (Figure 7), which confirmed the reliability of the RNA-Seq data. Therefore, the immune-related genes isolated in this study could be useful references for future studies on the molecular mechanisms of Chinese soft-shelled turtles during A. hydrophila infection.

4. Discussion

For the nutriment and medical values, Chinese soft-shelled turtle T. sinensis has been developed into the largest cultured turtle species in East Asia, especially in China and Japan. Serious infectious diseases caused by pathogens including bacteria and viruses is threatening the aquaculture of turtles [3]; in particular, the hemorrhagic sepsis caused by A. hydrophila, with more than 15 kinds of diseases, is the most common and troublesome in turtle disease cases [36,37]. Previous studies have reported in mammals and fish that abnormal immune responses to pathogenic infections, such as excessive activation of immune cells and dysfunction of immune responses, can lead the immune system to attack self-uninfected cells, causing systemic inflammation, tissue hemorrhagic sepsis, and even death [38,39]. However, the research on the immune response mechanisms is limited, and the molecular pathology of turtles infected by A. hydrophila remains unclear, which greatly hinders the strategy innovations for disease prevention and control in Chinese soft-shelled turtles.
The susceptible and resistant individuals in the natural population have offered excellent materials to study the molecular pathology or molecular basis of resistance for pathogenic diseases in many animal species [40,41]. In livestock and poultry animals, for example, comparative transcriptomes were analyzed to reveal the molecular mechanism differences in response to Mycoplasma hyopneumoniae infection in two pig breeds [42]. These two breeds share DEGs that are involved in immune relevant pathways, including cytokine–cytokine receptor interaction pathway, PI3K-Akt signaling pathway, and chemokine signaling pathway [42]. The study demonstrates that more chemokines and interleukins are specifically and significantly up-regulated, which can enhance the immune responses and reduce the susceptibility to M. hyopneumoniae infection in resistant pig breed [42]. When cytokine gene expressions are compared between chicken line 6.3 (Marek’s disease-resistant chicken) and line 7.2 (Marek’s disease-susceptible chicken) in a transcriptome analysis, among the identified 53 cytokines and 96 cytokine receptors, 15 cytokines and 29 cytokine receptors highly expressed in line 6.3 were detected [43]. In aquaculture fish species, critical cytokines including, IL8 and TNFα, are significantly up-regulated in resistant channel catfish (Ictalurus punctatus), while susceptible catfish show high expression levels of IL17 in response to Flavobacterium columnare infection [44]. The gene networks involved in the apoptotic process are also associated with disease resistance/susceptibility to Piscirickettsia salmonis in Atlantic salmon [29]. This evidence indicates that the expression of immune-relevant genes interrelates with disease resistance/susceptibility to pathogenic diseases in animal hosts. In the present study, two phenotypes of Chinese soft-shelled turtles were found after A. hydrophila infection. One group of turtles were active in feeding and moving, with no obvious pathological symptoms, which were considered as the resistant turtles, while the other group of turtles showed obviously pathological symptoms, with swelling and congestion in liver and spleen after A. hydrophila infection and the reduction of food intake and movement, which are regarded as susceptible turtles. Comparative liver and spleen transcriptomes from these two groups of turtles at different time periods (6, 24, and 72 hpi) were further analyzed to reveal the molecular basis of resistance/susceptibility for turtles infected by A. hydrophila. The results indicate that the expression of cytokine, apoptosis-, and phagocytosis-related genes in both liver and spleen of the inactive turtles is significantly distinct from those in the active turtles analyzed by KEGG pathway enrichment. Therefore, we infer that these gene expression differences may be related to the molecular pathology or resistant basis to A. hydrophila infection in Chinese soft-shelled turtles.
Cytokines are a class of low-molecular-weight-secreted proteins that can transduce signals between cells and exert immune regulation and effector functions [45]. They play important roles in the immune system by regulating the intensity and duration of immune responses [46]. During pathogen infection, cytokines produced by immune cells trigger an inflammatory response, which is essential for the early elimination of pathogens [47]. However, the lasting or excessive production and release of cytokines may initiate the “cytokine storm”, which often leads to various diseases, including hemorrhagic septicemia and even the failure of key organs or death for animal hosts [48]. It has been reported in many aquaculture fish species that abnormal expression of cytokines is linked to serious hemorrhagic septicemia. For example, hemorrhagic septicemia of mandarin fish (Siniperca chuatsi) is mainly caused by A. hydrophila infection [49]. Histopathological analysis reveals that inflammation, vacuolization, and extensive necrosis exist in the gill, liver, spleen, and head kidney of the diseased mandarin fish [49]. The mRNA expression levels of pro-inflammatory cytokines including TNFα, CCL3, and IL8 are sharply up-regulated in spleen and head kidney of mandarin fish post-A. hydrophila infection [49]. Coincidentally, Chinese perch infected with A. hydrophila also shows significantly high mRNA expression levels of pro-inflammatory cytokines, such as TNFα, and IL1β, compared to healthy fish [50]. In tambaqui (Colossoma macropomum), IL1β and complement component 4 are intensely up-regulated post-A. hydrophila infection [51]. With transcriptome analysis, the KEGG pathways associated with disease and immune responses, such as the cytokine–cytokine receptor interaction, complement and coagulation cascades, and inflammatory bowel disease, are also enriched in Leiocassis longirostris with A. hydrophila infection [52]. This evidence has suggested the involvement of pro-inflammatory cytokines in pathogenesis of hemorrhagic septicemia caused by A. hydrophila infection in fish. In the present study, the up-regulated number of cytokine and cytokine receptor genes are far more, and their up-regulations are more intense in inactive turtles than those in the active turtles. Especially in the spleen of inactive turtles, the significant up-regulations of 12 pro-inflammatory cytokines, including IL1β, IL6, IL8, CCL20, CXCL10, CXCL11, CXCL13, CXCL14, CX3CL1, TNFSF8, TNFSF15, TNFSF18, and 17 cytokine receptors, were identified at 6 hpi. The excessive expression of pro-inflammatory cytokines and their receptors have been confirmed to bring about uncontrolled inflammation, and lead to the pathological changes in tissues or key organs, and systemic hemorrhagic sepsis [48]. Since the high expression of pro-inflammatory cytokines, it is reasonable that the spleen and liver of inactive turtles exhibits the symptoms of hemorrhagic sepsis after A. hydrophila infection. In addition, it is worth noting that in both liver and spleen of the active turtles, IL10 is significantly up-regulated at all the tested time periods (6, 24, and 72 hpi). IL10 is well known as an important anti-inflammatory cytokine, which can prevent excessive tissue damage caused by bacterial and viral infections as well as pro-inflammatory responses [53]. Especially in the late phase of pathogen infection, IL10 serves the role in controlling the development of inflammatory diseases [54,55]. These above results collectively hint that the excessive expression of a large number of pro-inflammatory cytokines (“cytokine storm”) triggers an imbalanced immune response, which should partly explain the molecular pathology of hemorrhagic sepsis in the liver and spleen of inactive turtles, while the lasting up-regulation of IL10 may be critical for maintaining the immune homeostasis in the active turtles during A. hydrophila infection.
In fact, the expression of cytokines is delicately induced and regulated, where signal pathways mediated by PRRs such as TLRs, NLRs, and RLRs undertake the indispensable roles [56]. The innate immune cells utilize PRRs to recognize the invading microorganisms, and trigger downstream immune-related signal cascades [56]. Although the downstream signaling pathways mediated by TLRs, NLRs, and RLRs are different, they all induce the production of specific cytokines. For example, the activation of TLR signaling pathway usually induces the expression of pro-inflammatory cytokines including TNFs, interleukins such as IL1β, IL6, IL8, and IL12, chemokines including CCL3 and CCL5, and interferon genes [57]. It is well known that the activation of RLR signaling pathway initiates interferon production to resist virus, and it can also induce the expression of TNFs, IL8, IL12, and other pro-inflammatory cytokines depending on NF-κB phosphorylation [58], while the activation of NLR signaling pathway is only associated with the induction of pro-inflammatory cytokines such as TNFs, IL1β, IL6, IL8, IL12, CCL3, and CCL5 [59]. In the present study, we found that in both the active and inactive turtles, the TLR-, NLR-, and RLR-mediated signaling pathways exhibited different degrees of activation along with the up-regulation of cytokines after A. hydrophila challenge. The difference is that in liver and spleen of the active turtles, only the activation of the TLR signaling pathway is relatively intense when the cytokine expression is peaking at 24 hpi, while in liver and spleen of the inactive turtles, all the TLR, NLR, and RLR signaling pathways are significantly activated when the cytokine expression is peaking at 6 hpi. It has been reported in mammals and several fish species that immoderate activation of the PRRs-mediated signaling pathways causes excessive expression of pro-inflammatory cytokines, leading to the dysfunction of immune regulation and inflammatory disease [56,60]. Similarly, extensive activation of PRRs-mediated signaling pathways may be the key reason for the excessive expression of pro-inflammatory cytokines, which can explain the molecular pathology of hemorrhagic sepsis in inactive turtles after A. hydrophila infection.
Apoptosis is defined as programmed cell death, involved in many physiological processes including homeostasis maintenance, and developments of tissue and organ [61]. Conceptually, cell death appears to protect against most acute bacterial pathogens that infect hosts and, in many cases, even more successfully restricts nonpathogenic or opportunistic bacteria [62]. Therefore, apoptosis is considered as an intrinsic immune defense mechanism in response to microbial infections, and the apoptosis of infected cells is an effective way to eliminate pathogenic niches and prevent their further spreading [63]. It has been reported that bacterial infection sensed by PRRs induces NF-κB-dependent inflammatory cytokines, including those of the TNFs and ILs, which further promote inflammatory signaling through death receptors and induce apoptosis [64]. In Japanese flounder, cell apoptosis, along with the up-regulation of NLRP3, ASC, caspase-1, IL1β, and IL18, in the macrophages has been observed after Edwardsiella tarda infection [65]. In addition, the apoptosis of erythrocytes can be induced by A. hydrophila infection in grass carp, along with the up-regulation of CCL4, CCL11, CCL20, IL4, and IL12 [66]. These studies indicate that the inflammation caused by bacterial infection is often accompanied by cell apoptosis in hosts. In the present study, we found that in active turtles, only several apoptosis-related genes were significantly up-regulated at 6 hpi in both liver and spleen, and their expressions gradually decreased at 24 and 48 hpi, while in inactive turtles, the up-regulation of a large number of apoptosis-related genes, as well as inflammatory cytokines, including TNFs, ILs, and chemokines, were observed at 6 hpi, and the up-regulation of apoptosis-related genes can last to 72 hpi in both liver and spleen. These results confirm that the up-regulation of apoptosis-related genes in the inactive turtles is more intense and lasting than that in the active turtles. Since exuberant cell apoptosis often accompanies tissue damage and causes the pathological changes in parenchymal organs [67], excessive apoptosis-related gene expression may also be involved in the molecular pathology of hemorrhagic sepsis in the liver and spleen of turtles after A. hydrophila infection.
Phagocytosis constitutes an important immune response of immunocytes as the first line of defense to recognize and engulf foreign particles or self-apoptotic cells, followed by the digestion and clearance [68]. It is a primitive conserved innate immune defense mechanism for all metazoans, including vertebrates and invertebrates [69]. Macrophages, neutrophils, and dendritic cells are professional phagocytes that are able to phagocytose large foreign particles (with the diameter of >0.5 μm) such as bacteria [70]. Effective phagocytosis requires two components: particle internalization and phagosome maturation [71]. After the bacteria are recognized by the phagocytes, they undergo endocytosis to form the phagosome in the phagocytes [71]. The nascent or early phagosome has no killing activity, and they must transform into the mature phagosome to obtain the bactericidal properties [71]. The mature phagosome further fuses with the lysosome to form the phagolysosome where there are various bactericidal substances such as reactive oxygen species, and hydrolytic enzymes, including protease, polysaccharase, nuclease, and lipase, that can kill and digest the invading bacteria [71]. After digestion, most of the bacterial residues are discharged outside the host phagocytes, and part of the bacterial degradation products are presented onto the surface of antigen-presenting cells by MHC molecules, which promotes adaptive immune responses [72]. In the present study, we observed the expression differences of phagocytosis-related genes that are involved in the processes including internalization and formation of the phagosomes, early/mature phagosome, phagolysosome, activation of NADPH oxidase, and antigen presentation between the active and inactive turtles in response to A. hydrophila infection. The results indicate that in active turtles, most of the phagocytosis-related genes are significantly up-regulated at 6 hpi and the up-regulation could last until 24 and 72 hpi in both liver and spleen, while in the inactive turtles, only several phagocytosis-related genes are significantly up-regulated in the liver, and even the majority of phagocytosis-related genes are significantly down-regulated in the spleen at 6 hpi; up to 24 hpi, most of the phagocytosis-related genes are significantly up-regulated in the liver and spleen. At 72 hpi, only a small part of the phagocytosis-related genes is up-regulated. Overall, the activity of phagocytosis in the inactive turtles starts later than that in the active turtles. These results suggest that the lag of phagocytosis can lead to the inability to clear bacteria, which also may be one of the important reasons for the persistent inflammation caused by A. hydrophila proliferation in the inactive turtles.

5. Conclusions

In summary, the molecule immune responses of turtles infected by A. hydrophila was analyzed, for the first time, by comparative transcriptomes from two group of turtles with different susceptibility to A. hydrophila infection. The gene expression profiles indicate that the dysfunction of immune responses, including excessive activation of pro-inflammatory cytokines, PRRs-mediated signaling pathway, and apoptosis, and insufficient phagocytosis activity may contribute to the molecular pathology of hemorrhagic sepsis in liver and spleen of turtles during A. hydrophila infection (Figure 8). Although there was a lack of further functional verification for the suspected genes, the data of comparative transcriptomes in this study will provide useful information for future studies on the molecular immunopathogenesis after A. hydrophila infection or genetic improvements against hemorrhagic sepsis in Chinese soft-shelled turtles.

Supplementary Materials

The following are available online at https://0-www-mdpi-com.brum.beds.ac.uk/article/10.3390/biology10111218/s1. Supplementary Table S1: Details of RNA-Seq data. L, liver; S, spleen; AL group, liver in active turtles; IL group, liver in inactive turtles; AS group, spleen in active turtles; IS group, spleen in inactive turtles. One library was constructed for liver and spleen tissue from the control group, while three libraries were constructed for liver and spleen tissue from AL, IL, AS, and IS groups at 6, 24, and 72 hpi (hours post-injection), except that only two libraries from IL group at 6 hpi because one library was failed in quality. In total, 37 libraries were constructed and sequenced. Supplementary Table S2: The list of up-regulated KEGG pathways in livers from active and inactive turtles compared to that in control group. Supplementary Table S3: The list of down-regulated KEGG pathways in livers from active and inactive turtles compared to that in control group. Supplementary Table S4: The list of up-regulated KEGG pathways in spleens from active and inactive turtles compared to that in control group. Supplementary Table S5: The list of down-regulated KEGG pathways in spleens from active and inactive turtles compared to that in control group. Supplementary Table S6: The sequence information of primers for qPCR in this study.

Author Contributions

Conceptualization, C.Z., J.T. and Z.L.; methodology, J.T., X.L. and Z.L.; validation, J.T.; formal analysis, J.T., Y.H. and Z.L.; investigation, J.T. and Z.L.; data curation, Z.L.; writing—original draft preparation, J.T. and Z.L.; writing—review and editing, Z.L.; visualization, J.T. and Z.L.; supervision, C.Z.; funding acquisition, C.Z., Z.L., Y.H. and X.W. All authors have read and agreed to the published version of the manuscript.

Funding

The work is supported by grants from the Natural Science Foundation of Hunan Province (S2017JJQNJJ1393), Postdoctoral Research Foundation of China (2019M662783), Key projects of Hunan Provincial Education Department (No.19A222) and National Key Research and Development Project: Blue granary (2018YFD0900200).

Institutional Review Board Statement

Animal experiments in this study are approved by the Animal Care and Use Committee of Hunan Agricultural University (Approval Code: 201903297; Approval Date: 11 October 2019).

Informed Consent Statement

Not applicable.

Data Availability Statement

The fastq files containing the raw reads obtained from each Illumina library in this study could be obtained from the Sequence Read Archive (SRA) under BioProject PRJNA781380. All the data are also available from the corresponding author upon reasonable request.

Conflicts of Interest

The authors declare no conflict of interest. The funding sponsors had no role in the design of the study; in the collection, analyses, or interpretation of data; in the writing of the manuscript, and in the decision to publish the results.

Abbreviations

Akt, related to the A and C kinase; CCL, C-C motif chemokine; CFU, colony forming unit; CXCL, C-X-C motif chemokine; ECM, extracellular matrix; GAPDH, glyceraldehyde-3-phosphate dehydrogenase; IL, interleukin; KEGG, Kyoto Encyclopedia of Genes and Genomes; MHC, major histocompatibility complex; NADPH, nicotinamide adenine dinucleotide phosphate coenzyme II; NCBI, National Center for Biotechnology Information; NF-κB, nuclear factor kappa-B; NLR, nucleotide-binding domain-like receptor; NOD, nucleotide-binding domain; PCR, polymerase chain reaction; PI3K, phosphoinositide-3-kinase; PRR, pattern recognition receptor; RIG-I, retinoic acid-inducible gene I; RLR, retinoic acid-inducible gene I-like receptor; TLR, toll-like receptor; TNF, tumor necrosis factor; TNFSF, tumor necrosis factor ligand superfamily member. This list only addresses the abbreviations in contexts. The abbreviations in Table 1, Table 2, Table 3, Table 4, Table 5 and Table 6 have been explained separately.

References

  1. Jia, Y.; Yang, Z.; Hao, Y.; Gao, Y. Effects of animal-plant protein ratio in extruded and expanded diets on nitrogen and energy budgets of juvenile Chinese soft-shelled turtle (Pelodiscus sinensis Wiegmann). Aquac. Res. 2005, 36, 61–68. [Google Scholar] [CrossRef]
  2. Chen, J.; Zhu, N.; Kong, L.; Bei, Y.; Zheng, T.; Ding, X.; He, Z. First reported fatal Bacillus thuringiensis infections in Chinese soft-shelled turtles (Trionyx sinensis). Aquaculture 2014, 428–429, 16–20. [Google Scholar] [CrossRef]
  3. Chen, Z.-X.; Zheng, J.-C.; Jiang, Y.-L. A new iridovirus isolated from soft-shelled turtle. Virus Res. 1999, 63, 147–151. [Google Scholar] [CrossRef]
  4. Chung, T.; Yi, S.; Kim, B.; Kim, W.; Shin, G. Identification and antibiotic resistance profiling of bacterial isolates from septicaemic soft-shelled turtles (Pelodiscus sinensis). Vet. Med. 2017, 62, 169–177. [Google Scholar] [CrossRef] [Green Version]
  5. Chen, J.; Zhu, N.; Kong, L.; Bei, Y.; Zheng, T.; Ding, X.; He, Z. First case of soft shell disease in Chinese soft-shelled turtle (Trionyx sinens) associated with Aeromonas sobria—A. veronii complex. Aquaculture 2013, 406, 62–67. [Google Scholar] [CrossRef]
  6. Cahill, M.M. Virulence factors in motile Aeromonas species. J. Appl. Bacteriol. 1990, 69, 1–16. [Google Scholar] [CrossRef]
  7. Pasquale, V.; Baloda, S.B.; Dumontet, S.; Krovacek, K. An Outbreak of Aeromonas hydrophila Infection in Turtles (Pseudemis scripta). Appl. Environ. Microbiol. 1994, 60, 1678–1680. [Google Scholar] [CrossRef] [PubMed] [Green Version]
  8. Das, A.; Sahoo, P.; Mohanty, B.; Jena, J. Pathophysiology of experimental Aeromonas hydrophila infection in Puntius sarana: Early changes in blood and aspects of the innate immune-related gene expression in survivors. Veter. Immunol. Immunopathol. 2011, 142, 207–218. [Google Scholar] [CrossRef]
  9. Mares, C.A.; Ojeda, S.S.; Morris, E.G.; Li, Q.; Teale, J.M. Initial delay in the immune response to Francisella tularensis is followed by Hypercytokinemia Characteristic of severe sepsis and correlating with upregulation and release of damage-associated molecular patterns. Infect. Immun. 2008, 76, 3001–3010. [Google Scholar] [CrossRef] [Green Version]
  10. Coperchini, F.; Chiovato, L.; Rotondi, M. Interleukin-6, CXCL10 and infiltrating macrophages in COVID-19-related cytokine storm: Not one for all but all for one! Front. Immunol. 2021, 12, 668507. [Google Scholar] [CrossRef]
  11. Sattler, S. The role of the immune system beyond the fight against infection. Adv. Exp. Med. Biol. 2017, 1003, 3–14. [Google Scholar] [CrossRef]
  12. Schultz, M.; van der Poll, M.J.S.A.T. Modulation of innate immune responses in the treatment of sepsis and pneumonia. Curr. Drug Target. 2004, 3, 11–17. [Google Scholar] [CrossRef] [PubMed]
  13. Qiu, Y.; Tu, G.-W.; Ju, M.-J.; Yang, C.; Luo, Z. The immune system regulation in Sepsis: From innate to adaptive. Curr. Protein Pept. Sci. 2019, 20, 799–816. [Google Scholar] [CrossRef] [PubMed]
  14. Hotchkiss, R.S.; Monneret, G.; Payen, D. Sepsis-induced immunosuppression: From cellular dysfunctions to immunotherapy. Nat. Rev. Immunol. 2013, 13, 862–874. [Google Scholar] [CrossRef]
  15. de Castro, I.F.; Guzmán-Fulgencio, M.; García-Álvarez, M.; Resino, S. First evidence of a pro-inflammatory response to severe infection with influenza virus H1N1. Crit. Care 2010, 14, 115. [Google Scholar] [CrossRef] [PubMed] [Green Version]
  16. Yuan, S.; Jiang, S.-C.; Zhang, Z.-W.; Fu, Y.-F.; Hu, J.; Li, Z.-L. Quantification of cytokine storms during virus infections. Front. Immunol. 2021, 12, 659419. [Google Scholar] [CrossRef]
  17. Flajnik, M.F. A cold-blooded view of adaptive immunity. Nat. Rev. Immunol. 2018, 18, 438–453. [Google Scholar] [CrossRef]
  18. Liang, Q.; Li, W.; Guo, N.; Tong, C.; Zhou, Y.; Fang, W.; Li, X. Identification and functional analysis of Interleukin-1β in the Chinese soft-shelled turtle Pelodiscus sinensis. Genes 2016, 7, 18. [Google Scholar] [CrossRef] [Green Version]
  19. Zhang, Z.; Tian, M.; Song, R.; Xing, X.; Fan, Y.; Wang, L.; Niu, C.; Dalmo, R.A. A New IL6 Isoform in Chinese soft-shelled turtle (Pelodiscus sinesis) discovered: Its regulation during cold stress and infection. Biology 2020, 9, 111. [Google Scholar] [CrossRef]
  20. Zhou, X.; Feng, H.; Guo, Q.; Dai, H. Identification and characterization of the first reptilian CD9, and its expression analysis in response to bacterial infection. Dev. Comp. Immunol. 2010, 34, 150–157. [Google Scholar] [CrossRef]
  21. Liu, T.; Han, Y.; Chen, S.; Zhao, H. Genome-wide identification of Toll-like receptors in the Chinese soft-shelled turtle Pelodiscus sinensis and expression analysis responding to Aeromonas hydrophila infection. Fish. Shellfish. Immunol. 2019, 87, 478–489. [Google Scholar] [CrossRef]
  22. Zhou, X.; Guo, Q.; Dai, H. Molecular characterization and expression profiles in response to bacterial infection of Chinese soft-shelled turtle interleukin-8 (IL-8), the first reptilian chemokine gene. Dev. Comp. Immunol. 2009, 33, 838–847. [Google Scholar] [CrossRef]
  23. Zhang, Z.; Chen, B.; Yuan, L.; Niu, C. Acute cold stress improved the transcription of pro-inflammatory cytokines of Chinese soft-shelled turtle against Aeromonas hydrophila. Dev. Comp. Immunol. 2015, 49, 127–137. [Google Scholar] [CrossRef] [PubMed]
  24. Elbahnaswy, S.; Elshopakey, G.E. Differential gene expression and immune response of Nile tilapia (Oreochromis niloticus) challenged intraperitoneally with Photobacterium damselae and Aeromonas hydrophila demonstrating immunosuppression. Aquaculture 2020, 526, 735364. [Google Scholar] [CrossRef]
  25. Li, C.; Jiang, J.; Xie, J.; Yang, W.; Wang, Y. Transcriptome profiling and differential expression analysis of the immune-related genes during the acute phase of infection with Mycobacterium marinum in the goldfish (Carassius auratus L.). Aquaculture 2020, 533, 736198. [Google Scholar] [CrossRef]
  26. Zhu, C.; Pan, Z.; Chang, G.; Wu, N.; Wang, H.; Ding, H.; Qiang, X.; Zhang, L.; Qiang, J.; Zhang, J.; et al. Transcriptomic insights into immune responses to ulcerative syndrome in Pseudobagrus ussuriensis. Aquaculture 2021, 537, 736504. [Google Scholar] [CrossRef]
  27. Zhou, X.; Zhang, G.-R.; Ji, W.; Shi, Z.-C.; Ma, X.-F.; Luo, Z.-L.; Wei, K.-J. The dynamic immune response of yellow catfish (Pelteobagrus fulvidraco) infected with Edwardsiella ictaluri presenting the inflammation process. Front. Immunol. 2021, 12, 625928. [Google Scholar] [CrossRef] [PubMed]
  28. Eslamloo, K.; Caballero-Solares, A.; Inkpen, S.M.; Emam, M.; Kumar, S.; Bouniot, C.; Avendaño-Herrera, R.; Jakob, E.; Rise, M.L. Transcriptomic profiling of the adaptive and innate immune responses of atlantic salmon to Renibacterium salmoninarum infection. Front. Immunol. 2020, 11, 567838. [Google Scholar] [CrossRef] [PubMed]
  29. Moraleda, C.P.; Robledo, D.; Gutiérrez, A.P.; Del-Pozo, J.; Yáñez, J.M.; Houston, R.D. Investigating mechanisms underlying genetic resistance to Salmon Rickettsial Syndrome in Atlantic salmon using RNA sequencing. BMC Genom. 2021, 22, 156. [Google Scholar] [CrossRef]
  30. Kim, D.; Paggi, J.M.; Park, C.; Bennett, C.; Salzberg, S.L. Graph-based genome alignment and genotyping with HISAT2 and HISAT-genotype. Nat. Biotechnol. 2019, 37, 907–915. [Google Scholar] [CrossRef] [PubMed]
  31. Pertea, M.; Pertea, G.M.; Antonescu, C.M.; Chang, T.-C.; Mendell, J.T.; Salzberg, S.L. StringTie enables improved reconstruction of a transcriptome from RNA-seq reads. Nat. Biotechnol. 2015, 33, 290–295. [Google Scholar] [CrossRef] [PubMed] [Green Version]
  32. Wang, L.; Feng, Z.; Wang, X.; Wang, X.; Zhang, X. DEGseq: An R package for identifying differentially expressed genes from RNA-seq data. Bioinformatics 2010, 26, 136–138. [Google Scholar] [CrossRef]
  33. Camacho, C.; Coulouris, G.; Avagyan, V.; Ma, N.; Papadopoulos, J.; Bealer, K.; Madden, T.L. BLAST+: Architecture and applications. BMC Bioinform. 2009, 10, 421. [Google Scholar] [CrossRef] [PubMed] [Green Version]
  34. Mao, X.; Tao, C.; Olyarchuk, J.; Wei, L. Automated genome annotation and pathway identification using the KEGG Orthology (KO) as a controlled vocabulary. Bioinformatics 2005, 21, 3787–3793. [Google Scholar] [CrossRef]
  35. Rao, X.; Huang, X.; Zhou, Z.; Xin, L. An improvement of the 2(-delta delta CT) method for quantitative real-time polymerase chain reaction data analysis. Biostat. Bioinforma. Biomath. 2013, 3, 71–85. [Google Scholar] [CrossRef] [PubMed]
  36. Yang, Z.; Pan, H.; Sun, H. The immune response and protective efficacy of oral alginate microparticle Aeromonas sobria vaccine in soft-shelled turtles (Trionyx sinensis). Veter. Immunol. Immunopathol. 2007, 119, 299–302. [Google Scholar] [CrossRef]
  37. Musgrave, K.E.; Diehl, K.; Mans, C. Aeromonas Hydrophila Keratitis in Freshwater Turtles. J. Exot. Pet. Med. 2016, 25, 26–29. [Google Scholar] [CrossRef]
  38. Zhang, B.; Li, C.; Wang, X.; Liu, C.; Zhou, H.; Mai, K.; He, G. Administration of commensal Shewanella sp. MR-7 ameliorates lipopolysaccharide-induced intestine dysfunction in turbot (Scophthalmus maximus L.). Fish. Shellfish. Immunol. 2020, 102, 460–468. [Google Scholar] [CrossRef]
  39. Pradel, B.; Robert-Hebmann, V.; Espert, L. Regulation of Innate Immune Responses by Autophagy: A Goldmine for Viruses. Front. Immunol. 2020, 11, 578038. [Google Scholar] [CrossRef]
  40. Yang, M.; Wang, Q.; Wang, S.; Wang, Y.; Zeng, Q.; Qin, Q. Transcriptomics analysis reveals candidate genes and pathways for susceptibility or resistance to Singapore grouper iridovirus in orange-spotted grouper (Epinephelus coioides). Dev. Comp. Immunol. 2019, 90, 70–79. [Google Scholar] [CrossRef]
  41. Zhu, M.; Nan, Y.; Zhai, M.; Wang, M.; Shao, Y.; Blair, H.T.; Morris, S.T.; Kenyon, P.R.; Zhao, Z.; Zhang, H. Comparative profiling of the resistance of different genotypes of mannose-binding lectin to Mycoplasma pneumoniae infection in Chinese Merino sheep based on high-throughput sequencing technology. Veter. Immunol. Immunopathol. 2021, 233, 110183. [Google Scholar] [CrossRef] [PubMed]
  42. Ni, L.G.; Song, C.Y.; Wu, X.S.; Zhao, X.T.; Wang, X.Y.; Li, B.C.; Gan, Y. RNA-seq transcriptome profiling of porcine lung from two pig breeds in response to Mycoplasma hyopneumoniae infection. PeerJ 2019, 7, e7900. [Google Scholar] [CrossRef] [PubMed] [Green Version]
  43. Truong, A.D.; Hong, Y.H.; Lillehoj, H.S. High-throughput sequencing reveals differing immune responses in the intestinal mucosa of two inbred lines afflicted with necrotic enteritis. Veter. Immunol. Immunopathol. 2015, 166, 116–124. [Google Scholar] [CrossRef] [PubMed]
  44. Peatman, E.; Li, C.; Peterson, B.C.; Straus, D.L.; Farmer, B.D.; Beck, B.H. Basal polarization of the mucosal compartment in Flavobacterium columnare susceptible and resistant channel catfish (Ictalurus punctatus). Mol. Immunol. 2013, 56, 317–327. [Google Scholar] [CrossRef] [PubMed]
  45. Feghali, C.; Wright, T. Cytokines in acute and chronic inflammation. Front. Biosci. 1997, 2, d12–d26. [Google Scholar] [CrossRef] [Green Version]
  46. Shachar, I.; Karin, N. The dual roles of inflammatory cytokines and chemokines in the regulation of autoimmune diseases and their clinical implications. J. Leukoc. Biol. 2013, 93, 51–61. [Google Scholar] [CrossRef] [PubMed]
  47. Murtaugh, M.P.; Baarsch, M.J.; Zhou, Y.; Scamurra, R.W.; Lin, G. Inflammatory cytokines in animal health and disease. Veter. Immunol. Immunopathol. 1996, 54, 45–55. [Google Scholar] [CrossRef]
  48. D’Elia, R.V.; Harrison, K.; Oyston, P.C.; Lukaszewski, R.A.; Clark, G.C. Targeting the “Cytokine Storm” for therapeutic benefit. Clin. Vaccine Immunol. 2013, 20, 319–327. [Google Scholar] [CrossRef]
  49. Chen, N.; Jiang, J.; Gao, X.; Li, X.; Zhang, Y.; Liu, X.; Yang, H.; Bing, X.; Zhang, X. Histopathological analysis and the immune related gene expression profiles of mandarin fish (Siniperca chuatsi) infected with Aeromonas hydrophila. Fish. Shellfish. Immunol. 2018, 83, 410–415. [Google Scholar] [CrossRef]
  50. Liu, X.; Sun, W.; Zhang, Y.; Zhou, Y.; Xu, J.; Gao, X.; Zhang, S.; Zhang, X. Impact of Aeromonas hydrophila and infectious spleen and kidney necrosis virus infections on susceptibility and host immune response in Chinese perch (Siniperca chuatsi). Fish. Shellfish. Immunol. 2020, 105, 117–125. [Google Scholar] [CrossRef]
  51. Gallani, S.U.; Valladão, G.M.R.; Alves, L.D.O.; Kotzent, S.; Hashimoto, D.T.; Wiegertjes, G.; Kirsten, K.; Kreutz, L.C.; Pilarski, F. Patterns of the innate immune response in tambaqui Colossoma macropomum: Modulation of gene expression in haemorrhagic septicaemia caused by Aeromonas hydrophila. Microb. Pathog. 2020, 150, 104638. [Google Scholar] [CrossRef]
  52. Zhou, J.; Zhao, H.; Zhang, L.; Ye, X.; Wang, Z.; Li, Q.; Ke, H.; Zhao, G.; Du, J.; Yang, S.; et al. Effects of bacterial haemorrhagic septicemia on the immune response of Leiocassis longirostris by RNA-Seq and microRNA-Seq. Comp. Biochem. Physiol. Part. D Genom. Proteom. 2020, 34, 100659. [Google Scholar] [CrossRef]
  53. Couper, K.N.; Blount, D.G.; Riley, E.M. IL-10: The master regulator of immunity to infection. J. Immunol. 2008, 180, 5771–5777. [Google Scholar] [CrossRef] [PubMed]
  54. González, L.A.; Melo-González, F.; Sebastián, V.P.; Vallejos, O.P.; Noguera, L.P.; Suazo, I.D.; Schultz, B.M.; Manosalva, A.H.; Peñaloza, H.F.; Soto, J.A.; et al. Characterization of the anti-inflammatory capacity of IL-10-producing neutrophils in response to Streptococcus pneumoniae infection. Front. Immunol. 2021, 12, 578038. [Google Scholar] [CrossRef] [PubMed]
  55. Saraiva, M.; O’Garra, A. The regulation of IL-10 production by immune cells. Nat. Rev. Immunol. 2010, 10, 170–181. [Google Scholar] [CrossRef] [PubMed] [Green Version]
  56. Cao, X. Self-regulation and cross-regulation of pattern-recognition receptor signalling in health and disease. Nat. Rev. Immunol. 2016, 16, 35–50. [Google Scholar] [CrossRef]
  57. Fitzgerald, K.A.; Kagan, J.C. Toll-like receptors and the control of immunity. Cell 2020, 180, 1044–1066. [Google Scholar] [CrossRef]
  58. Stok, J.E.; Quiroz, M.E.V.; Van Der Veen, A.G. Self RNA Sensing by RIG-I–like Receptors in viral infection and sterile inflammation. J. Immunol. 2020, 205, 883–891. [Google Scholar] [CrossRef]
  59. Platnich, J.M.; Muruve, D.A. NOD-like receptors and inflammasomes: A review of their canonical and non-canonical signaling pathways. Arch. Biochem. Biophys. 2019, 670, 4–14. [Google Scholar] [CrossRef]
  60. Lu, Y.; Li, X.; Liu, S.; Zhang, Y.; Zhang, D. Toll-like receptors and inflammatory bowel disease. Front. Immunol. 2018, 9, 72. [Google Scholar] [CrossRef] [Green Version]
  61. Place, D.E.; Lee, S.; Kanneganti, T.-D. PANoptosis in microbial infection. Curr. Opin. Microbiol. 2021, 59, 42–49. [Google Scholar] [CrossRef]
  62. Jorgensen, I.; Rayamajhi, M.; Miao, E.A. Programmed cell death as a defence against infection. Nat. Rev. Immunol. 2017, 17, 151–164. [Google Scholar] [CrossRef] [PubMed]
  63. Lacey, C.; Miao, E. Programmed cell death in the evolutionary race against bacterial virulence factors. Cold Spring Harb. Perspect. Biol. 2019, 12, a036459. [Google Scholar] [CrossRef] [PubMed]
  64. Amarante-Mendes, G.P.; Adjemian, S.; Branco, L.M.; Zanetti, L.; Weinlich, R.; Bortoluci, K.R. Pattern recognition receptors and the host cell death molecular machinery. Front. Immunol. 2018, 9, 2379. [Google Scholar] [CrossRef] [PubMed] [Green Version]
  65. Wang, X.; Kong, X.; Liu, X.; Wang, X.; Wang, Z.; Liu, J.; Zhang, Q.; Yu, H. Edwardsiella tarda triggers the pyroptosis of the macrophage of Japanese flounder (Paralichthys olivaceus). Aquaculture 2020, 533, 736153. [Google Scholar] [CrossRef]
  66. Lu, Z.; Yang, M.; Zhang, K.; Zhan, F.; Li, F.; Shi, F.; Li, Y.; Zhao, L.; Li, J.; Lin, L.; et al. Aeromonas hydrophila infection activates death receptor apoptosis pathway in the red blood cells of grass carp (Ctenopharyngodon idellus). Aquaculture 2021, 532, 735956. [Google Scholar] [CrossRef]
  67. Wang, Z.; Gu, Z.; Hou, Q.; Chen, W.; Mu, D.; Zhang, Y.; Liu, Q.; Liu, Z.; Yang, D. Zebrafish GSDMEb cleavage-gated pyroptosis drives septic acute kidney injury in vivo. J. Immunol. 2020, 204, 1929–1942. [Google Scholar] [CrossRef]
  68. Greenberg, S.; Grinstein, S. Phagocytosis and innate immunity. Curr. Opin. Immunol. 2002, 14, 136–145. [Google Scholar] [CrossRef]
  69. Stuart, L.M.; Ezekowitz, R.A. Phagocytosis and comparative innate immunity: Learning on the fly. Nat. Rev. Immunol. 2008, 8, 131–141. [Google Scholar] [CrossRef]
  70. Browne, N.; Heelan, M.; Kavanagh, K. An analysis of the structural and functional similarities of insect hemocytes and mammalian phagocytes. Virulence 2013, 4, 597–603. [Google Scholar] [CrossRef] [Green Version]
  71. Flannagan, R.S.; Cosío, G.; Grinstein, S. Antimicrobial mechanisms of phagocytes and bacterial evasion strategies. Nat. Rev. Microbiol. 2009, 7, 355–366. [Google Scholar] [CrossRef] [PubMed]
  72. Underhill, D.M.; Goodridge, H.S. Information processing during phagocytosis. Nat. Rev. Immunol. 2012, 12, 492–502. [Google Scholar] [CrossRef] [PubMed] [Green Version]
Figure 1. Pathological symptoms of turtles infected by A. hydrophila. The pathological symptoms on the body surface including (A) white spots near the axillae; (B) abdominal congestion in inactive subgroup turtles. (C) The pathological symptoms of viscera including liver, spleen, and intestines after anatomy of inactive turtles. (D) The active subgroup turtles showed no obvious pathological symptoms and were aggressive and active in feeding and moving. Black arrows indicate the location of pathological symptoms.
Biology 10 01218 g001
Figure 2. Transcriptional relationship between samples and the overall gene expression profiles. (A) Heatmap of correlation value (R square) of 37 libraries from liver or spleen samples. (B) Principal component analysis based on all of the expressed genes, showing 14 distinct groups of samples. (C) The dispersion degree of the gene expression level in a single liver or spleen sample. (D) The significantly up-regulated and down-regulated DEGs identified in livers or spleens from active and inactive turtles at 6, 24, and 72 hpi compared to the control.
Biology 10 01218 g002
Figure 3. KEGG enrichment analysis in AL group turtles at different time periods. The top 20 KEGG pathways are presented here in the form of scatterplots to show the up-regulated and down-regulated DEGs enriched in livers from active subgroup turtles at 6, 12, and 72 hpi. The enrichment factor is the ratio between the DEG number and the number of all genes in a certain gene enrichment term. The sizes of the dots on these plots denote the number of DEGs, while colors correspond to the q value range.
Biology 10 01218 g003
Figure 4. KEGG enrichment analysis in IL group turtles at different time periods. The top 20 KEGG pathways are presented here in the form of scatterplots to show the up-regulated and down-regulated DEGs enriched in livers from inactive subgroup turtles at 6, 12, and 72 hpi. The enrichment factor is the ratio between the DEG number and the number of all genes in a certain gene enrichment term. The sizes of the dots on these plots denote the number of DEGs, while colors correspond to the q value range.
Biology 10 01218 g004
Figure 5. KEGG enrichment analysis in AS group turtles at different time periods. The top 20 KEGG pathways are presented here in the form of scatterplots to show the up-regulated and down-regulated DEGs enriched in spleens from active subgroup turtles at 6, 12, and 72 hpi. The enrichment factor is the ratio between the DEG number and the number of all genes in a certain gene enrichment term. The sizes of the dots on these plots denote the number of DEGs, while colors correspond to the q value range.
Biology 10 01218 g005
Figure 6. KEGG enrichment analysis in IS group turtles at different time periods. The top 20 KEGG pathways are presented here in the form of scatterplots to show the up-regulated and down-regulated DEGs enriched in spleens from inactive subgroup turtles at 6, 12, and 72 hpi. The enrichment factor is the ratio between the DEG number and the number of all genes in a certain gene enrichment term. The sizes of the dots on these plots denote the number of DEGs, while colors correspond to the q value range.
Biology 10 01218 g006
Figure 7. Validation of RNA-Seq results by qPCR. Nine DEGs are randomly selected, and the expressions of genes at different time periods are examined relative to the endogenous control genes (β-actin and GAPDH). The relative expression values are transformed into the log2 (fold change) form. The results are shown as the mean ± SEM of liver and spleen tissues derived from 3 individual turtles.
Biology 10 01218 g007
Figure 8. The suspected molecular immunopathogenesis of hemorrhagic sepsis caused by A. hydrophila infection in Chinese soft-shelled turtles.
Biology 10 01218 g008
Table 1. Fold changes of differentially expressed cytokine and cytokine receptor, and cytokine expression mediating pathway genes in the AL group and the IL group compared to the control.
Categories/
Gene Name
DescriptionLog2 (Fold Changes)
AL GroupIL Group
6 Hpi24 Hpi72 Hpi6 Hpi24 Hpi72 Hpi
Interleukins and interleukin receptors
IL1β interleukin 1 beta 2.18 4.82
IL8 interleukin 8 3.55
IL10 interleukin 10 6.08 4.41 2.31
IL1R1 interleukin 1 receptor type I 1.66
IL1R2 interleukin 1 receptor type II 5.88 3.16 7.06
IL5RA interleukin 5 receptor alpha −2.57 −2.40−3.01
IL18R1 interleukin 18 receptor 1 −5.30
Chemokines and chemokine receptors
CCL5 C-C motif chemokine 5 4.71
CCL20 C-C motif chemokine 20 9.347.63 12.18
CX3CL1 C-X3-C motif chemokine 1 −4.91 3.28
CCR5 C-C chemokine receptor type 5 3.02
TNF family members and TNF receptors
TNFSF10 tumor necrosis factor ligand superfamily member 10 −2.56−2.08
TNFSF15 tumor necrosis factor ligand superfamily member 15 −2.40
SF6B tumor necrosis factor receptor superfamily member 6B −2.57
SF12A tumor necrosis factor receptor superfamily member 12A 4.49 4.60
Toll-like receptor (TLR) signaling pathway
TLR2 toll-like receptor 2 4.562.80
TLR5 toll-like receptor 5 3.611.51 2.89
TRIF toll-like receptor adapter molecule 1 −3.15−2.87−1.99 −3.40−3.42
TAB1 TAK1-binding protein 1 1.77
PI3K phosphoinositide-3-kinase 2.48 2.96
MAP2K1 mitogen-activated protein kinase kinase 1 2.13
MAP2K6 mitogen-activated protein kinase kinase 6 −2.04-2.63 −2.59
AP-1 proto-oncogene protein c-fos 1.43
STAT1 signal transducer and activator of transcription 1 1.49
RIG-I-like receptor (RLR) signaling pathway
RIG-I retinoic acid inducible gene I 2.38
LGP2 laboratory of genetics and physiology 2 2.21
MDA5 melanoma differentiation-associated gene 5 2.43
TRAF3 TNF receptor-associated factor 3 5.073.54
IRF7 interferon regulatory factor 7 −1.83 2.86
DDX3X ATP-dependent RNA helicase DDX3X −1.86−1.69 −2.08−2.02
NOD-like receptor (NLR) signaling pathway
ASC apoptosis-associated speck-like protein containing a CARD 1.99
RIPK2 receptor-interacting serine/threonine-protein kinase 2 2.47
cIAP baculoviral IAP repeat-containing protein 2/3 2.50
TNFAIP3 tumor necrosis factor alpha-induced protein 3 1.563.75
Note: This table and the following tables only show the DEGs with the values of log2 (fold change) with FDR < 0.05.
Table 2. Fold changes of differentially expressed phagocytosis-related genes in the AL group and the IL group compared to the control.
Categories/
Gene Name
DescriptionLog2 (Fold Changes)
AL GroupIL Group
6 Hpi24 Hpi72 Hpi6 Hpi24 Hpi72 Hpi
Internalization and formation of the phagosomes
TLR2toll-like receptor 24.562.80
MRmannose receptor 1.871.07 −2.18
iC3bthe fragment of complement component 34.38 2.79
CollectinC-type lectin4.813.691.47−2.63
F-actin actin beta/gamma 1 5.57 5.31 4.39 5.095.684.64
Early phagosome
Rab5ras-related protein Rab-5B2.28
vATPase V-type H+-transporting ATPase 2.332.05 3.85−2.08
CALR calreticulin 4.05
Mature phagosome
TUBA tubulin alpha 2.26
TUBB tubulin beta 4.633.251.42 2.72
vATPase V-type H+-transporting ATPase 2.332.05 3.85−2.08
Phagolysosome
sec61protein transport protein SEC61 subunit beta2.723.26 2.95
vATPase V-type H+-transporting ATPase 2.332.05 3.85−2.08
Activation of NADPH oxidase
p40phox neutrophil cytosolic factor 4 3.50
p47phox neutrophil cytosolic factor 1 2.79 2.42
gp91 NADPH oxidase 1 1.59
Antigen presentation
MHC II MHC class II antigen −2.21
sec22 vesicle transport protein SEC22 4.21 3.54
Table 3. Fold changes of up-regulated apoptosis-related genes in the AL group and the IL group compared to the control.
Gene NameDescriptionLog2 (Fold Changes)
AL GroupIL Group
6 Hpi24 Hpi72 Hpi6 Hpi24 Hpi72 Hpi
p53tumor protein p531.94
IP3Rinositol 1,4,5-triphosphate receptor type 31.351.56 1.92
Perforinperforin 1 3.122.57
PI3Kphosphoinositide-3-kinase 2.48 2.96
MERK2mitogen-activated protein kinase kinase 2 2.13
PERKprotein kinase RNA (PKR)-like ER kinase 1.852.30
Cathepsin cathepsin B 5.114.27
NOXA phorbol-12-myristate-13-acetate-induced protein 1 1.62
AP1 proto-oncogene protein c-fos 1.43
GZMB granzyme B 3.87
IL3R cytokine receptor common subunit beta 3.43
A1 hematopoietic Bcl-2-related protein A1 4.59
Table 4. Fold changes of differentially expressed cytokine and cytokine receptor, and cytokine expression mediating pathway genes in the AS group and the IS group compared to the control.
Categories/
Gene Name
DescriptionLog2 (Fold Changes)
AS GroupIS Group
6 Hpi24 Hpi72 Hpi6 Hpi24 Hpi72 Hpi
Interleukins and interleukin receptors
IL1β interleukin 1 beta 2.46
IL6 interleukin 6 5.20
IL7 interleukin 7 −2.79
IL8 interleukin 8 3.27 2.43 2.41
IL10 interleukin 10 6.82 5.69 1.21 7.30
IL1R2 interleukin 1 receptor type II 4.13 3.81
IL1RAP interleukin 1 receptor accessory protein 2.24
IL3RB cytokine receptor common subunit beta 3.56
IL4R interleukin 4 receptor 1.18
IL5RA interleukin 5 receptor alpha −1.95−3.81 −2.85
IL5RB interleukin 5 receptor alpha 3.56
IL8RB interleukin 8 receptor 3.07 2.32
IL12RB1 interleukin 12 receptor beta-1 2.60
IL12RB2 interleukin 12 receptor beta-1 3.20
IL15RA interleukin 15 receptor alpha 3.68
IL21R interleukin 21 receptor 1.98
IL22RA2 interleukin 22 receptor alpha 2 5.21 4.774.39
Chemokines and chemokine receptors
CCL20 C-C motif chemokine 20 6.33 6.72 2.56
CXCL10 C-X-C motif chemokine 10 5.36
CXCL11 C-X-C motif chemokine 11 4.32
CXCL12 C-X-C motif chemokine 12 −2.00
CXCL13 C-X-C motif chemokine 13 3.47 2.41
CXCL14 C-X-C motif chemokine 14 1.81 2.07
CX3CL1 C-X3-C motif chemokine 1 −3.70 3.90
CCR5 C-C chemokine receptor type 5 1.26
CXCR4 C-X-C chemokine receptor type 4 −1.75
XCR1 XC chemokine receptor 1 −4.81
TNF family members and TNF receptors
TNFSF8 tumor necrosis factor ligand superfamily member 8 3.06
TNFSF10 tumor necrosis factor ligand superfamily member 10 −2.86 −4.23−3.17
TNFSF12 tumor necrosis factor ligand superfamily member 12 −1.99
TNFSF15 tumor necrosis factor ligand superfamily member 15 3.09
TNFSF18 tumor necrosis factor ligand superfamily member 18 4.56
EDA ectodysplasin-A −2.93
SF6B tumor necrosis factor receptor superfamily member 6B 7.29
SF9 tumor necrosis factor receptor superfamily member 9 3.26
SF12A tumor necrosis factor receptor superfamily member 12A 6.32 7.327.37
SF13B tumor necrosis factor receptor superfamily member 13B 2.33 3.08
SF19L tumor necrosis factor receptor superfamily member 19-like 5.98
FAS tumor necrosis factor receptor superfamily member 6 2.34
NGFR tumor necrosis factor receptor superfamily member 16 −3.24
EDAR ectodysplasin-A receptor −4.72
Toll-like receptor (TLR) signaling pathway
TLR4 toll-like receptor 4 2.301.71
TLR5 toll-like receptor 5 2.771.82 3.00
MyD88 myeloid differentiation factor 88 1.08
TRIF toll-like receptor adapter molecule 1 1.96
Rac Ras-related C3 botulinum toxin substrate 1 2.372.521.971.842.512.04
PI3K phosphoinositide-3-kinase −4.06
AKT RAC serine/threonine-protein kinase 1.26
MAP2K1 mitogen-activated protein kinase kinase 1 2.882.822.502.852.942.57
MAP2K6 mitogen-activated protein kinase kinase 6 −2.37
AP-1 proto-oncogene protein c-fos 1.60 1.33
STAT1 signal transducer and activator of transcription 1 2.03
IKBKE inhibitor of nuclear factor kappa-B kinase subunit epsilon 1.92
RIG-I-like receptor (RLR) signaling pathway
RIG-I retinoic acid inducible gene I 2.32
LGP2 laboratory of genetics and physiology 2 1.90
MDA5 melanoma differentiation-associated gene 5 1.54
TRAF2 TNF receptor-associated factor 2 2.19
MITA Mediator of IFN regulatory transcription factor 3 activation 1.29
NOD-like receptor (NLR) signaling pathway
NLRP12 NACHT, LRR and PYD domains-containing protein 12 −2.65 −2.05−3.11
ASC apoptosis-associated speck-like protein containing a CARD 2.27
RIPK2 receptor-interacting serine/threonine-protein kinase 2 1.46
CARD8 caspase recruitment domain-containing protein 8 1.49
Table 5. Fold changes of differentially expressed phagocytosis-related genes in the AS group and the IS group compared to the control.
Categories/
Gene Name
DescriptionLog2 (Fold Changes)
AS GroupIS Group
6 Hpi24 Hpi72 Hpi6 Hpi24 Hpi72 Hpi
Internalization and formation of the phagosome
TLR4toll-like receptor 4 2.301.71
MRmannose receptor−2.71−1.43 −3.02
CR1complement receptor 1 1.69 2.15
αvβ5integrin αvβ5 −2.45
iC3bthe fragment of complement component 3 −3.36
CollectinC-type lectin−4.00−1.66 −4.85
F-actin actin beta/gamma 1 3.60 −3.11−3.66−3.71−2.46
Early phagosome
Rab5ras-related protein Rab-5B2.47 1.84 1.82
vATPase V-type H+-transporting ATPase 2.21 −1.011.59
CALR calreticulin 2.10
Mature phagosome
TUBA tubulin alpha 1.141.581.63
TUBB tubulin beta 3.631.60 −1.212.282.34
vATPase V-type H+-transporting ATPase 2.21 −1.011.59
Dynein dynein heavy chain 2 −1.82
Phagolysosome
sec61protein transport protein SEC61 subunit beta 1.36
vATPase V-type H+-transporting ATPase 2.21 −1.011.59
NOS nitric-oxide synthase −3.07
TAP ATP-binding cassette subfamily B member 3 2.17
Activation of NADPH oxidase
gp91 NADPH oxidase 1 1.62 1.571.40
p40phox neutrophil cytosolic factor 4 1.27
p47phox neutrophil cytosolic factor 1 2.752.32 2.532.041.52
P67phox neutrophil cytosolic factor 2 1.40
Rac Ras-related C3 botulinum toxin substrate 1 2.372.521.971.842.512.04
Antigen presentation
MHC II MHC class II antigen 3.14−1.87 −2.54
Table 6. Fold changes of up-regulated apoptosis-related genes in the AS group and the IS group compared to the control.
Gene NameDescriptionLog2 (Fold Changes)
AS GroupIS Group
6 Hpi24 Hpi72 Hpi6 Hpi24 Hpi72 Hpi
p53tumor protein p53 1.66
IP3Rinositol 1,4,5-triphosphate receptor type 3 1.17
Perforinperforin 13.24 5.58
MERK2mitogen-activated protein kinase kinase 22.882.822.502.852.952.57
Cathepsin cathepsin B 6.19 3.24 1.572.81
AP1 proto-oncogene protein c-fos 1.60 1.33
GZMB granzyme B 1.22 1.57 5.59 5.34
IL-3R cytokine receptor common subunit beta 2.56
TRAF12 TNF receptor-associated factor 2 2.91 2.19
Fas tumor necrosis factor receptor superfamily member 6 2.34
TrkA neurotrophic tyrosine kinase receptor type 1 6.49
NIK mitogen-activated protein kinase kinase kinase 14 1.24
FLIP CASP8 and FADD-like apoptosis regulator 1.26
eiF2α translation initiation factor 2 subunit 1 1.25
Calpain calpain-1 1.49
ARTS septin 4 2.45
AIF apoptosis-inducing factor 1 1.40
Gadd45 growth arrest and DNA-damage-inducible protein 2.32
ASK1 mitogen-activated protein kinase kinase kinase 5 5.27
CytC cytochrome c 1.901.80
Publisher’s Note: MDPI stays neutral with regard to jurisdictional claims in published maps and institutional affiliations.

