Article

Evaluation of Genomic Prediction for Fusarium Head Blight Resistance with a Multi-Parental Population

1
Aquatic and Crop Resources Development, National Research Council of Canada, Saskatoon, SK S7N 0W9, Canada
2
Department of Plant Science, Agriculture Building, University of Manitoba, Winnipeg, MB R3T 2N2, Canada
3
Ottawa Research and Development Centre, Agriculture and Agri-Food Canada, Ottawa, ON K1A 0C6, Canada
4
Swift Current Research and Development Centre, Agriculture and Agri-Food Canada, Swift Current, SK S9H 3X2, Canada
5
Lethbridge Research and Development Centre, Agriculture and Agri-Food Canada, Lethbridge, AB T1J 4B1, Canada
6
Aquatic and Crop Resources Development, National Research Council of Canada, Ottawa, ON K1A 0R6, Canada
*
Authors to whom correspondence should be addressed.
Submission received: 30 June 2021 / Revised: 1 August 2021 / Accepted: 2 August 2021 / Published: 6 August 2021
(This article belongs to the Special Issue Crop Improvement Now and Beyond)

Abstract

:

Simple Summary

Genomic selection is a promising approach to select superior wheat lines with better resistance to Fusarium head blight. The accuracy of genomic selection is determined by many factors. In this study, we found a training population with large size, genomic selection models incorporating biological information, and multi-environment modelling led to considerably better predictabilities. A training population designed by the coefficient of determination (CDmean) could increase accuracy of prediction. Relatedness between training population (TP) and testing population is the key for accuracies of genomic selection across populations.

Abstract

Fusarium head blight (FHB) resistance is quantitatively inherited, controlled by multiple minor effect genes, and highly affected by the interaction of genotype and environment. This makes genomic selection (GS) that uses genome-wide molecular marker data to predict the genetic breeding value as a promising approach to select superior lines with better resistance. However, various factors can affect accuracies of GS and better understanding how these factors affect GS accuracies could ensure the success of applying GS to improve FHB resistance in wheat. In this study, we performed a comprehensive evaluation of factors that affect GS accuracies with a multi-parental population designed for FHB resistance. We found larger sample sizes could get better accuracies. Training population designed by CDmean based optimization algorithms significantly increased accuracies than random sampling approach, while mean of predictor error variance (PEVmean) had the poorest performance. Different genomic selection models performed similarly for accuracies. Including prior known large effect quantitative trait loci (QTL) as fixed effect into the GS model considerably improved the predictability. Multi-traits models had almost no effects, while the multi-environment model outperformed the single environment model for prediction across different environments. By comparing within and across family prediction, better accuracies were obtained with the training population more closely related to the testing population. However, achieving good accuracies for GS prediction across populations is still a challenging issue for GS application.

1. Introduction

Fusarium head blight (FHB), or scab, mainly caused by the fungus Fusarium graminearum Schwabe [telomorph: Gibberella zeae Schw. (Petch)], is becoming the most destructive fungal disease for wheat production in both Canada and USA [1]. Fusarium infected grains display shrunken shapes (Fusarium damaged kernels [FDK]) and appear white or pink in color (bleaching) [2]. This results in severe yield and quality losses for wheat crops [1,3]. In addition, grains infected by the F. graminearum pathogen also accumulate the mycotoxin deoxynivalenol (DON), which represents a severe food and feed safety concern [1]. Annual losses attributed to FHB in Canada are in the hundreds of millions of dollars [4]. While in the USA, during the 2015–2016 season, it was estimated that FHB caused an economic loss of US $4.2 billion [5].
Integration of agronomic practices and chemical fungicides with genetic resistance is the most effective means to manage FHB [6,7]. Due to its lower cost, higher efficacy, and environmental benefit, genetic resistance is favored [7]. The genetic architecture underlying FHB resistance is quantitative in nature, controlled by multiple minor genes. To date, more than 500 quantitative trait loci (QTL) for FHB resistance on all 21 wheat chromosomes have been identified [8,9,10]. In addition, the genetics of FHB resistance contains multiple components, which can mainly be defined as four types. These include: (1) resistance to initial infection (Type I, incidence (INC)); resistance to fungal spread across the wheat head (Type II, severity (SEV)); resistance to kernel infection (Type III, Fusarium damaged kernels (FDK)); (2) tolerance to infection, and (3) accumulation of deoxynivalenol (DON) toxin (Type IV) [2,11,12,13,14]. Previous studies indicated that the genetic architectures of these different components are either only partially shared, or independent [12,15,16,17]. In addition to physiological (active) resistance mechanisms, developmental related traits like flowering time, plant height, and spike morphological traits also affect FHB resistance levels through disease escape (passive) mechanisms [12,14,18,19,20,21,22,23,24,25,26]. For example, a negative association between plant height and FHB incidence and severity was observed in numerous studies [19,20,23,25]. Finally, genotype by environmental interactions (GEI) also significantly affect FHB resistance [2,21,26], thus a lower to moderate heritability has been observed for FHB resistance traits [27]. These represent challenges in selecting for FHB resistance in the field using visual selection.
The nature of FHB resistance traits also represents challenges in the application of the QTL approach, which relies on sufficient statistical power of the mapping populations to improve resistance. Genomics selection/prediction (GS) that can address these limitations, is therefore an ideal approach to improve FHB resistance [14,28,29,30,31]. The strength of GS for FHB resistance is that it uses genome-wide marker information to calculate genomic estimated breeding values (GEBV) and makes selection based on GEBVs instead of phenotypes [32,33]. In addition, GS can increase genetic gain and accelerate selection in the breeding program [32,33]. Recently, the advent of affordable high-throughput genotyping approaches, such as SNP arrays and genotyping-by-sequencing, has allowed GS to be a feasible practice for predicting complex traits in breeding programs.
The success of applying GS for complex traits is mainly determined by the prediction accuracy/precision (PA). A broad range of factors affect the PA of GS. As reviewed by Voss-Fels et al. [34] and Xu et al. [35], key factors may include, but are not limited to, trait heritability, marker density, population size and structure, relatedness between the TP and the testing population, and statistical models. In general, the PA was found to increase along with the increase of heritability for the target trait [36]. Depending on the property of the population, high density markers were required for the natural populations, while moderate density markers were needed for biparental populations [32,37,38]. Population size was also critical for the accuracy of the GS. Batternffield et al. [39] showed that when a population size increased from 250 to 4095 lines, PA for wheat quality traits increased gradually. A similar pattern was also observed in soybean when TP size reached 4000 lines [40]. However, diminishing returns were observed beyond N = 200 for FHB resistance traits in barley [28], N = 192 for wheat FHB resistance traits [30] and N = 150 in rice for flower time and plant height traits [41]. In general, the size of the TP required depends on the genetic relatedness between the TP and testing population. A smaller TP with a good PA can be achieved when the TP and testing population are closely related [42,43]. In addition, by applying optimization algorithms to design the TP, better accuracies can be achieved [41,44,45,46,47].
A broad range of statistical models can be implemented in GS to predict the complex traits, as reviewed by Xu et al. [35]. These models varied in assumptions with different parameters and showed varied accuracies on a trait-by-trait basis [48,49,50]. Models including ridge regression best linear unbiased prediction (RR-BLUP; equal to Genomic best linear unbiased prediction (GBLUP)) and Bayesian’s models [51] have been predominantly applied in GS. Recently, these models were further advanced from single environment models to multi-trait and multi-environment models by incorporating the modeling of GEI [52,53], allowing better predictability of GS across different environments. In addition, research findings with both simulated and empirical datasets have asserted that PA can be considerably improved by incorporating prior known large-effect QTL identified by association mapping or linkage mapping [54,55,56].
GS has been evaluated to predict FHB resistance traits in a number of previous reports [29,30,31,57,58]. However, only a limited number of factors contributing to accuracies of GS for FHB resistance traits were investigated in these studies. Thus, a better understanding of the precision of GS on FHB resistance is needed. In the present study, we aimed to identify and characterize factors that affect accuracies of GS for FHB resistance by analysis of a multi-parental population that we developed previously [17]. These factors include sample size, GS models, TP optimization, the incorporation of prior QTL, multi-trait and multi-environment models and within family and across family predictions.

2. Materials and Methods

2.1. Plant Materials

A multi-parental spring wheat (Triticum aestivum L.) population (double haploid population) derived from the cross of FL62R1 (as common parental line) with Stettler, Muchmore, and Emerson was developed as described previously [17]. FL62R1 is an Eastern Canadian spring wheat line with comparable resistance to Sumai 3, developed by Comeau et al. [59] with a systemic breeding approach. Stettler and Muchmore are two semi-dwarf, high-yielding Canada Western Red Spring (CWRS) wheat cultivars [60,61] and Emerson is Canada Western Red Winter (CWRW) variety that is the first Canadian wheat to register as an R rating for FHB resistance [62]. The Stettler population (FS) contained 161 lines and the Muchmore (FM) population consisted of 201 DH lines. The Emerson (FE) population has 218 spring type DH lines.

2.2. Disease Inoculation and Phenotyping

The multi-parent population was evaluated for FHB resistance in disease nurseries at Carman, Manitoba (MB) and Ottawa, Ontario (ON) in 2015 and 2016 with three biological replications and a random complete block design (RCBD) in single meter rows. Disease trait evaluation and phenotyping were described in detail by Zhang et al. [17]. The evaluated FHB and related traits included INC, SEV, FDK, and DON levels. Days to anthesis (DA) and plant height (HT) were also recorded, excluding in 2015 at Carman, MB, where no HT data was available.

2.3. Genotyping

The multi-parental population was genotyped with the Illumina iSelect 90K SNP array [63] and raw data were processed and cleaned as described by Wang et al. [63] using the diploid version of GenomeStudio (Illumina, San Diego, CA, USA). High quality SNP markers from GenomeStudio were further cleaned with the R/QTL package and redundant markers were removed. Finally, a high-quality marker dataset with 4205 informative SNP markers was generated for the GS analysis.

2.4. Evaluation of GS

2.4.1. Prediction Models

Seven genomics selection (GS) models, including BayesA, BayesB, BayesC, and Bayesian least absolute shrinkage and selection operator (BLASSO), Bayesian Ridge Regression (BRR), reproducing kernel Hilbert space (RKHS) and RR-BLUP were evaluated by R packages BGLR or rrBLUP [52,64]. Marker effects were estimated by Y = Xβ + Zμ + ε, where Y is the vector of phenotypes, β is the vector of fixed effects, μ is the vector of random marker effect, X and Z are design matrices. ε is the vector of residual error, which assumed a normal distribution as var(ε) ~N (0, Iδ2ε). I is defined as the identity matrix and δ2ε is the residual variance. When QTL were incorporated as fixed effects, the peak markers identified from Zhang et al. [17] were passed to X vector, otherwise, vector of 1 was used.

2.4.2. Optimization TP

Two optimization algorithms, mean of the coefficient of determination (CDmean) and mean of predictor error variance (PEVmean) proposed by Rincent et al. [46] were implemented in R the package TrainSel [65] to design the training population. A randomly sampled training population was also applied and compared with these optimized training populations generated by CDmean and PEVmean. Training populations were set with sizes 50 and 100 lines.

2.4.3. Bayesian Multi-Trait Multi-Environment (BMTME)

Multi-trait and multi-environment prediction were performed with Bayesian Multi-Trait Multi-Environment (BMTME) models, proposed by Montesinos-López et al. [66] which was implemented in the R package BMTME [66]. Briefly, datasets were fitted in the model: Y = XEB + Z1b1 + Z2b2 + e, where Y is defined as the phenotypic response with a n × L matrix, n represents observations of a trait and L is the number of traits. XE is a design matrix for the environmental effects with an n × I order, B is defined as beta coefficients with an I × L matrix. Z1 is the design matrix of genotypes with n × J order, and Z2 is the design matrix of genotype x environment interactions with an order of n × JI. b1 is the matrix for genotypic random effects with an order of J × L, followed a distribution as b1 ~ M N (0, G, Σt), where M N represents matrix normal distribution with a mean vector 0 and within and between variance-covariance matrices G and Σt. G is calculated according to Van Raden [67] and assumed known. Σt is a L × L matrix for unknown variance -covariance of traits and b2 stands for random effects of genotype x environment interactions with a matrix of JI × L order with an assumed distribution as b2 ~ M N (0, E   G , Σt). e is the matrix for random residual errors with a n × L dimension, distributed as M N (0, In, Re).

2.4.4. Cross Validations of the Prediction Accuracy (PA)

Prediction accuracies of TP sizes and TP optimizations were obtained by 100 iterations from these defined TP with the genomic selection model rrBLUP [64]. For all other tests, predictions accuracies were estimated from the 5-fold cross validation scheme. With this scheme, lines were randomly divided into 5 subsets and four of the five subsets were combined as the TP, and the remaining fifth fold was treated as the validation set. This scheme was applied to each fifth fold of these five subsets and this process was repeated 10 times. Prediction accuracy was calculated as Pearson’s correlation between the GEBVs obtained from GS models and the observed phenotypic data.

3. Results

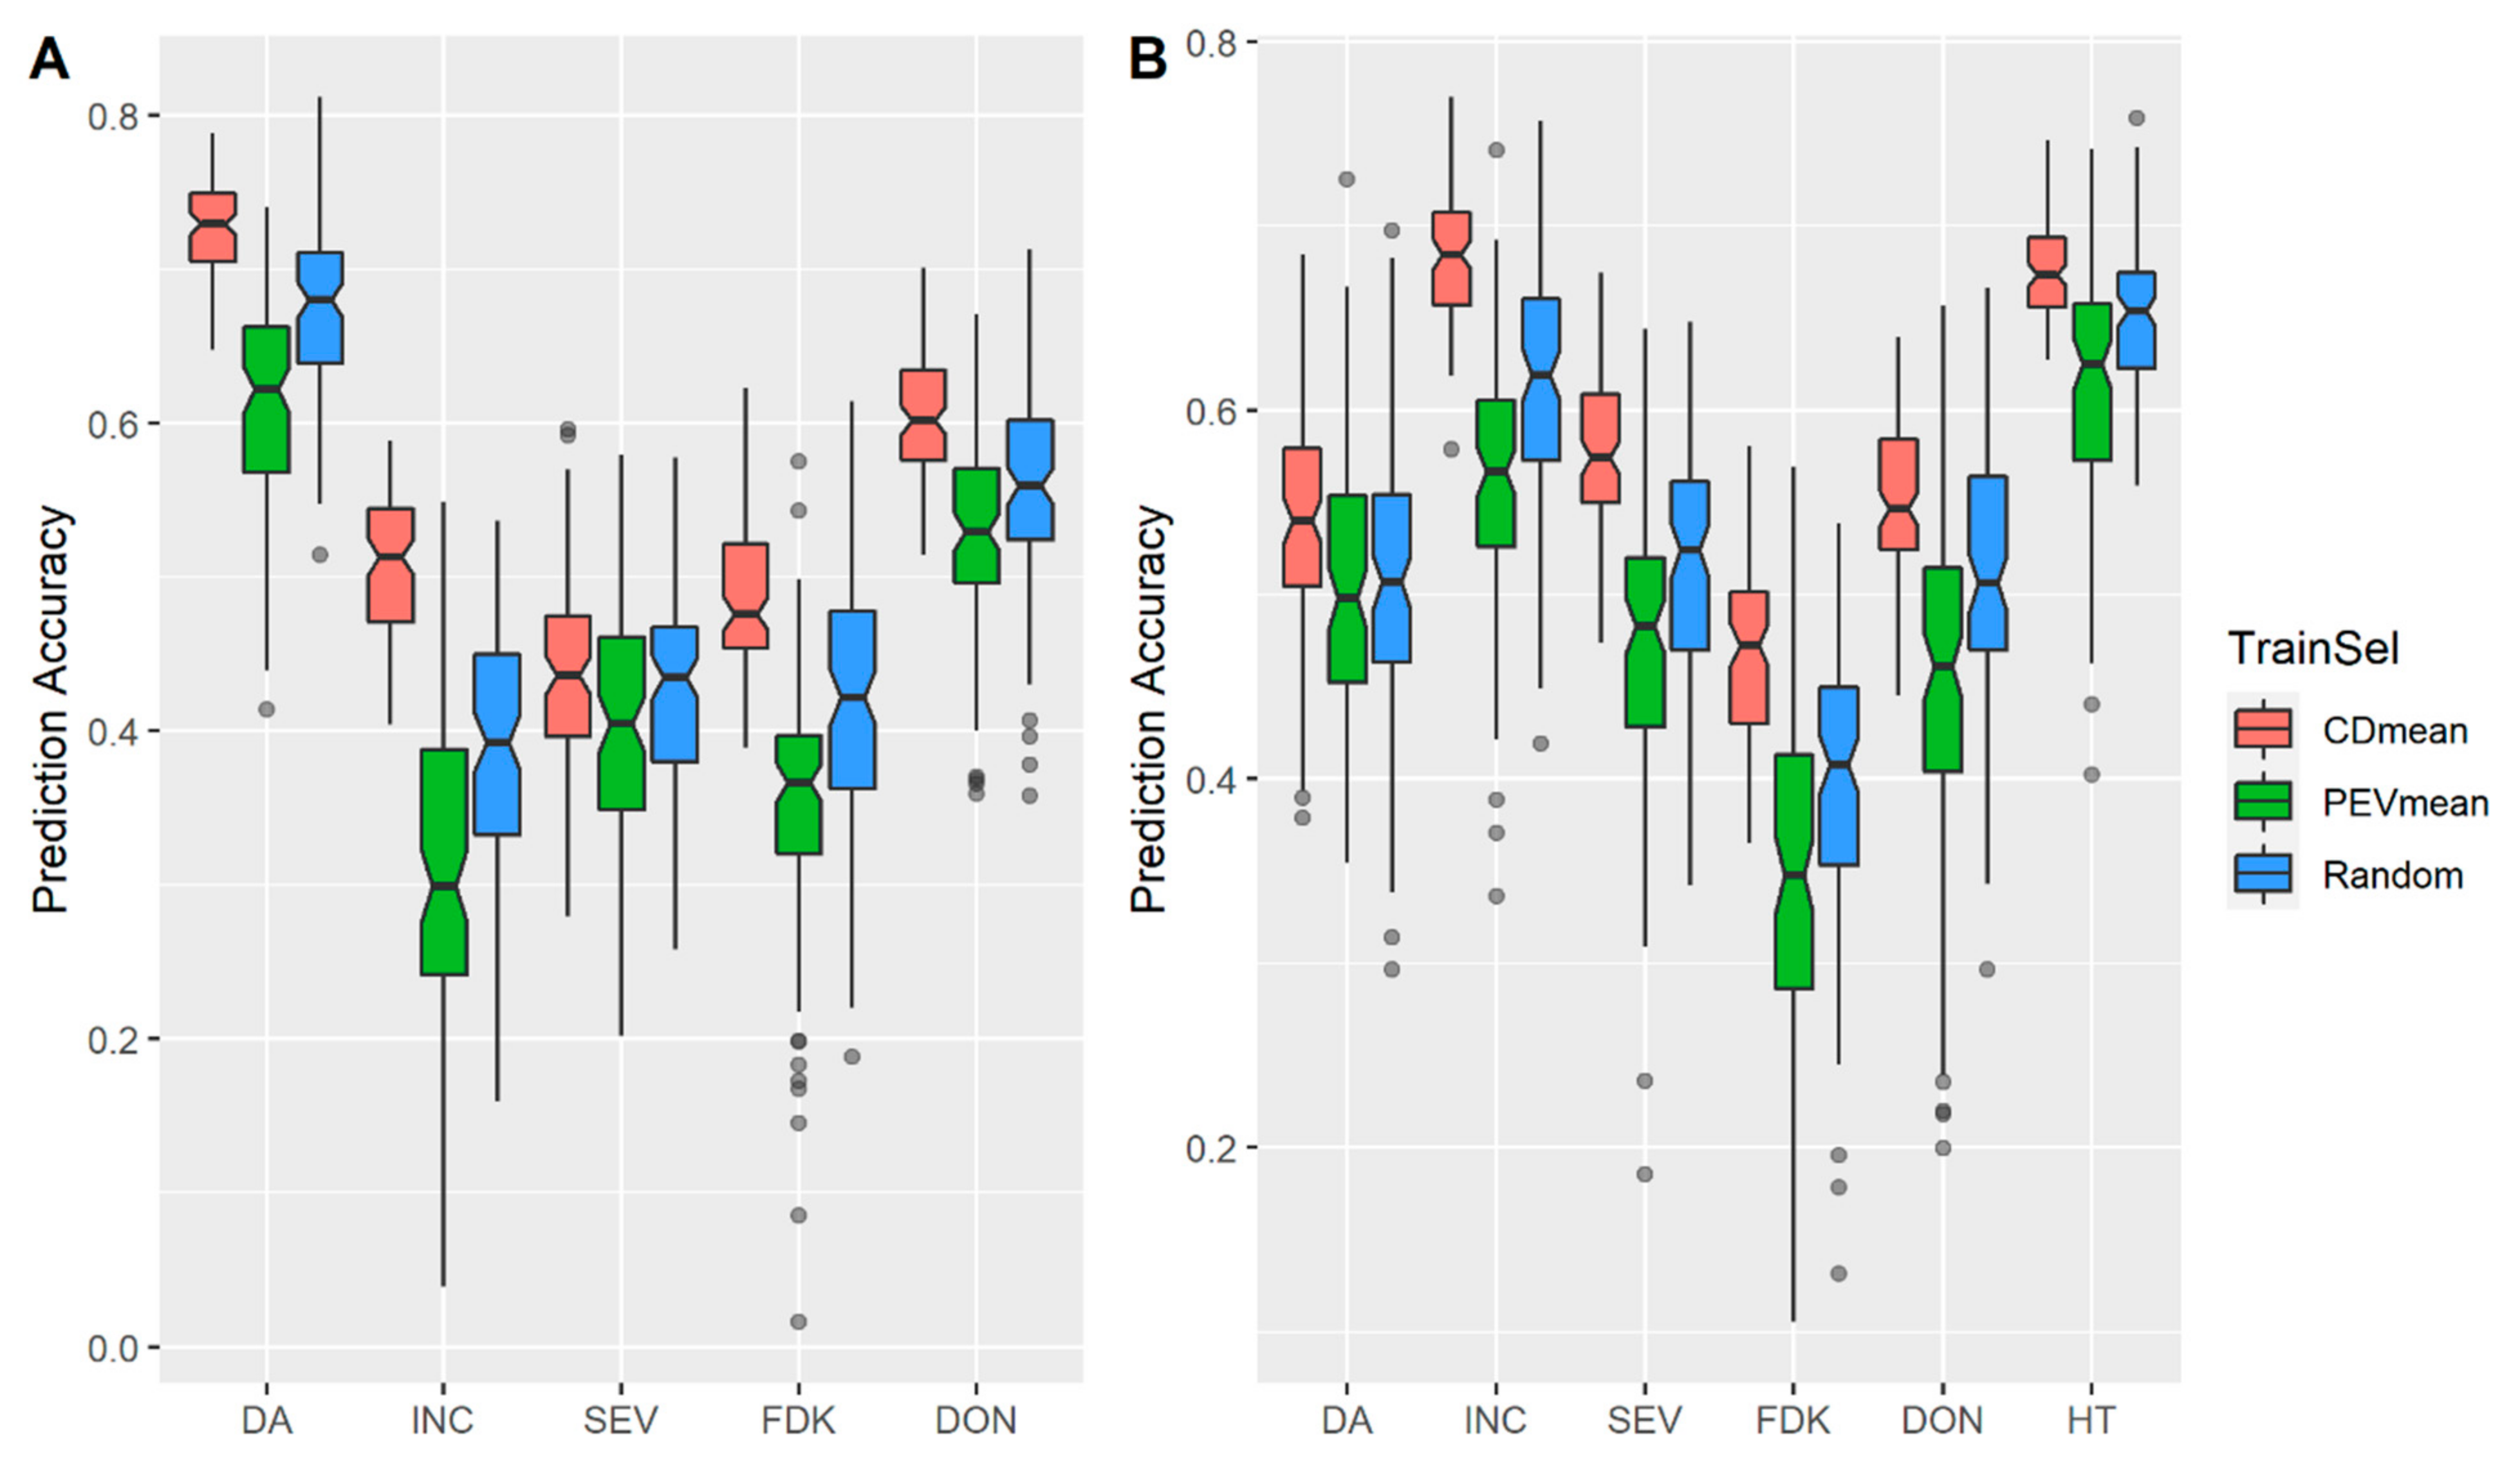
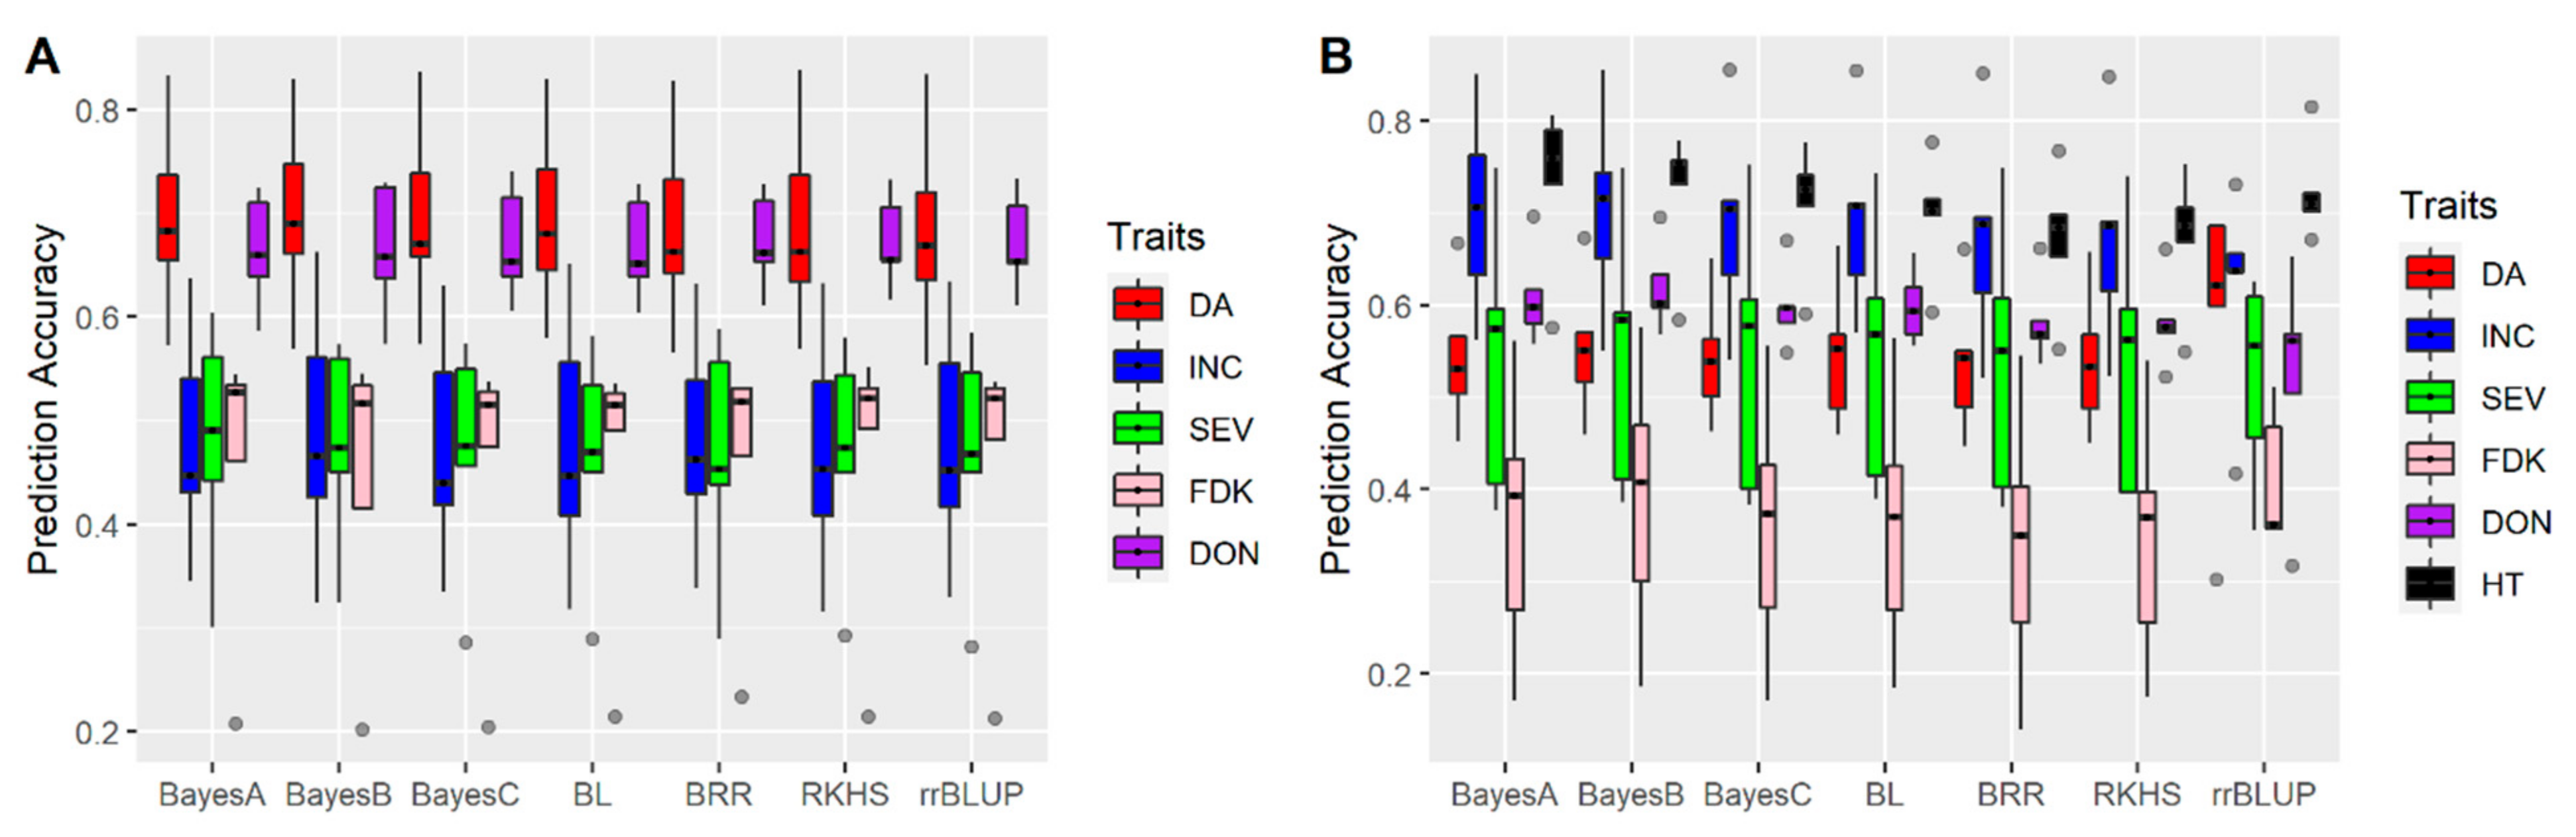
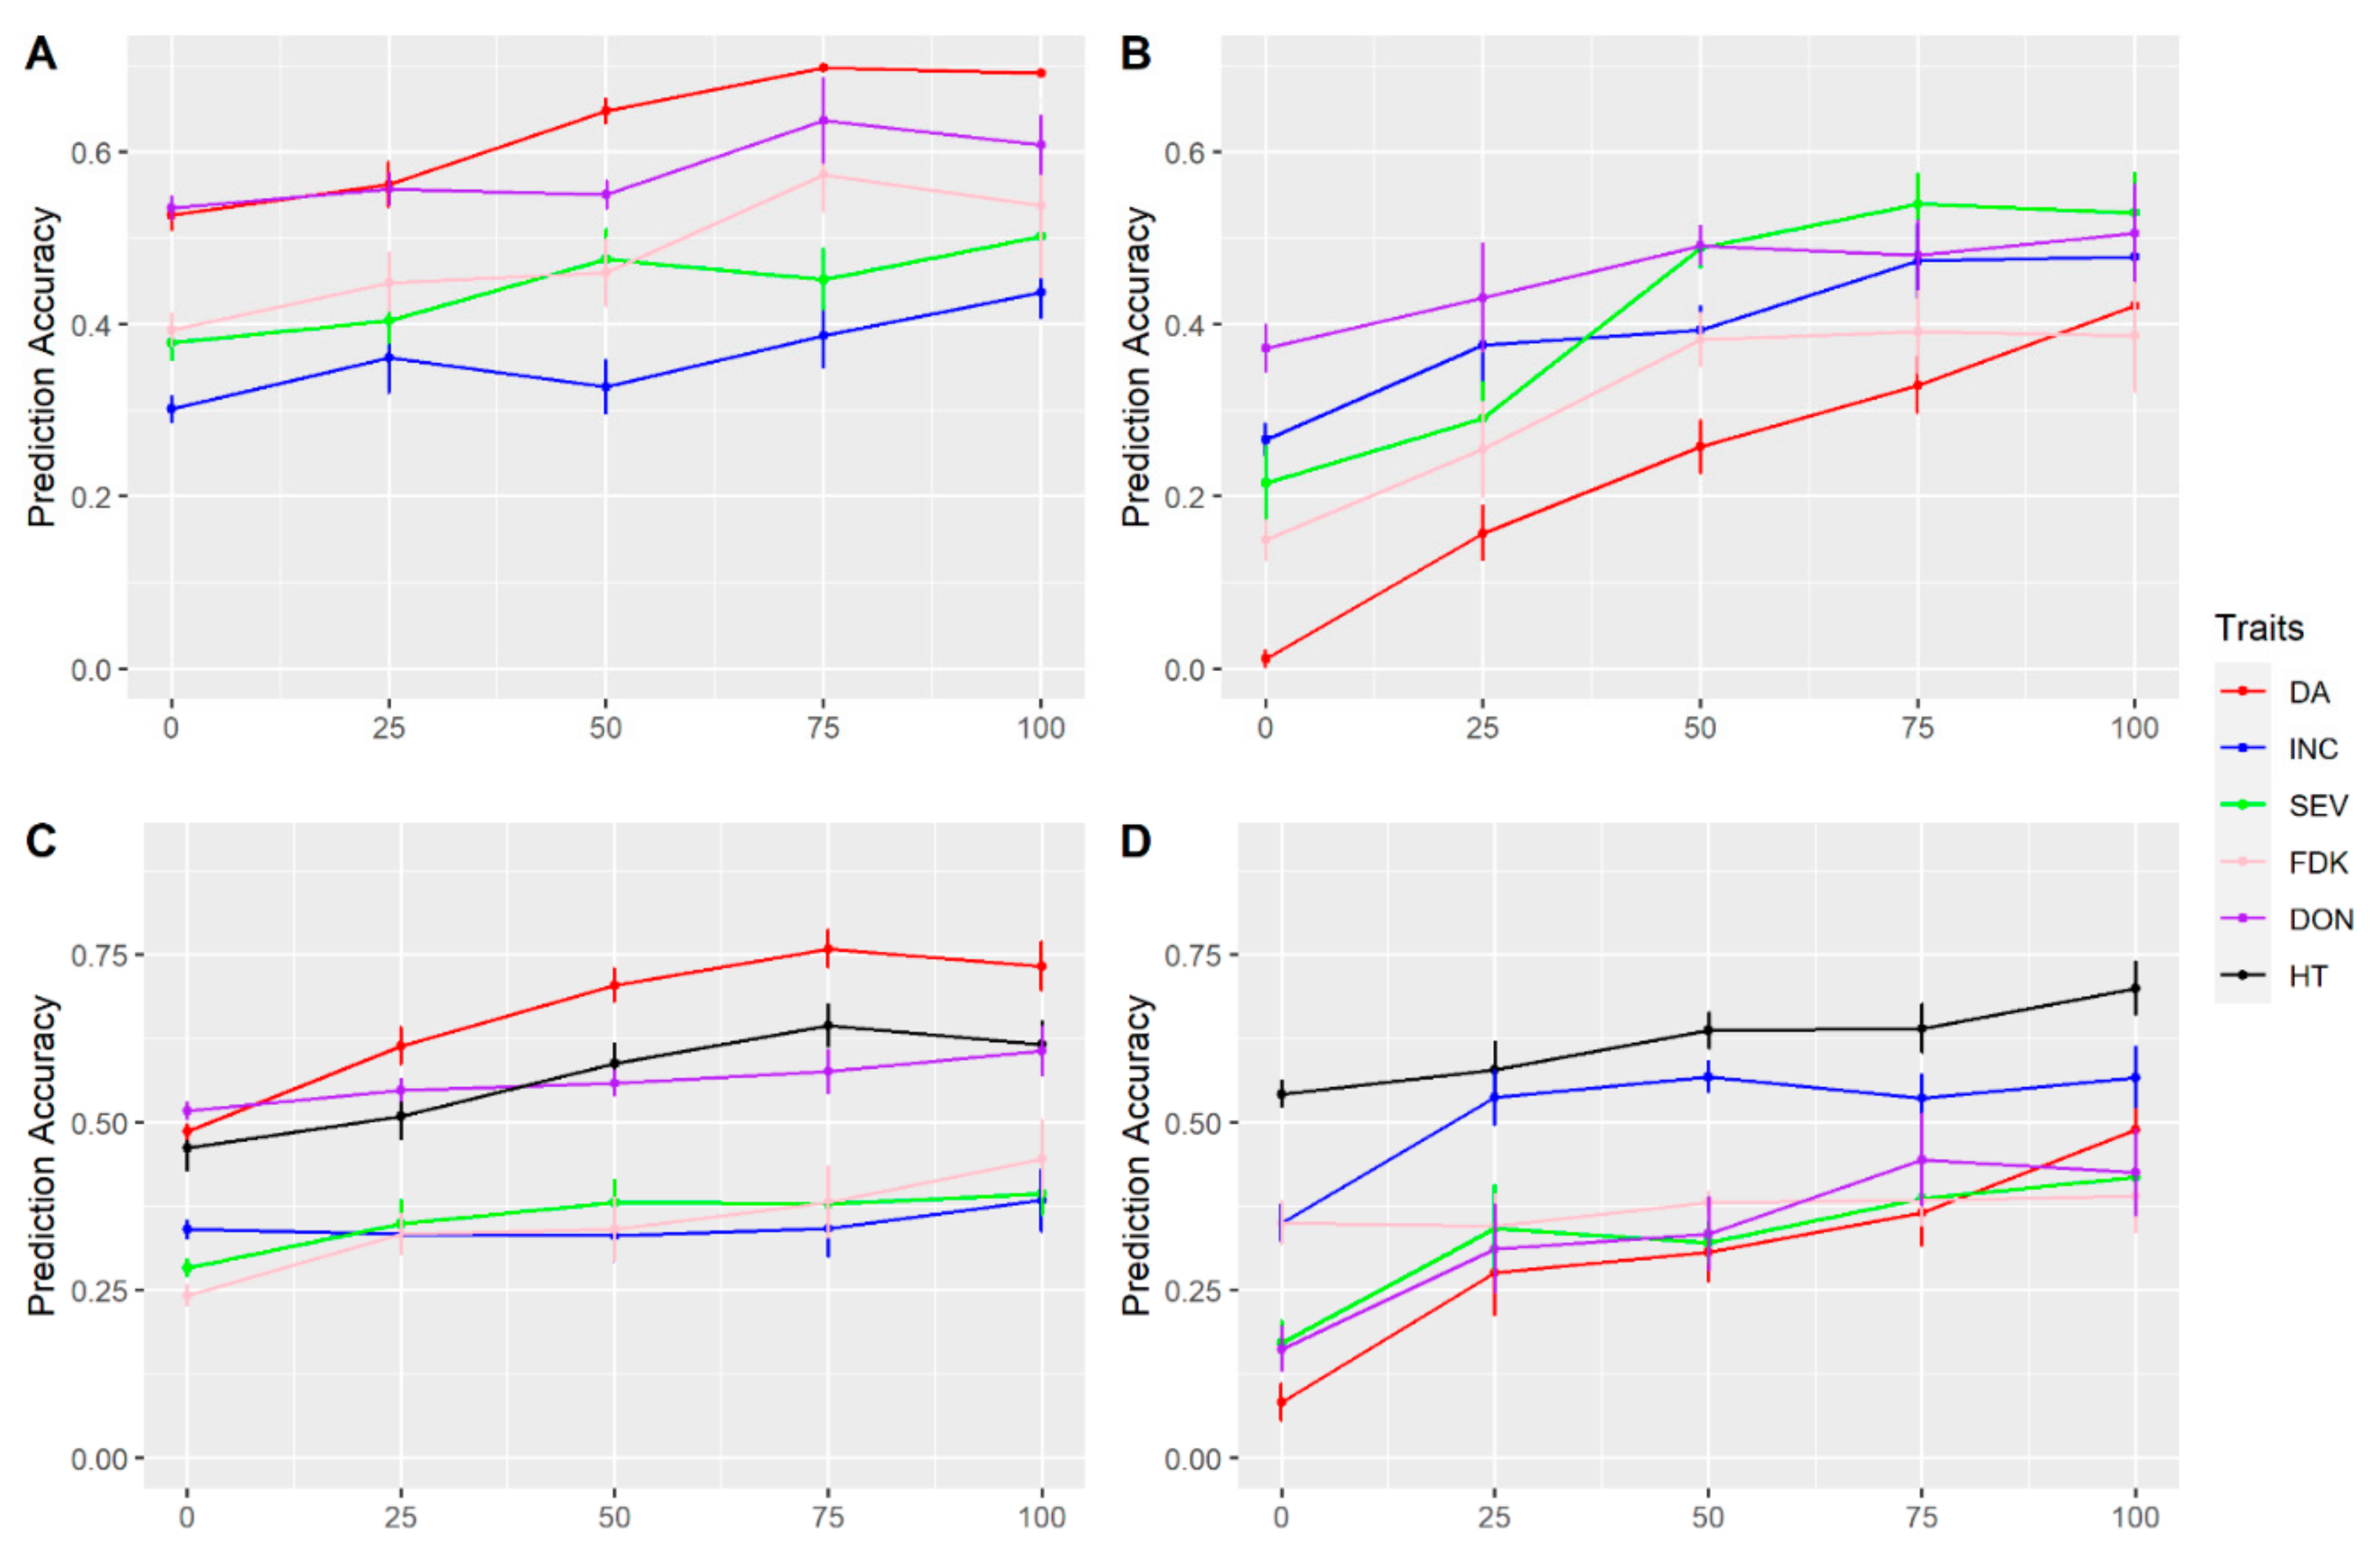
3.1. Effects of Training Population (TP) Size, TP Optimization and Models of Prediction

We used the FS population, with data from MB, to assess the effects of the population size on the accuracy of genomics prediction. For all traits, the prediction accuracy considerably increased by increasing the size of the TP from 25 to 150 lines in both year-independent tests (Figure 1). The accuracy did not reach a plateau at the maximum TP size of 150 lines for any of the traits except DA in 2016 (Figure 1B).
In addition, for all test TP sizes, for DA, a higher accuracy was observed in 2015 (Figure 1A) than in 2016 (Figure 1B). INC and SEV were both observed with higher accuracies in 2016 than 2015 (Figure 1). DON consistently showed higher accuracies across two-year tests, in contrast there was consistently lower accuracies of FDK across years (Figure 1). HT showed the highest accuracy in 2016 compared to all other traits (Figure 1).
In addition to the TP size, we also evaluated the effect of TP optimization algorithms with same datasets above. As shown in Figure 2, TP selection using CDmean always performed better than the PEVmean and random sampling approaches with PEVmean showing lower accuracies than random sampling for all traits in both 2015 (Figure 2A) and 2016 (Figure 2B). When the TP size was reduced to 50 lines the same trends were observed, with the best performance from CDmean optimization (Figure S1).
Seven genomic prediction models, including five parametric (rrBLUP, BayesA, BayesB, BayesC, BL, BRR) and one semiparametric approach (RKPHS) were evaluated with the same datasets. In the year 2015, each model had a similar performance for all FHB related traits (Figure 3A). In the year 2016, each model also showed similar accuracy, except rrBLUP showed higher accuracies for DA and SEV, but lower accuracies for DON (Figure 3B).

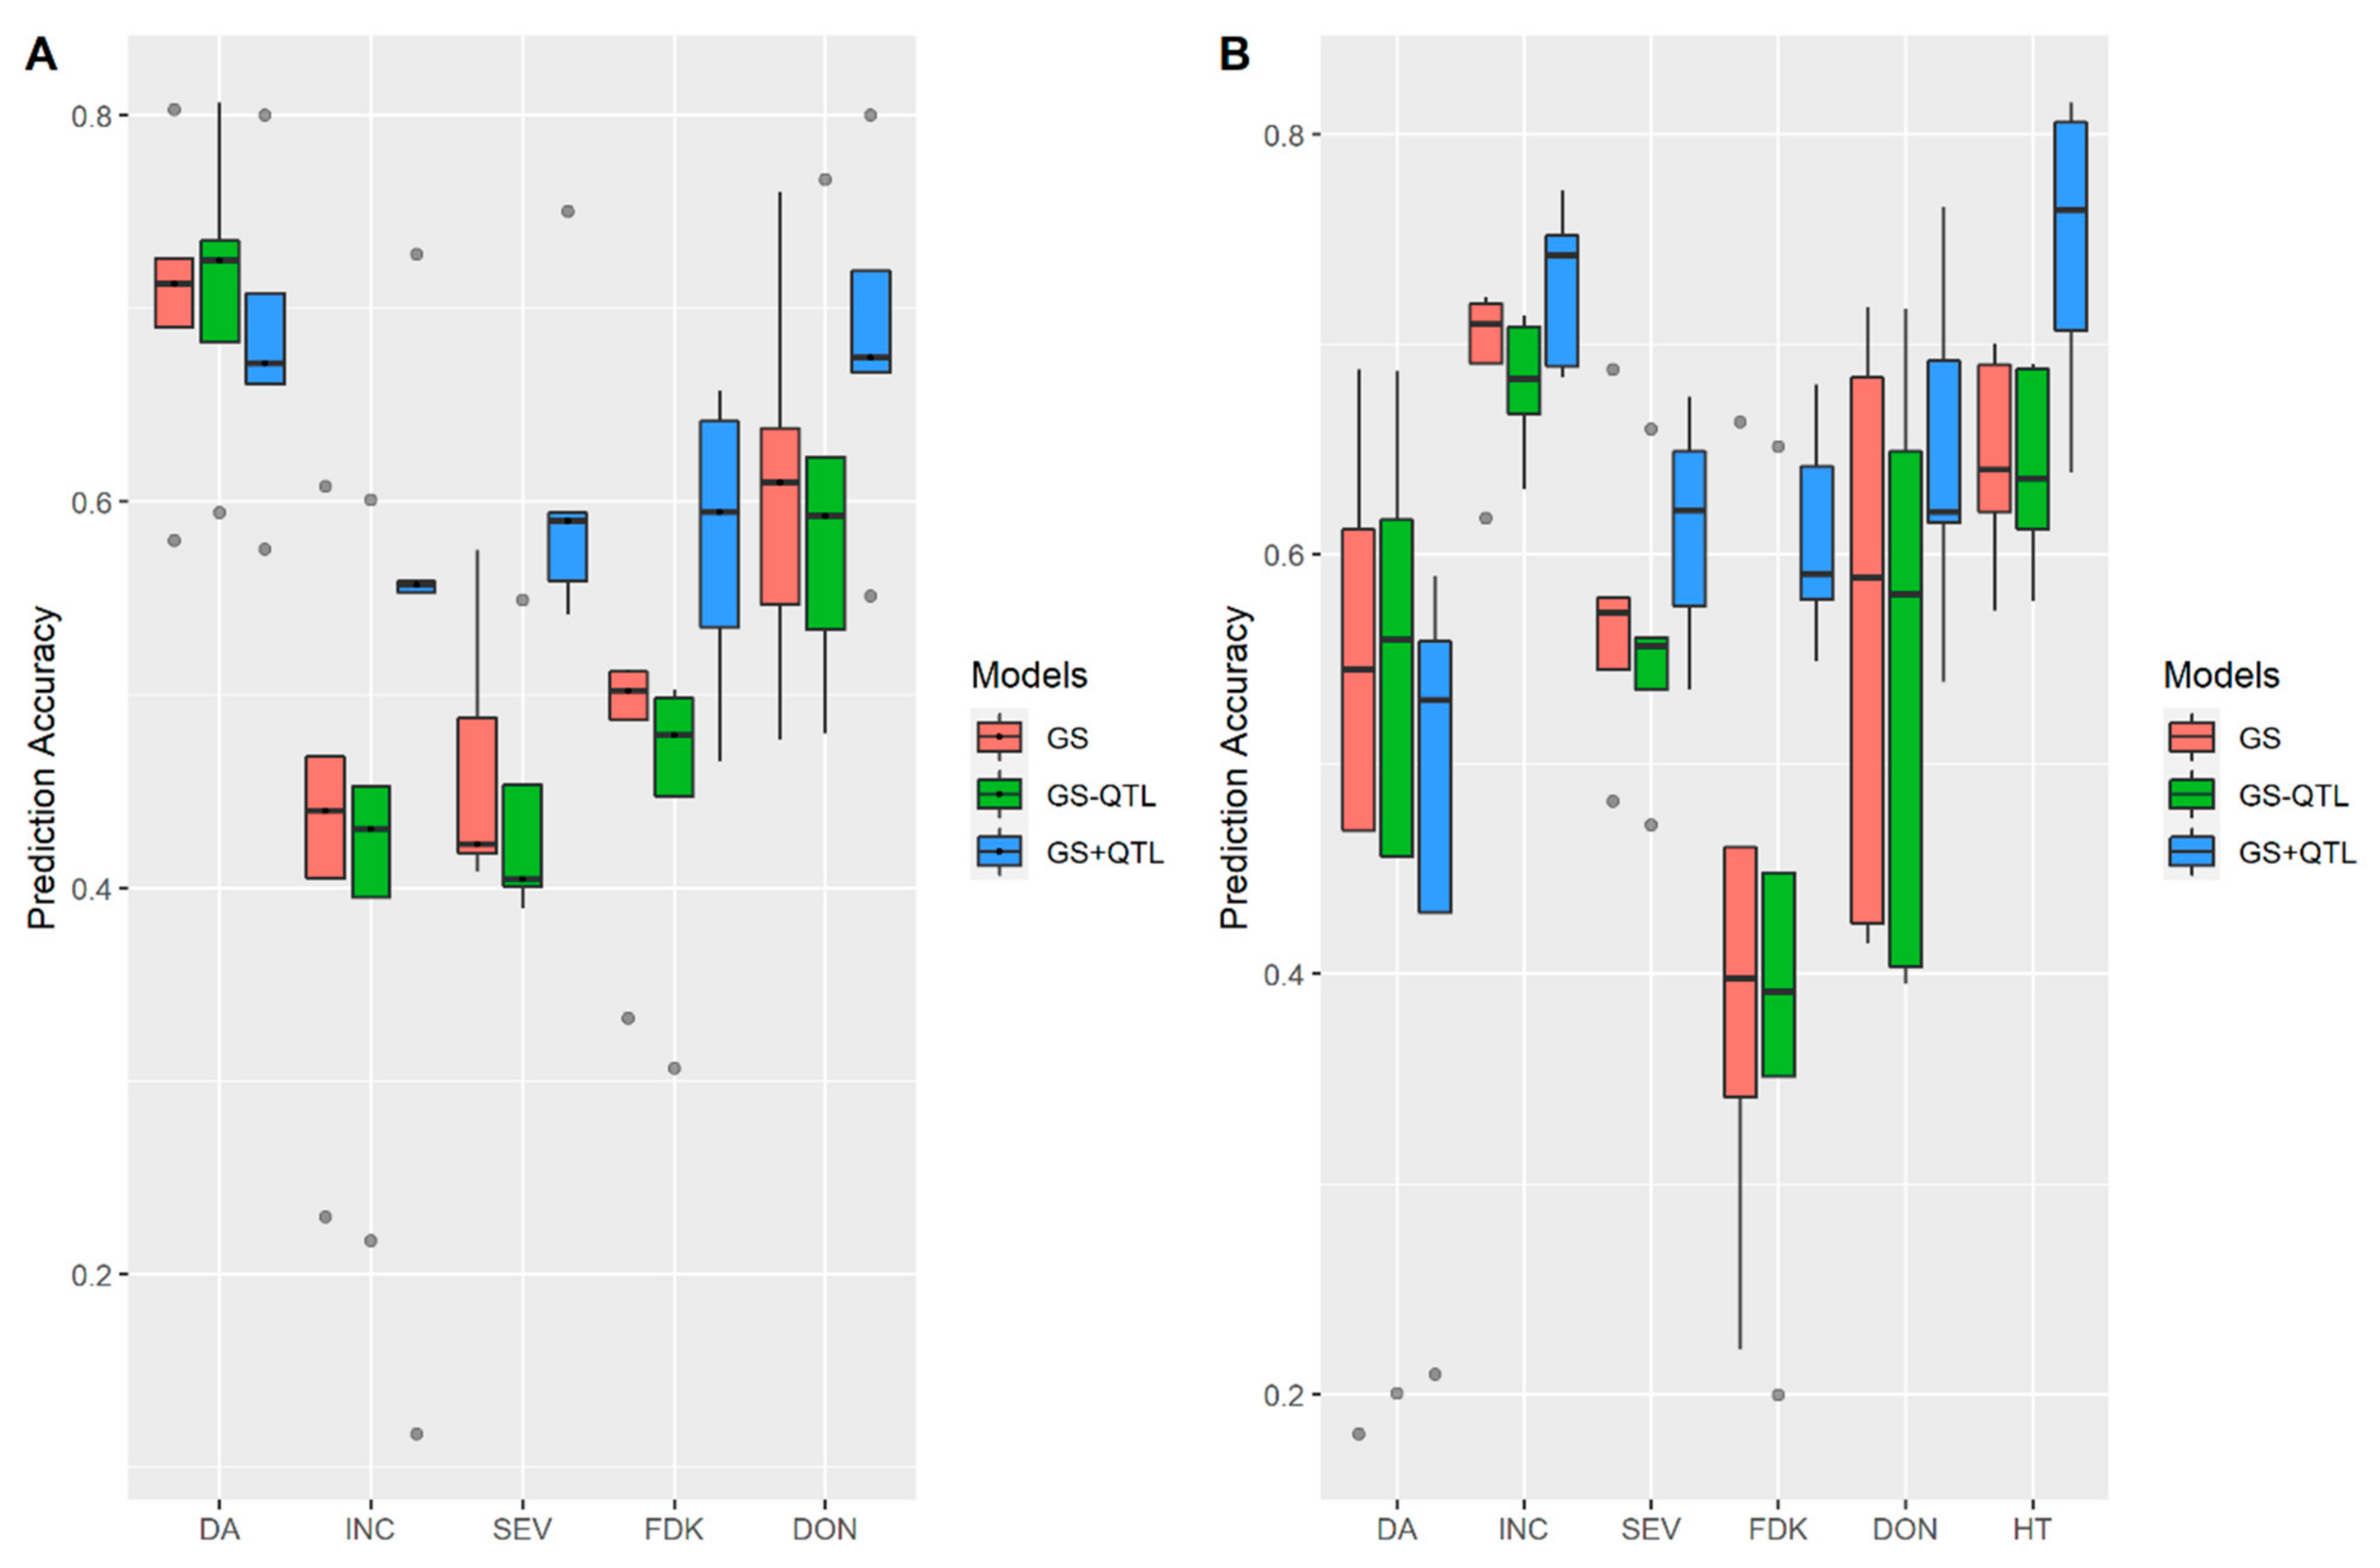
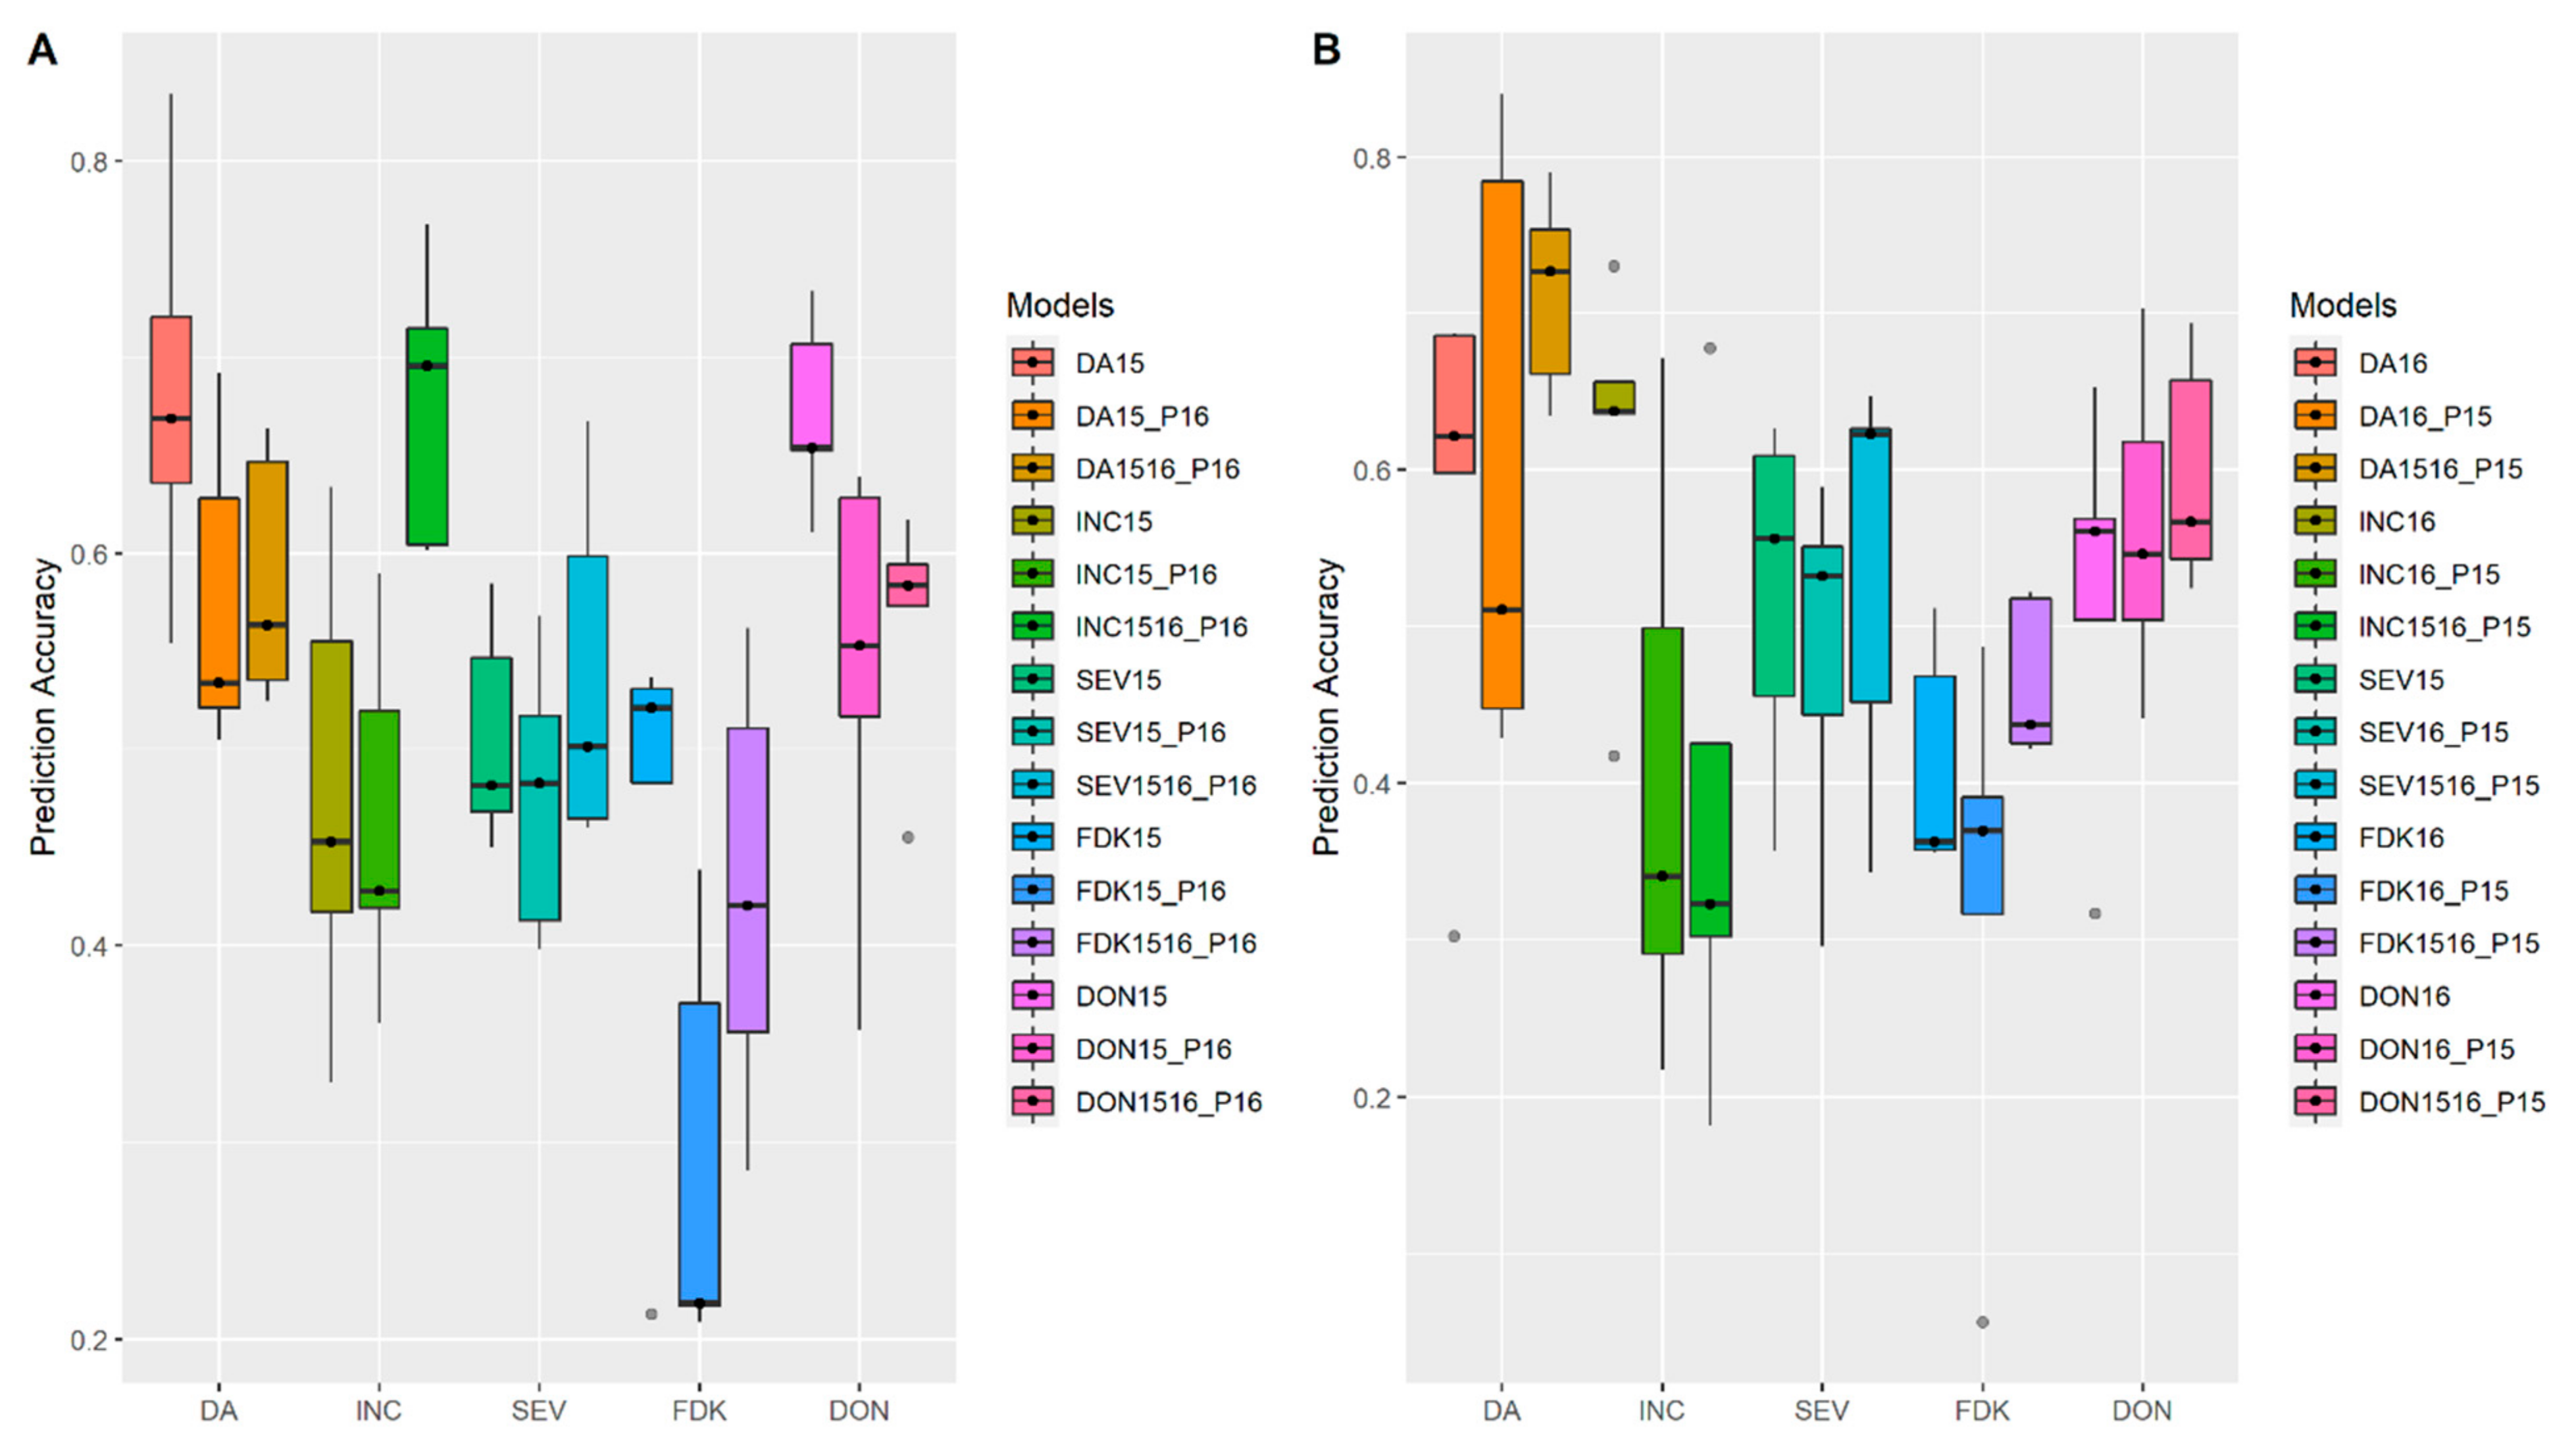
3.2. Incorporation of Prior Known QTL into the Genomic Prediction Model

We evaluated the effect of including QTL as a fixed effect in the genomics prediction model, with the datasets of the FS population from MB. As shown in Figure 4A, in 2015, incorporating QTL into the GS models significantly improved the prediction accuracy for FHB traits including INC, SEV, FDK and DON, but had almost no effect on DA. A similar pattern was also observed in the year 2016 (Figure 4B). We also found in 2016, accuracy of HT prediction was improved by incorporating prior known QTL (Figure 4B).

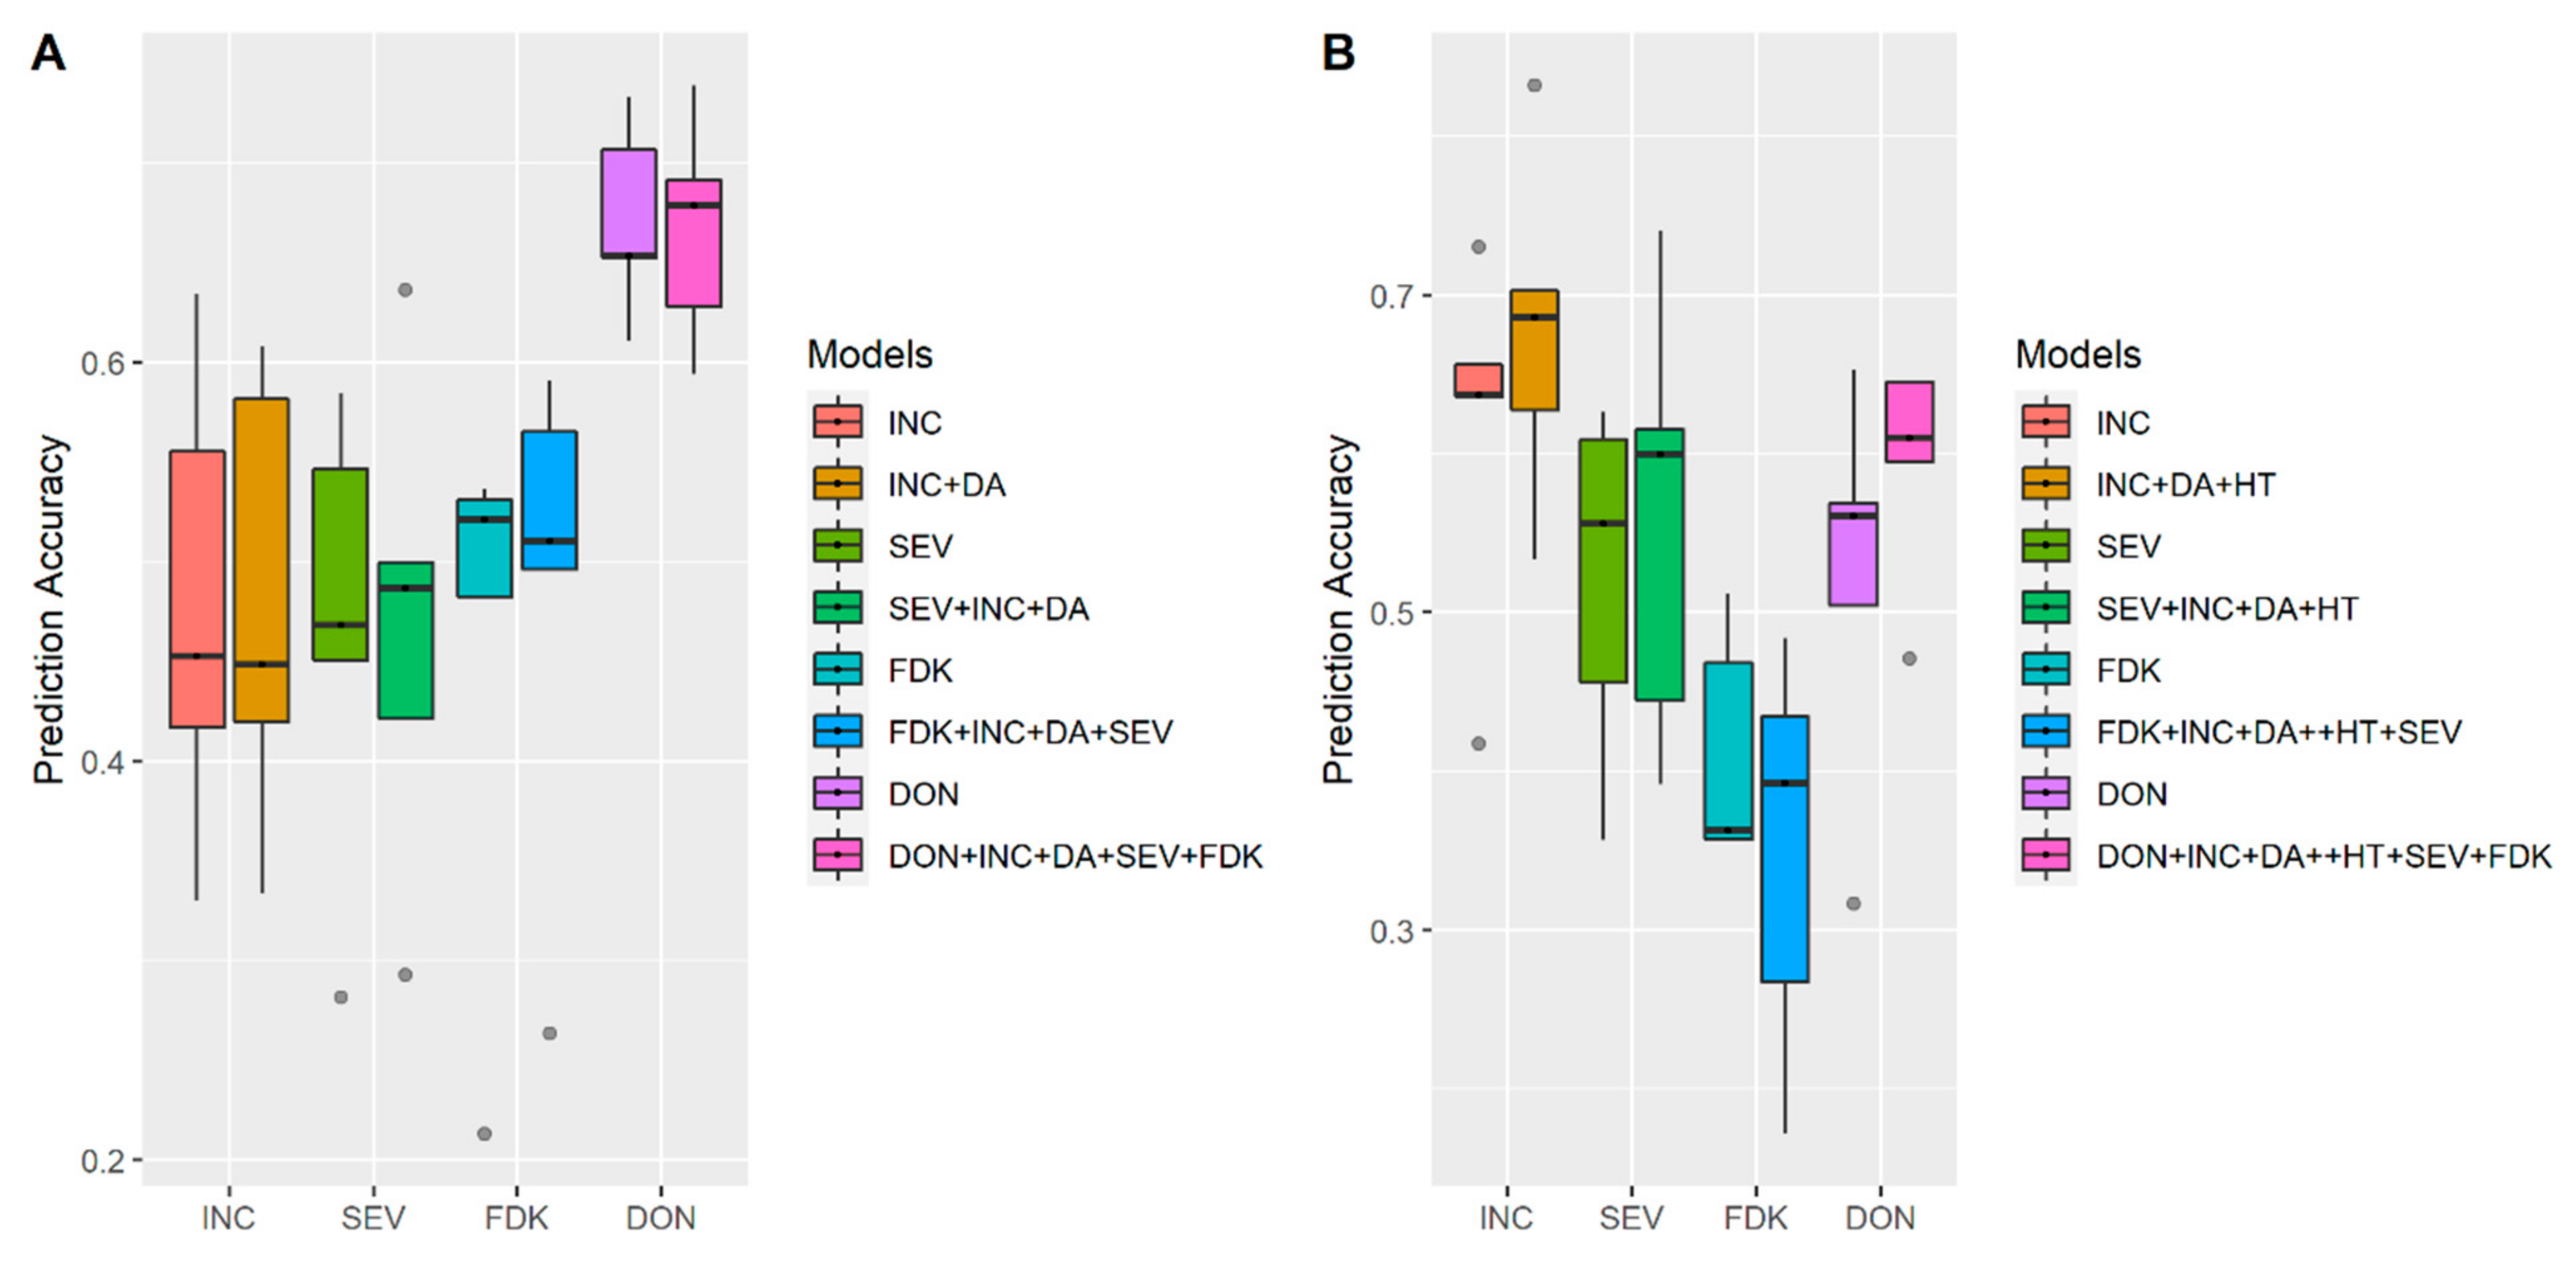
3.3. Multi-Traits and Multi-Environment Prediction

We first compared the single trait and multi-trait model analysis in the year 2015 with datasets of FS population from MB. As shown in Figure 5A, for FHB related traits, INC, SEV, FDK, and DON, and their corresponding multi-trait models, INC + DA, SEV + INC + DA, FDK + INC + DA + SEV, and DON + INC + DA + SEV + FDK, results of multi-trait models were very similar to the single trait model analysis. For the year 2016, HT was included in the multi-trait model in addition to DA. We found that only for DON, the multi-trait model, DON + INC + DA + HT + SEV + FDK performed better than the single trait model analysis (Figure 5B).
To evaluate the accuracy of the multi-environment prediction model, we adopted a scenario to simplify the complexity of GEI. We first assessed a scenario of prediction accuracy in the same location but across different years with datasets of the FS population from MB. For all FHB related traits, a single environment model built from a one-year trial always had lower accuracy when applied to the other year (Figure 6A,B). When a multi-environment model built from multiple years was applied, it achieved better performance for the prediction across years compared to a single environment model (Figure 6). We then assessed the multi-environment model from the same year but across different locations with datasets of the FS population from both MB and ON. As shown in Figure 7A, models built from the trials at Winnipeg, MB (Western Canada) showed lower accuracy to predict the performance of FHB related traits at Ottawa, ON (Eastern Canada) in the year 2015. A similar pattern was observed when an Eastern Canada model was used to predict the performance in Western Canada (Figure 7B). When a multi-environment model developed from both locations was applied, it always displayed higher prediction accuracy across different locations in 2015 (Figure 7). A similar pattern was observed in 2016 (Figure S2), validating the better performance of the multi-environment model.

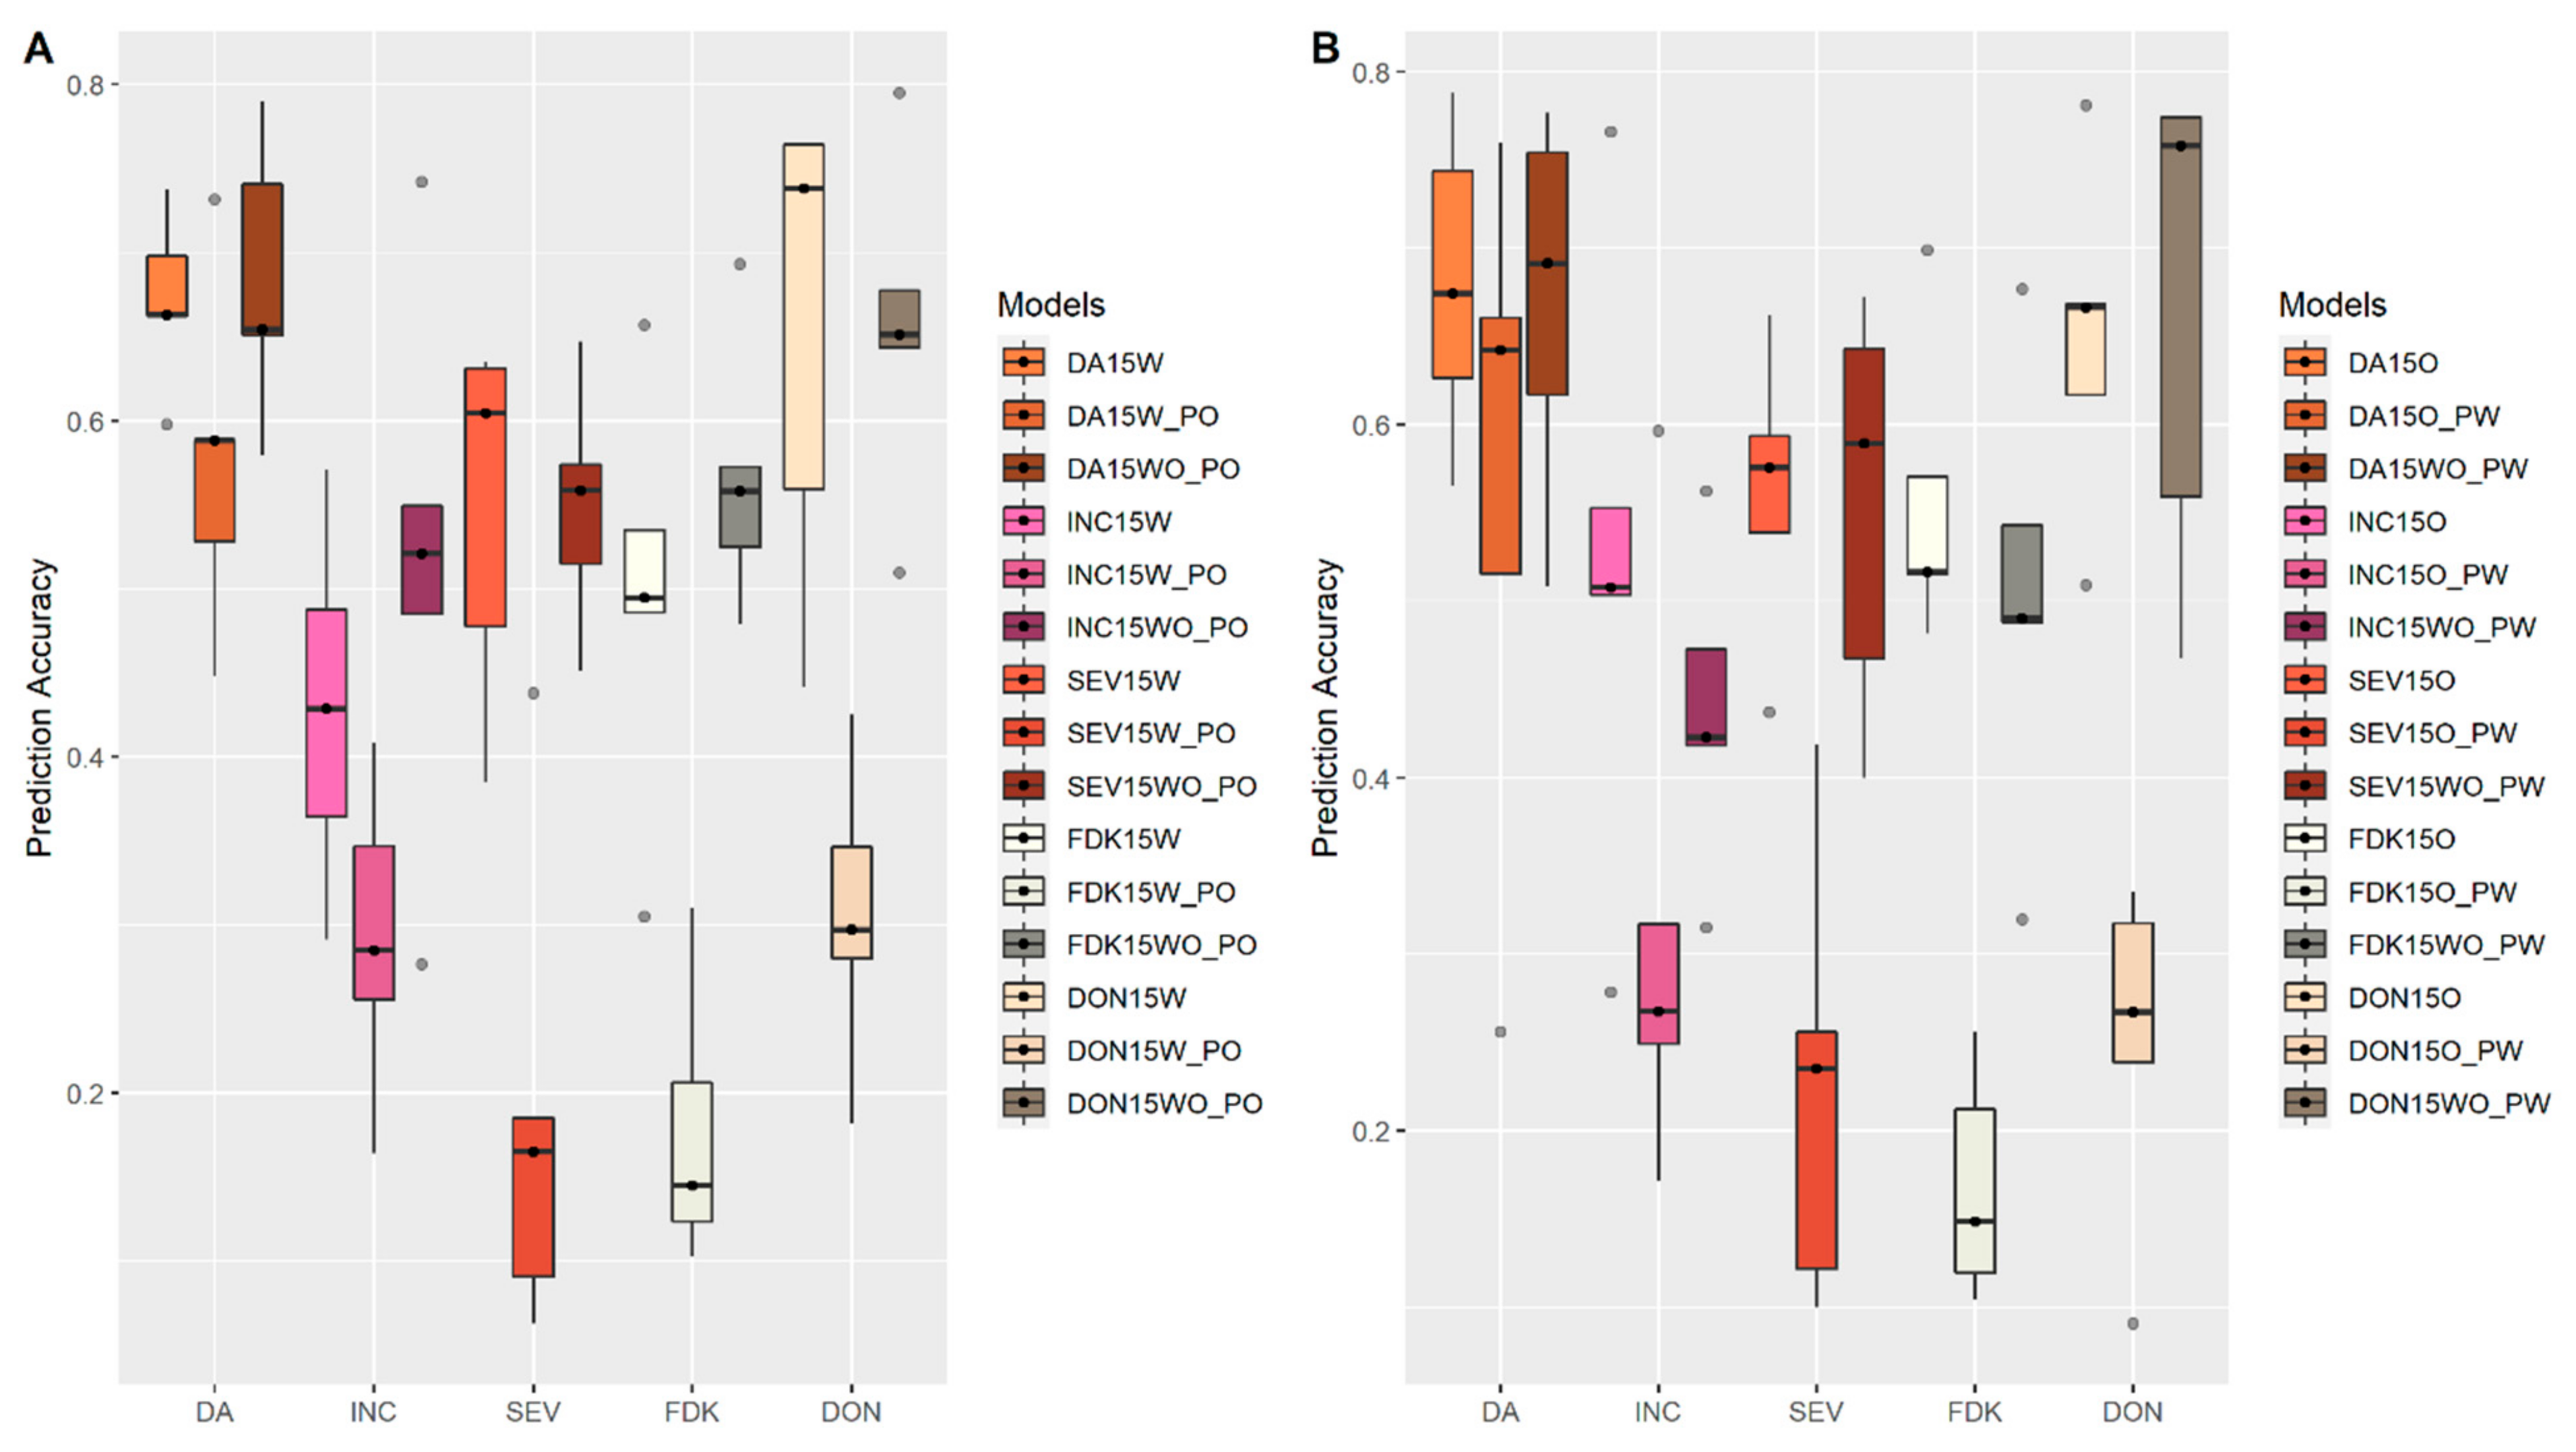
3.4. Prediction within and across Populations

The multi-parental population including FS, FM and FE was evaluated for FHB resistance with datasets from MB. This multi-parental population was designed as a nested association mapping (NAM) approach with the FHB resistance line FL62R1, as common parental line. Principal component analysis (PCA) showed that lines from each individual population were grouped together (Figure S3). PC1 differentiated the FE population from both the FS and FM population (Figure S3). Dendrogram of hierarchical cluster analysis on the genomic relationship of this multiple parental population is also consistent with the PCA analysis (Figures S3 and S4), showing that the FS and FM population have higher relatedness to each other, and lower relatedness to the FE population (Figures S3 and S4).
To evaluate predictabilities across populations, we set the FS population as the reference population and used it to predict performance on the other two test populations. As shown in Figure 8, when TP composition changed from 0 (all lines were from FS population) to 100% (all lines were from test populations), accuracies were consistently increased for all FHB related traits in both two-year tests. When the TP was at 50% of reference population, lines from the test population can get a relatively reasonable accuracy, varying from ~0.3 to 0.65 for these different traits (Figure 8). When the reference FS population was used to predict the FM (Figure 8A,C) and FE population (Figure 8B,D), higher accuracies were observed for the FM population.

4. Discussion

4.1. TP Size

The gradual increase in accuracies for FHB related traits along with the increased TP size agrees with many previous research, including FHB resistance in wheat [30,58] and barley [28], agronomics traits in winter wheat [68] and maize [69]. The size of the training set has a big impact on the accuracy of GS, and a TP of sufficient size is required for good prediction [33,40,48]. However, there are practical reasons the size is constrained (i.e., additional costs with the larger field tests) and there is a TP size where the gains are diminished [28,43]. In barley, it was reported that increasing the size of TP beyond 200 lines has little effect on the accuracy of the FHB resistance prediction [28]. Arruda et al. [30] found that with a TP size of 192 lines, all FHB related traits in wheat except index reaching the plateau. Isidro et al. [41] evaluated five agronomic traits in wheat and found that accuracy prediction plateaued with a TP size at 300 lines. We observed that the prediction accuracy was still increasing when the TP size reached the maximum of our test, 150 lines. Considering that FHB resistance is a complex trait that is controlled by many minor genes that are significantly affected by GEI and with relatively lower phenotyping accuracy, a TP with a size around 200 lines, or more will be needed to achieve better accuracy for FHB resistance in wheat.

4.2. Design TP with Optimization Algorithms

Larger training population size tends to increase the accuracy of the genomic selection, however, a reasonable accuracy can be achieved with a small TP size, given an appropriate design [44,45,46,70]. In addition, knowing how well the model predicts could allow breeders to better allocate resources to apply the GS in the breeding program [41]. Thus, designing an optimal TP is central to the success of the GS in the breeding program. CDmean and PEVmean were originally applied to optimize the TP by Rincent et al. [46] and later these approaches were advanced to stratified CDmean (StratCDmean) and Selection of Training Populations by Genetic Algorithm (STPGA) [41,44,45]. In present study, we found that CDmean consistently outperformed PEVmean for all FHB related traits and at a different TP size. The better performance of CDmean to design an optimal TP with higher accuracy agrees with previous findings for complex traits from many other crops [41,46,47,71]. Together, all of these findings indicated that CDmean may be a promising approach to optimize the TP for better accuracies. Tiede and Smith [71] reported that all optimization algorithms performed better than random sampling TP. However, in our study, PEVmean had consistently worse accuracies compared to random sampling in different years and for all evaluated FHB related traits. Isidro et al. [41] also found that PEVmean showed lower accuracies for florets per panicle and flowering time in wheat with an intermediate TP size, a size comparable to the TP size of our study (around 100–150 lines). There is a need to further explore the cause of this lower accuracy of PEVmean. In addition, most current optimization algorithms only use the genomics information of the TP, except the STPGA, which also incorporated the information from the testing population [44]. In the future, new advanced optimization algorithms that can design the TP with a better predictability will pave the way for the design of the TP, and thus can broadly benefit the GS application in the breeding program.

4.3. Models of Prediction

There are a large number of models that can be used to predict phenotypic traits and these methods can be simply classified into parametric and non-parametric (or semi-parametric) approaches [72]. These methods varied in their accuracies for different traits as parameters varied according to different assumptions to appropriately suit the genetic architecture underlying that targeted trait [48,49,50]. The majority of models used for genomic prediction are Bayesian based models and rrBLUP (or GBLUP, equal to rrBLUP) model [51,64]. In the present study, we found seven models including both parametric and non-parametric approaches had very similar performance for all FHB related traits across different years. Heffner et al. [43] also observed no difference for different GS models, tested on thirteen agronomic traits in wheat. With their findings as ours, GS models may play a minor effect on the accuracy to predict FHB resistance and agronomics traits in wheat.

4.4. Incorporation of Prior Known QTL

Previous studies with both simulated and empirical datasets in different crops, including rice, maize, sorghum and wheat demonstrated that incorporating large effect QTL as fixed effects into GS can lead to better predictability [54,55,58,73,74,75,76]. In our study, we also found that including QTL into GS model as fixed effects can considerably improve accuracies for FHB resistance traits including INC, SEV, FDK and DON. This benefit was also validated by the test in different environments. Arruda et al. [74] also observed that including QTL as fixed effects can significantly improve accuracies of GS for INC, SEV, FDK, but with no effect on DON. Beside FHB traits, Herter et al. [58] 2019 found higher accuracies for the heading date and plant height with QTL as fixed effects in the GS model, while our study found including fixed effect QTL influenced the prediction accuracy of plant height but had little or no effect on heading date. A simulation study [54] demonstrated that including known major genes as fixed effects can increase prediction accuracy when a substantial amount of phenotypic variance can be explained by major genes. Our previous study [17] identified that a major QTL from FL62R1 on chromosome 4B contributed to the FHB resistance and plant height. In addition, FHB1 was found as the second largest QTL from FL62R1 that conferred FHB resistance [17]. However, only quite minor QTL were identified for the heading date. Thus, our findings were in agreement with results from Bernardo [54]. Recently, Larkin et al. [57] reported that GS plus QTL performed worse than native GS, while Rice and Lipka [76] showed that the benefits of GS plus QTL were on a trait-by-trait basis. Therefore, application of the GS plus QTL model should take into account the trait, effect of QTL, and the property of the genetic architecture underlying the trait. An additional complication is that candidate genes controlling many traits are still not yet cloned, and most times, markers associated with the trait were used instead of functional genes. This may affect the accuracy of the GS plus QTL model. Indeed, a negative impact on the GS was noted by Spindel et al. [55] when inaccurate or inappropriate fixed effects were incorporated into the GS model.

4.5. Predictability with Multi-Trait and Multi-Environment Models

Many studies, including our previous study on the FHB resistance of FL62R1 identified that flowering time and plant height are associated with FHB resistance [17,21,23,25]. In addition, different FHB resistance components, including INC, SEV, FDK and DON may partially share the same genetic architecture [17,21,25]. Jia and Jannink [52] reported that for genetically correlated quantitative traits, multivariate genomic selection (MVGS) model on multiple correlated traits outperformed the single-trait (univariate) GS model. With the application of the MVGS model on FHB related traits including INC, SEV, FDK and DON and plant height, Larkin et al. [57] found that MVGS performed better for all these FHB resistance traits except for DON. In our study, we found MVGS did not perform better than the single trait prediction model for all these FHB related traits in the test of Year 2015. This finding was supported by the other independent test in the year of 2016, except for DON, where MVGS had better accuracy than the single trait model. Previous study in wheat quality and yield traits, showed that MVGS models did not perform better than the single trait model except yield [77,78]. These discrepancies on accuracies of MVGS models may be partially caused by different genetic architecture, mechanism and interactions of genes underlying genetically correlated traits.
In contrast, when we applied multi-environment (MET) models across different years or locations, MET models that incorporated GEI always performed better than single environment models for all FHB related traits and for DA and HT. Lado et al. [79] performed MET model analysis with 35 location–year combinations and found that higher predictive ability can be achieved by modeling GEI in the GS models. Lado et al. [79] also found modeling GEI for GS quite complicated, and that borrowing information from relatives evaluated in multiple environments and modeling them is important for MET prediction accuracies. Our findings indicated that designing a TP with phenotypic traits generated from environments similar to environments of the test population may be crucial for the success of MET prediction in the breeding program.

4.6. Predictability within and across Populations

The relatedness between the TP and tested population is critical for the prediction of complex traits [36]. With FS as reference population, we found that changing the TP compositions from 0% of the tested population to 100% (FS decreased from 100% to 0%), increased accuracies for all FHB related traits across different years. This was supported by findings in maize [80] and durum wheat [81], which all indicated that relatedness between TP and test population should be the key consideration for GS application. In addition, we found when FS was used as TP, it better predicted the more closely related FM population than the more distantly related FE population. Parental line Stettler from FS and Muchmore from FM populations are two Canadian western red spring wheat varieties that were developed from the AAFC Swift-Current breeding program, and share the same parent, Superb, in their pedigrees [60,61]. The FE population was generated from Emerson, a winter wheat that is the only R rated FHB resistance wheat in Canada [62]. This pedigree information validated the higher genetic relatedness between the FS and FM population than the FE population. It should be noted that the FS TP and the test populations all share the major 4B QTL for FHB resistance that derives from the common FHB resistant parental line FL62R1 [17]. Thus, findings from this study may have limits when attempting to apply to broad applications.

5. Conclusions

In this study, with multiple connected bi-parental populations, we evaluated factors that can affect accuracies for the prediction of FHB related traits in wheat. We found a TP size around 200 lines, or more, is needed to achieve good accuracies for FHB resistance. Incorporating prior known QTL information of these traits can significantly improve predictabilities. Multi-environment modelling and including phenotypic data from the TP with relevance to the test population led to considerably better predictabilities across environments. Relatedness between TP and testing population is the key for accuracies, but accurately applying GS across less related populations remains a challenge.

6. Patents

Not Applicable.

Supplementary Materials

The following are available online at https://0-www-mdpi-com.brum.beds.ac.uk/article/10.3390/biology10080756/s1, Figure S1: Effects of training population (TP) optimization on the accuracy of fusarium head blight (FHB)-related traits in (A) Year 2015; (B) Year 2016. A TP with a size of 50 lines was randomly selected or optimized with CDmean and PEVmean. Prediction accuracy is the mean value of 100 iterations for each of these defined TP. Days to anthesis (DA), incidence (INC), severity (SEV), Fusarium damaged kernels (FDK), deoxynivalenol (DON) and plant height (HT), Figure S2: Accuracies of genomic prediction with multi-environment models built from multiple locations predicted performance across locations in the year 2016 (A) Prediction of traits for Ottawa, Ontario (O); (B) Prediction of traits for Carman, MB (W). Whiskers represent the upper and lower limit, and the box represents the quartiles Q1 (25%), Q2 (median, thick black line within the box), and Q3 (75%). Each model was assessed by fivefold cross-validations repeated 10 times. 16 represented the year 2016. W and O, represented Carman, MB and Ottawa, Ontario. Models built from single environment (SE) at Carman, MB (W), and multiple environment model with two locations, Carman, MB and Ottawa, Ontario (WO) were used to predict traits performance at Ottawa, Ontario (W_PO and WO_PO) and compared to the single environment model at local environment (W), as shown in (A). Models built from single environment (SE) at Ottawa, Ontario (O), and multiple environment model with two locations, Carman, MB and Ottawa, Ontario (WO) were used to predict traits performance at Carma, MB (O_PW and WO_PW) and compared to the single environment model’s prediction at local environment (O), as shown in (B), Figure S3: Principal component analysis (PCA) of the population structure of the multi-parental population. Blue dots represented Emerson population (FE), red and green were Stettler population (FS) and Muchmore population (FE). X-axis and Y-axis represented variations explained by PC1 and PC2, Figure S4: Dendrogram of hierarchical cluster analysis heatmap of the genomic relationship matrix for the wheat multi-parental population. Blue branches represented Emerson population (FE), red and green branches were Stettler population (FS) and Muchmore population (FE).

Author Contributions

P.R.F. and W.Z. conceived this study and acquired funds for this study. P.R.F., W.Z., K.B., R.C. and R.G. designed the experiment. F.J. and F.E. developed DH populations, and H.R. contributed to the seed increasing of DH populations. K.B., P.G., B.P. and W.Z. performed the experiment. A.B.-B., G.F. and Z.R.D. contributed to field trials and disease evaluation. W.Z. and K.B. analyzed data, interpreted results. W.Z., K.B. and P.R.F. wrote the manuscript. All authors have read and agreed to the published version of the manuscript.

Funding

This research was funded by the Sustainable Agri-Food program of National Research Council Canada.

Institutional Review Board Statement

Not Applicable.

Informed Consent Statement

Not Applicable.

Data Availability Statement

All data generated during this study are included in this published article (and its Supplementary Information files).

Acknowledgments

The authors thank Ron DePauw for Stettler and Muchmore seeds, and Robert Graf for Emerson seeds, Janet Condie for technical assistance with the 90K SNP genotyping, and Daoquan Xiang for critically reviewing the manuscript.

Conflicts of Interest

The authors declare that the research was conducted in the absence of any commercial or financial relationships that could be construed as a potential conflict of interest. The funders had no role in the design of the study; in the collection, analyses, or interpretation of data; in the writing of the manuscript, or in the decision to publish the results.

References

  1. Gilbert, J.; Tekauz, A. Review: Recent developments in research on fusarium head blight of wheat in Canada. Can. J. Plant Pathol. 2000, 22, 1–8. [Google Scholar] [CrossRef]
  2. Bai, G.; Shaner, G. Management and resistance in wheat and barley to Fusarium head blight. Annu. Rev. Phytopathol. 2004, 42, 135–161. [Google Scholar] [CrossRef]
  3. McMullen, M.; Bergstrom, G.; De Wolf, E.; Dill-Macky, R.; Hershman, D.; Shaner, G.; Van Sanford, D. A unified effort to fight an enemy of wheat and barley: Fusarium head blight. Plant Dis. 2012, 96, 1712–1728. [Google Scholar] [CrossRef] [PubMed] [Green Version]
  4. Haile, J.K.; N’Diaye, A.; Walkowiak, S.; Nilsen, K.T.; Clarke, J.M.; Kutcher, H.R.; Steiner, B.; Buerstmayr, H.; Pozniak, C.J. Fusarium head blight in durum wheat: Recent status, breeding directions, and future research prospects. Phytopathology 2019, 109, 1664–1675. [Google Scholar] [CrossRef]
  5. Wilson, W.; Dahl, B.; Nganje, W. Economic Costs of Fusarium Head Blight, Scab and Deoxynivalenol. World Mycotoxin J. 2018, 11, 291–302. [Google Scholar] [CrossRef]
  6. Gilbert, J.; Haber, S. Overview of some recent research developments in Fusarium head blight of wheat. Can. J. Plant Pathol. 2013, 35, 149–174. [Google Scholar] [CrossRef]
  7. Prat, N.; Buerstmayr, M.; Steiner, B.; Robert, O.; Buerstmayr, H. Current knowledge on resistance to Fusarium head blight in tetraploid wheat. Mol. Breed. 2014, 34, 1689–1699. [Google Scholar] [CrossRef]
  8. Liu, S.; Hall, M.D.; Griffey, C.A.; McKendry, A.L. Meta-analysis of QTL associated with Fusarium Head Blight resistance in wheat. Crop Sci. 2009, 49, 1955–1968. [Google Scholar] [CrossRef]
  9. Löffler, M.; Schön, C.C.; Miedaner, T. Revealing the genetic architecture of FHB resistance in hexaploid wheat (Triticum aestivum L.) by QTL meta-analysis. Mol. Breed. 2009, 23, 473–488. [Google Scholar] [CrossRef]
  10. Venske, E.; Dos Santos, R.S.; Farias, D.D.R.; Rother, V.; Maia, L.C.D.; Pegoraro, C.; Costa De Oliveira, A. Meta-analysis of the QTLome of Fusarium head blight resistance in bread wheat: Refining the current puzzle. Front. Plant Sci. 2019, 10, 727. [Google Scholar] [CrossRef] [Green Version]
  11. Miller, J.D.; Young, J.C.; Sampson, D.R. Deoxynivalenol and Fusarium head blight resistance in spring cereals. J. Phytopathol. 1985, 113, 359–367. [Google Scholar] [CrossRef]
  12. Mesterhazy, A. Types and components of resistance to Fusarium head blight of wheat. Plant. Breed. 1995, 114, 377–386. [Google Scholar] [CrossRef]
  13. Mesterhazy, A.; Bartok, T.; Mirocha, C.G.; Komoroczy, R. Nature of wheat resistance to Fusarium head blight and the role of deoxynivalenol for breeding. Plant. Breed. 1999, 118, 97–110. [Google Scholar] [CrossRef]
  14. Steiner, B.; Buerstmayr, M.; Michel, S.; Schweiger, W.; Lemmens, M.; Buerstmayr, H. Breeding strategies and advances in line selection for Fusarium head blight resistance in wheat. Trop. Plant. Pathol. 2017, 42, 165–174. [Google Scholar] [CrossRef] [Green Version]
  15. Steiner, B.; Lemmens, M.; Griesser, M.; Scholz, U.; Schondelmaier, J.; Buerstmayr, H. Molecular mapping of resistance to Fusarium head blight in the spring wheat cultivar Frontana. Theor. Appl. Genet. 2004, 109, 215–224. [Google Scholar] [CrossRef] [PubMed]
  16. Lv, C.; Song, Y.; Gao, L.; Yao, Q.; Zhou, R.; Xu, R.; Jia, J. Integration of QTL detection and marker assisted selection for improving resistance to Fusarium head blight and important agronomic traits in wheat. Crop J. 2014, 2, 70–78. [Google Scholar] [CrossRef] [Green Version]
  17. Zhang, W.; Boyle, K.; Brûlé-Babel, A.L.; Fedak, G.; Gao, P.; Robleh Djama, Z.; Polley, B.; Cuthbert, R.; Randhawa, H.; Jiang, F.Y.; et al. Genetic characterization of multiple components contributing to Fusarium head blight resistance of FL62R1, a Canadian bread wheat developed using systemic breeding. Front. Plant Sci. 2020, 26, 580833. [Google Scholar] [CrossRef]
  18. Gervais, L.; Dedryver, F.; Morlais, J.Y.; Bodusseau, V.; Negre, S.; Bilous, M.; Groos, C.; Trottet, M. Mapping of quantitative trait loci for field resistance to Fusarium head blight in a European winter wheat. Theor. Appl. Genet. 2003, 106, 961–970. [Google Scholar] [CrossRef]
  19. Srinivasachary, G.N.; Steed, A.; Faure, S.; Bayles, R.; Jennings, P.; Nicholson, P. Mapping of QTL associated with Fusarium head blight in spring wheat RL4137. Czech J. Genet. Plant. 2008, 44, 147–159. [Google Scholar] [CrossRef] [Green Version]
  20. Srinivasachary, G.N.; Steed, A.; Hollins, T.; Bayles, R.; Jennings, P.; Nicholson, P. Semi-dwarfing Rht-B1 and Rht-D1 loci of wheat differ significantly in their influence on resistance to Fusarium head blight. Theor. Appl. Genet. 2009, 118, 695–702. [Google Scholar] [CrossRef] [PubMed]
  21. Buerstmayr, H.; Ban, T.; Anderson, J.A. QTL mapping and marker-assisted selection for Fusarium head blight resistance in wheat: A review. Plant Breed. 2009, 128, 1–26. [Google Scholar] [CrossRef]
  22. Skinnes, H.; Semagn, K.; Tarkegne, Y.; Maroy, A.G.; Bjornstad, A. The inheritance of anther extrusion in hexaploid wheat and its relationship to Fusarium head blight resistance and deoxynivalenol content. Plant Breed. 2010, 129, 149–155. [Google Scholar] [CrossRef]
  23. Lu, Q.X.; Lillemo, M.; Skinnes, H.; He, X.Y.; Shi, J.R.; Ji, F.; Dong, Y.H.; Bjornstad, A. Anther extrusion and plant height are associated with Type I resistance to Fusarium head blight in bread wheat line ‘Shanghai-3/ Catbird’. Theor. Appl. Genet. 2013, 126, 317–334. [Google Scholar] [CrossRef] [PubMed]
  24. Szabo-Hever, A.; Lehoczki-Krsjak, S.; Varga, M.; Purnhauser, L.; Pauk, J.; Lantos, C.; Mesterházy, Á. Differential influence of QTL linked to Fusarium head blight, Fusarium-damaged kernel, deoxynivalenol contents and associated morphological traits in a Frontana-derived wheat population. Euphytica 2014, 200, 9–26. [Google Scholar] [CrossRef] [Green Version]
  25. Buerstmayr, M.; Buerstmayr, H. The semidwarfing alleles Rht-D1b and Rht-B1b show marked differences in their associations with anther-retention in wheat heads and with Fusarium head blight susceptibility. Phytopathology 2016, 106, 1544–1552. [Google Scholar] [CrossRef] [Green Version]
  26. Buerstmayr, M.; Steiner, B.; Buerstmayr, H. Breeding for Fusarium head blight resistance in wheat—Progress and challenges. Plant Breed. 2020, 139, 429–454. [Google Scholar] [CrossRef]
  27. Van Sanford, D.; Anderson, J.; Campbell, K.; Costa, J.; Cregan, P.; Griffey, C.; Hayes, P.; Ward, R. Discovery and deployment of molecular markers linked to fusarium head blight resistance: An integrated system for wheat and barley. Crop Sci. 2001, 41, 638–644. [Google Scholar] [CrossRef]
  28. Lorenz, A.J.; Smith, K.P.; Jannink, J.L. Potential and optimization of genomic selection for Fusarium head blight resistance in six-row barley. Crop Sci. 2012, 52, 1609–1621. [Google Scholar] [CrossRef]
  29. Rutkoski, J.; Benson, J.; Jia, Y.; Brown-Guedira, G.; Jannink, J.-L.; Sorrells, M. Evaluation of Genomic Prediction Methods for Fusarium Head Blight Resistance in Wheat. Plant Genome 2012, 5, 51–61. [Google Scholar] [CrossRef] [Green Version]
  30. Arruda, M.P.; Brown, P.J.; Lipka, A.E.; Krill, A.M.; Thurber, C.; Kolb, F.L. Genomic selection for predicting head blight resistance in a wheat breeding program. Plant Genome 2015, 8, 1–12. [Google Scholar] [CrossRef] [Green Version]
  31. Steiner, B.; Michel, S.; Maccaferri, M.; Lemmens, M.; Tuberosa, R.; Buerstmayr, H. Exploring and exploiting the genetic variation of Fusarium head blight resistance for genomic-assisted breeding in the elite durum wheat gene pool. Theor. Appl. Genet. 2019, 132, 969–988. [Google Scholar] [CrossRef] [PubMed] [Green Version]
  32. Meuwissen, T.H.E.; Hayes, B.J.; Goddard, M.E. Prediction of total genetic value using genome-wide dense marker maps. Genetics 2001, 157, 1819–1829. [Google Scholar] [CrossRef] [PubMed]
  33. Heffner, E.L.; Sorrells, M.E.; Jannink, J.L. Genomic selection for crop improvement. Crop Sci. 2009, 49, 1–12. [Google Scholar] [CrossRef]
  34. Voss-Fels, K.P.; Cooper, M.; Hayes, B.J. Accelerating crop genetic gains with genomic selection. Theor. Appl. Genet. 2019, 132, 669–686. [Google Scholar] [CrossRef]
  35. Xu, Y.; Liu, X.; Fu, J.; Wang, H.; Wang, J.; Huang, C.; Prasanna, B.M.; Olsen, M.S.; Wang, G.; Zhang, A. Enhancing genetic gain through genomic selection: From livestock to plants. Plant Commun. 2020, 1, 100005. [Google Scholar] [CrossRef]
  36. Jannink, J.L.; Lorenz, A.J.; Iwata, H. Genomic selection in plant breeding: From theory to practice. Brief. Funct. Genom. 2010, 9, 166–177. [Google Scholar] [CrossRef] [PubMed] [Green Version]
  37. Smith, J.S.C.; Hussain, T.; Jones, E.S.; Graham, G.; Podlich, D.; Wall, S.; Williams, M. Use of doubled haploids in maize breeding: Implications for intellectual property protection and genetic diversity in hybrid crops. Mol. Breed. 2008, 22, 51–59. [Google Scholar] [CrossRef]
  38. Lorenzana, R.E.; Bernardo, R. Accuracy of genotypic value predictions for marker-based selection in biparental plant populations. Theor. Appl. Genet. 2009, 120, 151–161. [Google Scholar] [CrossRef]
  39. Battenfield, S.D.; Guzman, C.; Gaynor, R.C.; Singh, R.P.; Pena, R.J.; Dreisigaker, S.; Poland, J.A. Genomic selection for processing and end-use quality traits in the CIMMYT spring bread wheat breeding program. Plant Genome 2016, 9, 1–12. [Google Scholar] [CrossRef] [Green Version]
  40. Xavier, A.; Muir, W.M.; Rainey, K.M. Assessing predictive properties of genome-wide selection in soybeans. G3 2016, 6, 2611–2616. [Google Scholar] [CrossRef] [Green Version]
  41. Isidro, J.; Jannink, J.L.; Akdemir, D.; Poland, J.A.; Heslot, N.; Sorrels, M.E. Training set optimization under population structure in genomic selection. Theor. Appl. Genet. 2015, 128, 145–158. [Google Scholar] [CrossRef] [Green Version]
  42. Meuwissen, T.H.E. Accuracy of breeding values of ‘unrelated’ individuals predicted by dense SNP genotyping. Genet. Sel. Evol. 2009, 41, 35. [Google Scholar] [CrossRef] [PubMed] [Green Version]
  43. Heffner, E.L.; Jannink, J.L.; Sorrells, M.E. Genomic Selection Accuracy Using Multifamily Prediction Models in a Wheat Breeding Program. Plant Genome 2011, 4, 65–75. [Google Scholar] [CrossRef] [Green Version]
  44. Akdemir, D.; Sanchez, J.I.; Jannink, J.L. Optimization of genomic selection training populations with a genetic algorithm. Genet. Sel. Evol. 2015, 47, 38–47. [Google Scholar] [CrossRef] [PubMed] [Green Version]
  45. Akdemir, D.; Isidro-Sanchez, J. Design of training populations for selective genotyping in genomic prediction. Sci. Rep. 2019, 9, 1446. [Google Scholar] [CrossRef]
  46. Rincent, R.; Laloë, D.; Nicolas, S.; Altmann, T.; Brunel, D.; Revilla, P.; Rodriguez, V.M.; Moreno-Gonzales, J.; Melchinger, A.E.; Bauer, E. Maximizing the reliability of genomic selection by optimizing the calibration set of reference individuals: Comparison of methods in two diverse groups of maize inbreds (Zea mays L.). Genetics 2012, 192, 715–728. [Google Scholar] [CrossRef] [Green Version]
  47. Tayeh, N.; Klein, A.; Le Paslier, M.C.; Jacquin, F.; Houtin, H.; Rond, C.; Chabert-Martinello, M.; Magnin-Robert, J.B.; Marget, P.; Aubert, G.; et al. Genomic prediction in pea: Effect of marker density and training population size and composition on prediction accuracy. Front. Plant Sci. 2015, 6, 941. [Google Scholar] [CrossRef] [PubMed] [Green Version]
  48. Bastiaansen, J.; Coster, A.; Calus, M.; Van Arendonk, J.; Bovenhuis, H. Long-term response to genomic selection: Effects of estimation method and reference population structure for different genetic architectures. Genet. Sel. Evol. 2012, 44, 3. [Google Scholar] [CrossRef] [Green Version]
  49. Dekkers, J.C.M. Application of genomics tools to animal breeding. Curr. Genomics 2012, 13, 207–212. [Google Scholar] [CrossRef] [PubMed] [Green Version]
  50. De los Campos, G.; Hickey, J.M.; Pong-Wong, R.; Daetwyler, H.D.; Calus, M.P. Whole-genome regression and prediction methods applied to plant and animal breeding. Genetics 2013, 193, 327–345. [Google Scholar] [CrossRef] [Green Version]
  51. Pérez, P.; de los Campos, G. Genome-wide regression and prediction with the BGLR statistical package. Genetics 2014, 198, 483–495. [Google Scholar] [CrossRef] [PubMed]
  52. Jia, Y.; Jannink, J.L. Multiple-trait genomic selection methods increase genetic value prediction accuracy. Genetics 2012, 192, 1513–1522. [Google Scholar] [CrossRef] [PubMed] [Green Version]
  53. Montesinos-López, O.A.; Montesinos-López, A.; Pérez-Rodríguez, P.; de los Campos, G.; Eskridge, K.; Cross, J. Threshold models for genome-enabled prediction of ordinal categorical traits in plant breeding. G3 Genes Genomes Genet. 2015, 5, 291–300. [Google Scholar] [CrossRef] [Green Version]
  54. Bernardo, R. Genome wide selection when major genes are known. Crop Sci. 2014, 54, 68–75. [Google Scholar] [CrossRef]
  55. Spindel, J.E.; Begum, H.; Akdemir, D.; Collard, B.; Redoña, E.; Jannink, J.; McCouch, S. Genome-wide prediction models that incorporate de novo GWAS are a powerful new tool for tropical rice improvement. Heredity 2016, 116, 395–408. [Google Scholar] [CrossRef] [PubMed] [Green Version]
  56. Bian, Y.; Holland, J.B. Enhancing genomic prediction with genome-wide association studies in multiparental maize populations. Heredity 2017, 118, 585–593. [Google Scholar] [CrossRef]
  57. Larkin, D.L.; Holder, A.L.; Mason, R.E.; Moon, D.E.; Brown-Guedira, G.; Price, P.P.; Dong, Y. Genome-wide analysis and prediction of fusarium head blight resistance in soft red winter wheat. Crop Sci. 2020, 60, 2882–2900. [Google Scholar] [CrossRef]
  58. Herter, C.P.; Ebmeyer, E.; Kollers, S.; Korzun, V.; Würschum, T.; Miedaner, T. Accuracy of within-and among-family genomic prediction for Fusarium head blight and Septoria tritici blotch in winter wheat. Theor. Appl. Genet. 2019, 132, 1121–1135. [Google Scholar] [CrossRef]
  59. Comeau, A.; Langevin, F.; Caetano, V.R.; Haber, S.; Savard, M.E.; Voldeng, H.; Fedak, F.; Dion, Y.; Rioux, S.; Gilbert, J.; et al. A systemic approach for the development of FHB resistant germplasm accelerates genetic progress. Cereal Res. Commun. 2008, 36, 5–9. [Google Scholar] [CrossRef]
  60. DePauw, R.M.; Knox, R.E.; Clarke, F.R.; Clarke, J.M.; McCaig, T.N. Stettler hard red spring wheat. Can. J. Plant Sci. 2009, 89, 945–951. [Google Scholar] [CrossRef]
  61. DePauw, R.M.; Knox, R.E.; McCaig, T.N.; Clarke, F.R.; Clarke, J.M. Muchmore hard red spring wheat. Can. J. Plant Sci. 2011, 91, 1–7. [Google Scholar] [CrossRef] [Green Version]
  62. Graf, R.; Beres, B.L.; Laroche, A.; Gaudet, D.A.; Eudes, F.; Pandeya, R.S.; Badea, A.; Randhawa, H.S. Emerson hard red winter wheat. Can. J. Plant Sci. 2013, 93, 741–748. [Google Scholar] [CrossRef] [Green Version]
  63. Wang, S.; Wong, D.; Forrest, K.; Allen, A.; Chao, S.; Huang, B.E.; Maccaferri, M.; Salvi, S.; Milner, S.G.; Cattivelli, L.; et al. Characterization of polyploid wheat genome diversity using a high-density 90,000 single nucleotide polymorphism array. Plant Biotechnol. J. 2014, 12, 787–796. [Google Scholar] [CrossRef] [PubMed] [Green Version]
  64. Endelman, J.B. Ridge regression and other kernels for genomic selection with R package rrBLUP. Plant Genome 2011, 4, 250–255. [Google Scholar] [CrossRef] [Green Version]
  65. Akdemir, D.; Rio, S.; Isidro y Sánchez, J. TrainSel: An R Package for Selection of Training Populations. Front. Genet. 2021, 12, 655287. [Google Scholar] [CrossRef] [PubMed]
  66. Montesinos-López, O.; Montesinos-López, A.; Luna-Vázquez, F.J.; Toledo, F.H.; Pérez-Rodríguez, P.; Lillemo, M.; Crossa, J. An R package for Bayesian analysis of multi-environment and multi-trait multi-environment data for genome-based prediction. G3 Genes Genomes Genet. 2019, 9, 1355–1369. [Google Scholar] [CrossRef] [Green Version]
  67. Van Raden, P.M. Efficient method to compute genomic predictions. J. Dairy Sci. 2008, 91, 4414–4423. [Google Scholar] [CrossRef] [Green Version]
  68. Maulana, F.; Kim, K.S.; Anderson, J.D.; Sorrells, M.E.; Butler, T.J.; Liu, S.Y.; Baenziger, P.S.; Patrick, F.B.; Ma, X.F. Genomic selection of forage agronomic traits in winter wheat. Crop Sci. 2020, 60, 2882–2900. [Google Scholar] [CrossRef]
  69. Zhang, A.; Wang, H.; Beyene, Y.; Semagn, K.; Liu, Y.; Cao, S.; Cui, Z.; Ruan, Y.; Burgueño, J.; Vicente, F.S.; et al. Effect of Trait Heritability, Training Population Size and Marker Density on Genomic Prediction Accuracy Estimation in 22 bi-parental Tropical Maize Populations. Front. Plant Sci. 2017, 8, 1916. [Google Scholar] [CrossRef]
  70. Habier, D.; Fernando, R.L.; Dekkers, J.C.M. Genomic selection using low-density marker panels. Genetics 2009, 182, 343–353. [Google Scholar] [CrossRef] [PubMed] [Green Version]
  71. Tiede, T.; Smith, K.P. Evaluation and retrospective optimization of genomic selection for yield and disease resistance in spring barley. Mol. Breed. 2018, 38, 55. [Google Scholar] [CrossRef]
  72. Desta, Z.A.; Ortiz, R. Genomic selection: Genome-wide prediction in plant improvement. Trends. Plant Sci. 2014, 19, 592–601. [Google Scholar] [CrossRef]
  73. Rutkoski, J.; Poland, J.; Singh, R.P.; Huerta-Espino, J.; Bhavani, S.; Barbier, H.; Rouse, M.N.; Jannink, J.; Sorrells, M.E. Genomic Selection for Quantitative Adult Plant Stem Rust Resistance in Wheat. Plant Genome 2014, 7, 1–10. [Google Scholar] [CrossRef] [Green Version]
  74. Arruda, M.P.; Lipka, A.E.; Brown, P.J.; Krill, A.M.; Thurber, C.; Brown-Guedira, G.; Dong, Y.; Foresman, B.J.; Kolb, F.L. Comparing genomic selection and marker-assisted selection for Fusarium head blight resistance in wheat (Triticum aestivum). Mol. Breed. 2016, 36, 1–11. [Google Scholar] [CrossRef]
  75. Liabeuf, D.; Sim, S.; Francis, D. Comparison of marker-based genomic estimated breeding values and phenotypic evaluation for selection of bacterial spot resistance in tomato. Phytopathology 2018, 108, 392–401. [Google Scholar] [CrossRef] [PubMed] [Green Version]
  76. Rice, B.; Lipka, A.E. Evaluation of RR-BLUP genomic selection models that incorporate peak genome-wide association study signals in maize and sorghum. Plant Genome 2019, 12, 180052. [Google Scholar] [CrossRef] [Green Version]
  77. Haile, J.K.; N’Diaye, A.; Clarke, F.; Clarke, J.; Knox, R.; Rutkoski, J.; Bassi, F.M.; Pozniak, C.J. Genomic Selection for Grain Yield and Quality Traits in Durum Wheat. Mol. Breed. 2018, 38, 75. [Google Scholar] [CrossRef]
  78. Lado, B.; Vázquez, D.; Quincke, M.; Silva, P.; Aguilar, I.; Gutiérrez, L. Resource Allocation Optimization with Multi-Trait Genomic Prediction for Bread Wheat (Triticum aestivum L.) Baking Quality. Theor. Appl. Genet. 2018, 131, 2719–2731. [Google Scholar] [CrossRef] [PubMed] [Green Version]
  79. Lado, B.; Barrios, P.G.; Quincke, M.; Silva, P.; Gutiérrez, L. Modeling genotype × environment interaction for genomic selection with unbalanced data from a wheat breeding program. Crop Sci. 2016, 56, 1–15. [Google Scholar] [CrossRef] [Green Version]
  80. Riedelsheimer, C.; Endelman, J.B.; Stange, M.; Sorrells, M.E.; Jannink, J.L.; Melchinger, A.E. Genomic predictability of interconnected bi-parental maize populations. Genetics 2013, 194, 493–503. [Google Scholar] [CrossRef] [Green Version]
  81. Zaim, M.; Kabbaj, H.; Kehel, Z.; Gorjanc, G.; Filali, M.A.; Belkadi, B.; Nachit, M.M.; Bassi, F.M. Combining QTL analysis and genomic predictions for four durum wheat populations under drought conditions. Front. Genet. 2020, 11, 316. [Google Scholar] [CrossRef] [PubMed]
Figure 1. The effect of training population (TP) size on accuracies of genomic selection for fusarium head blight (FHB)-related traits in (A) Year 2015; (B) Year 2016. Prediction accuracy is the mean value of 100 iterations from the randomly sampling TP of the same size. Days to anthesis (DA), incidence (INC), severity (SEV), Fusarium damaged kernels (FDK), deoxynivalenol (DON) and plant height (HT). Standard error is indicated for each point.
Biology 10 00756 g001
Figure 2. Effects of training population optimization methods on accuracies of fusarium head blight (FHB)-related traits in (A) Year 2015; (B) Year 2016. Training population (TP) with a size of 100 lines was randomly selected or optimized with CDmean or PEVmean algorithms. Days to anthesis (DA), incidence (INC), severity (SEV), Fusarium damaged kernels (FDK), deoxynivalenol (DON) and plant height (HT). Prediction accuracy is the mean value of 100 iterations for each defined TP.
Biology 10 00756 g002
Figure 3. Accuracies of genomic prediction models in (A) Year 2015; (B) Year 2016. Models include five Bayesian’s approaches: BayesA, BayesB, BayesC, Bayesian least absolute shrinkage and selection operator (BL), Bayesian Ridge Regression (BRR) and two other models: reproducing kernel Hilbert space (RKHS) and ridge regression-best linear unbiased prediction (rr-BLUP). Whiskers represent the upper and lower limit, and the box represents the quartiles Q1 (25%), Q2 (median, thick black line within the box), and Q3 (75%). Each model was evaluated by fivefold cross-validations and repeated 10 times. Days to anthesis (DA), incidence (INC), severity (SEV), Fusarium damaged kernels (FDK), deoxynivalenol (DON) and plant height (HT).
Biology 10 00756 g003
Figure 4. Accuracies of genomic prediction incorporating QTL as fixed effects for FHB related traits in (A) Year 2015; (B) Year 2016. Results were shown with the genomics selection (GS) model with the whole marker dataset, marker datasets without QTL peak markers (GS−QTL), and GS prediction with QTL as fixed effects (GS+ QTL). Whiskers represent the upper and lower limit, and the box represents the quartiles Q1 (25%), Q2 (median, thick black line within the box), and Q3 (75%). Each model was assessed by fivefold cross-validations and repeated 10 times. Days to anthesis (DA), incidence (INC), severity (SEV), Fusarium damaged kernels (FDK), deoxynivalenol (DON) and plant height (HT).
Biology 10 00756 g004
Figure 5. Accuracies of genomic prediction with multi-trait model in (A) Year 2015; (B) Year 2016. Whiskers represent the upper and lower limit, and the box represents the quartiles Q1 (25%), Q2 (median, thick black line within the box), and Q3 (75%). Each model was assessed by fivefold cross-validations repeated 10 times. Days to anthesis (DA), incidence (INC), severity (SEV), Fusarium damaged kernels (FDK), deoxynivalenol (DON) and plant height (HT). For FHB resistance traits, their corresponding multi-trait models with combination of INC, SEV, FDK, DON, DA and HT were defined as shown by the legend Models.
Biology 10 00756 g005
Figure 6. Accuracies of genomic prediction with multi-environment model built from multiple years in the same location and predicted for (A) Year 2016; (B) Year 2015. Whiskers represent the upper and lower limit, and the box represents the quartiles Q1 (25%), Q2 (median, thick black line within the box), and Q3 (75%). Each model was assessed by fivefold cross-validations repeated 10 times. 15 and 16 represented the year 2015 and 2016. 15_P16 and 16_P15, models were built from 2015 and 2016 and were used to predict performance across the year of 2016 and 2015. 1516_P15 and 1516_P16, models were built from multiple years 2015 and 2016 and were used to predict the year traits performance in Year 2015 and 2016. Days to anthesis (DA), incidence (INC), severity (SEV), Fusarium damaged kernels (FDK), deoxynivalenol (DON) and plant height (HT).
Biology 10 00756 g006
Figure 7. Accuracies of genomic prediction with multi-environment models built from multiple locations to predict performance across locations in the year 2015 (A) Prediction of traits for Ottawa, Ontario (O); (B) Prediction of traits for Carman, MB (W). Whiskers represent the upper and lower limit, and the box represents the quartiles Q1 (25%), Q2 (median, thick black line within the box), and Q3 (75%). Each model was assessed by fivefold cross-validations repeated 10 times. 15 represented the year 2015. W and O, represented Carman, MB and Ottawa, Ontario. Models built from single environment (SE) at Carman, MB (W), and multiple environment model with two locations, Carman, MB and Ottawa, Ontario (WO) were used to predict traits performance at Ottawa, Ontario (W_PO and WO_PO) and compared to the single environment model at local environment (W), as shown in (A). Models built from single environment (SE) at Ottawa, Ontario (O), and multiple environment model with two locations, Carman, MB and Ottawa, Ontario (WO) were used to predict traits performance at Carman, MB (O_PW and WO_PW) and compared to the single environment model’s prediction at local environment (O), as shown in (B).
Biology 10 00756 g007
Figure 8. Accuracies of genomic prediction within and across populations. Stetter (FS) population was set as reference population and was used to predict performance on Muchmore population (FM) in (A) Year 2015 and Emerson population (FE); (B) in Year 2016 and (C) FM in Year 2016 and (D) FE in Year 2016. Days to anthesis (DA), incidence (INC), severity (SEV), Fusarium damaged kernels (FDK), deoxynivalenol (DON) and plant height (HT). Prediction accuracy is the mean value by fivefold cross-validations repeated 10 times. 0–100% presented lines of tested populations in the TP, increased from 0 to 100 percent (and reference population decreased from 100 to 0%). Standard error is indicated for each point.
Biology 10 00756 g008
Publisher’s Note: MDPI stays neutral with regard to jurisdictional claims in published maps and institutional affiliations.

