
Machine Learning-Based Identification of Colon Cancer Candidate Diagnostics Genes
by
 , , and
Saraswati Koppad
1 ,
,
Annappa Basava
1,
Katrina Nash
2,
Georgios V. Gkoutos
3,4,5,6,7,8 and
Animesh Acharjee
3,4,5,*
1
Department of Computer Science and Engineering, National Institute of Technology Karnataka, Mangalore 575025, India
2
College of Medical and Dental Sciences, University of Birmingham, Birmingham B15 2TT, UK
3
Institute of Cancer and Genomic Sciences, University of Birmingham, Birmingham B15 2TT, UK
4
Institute of Translational Medicine, University of Birmingham, Birmingham B15 2TT, UK
5
NIHR Surgical Reconstruction and Microbiology Research Centre, University Hospital Birmingham, Birmingham B15 2WB, UK
6
MRC Health Data Research UK (HDR UK), Midlands Site, Birmingham B15 2TT, UK
7
NIHR Experimental Cancer Medicine Centre, Birmingham B15 2TT, UK
8
NIHR Biomedical Research Centre, University Hospital Birmingham, Birmingham B15 2TT, UK
*
Author to whom correspondence should be addressed.
Biology 2022, 11(3), 365; https://0-doi-org.brum.beds.ac.uk/10.3390/biology11030365
Submission received: 17 December 2021
/
Revised: 16 February 2022
/
Accepted: 23 February 2022
/
Published: 25 February 2022
(This article belongs to the Special Issue Bioinformatics and Machine Learning for Cancer Biology)
Abstract
:Simple Summary
We developed a predictive approach using different machine learning methods to identify a number of genes that can potentially serve as novel diagnostic colon cancer biomarkers.
Abstract
Background: Colorectal cancer (CRC) is the third leading cause of cancer-related death and the fourth most commonly diagnosed cancer worldwide. Due to a lack of diagnostic biomarkers and understanding of the underlying molecular mechanisms, CRC’s mortality rate continues to grow. CRC occurrence and progression are dynamic processes. The expression levels of specific molecules vary at various stages of CRC, rendering its early detection and diagnosis challenging and the need for identifying accurate and meaningful CRC biomarkers more pressing. The advances in high-throughput sequencing technologies have been used to explore novel gene expression, targeted treatments, and colon cancer pathogenesis. Such approaches are routinely being applied and result in large datasets whose analysis is increasingly becoming dependent on machine learning (ML) algorithms that have been demonstrated to be computationally efficient platforms for the identification of variables across such high-dimensional datasets. Methods: We developed a novel ML-based experimental design to study CRC gene associations. Six different machine learning methods were employed as classifiers to identify genes that can be used as diagnostics for CRC using gene expression and clinical datasets. The accuracy, sensitivity, specificity, F1 score, and area under receiver operating characteristic (AUROC) curve were derived to explore the differentially expressed genes (DEGs) for CRC diagnosis. Gene ontology enrichment analyses of these DEGs were performed and predicted gene signatures were linked with miRNAs. Results: We evaluated six machine learning classification methods (Adaboost, ExtraTrees, logistic regression, naïve Bayes classifier, random forest, and XGBoost) across different combinations of training and test datasets over GEO datasets. The accuracy and the AUROC of each combination of training and test data with different algorithms were used as comparison metrics. Random forest (RF) models consistently performed better than other models. In total, 34 genes were identified and used for pathway and gene set enrichment analysis. Further mapping of the 34 genes with miRNA identified interesting miRNA hubs genes. Conclusions: We identified 34 genes with high accuracy that can be used as a diagnostics panel for CRC.
1. Introduction
Colorectal cancer (CRC) is the third most common cause of death due to cancer and the fourth most commonly diagnosed cancer worldwide [1,2]. Considering demographic estimates, nearly 2.2 million new cases and about 1.1 million deaths are expected by 2030, and the global burden of CRC is estimated to increase by 60% [3]. CRC cancer is a genotype and phenotype heterogeneous disease, characterized by a display of distinct molecular signatures [4]. Around 1.4 million new cases and nearly 700,000 deaths were recorded in 2012 due to colorectal cancer [5].
Advancements in omics technologies, such as microarrays, RNAseq [6], next-generation sequencing (NGS) [7], and mass spectrometry [8], have enabled employing molecular markers for the diagnosis of CRC [9]. For example, recent studies have used gene microarrays, as well as high-throughput sequencing technologies, to explore differential expressing novel genes in colon cancer [10]. Fang-Ze et al. [11] reported that CLCA1 may be a candidate diagnostic and prognostic differentially expressed gene or biomarker for colon cancer. Li et al. [12] identified CDK1 and CDC20 genes as candidate targets for diagnosis of CRC. Most studies reported individual markers such as the CEA, CK19, and CK20 genes [13]. However, the resulting specificity (89%) and sensitivity (78%) of those biomarkers have rendered them unsuitable for the development of a noninvasive diagnostic method for the detection of colon cancer [14]. Dasi et al. [15] and Schiedeck et al. [16] investigated TERT, GCC, MAGEA, TS, CGM2, and L6 as biomarkers for detecting colon cancer, reporting a sensitivity and specificity of around 85% and 95%. Furthermore, Liu et al. [17] identified seven prognostic genes, namely, TIMP1, LZTS3, AXIN2, CXCL1, ITLN1, CPT2, and CLDN23, for the application of novel diagnostic and prognostic biomarkers for the treatment of colon cancer.
Torres et al. [18] investigated the proteome profiling of human and mouse tissue which revealed a novel association of cancer-associated fibroblasts with cancer progression. This study further unveiled the role of the LTBP2, CDH11, OLFML3, CALU, CDH11, and FSTL1 proteins in migration and invasion of CRC and, hence, their use as a biomarker. Moreover, Kim et al. (2019) [19] identified abnormal concentrations of the taurine, alanine, 3-aminoisobutyrate, and citrate metabolites from urine samples in CRC patients.
Although the various molecular characteristics, biological markers, and therapeutic targets of colon cancer previously discovered have contributed significantly to its diagnosis and treatment, the biological complexity, outcome severity, and high metastasis of this complex disease necessitate further predictive and prognostic biomarker identification [20,21]. Currently, CRC prognosis is based on a classification of clinicopathological features, including, tumor, node, metastasis (TNM) stage, cancer numbers, histologic type (mucinous carcinoma or signet ring-cell carcinoma), histology type, tumor grade, tumor size, number of lymph nodes, and tumor location [22]. Furthermore, the right and left localization and the excision of lymph nodes are included in the histological type and grading in the prognosis of colorectal cancer [23].
This study aimed to design and develop novel ML-based, computationally efficient platforms to study CRC gene associations and identify signature genes used as diagnostics markers across transcriptomics datasets.
2. Methods
In this study, we used three gene expression datasets (GSE44861, GSE20916, GSE113513), available from the GEO database [24], and applied six different machine learning methods (Adaboost, ExtraTrees, logistic regression, naïve Bayes, random forest, and XGBoost) to identify genes that can be used as diagnostics markers. We used different combinations of the GSE44861, GSE20916, and GSE113513 datasets for training and validation. We then performed an enrichment analysis and associated the resulting gene signatures with miRNA. Lastly, we estimated the number of samples required for the markers selected for the future validation experiments.
2.1. Data
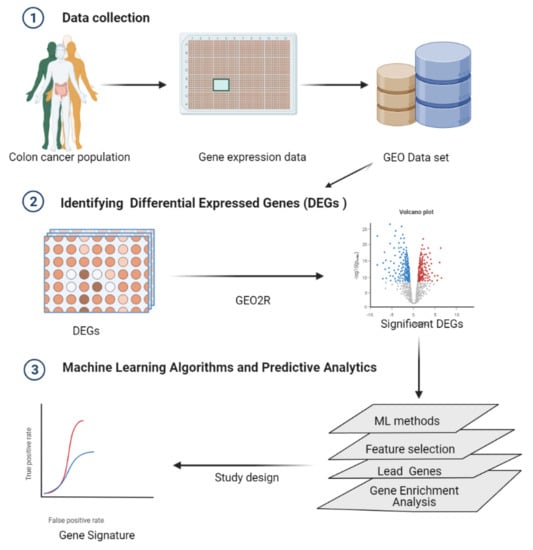
The gene expression matrixes and clinical data were downloaded from the GEO database repository (https://0-www-ncbi-nlm-nih-gov.brum.beds.ac.uk/geo/) accessed on 1 October 2020. The details of the datasets used in this study are summarized in Table 1. The detailed workflow of the methods and process used in this study is presented in Figure 1.
Differentially Expressed Genes (DEGs) Identified by GEO2R
GEO2R (http://0-www-ncbi-nlm-nih-gov.brum.beds.ac.uk/geo/geo2r, accessed on 5 January 2021), an online data analysis tool, was used to identify differentially expressed genes (DEGs) between colon cancer patients and healthy controls. We used three GEO series, namely GSE20916, GSE44861, and GSE113513, and identified differential expressed genes. Genes without a corresponding gene symbol and genes with more than one probe set were removed. Adjusted p-values ≤ 0.0001 were considered statistically significant. Subsequently, the top 500 most statistically significant DEG genes from each dataset were selected for further analysis.
2.2. Machine Learning Algorithms and Predictive Analytics
Six different machine learning algorithms, namely, Adaboost [28], ExtraTrees [29], logistic regression [30,31], naïve Bayes (NB) classifier [32], random forest [33], and XGBoost [34], were employed to develop models using the selected GEO datasets (GSE44861, GSE20916, and GSE113513). These datasets were employed to generate different combinations of training and test data to assess the derived models’ performance.
The python Scikit-learn libraries [35] were employed for the implementation of the different classifiers and feature selection methods.
2.2.1. Hyperparameter Optimization
We used the GridSearchCV [35] function to find the optimal values for each model hyperparameter. GridSearchCV is a function, available as part of the Scikit-learn’s library, that caters the looping through predefined hyperparameters and the fitting of the model on the training set. GridSearchCV uses all the combinations of the predefined parameter values and evaluates a model’s performance for each combination using cross-validation. The accuracy results obtained for every hyperparameter combination can then be used to identify the best-performing model.
2.2.2. Machine Learning Model Evaluation
The analysis was carried out using three different GEO datasets (GSE44861, GSE20916, and GSE113513) as training and testing data for performance comparison in a combinatorial way with six different machine learning models including logistic regression [36], naïve Bayes [37], random forest [38], ExtraTrees [39], Adaboost [40], and XGBoost [41]. Each model was evaluated with different evaluation metrics such as precision, recall [42], specificity, sensitivity [43], F1 score, AUROC [44], and accuracy.
We also included multiple validation strategies to validate the performance of the model. The most commonly used k-fold cross-validation technique was applied in our experimental work. In the k-fold (here, k = 5) cross-validation technique, the dataset is randomly split into k subsets, whereby k − 1 subsets are used for training, and the remaining subset is used for testing; the is process repeated k times. In addition to this, we used resampling with the bootstrap method and leave-one-out cross-validation (LOOCV) in our experimental work for validation of the model performance. The model performance was evaluated for the mean value of performance metrics over 100 iterations. In the LOOCV method, the dataset is split into training data considering all data samples, excluding one data sample used as the test dataset. The model developed with training data finally measures the mean performance value for the repeated process. The experimental results in this method for different models are also provided in Supplementary Table S1.
2.2.3. Feature Selection
We performed feature selection using two methods, mean decrease in impurity (MDI) [45] and Boruta [46], for the selection of important genes. MDI or Gini importance [47] computes the total reduction in loss or impurity contributed by all splits for a given feature. This method evaluates the importance of a variable Xm for predicting Y by adding up the weighted impurity decreases p(t) ∆i(st,t) for all nodes t where Xm is used, averaged over all NT trees in the forest as shown in the equation below.
where p(t) is the proportion Nt/N of samples reaching t, and v(st) is the variable used in split st. When using the Gini index as an impurity function, this measure is known as the Gini importance or mean decrease Gini. MDI is computationally very efficient and has been widely used in a variety of applications. Gini importance represents the total decrease in node impurity, i.e., how much the model fit or accuracy decreases when dropping a variable. A larger decrease in node impurity results in a more significant variable. The top 15 genes across 10 iterations were selected with the MDI technique.
In addition to MDI, we also used Boruta which is a feature selection algorithm and works as a wrapper algorithm around random forest [48]. It attempts to capture all the important, interesting features from a dataset with respect to an outcome variable and can be used in combination with tree-based ensemble learning algorithms.
2.3. Gene Enrichment Analysis
Gene ontology (GO) enrichment analysis of DEGs was carried out using the FunRich (functional enrichment analysis tool) (http://www.funrich.org/, accessed on 25 January 2021). DEGs were classified according to the biological process and cellular component GO collections. Biological terms with an FDR p-value lower than 0.05 were considered significantly enriched. Correction for multiple hypothesis testing was carried out by the Benjamini–Hochberg method.
2.3.1. Association of the Gene Markers with miRNA
We used the NetworkAnalyst (www.networkanalyst.ca, accessed on 28 January 2021) [49] tool and more specifically the gene–miRNA module that employs the miRTarBase v8 database to calculate the number of the connections or links for each gene, also termed degrees.
2.3.2. Sample Size Estimates for Future Validation Experiments
We then used PowerTools (https://joelarkman.shinyapps.io/PowerTools/, accessed on 10 February 2021) [50] to estimate the number of samples required for future experiments.
3. Results
3.1. Differential Expressed Genes (DEGs)
We identified the top 500 DEGS across each of the GEO datasets examined. For the GSE44861 dataset, 324 genes were found to be upregulated and 176 genes were downregulated, while, for the GSE20916 and the GSE113513 datasets, 171 and 223 genes were upregulated and 329 and 277 genes were downregulated, respectively. The identified differentially expressed genes and their respective p-values, as well as the fold changes, are listed in Supplementary Table S2.
Performance Evaluation
For each of the three GEO datasets examined, their respective DEGs were used as features across six different classification models, namely, Adaboost, ExtraTrees, logistic regression, naïve Bayes classifier, random forest, and XGBoost. The performance of these models was evaluated against different combination of training and test datasets.
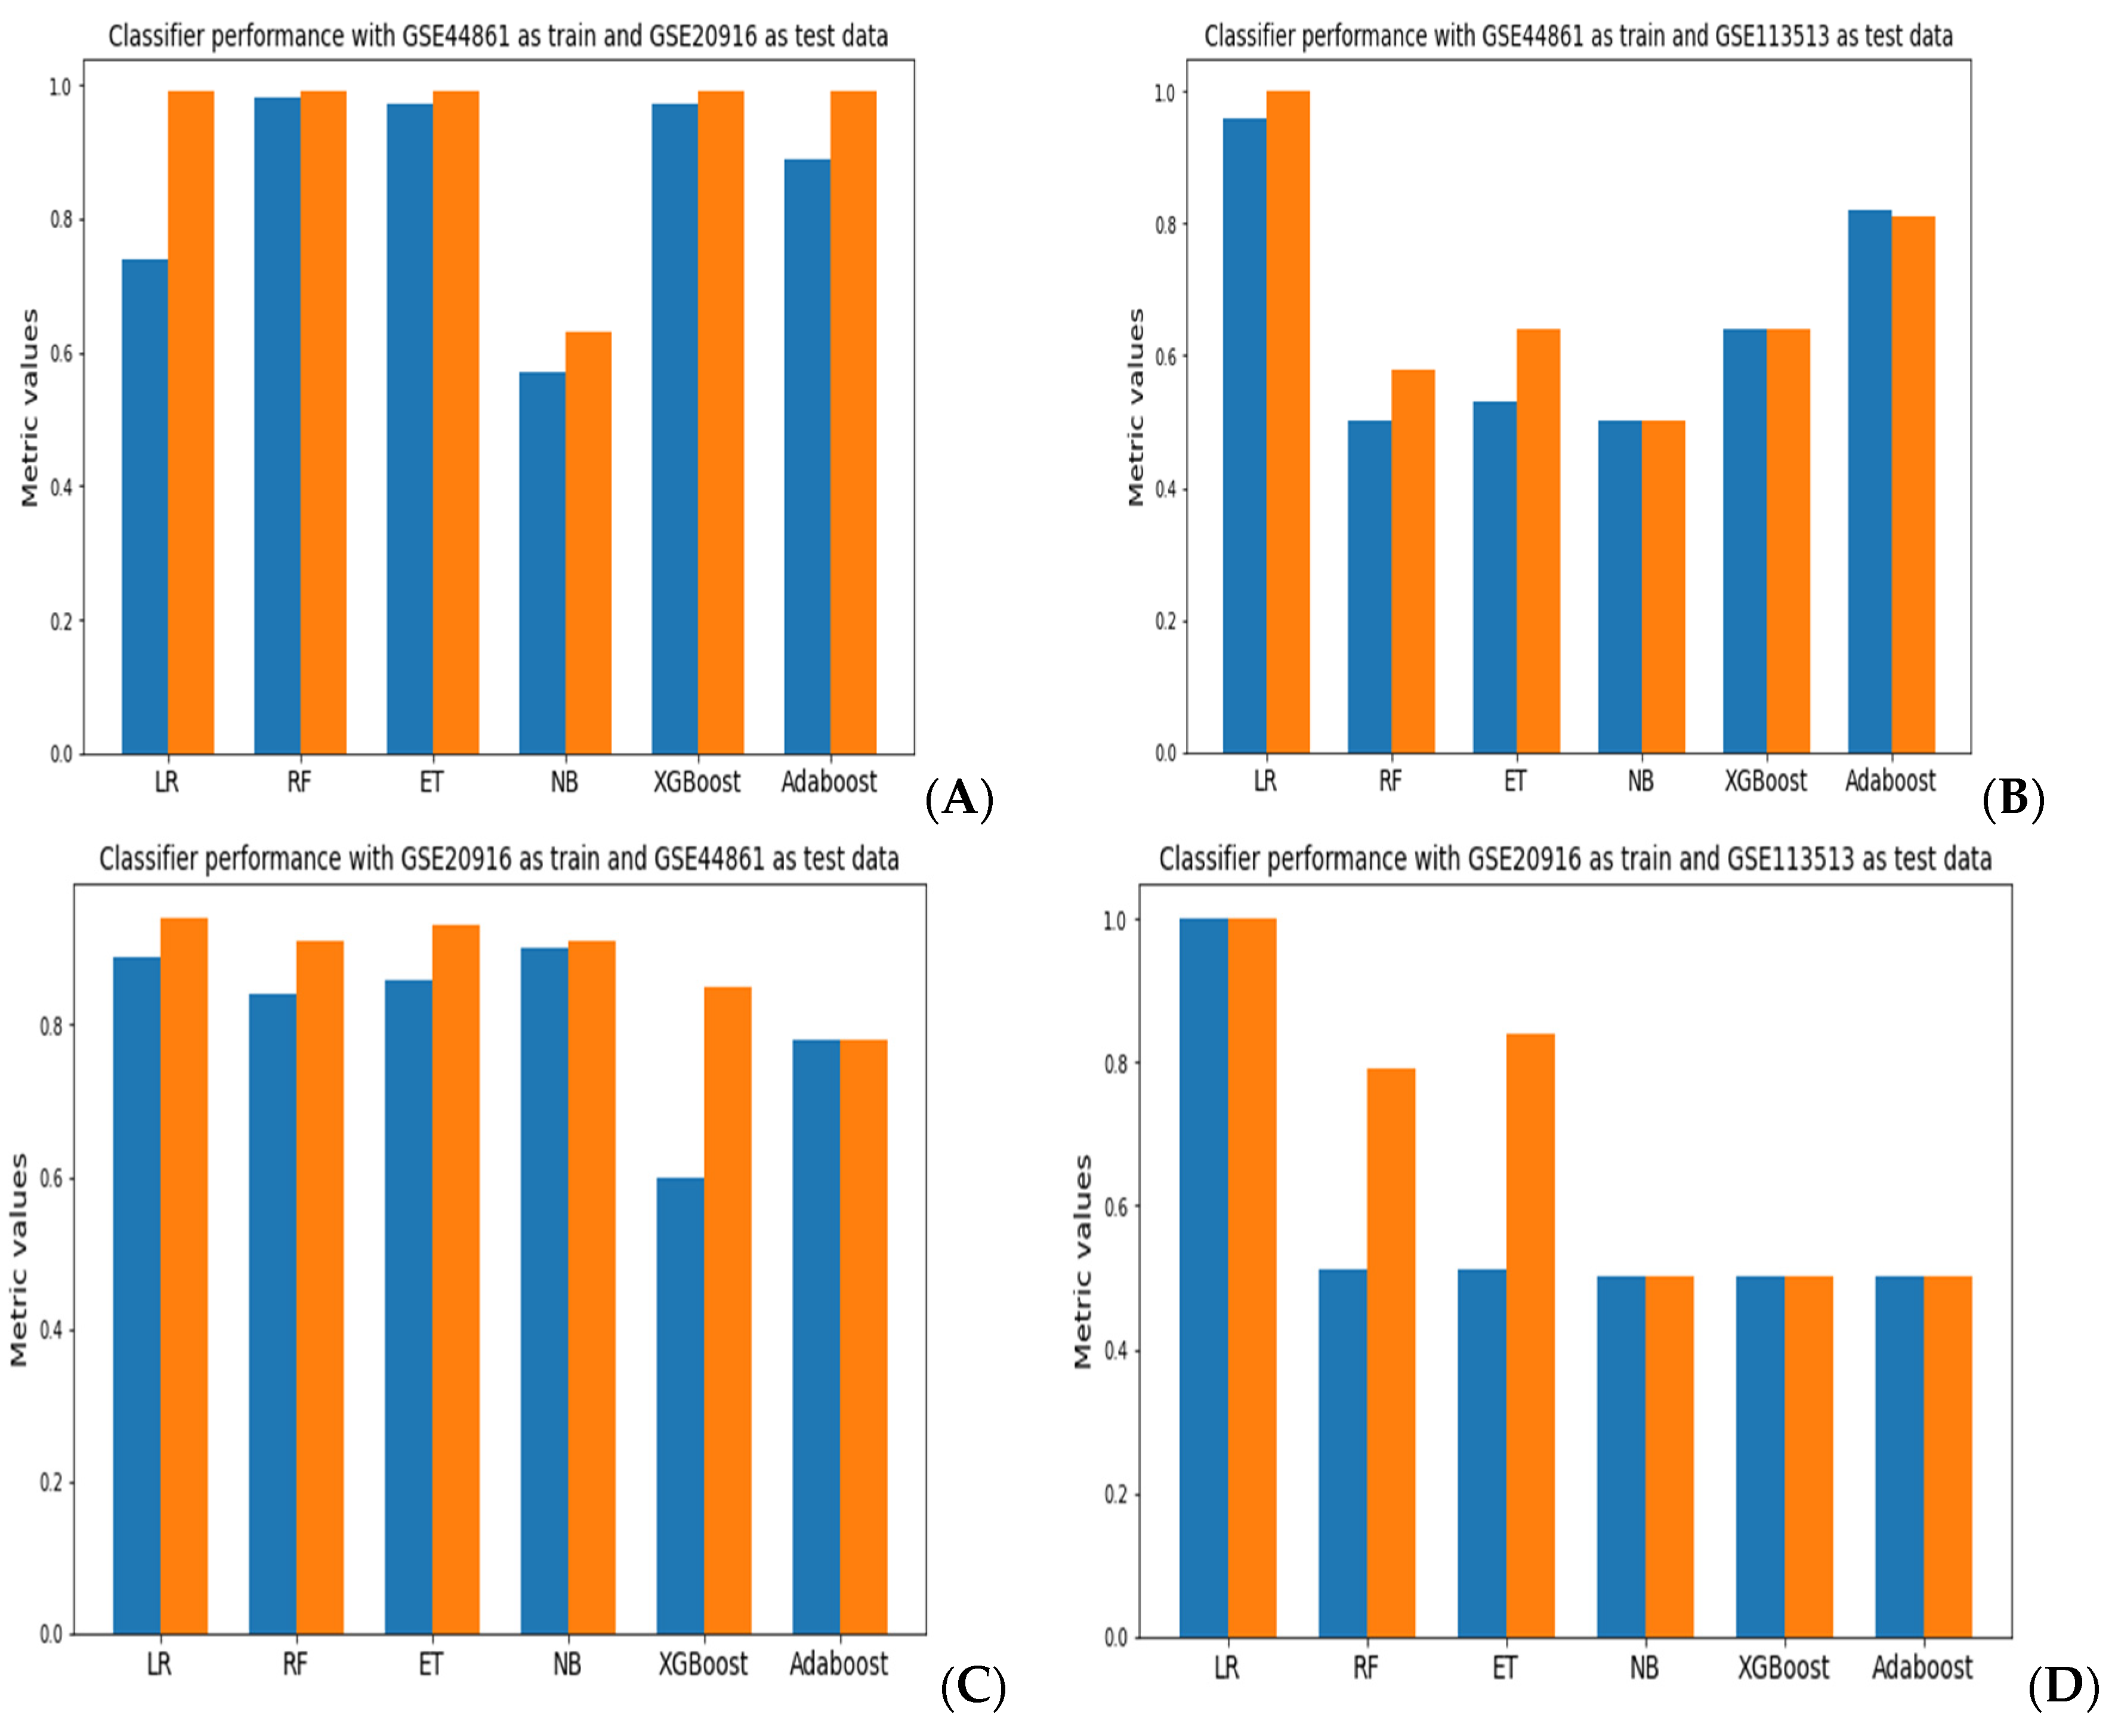
The results of the different performance metrics for each classifier are presented in Supplementary Table S1. With GSE44861 as training data and GSE20916 as test data, the random forest model achieved better performance with an accuracy of 98.2% and 90% using the bootstrap and LOOCV methods, respectively. With GSE44861 as training and GSE113513 as testing data, the logistic regression model achieved an accuracy of 96.4% and 84% using bootstrap and LOOCV, respectively. When we used GSE20916 as training data and GSE44861 as testing data, the naïve Bayes classifier achieved an accuracy of 90.1% and 96% using bootstrap and LOOCV, respectively. With GSE20916 as training data and GSE113513 as testing data, logistic regression resulted in better performance. With GSE113513 as training and GSE44861 as testing data, the ExtraTree classifier model achieved better performance. With GSE113513 as training data and GSE20916 as testing data, none of the models achieved good performance.
A comparison of the accuracy and AUROC results for each model evaluations is presented in Figure 2. When using GSE44861 as training data and GSE20916 as test data, the random forest classifier achieved the best performance across all classifiers with an accuracy of 98.2% and an AUROC of 99.9% (Figure 2A). With GSE44861 as training data and GSE113513 as test data, a logistic regression model achieved an accuracy of 96.4% and an AUROC of 99% (Figure 2B). When using GSE20916 as training data and GSE44861 as test data, the naïve Bayes classifier exhibited the best performance with an accuracy of 90.1% and AUROC of 90%, as shown in Figure 2C. Using GSE20916 as the training data and GSE113513 as the test data, the logistic regression model achieved the best performance (Figure 2D). Lastly, with GSE113513 as the training data and GSE44861 as the test data, as well as with GSE113513 as the training data and GSE20916 as the test data, all classifiers achieved an accuracy of 50% to 51% and an AUROC of 50% to 51%, apart from logistic regression, which resulted in an AUROC of 99% (Figure 2E,F).
The AUROC plots for the models that had the best performance across the different training and test data combinations are presented in Figure 3. Across the three datasets tested, random forest and logistic regression achieved the best performance when we combined GSE44861 and GSE20916 datasets as training and test data. However, none of the classifiers assessed achieved a good performance using the GSE113513 dataset. The best performances of each classification model are represented as AUROC plots. Overall, the random forest models exhibited consistently better performance across all classification models tested.
3.2. Gene Selection
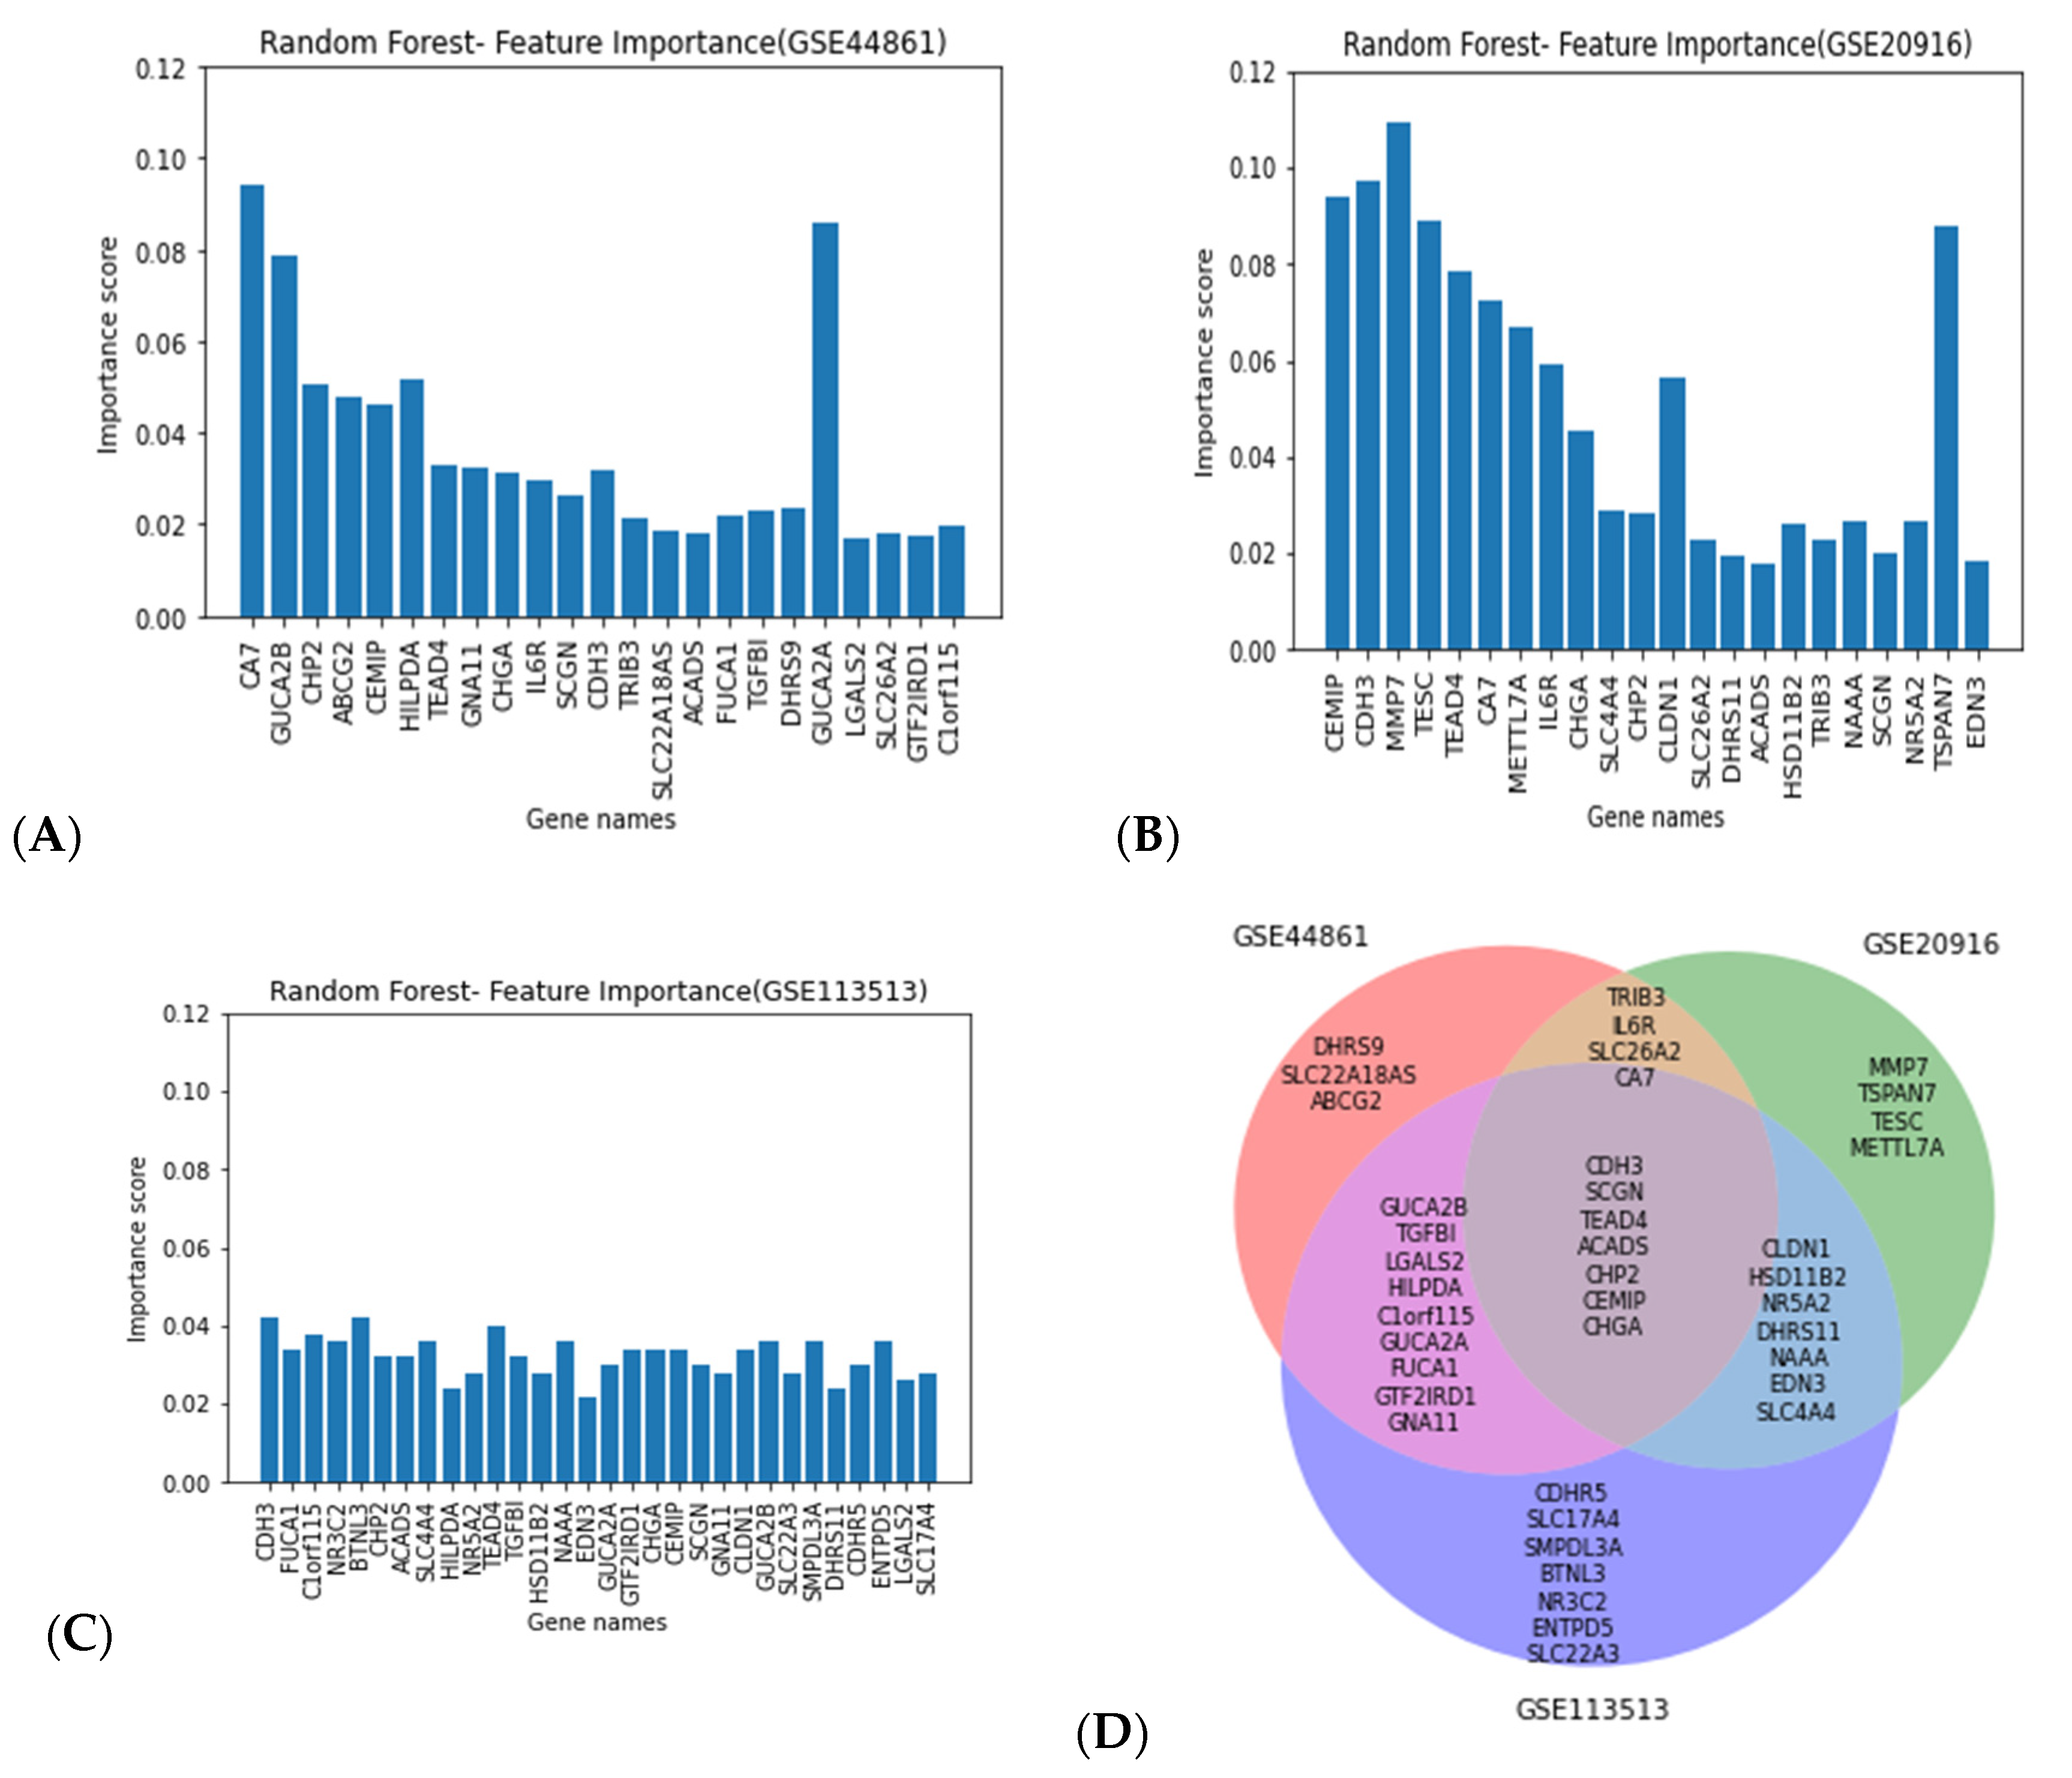
Random forest classification, on the basis of the performance previously reported, was applied in combination with MDI to select the top 15 genes with the highest importance score in 10 different iterations. We then identified the union of all the genes selected from all 10 iterations. Figure 4 shows the important genes selected using the mean decrease in impurity (MDI) technique in combination with the random forest classifier. Figure 4A depicts the important genes selected using the GSE44861 dataset, while Figure 4B presents the important genes selected using the GSE20916 dataset.
Gene Ontology (GO) Enrichment Analysis
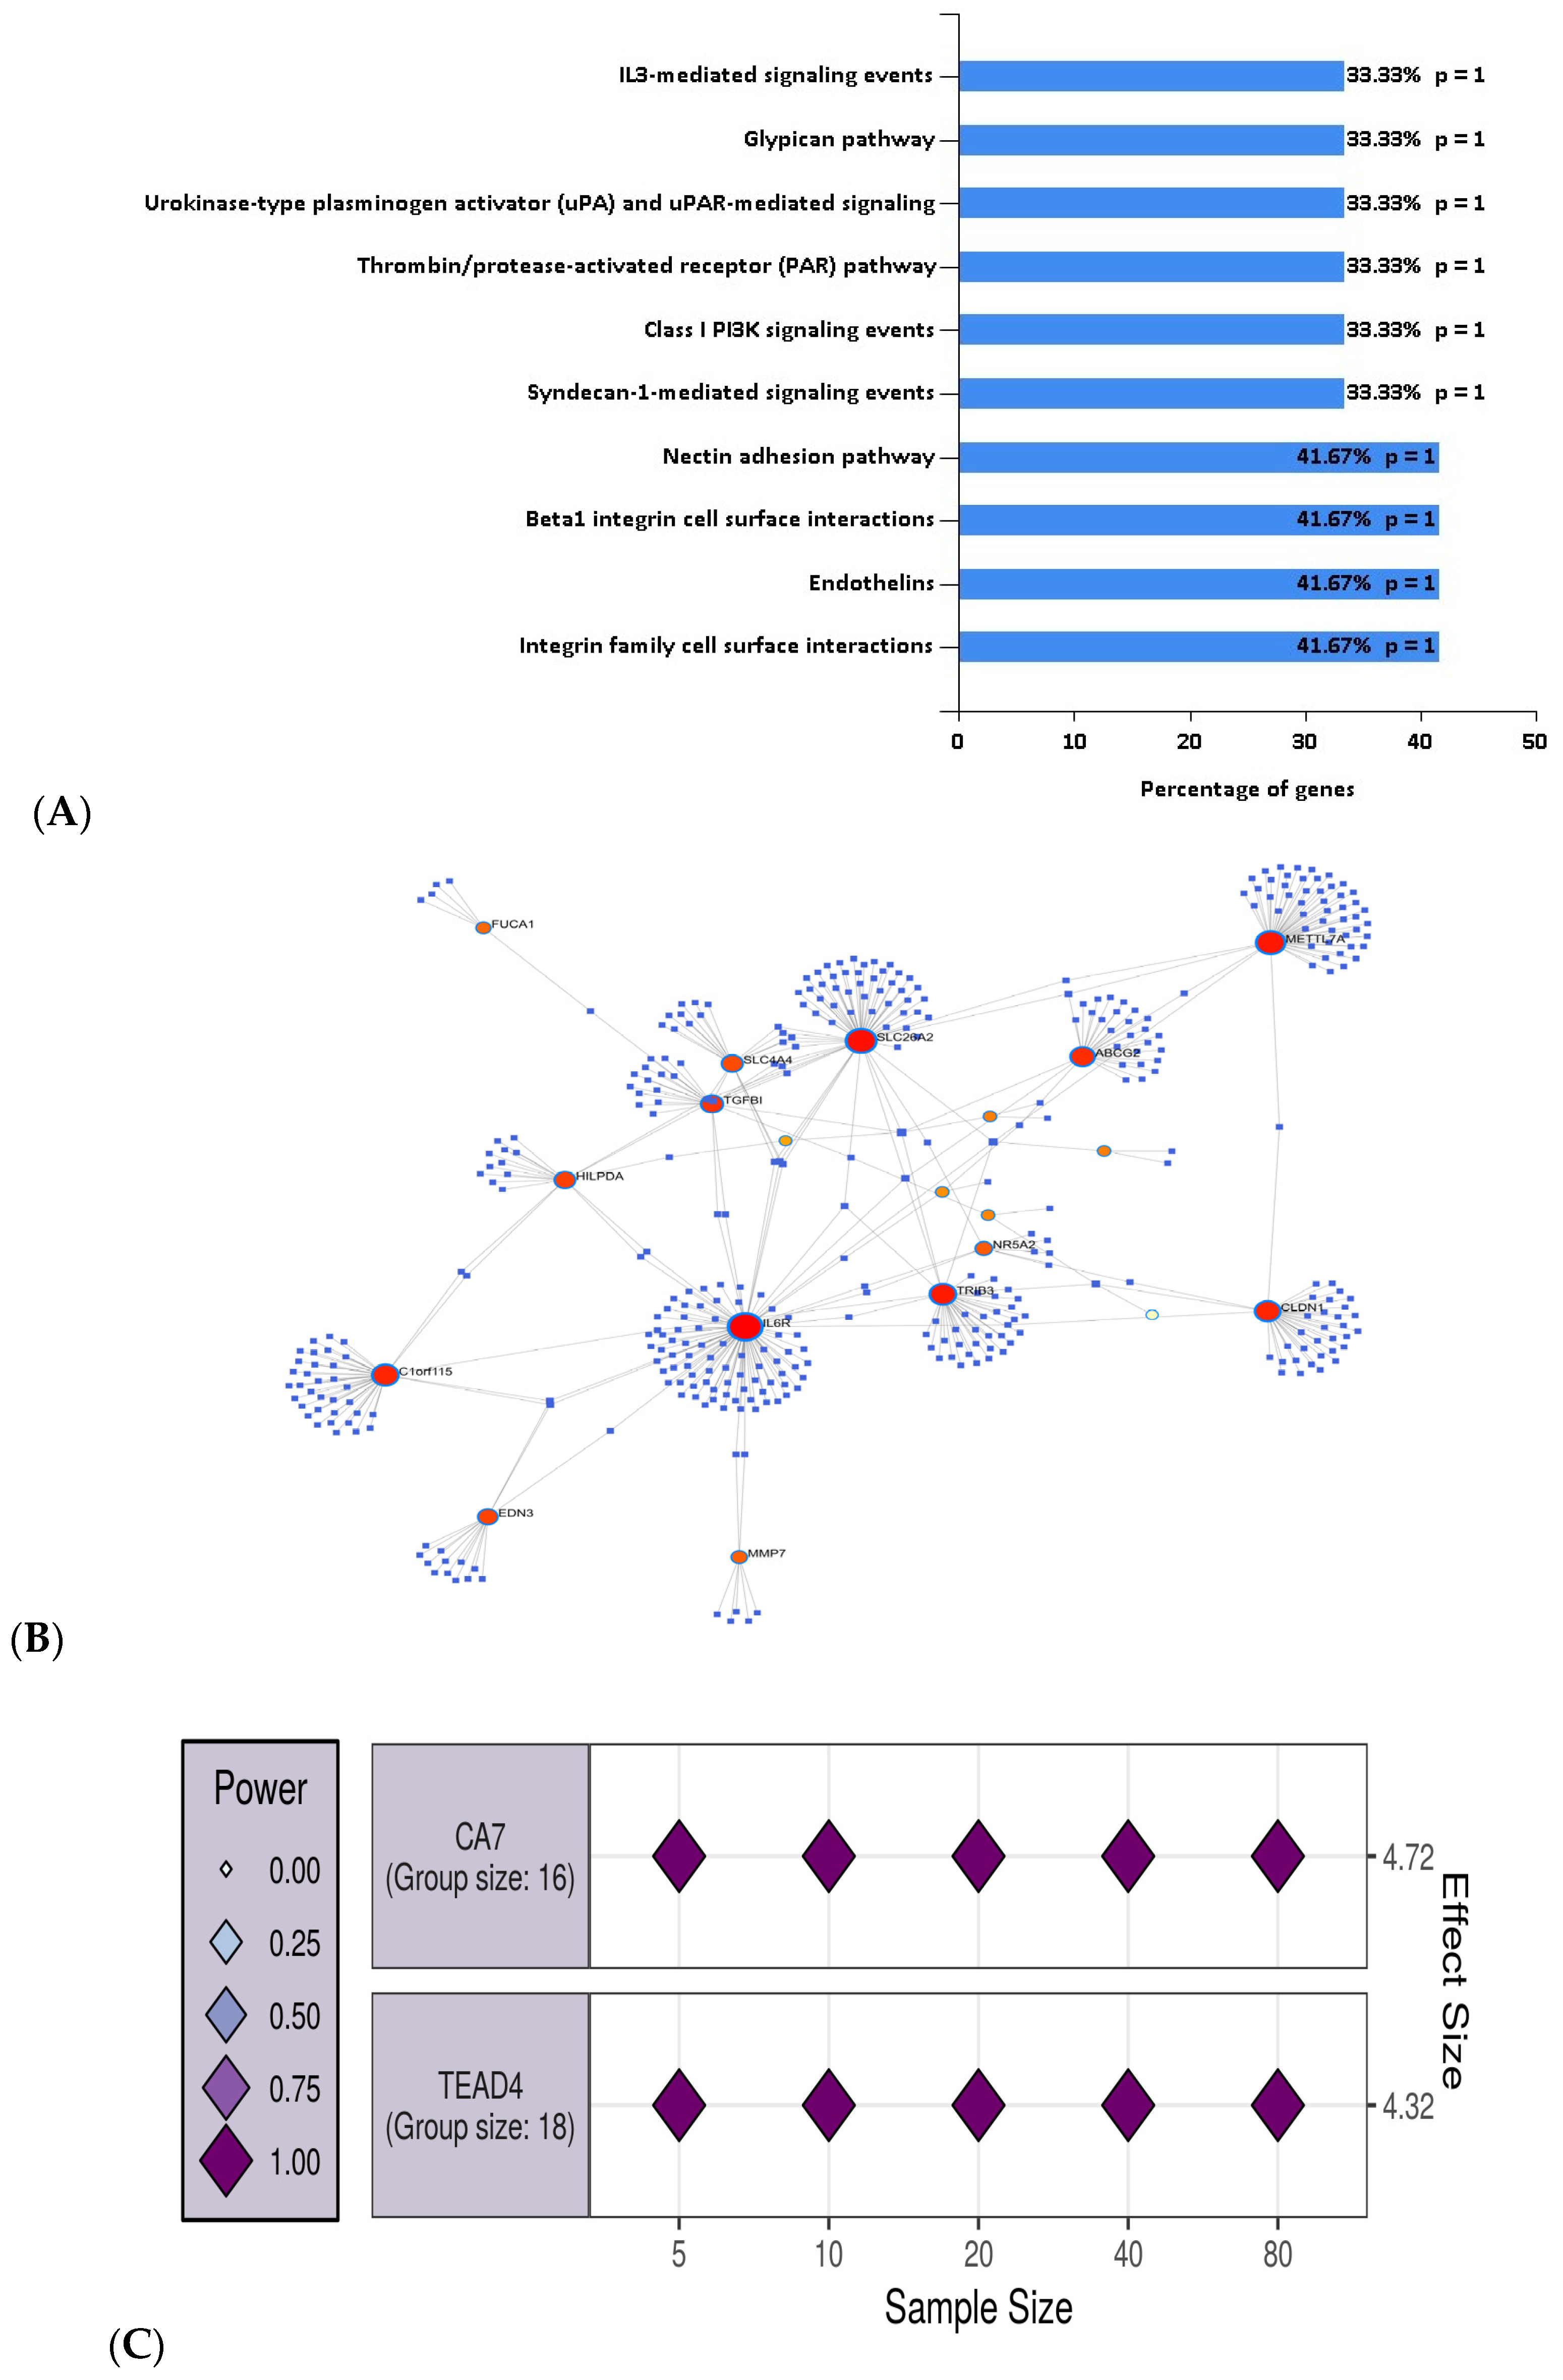
MDI in combination with the random forest classifier for feature selection resulted in the selection of 34 genes that were used for the pathway and gene set enrichment analysis. These genes were found to be associated with a number of molecular functions including cell adhesion molecule activity (CDH3 and CLDN), transporter activity (ABCG2, SLC22A18AS, and SLC26A2), catalytic activity (CA7, DHRS9, and HSD11B2) and oxidoreductase activity (ACADS and DHRS11). The pathways for which 34 genes were found to be enriched are presented in Figure 5A.
3.3. Associating Selected Genes with miRNA Using NetworkAnalyst
We mapped the 34 identified genes using the NetworkAnalyst tool and found that 19 genes out of 34 genes formed hub genes (Figure 5B). For example, IL6R had the highest number of miRNA interactions (degree, 94). A list of the identified genes and their miRNA associations is provided in the Supplementary Table S3.
Lastly, we also performed a power analysis over the GSE44861 dataset. For this purpose, we used the 34 genes that were identified and ranked by the random forest algorithm. We then applied hierarchical clustering over these 34 genes and identified two clusters. We selected the genes that presented the highest correlation across normal vs. cancer samples.
CA7 and TEAD4 were selected as representative genes across the two clusters as they had the highest correlation with the normal vs. CRC samples (i.e., lowest p-values). For both clusters of genes including CA7 and TEAD4, we estimated N = 5 samples, required for both control and CRC samples. Figure 5C represents the number of the estimated samples required for genes from each cluster.
4. Discussion
The three GEO datasets used in our experimental work with six different machine learning methods were validated across different combinations of training and test datasets. The performance of each model was reported and compared using a number of performance metrics, such as accuracy, sensitivity, specificity, AUC, etc. The random forest method showed the best performance against the GSE44861 and GSE20916 datasets when used as a combination of training and test data. It was less prone to overfitting when compared to the other methods used. This method has also been applied successfully in other diseases such as NAFLD [51], obesity [52], and IBD [53]; therefore, we applied the random forest method to select the important features from these two datasets.
The GSE113513 dataset had a lower number of samples or observations compared to the GSE44861 and GSE20916 datasets, which resulted in lower performance compared to the other datasets, thus indicating an overfitting problem. We used multiple approaches to protect against the overfitting problem, such as the widely used fivefold cross-validation, LOOCV, and bootstrapping. Compared with k-fold cross validation and LOOCV, the bootstrap method could use the entire sample in model development and validation, thus helping to estimate optimism and measure overfitting. The optimism-corrected estimated performance by the bootstrap method is relatively stable because it uses the full sample size and the bootstrap samples vary in composition [54]. We incorporated 100 iterations with the bootstrap method for the experimental work, and each of these evaluation metrics were averaged over these 100 iterations. Datasets GSE44861 and GSE20961 were observed to perform better, and the random forest method was chosen for the feature selection process.
The gene ontology enrichment analysis identified several genes and their associated pathways, most notably, cell adhesion molecule activity, transporter activity, catalytic activity, and oxidoreductase activity. CDH3, a gene encoding P-cadherin that forms a major component of the adherens junctions that are essential for cell adhesion, has been identified as being upregulated in CRC in multiple studies and as a diagnostic or prognostic marker [55,56]. Conversely, CLDN, encoding for the claudin protein forming tight junctions, has been found to be a potential diagnostic marker with downregulation in CRC patients [56,57]. Furthermore, previous research has postulated that the HDS11B2 gene, involved in catalytic activity pathways, plays a vital role in migration, invasion, and metastasis of CRC [58]. Other genes identified to be involved in catalytic activity (CA7 and DHRS9) have been found to be downregulated in CRC cells, and have been proposed as promising diagnostic and/or prognostic markers [59,60]. Genes associated with transporter activity have also been identified in existing studies. Of particular note is the upregulation of the ABCG2 gene, which has been postulated to play a protective role against oxidative stress through cell signaling pathways, which may explain why it has been found to be upregulated in CRC [61,62,63]. Similarly, genes involved in oxidoreductase activity (ACADS and DHRS11) have been found to be downregulated in previous studies [64,65]. These genes are involved in fatty-acid metabolism and energy production within mitochondria; thus, their downregulation may partially explain the changes in metabolism often observed in cancer cells [66]. Many of the identified genes have been previously associated with colon cancer via miRNA interactions. Multiple studies, including Bian et al., Hua et al., and Xu et al., have reported that serum IL-6 may be a potential biomarker for CRC diagnosis and a miR-34a target [67]. IL6R has also been implicated in other cancer types, including prostate cancer [68]. Another gene, SLC4A4, was found to be significantly correlated with shorter survival of CRC patients and a marker of poorer progression for patients with breast cancer, lung cancer, gastric cancer, and ovarian cancer. This suggests a potential role of SLC4A4 in tumor suppression, as well as in prognostic prediction in multiple malignancies, including CRC, thus representing a potential novel therapeutic CRC target [69]. Yang et al. (2019) [70] identified a similar SLC4A4 expression association and proposed the expression of six further genes, namely, SGCG, CLDN23, CCDC78, SLC17A7, OTOP3, and SMPDL3A, as novel colon cancer prognostic biomarkers. Zhang et al. (2020) [71] reported that hsa_circRNA_001587 upregulates SLC4A4 expression to inhibit migration, invasion, and angiogenesis of pancreatic cancer cells via binding to microRNA-223. Furthermore, Mencia et al. (2011) reported miR-224 to be one of the most differentially expressed miRNAs associated with SLC4A4 [72]. Andersen et al. (2015) [73] reported changes in gene expression levels (high ABCC2 and low ABCG2) as early events in the colon adenoma–carcinoma sequence. Moreover, miR-132 has been reported to regulate the SIRT1/CREB/ABCG2 signaling pathway, contributing to cisplatin resistance and serving as a novel therapeutic target against gastric cancer [74]. Cherradi et al. found CLDN1 to be significantly overexpressed (p < 0.001) in CRC samples, and they proposed it as a new potential therapeutic target of miR-7-2 [75]. Lastly, Miwa et al. (2011) [76] reported CLDN1 as a target of TCF/LEF signaling, while Singh et al. (2011) [77] suggested the involvement of CLDN1 in the regulation of the WNT signaling pathway.
Our approach utilized a limited number of public datasets, and the potential causal relationships identified necessitate experimental validation. We did not consider the effect of multiple factors, such as age, gender, ethnicity, and tumor grade and stage, on gene expression patterns since we focused only on genes that have been previously reported as having significant variation between control and cancer samples. In the context of translational medicine [78], further research is required to investigate the selected prognostic/diagnostic signature’s clinical utility in predicting clinical outcomes in various tumor types.
In CRC diagnostics, colonoscopy is the current gold-standard screening method. However, this approach has some limitations that include internal hemorrhage, colonic perforation, and cardiorespiratory problems [79].
Another approach is the guaiac fecal occult blood test (gFOBT) [80], which detects hemoglobin peroxidase activity in the feces, and it is the most often used noninvasive screening procedure. Although FOBT is a simple and inexpensive way to screen for CRC, it has a high percentage of false positives and false negatives.
As a result, alternative CRC screening approaches that are cost-effective, noninvasive, easily quantifiable, and accurate are urgently needed. Thus, gene signature-based biomarkers in the clinical applications in CRC are required for early cancer detection, prognostic stratification, and surveillance [80]. Genes identified in this study will need to go through targeted validation experiments using qPCR. A new trial needs to be set up to replicate the gene signature’s effect. This step will ensure the clinical efficacy of those markers identified and will allow a better clinical decision on CRC [81].
5. Conclusions
This study aimed to identify novel genes associations with CRC that can potentially be used as diagnostic markers in translational research. To achieve this, we applied a predictive analytics approach that employed a variety of machine learning methods. In addition, we estimated the required number of samples for future validation experiments.
Supplementary Materials
The following supporting information can be downloaded at https://0-www-mdpi-com.brum.beds.ac.uk/article/10.3390/biology11030365/s1: Table S1. The experimental results from different models and performance comparison of all methods across training and test datasets; Table S2. List of identified differentially expressed genes and their respective p-values, and the fold changes; Table S3. A list of the identified genes and their miRNA associations.
Author Contributions
S.K. and A.A. performed the machine learning analysis; A.A. conceptualized and designed the data analytics strategy; S.K., A.B., K.N., G.V.G. and A.A. wrote the first draft; A.B., G.V.G. and A.A. supervised the project; K.N. provided clinical interpretation of the results. All authors co-wrote, edited, and reviewed the manuscript. All authors have read and agreed to the published version of the manuscript.
Funding
The authors acknowledge support from the Ministry of Electronics and Information Technology (MeitY), Government of India, as well as from the NIHR Birmingham ECMC, NIHR Birmingham SRMRC, Nanocommons H2020-EU (731032), NIHR Birmingham Biomedical Research Center, MRC Health Data Research UK (HDRUK/CFC/01), an initiative funded by UK Research and Innovation, Department of Health and Social Care (England) and the devolved administrations, and leading medical research charities. The views expressed in this publication are those of the authors and not necessarily those of the NHS, the National Institute for Health Research, the Medical Research Council, or the Department of Health.
Institutional Review Board Statement
Not applicable.
Informed Consent Statement
This study did not involve an animal and/or human tissue/individual data/participants; thus, there were no ethics-related issues. No permission was required to use any repository data involved in the present study.
Data Availability Statement
Availability of data and materials: GEO datasets used in this study can be obtained from the GEO database (https://0-www-ncbi-nlm-nih-gov.brum.beds.ac.uk/geo/, accessed on 5 January 2021).
Conflicts of Interest
The authors declare no conflict of interest.
Abbreviations
| AUROC | Area under the receiver operating characteristic curve |
| CRC | Colon cancer |
| DEGs | Differential expressed genes |
| GEO | Gene Expression Omnibus |
| GO | Gene ontology |
| miRNA | microRNA |
| MDI | Mean decrease in impurity |
| RF | Random forest |
References
- Siegel, R.; DeSantis, C.; Jemal, A. Colorectal cancer statistics, 2014. CA A Cancer J. Clin. 2014, 64, 104–117. [Google Scholar] [CrossRef] [PubMed]
- Worldwide incidence and mortality of colorectal cancer and human development index (HDI): An ecological study. WCRJ 2019, 6, 1433.
- Rawla, P.; Sunkara, T.; Barsouk, A. Epidemiology of colorectal cancer: Incidence, mortality, survival, and risk factors. Prz. Gastroenterol. 2019, 14, 89–103. [Google Scholar] [CrossRef] [PubMed]
- Bogaert, J.; Prenen, H. Molecular genetics of colorectal cancer. Ann. Gastroenterol. 2014, 27, 9–14. [Google Scholar]
- Torre, L.A.; Siegel, R.L.; Ward, E.M.; Jemal, A. Global Cancer Incidence and Mortality Rates and Trends—An Update. Cancer Epidemiol. Biomark. Prev. 2016, 25, 16–27. [Google Scholar] [CrossRef] [Green Version]
- Stefano, G.B.; Mantione, K.J.; Kream, R.M.; Kuzelova, H.; Ptacek, R.; Raboch, J.; Samuel, J.M. Comparing Bioinformatic Gene Expression Profiling Methods: Microarray and RNA-Seq. Med. Sci. Monit. Basic Res. 2014, 20, 138–142. [Google Scholar] [CrossRef] [Green Version]
- Metzker, M.L. Sequencing technologies—The next generation. Nat. Rev. Genet. 2010, 11, 31–46. [Google Scholar] [CrossRef] [Green Version]
- Kim, H.-Y.; Lee, S.-G.; Oh, T.-J.; Lim, S.R.; Kim, S.-H.; Lee, H.J.; Kim, Y.-S.; Choi, H.-K. Antiproliferative and Apoptotic Activity of Chamaecyparis obtusa Leaf Extract against the HCT116 Human Colorectal Cancer Cell Line and Investigation of the Bioactive Compound by Gas Chromatography-Mass Spectrometry-Based Metabolomics. Molecules 2015, 20, 18066–18082. [Google Scholar] [CrossRef] [Green Version]
- Dalal, N.; Jalandra, R.; Sharma, M.; Prakash, H.; Makharia, G.K.; Solanki, P.R.; Singh, R.; Kumar, A. Omics technologies for improved diagnosis and treatment of colorectal cancer: Technical advancement and major perspectives. Biomed. Pharmacother. 2020, 131, 110648. [Google Scholar] [CrossRef]
- Chen, M.; Yang, X.; Yang, M.; Zhang, W.; Li, L.; Sun, Q. Identification of a novel biomarker-CCL5 using antibody microarray for colorectal cancer. Pathol. Res. Pract. 2019, 215, 1033–1037. [Google Scholar] [CrossRef]
- Wei, F.-Z.; Mei, S.-W.; Wang, Z.-J.; Chen, J.-N.; Shen, H.-Y.; Zhao, F.-Q.; Li, J.; Liu, Z.; Liu, Q. Differential Expression Analysis Revealing CLCA1 to Be a Prognostic and Diagnostic Biomarker for Colorectal Cancer. Front. Oncol. 2020, 10, 573295. [Google Scholar] [CrossRef] [PubMed]
- Li, J.; Wang, Y.; Wang, X.; Yang, Q. CDK1 and CDC20 overexpression in patients with colorectal cancer are associated with poor prognosis: Evidence from integrated bioinformatics analysis. World J. Surg. Oncol. 2020, 18, 1–11. [Google Scholar] [CrossRef] [PubMed]
- Gonzalez-Pons, M.; Cruz-Correa, M. Colorectal Cancer Biomarkers: Where Are We Now? BioMed. Res. Int. 2015, 2015, 1–14. [Google Scholar] [CrossRef] [PubMed] [Green Version]
- Lin, S.-R.; Huang, M.-Y.; Chang, H.-J. Molecular Detection of Circulating Tumor Cells With Multiple mRNA Markers by Genechip for Colorectal Cancer Early Diagnosis and Prognosis Prediction. Genom. Med. Biomark. Health Sci. 2011, 3, 9–16. [Google Scholar] [CrossRef] [Green Version]
- Dasí, F.; Lledó, S.; García-Granero, E.; Ripoll, R.; Marugán, M.; Tormo, M.; García-Conde, J.; Aliño, S.F. Real-time quantification in plasma of human telomerase reverse transcriptase (hTERT) mRNA: A simple blood test to monitor disease in cancer patients. Lab. Investig. 2001, 81, 767–769. [Google Scholar] [CrossRef] [PubMed] [Green Version]
- Schiedeck, T.H.K.; Wellm, C.; Roblick, U.J.; Broll, R.; Bruch, H.-P. Diagnosis and Monitoring of Colorectal Cancer by L6 Blood Serum Polymerase Chain Reaction Is Superior to Carcinoembryonic Antigen-Enzyme-Linked Immunosorbent Assay. Dis. Colon Rectum 2003, 46, 818–825. [Google Scholar] [CrossRef]
- Liu, X.; Bing, Z.; Wu, J.; Zhang, J.; Zhou, W.; Ni, M.; Meng, Z.; Liu, S.; Tian, J.; Zhang, X.; et al. Integrative Gene Expression Profiling Analysis to Investigate Potential Prognostic Biomarkers for Colorectal Cancer. Med. Sci. Monit. 2020, 26, e918906. [Google Scholar] [CrossRef]
- Torres, S.; Bartolome, R.A.; Mendes, M.; Barderas, R.; Fernández-Aceñerp, M.J.; Peláez-García, A.; Peña, C.; Lopez-Lucendo, M.; Villar-Vázquez, R.; De Herreros, A.G.; et al. Proteome Profiling of Cancer-Associated Fibroblasts Identifies Novel Proinflammatory Signatures and Prognostic Markers for Colorectal Cancer. Clin. Cancer Res. 2013, 19, 6006–6019. [Google Scholar] [CrossRef] [Green Version]
- Kim, E.R.; Kwon, H.N.; Nam, H.; Kim, J.J.; Park, S.; Kim, Y.-H. Urine-NMR metabolomics for screening of advanced colorectal adenoma and early stage colorectal cancer. Sci. Rep. 2019, 9, 1–10. [Google Scholar] [CrossRef]
- Schirripa, M.; Lenz, H.-J. Biomarker in Colorectal Cancer. Cancer J. 2016, 22, 156–164. [Google Scholar] [CrossRef] [Green Version]
- Shi, K.; Lin, W.; Zhao, X.-M. Identifying Molecular Biomarkers for Diseases With Machine Learning Based on Integrative Omics. IEEE/ACM Trans. Comput. Biol. Bioinform. 2020, 18, 2514–2525. [Google Scholar] [CrossRef] [PubMed]
- Wang, R.; Wang, M.-J.; Ping, J. Clinicopathological Features and Survival Outcomes of Colorectal Cancer in Young Versus Elderly: A Population-Based Cohort Study of SEER 9 Registries Data (1988–2011). Medicine 2015, 94, e1402. [Google Scholar] [CrossRef] [PubMed]
- Mangone, L.; Pinto, C.; Mancuso, P.; Ottone, M.; Bisceglia, I.; Chiaranda, G.; Michiara, M.; Vicentini, M.; Carrozzi, G.; Ferretti, S.; et al. Colon cancer survival differs from right side to left side and lymph node harvest number matter. BMC Public Health 2021, 21, 1–10. [Google Scholar] [CrossRef]
- Edgar, R.; Domrachev, M.; Lash, A.E. Gene Expression Omnibus: NCBI gene expression and hybridization array data repository. Nucleic Acids Res. 2002, 30, 207–210. [Google Scholar] [CrossRef] [PubMed] [Green Version]
- Ryan, B.M.; Zanetti, K.A.; Robles, A.; Schetter, A.J.; Goodman, J.; Hayes, R.; Huang, W.-Y.; Gunter, M.J.; Yeager, M.; Burdette, L.; et al. Germline variation inNCF4, an innate immunity gene, is associated with an increased risk of colorectal cancer. Int. J. Cancer 2014, 134, 1399–1407. [Google Scholar] [CrossRef] [Green Version]
- Skrzypczak, M.; Goryca, K.; Rubel, T.; Paziewska, A.; Mikula, M.; Jarosz, D.; Pachlewski, J.; Oledzki, J.; Ostrowsk, J. Modeling oncogenic signaling in colon tumors by multidirectional analyses of microarray data directed for maximization of analytical reliability. PLoS ONE 2010, 5, e13091. [Google Scholar] [CrossRef]
- Barrett, T.; Wilhite, S.E.; Ledoux, P.; Evangelista, C.; Kim, I.F.; Tomashevsky, M.; Marshall, K.A.; Phillippy, K.H.; Sherman, P.M.; Holko, M.; et al. NCBI GEO: Archive for functional genomics data sets—Update. Nucleic Acids Res. 2013, 41, D991–D9955. [Google Scholar] [CrossRef] [Green Version]
- Friedman, J.; Hastie, T.; Tibshirani, R. Additive logistic regression: A statistical view of boosting. Ann. Stat. 2000, 28, 337–407. [Google Scholar] [CrossRef]
- Huynh-Thu, V.A.; Irrthum, A.; Wehenkel, L.; Geurts, P. Inferring Regulatory Networks from Expression Data Using Tree-Based Methods. PLoS ONE 2010, 5, e12776. [Google Scholar] [CrossRef]
- Yuan, Z.; Ghosh, D. Combining Multiple Biomarker Models in Logistic Regression. Biometrics 2008, 64, 431–439. [Google Scholar] [CrossRef]
- Tolles, J.; Meurer, W.J. Logistic Regression: Relating Patient Characteristics to Outcomes. JAMA 2016, 316, 533–534. [Google Scholar] [CrossRef] [PubMed]
- Sambo, F.; Trifoglio, E.; Di Camillo, B.; Toffolo, G.M.; Cobelli, C. Bag of Naïve Bayes: Biomarker selection and classification from genome-wide SNP data. BMC Bioinform. 2012, 13, S2. [Google Scholar] [CrossRef] [PubMed] [Green Version]
- Chen, X.; Ishwaran, H. Random forests for genomic data analysis. Genomics 2012, 99, 323–329. [Google Scholar] [CrossRef] [PubMed] [Green Version]
- Li, W.; Yin, Y.; Quan, X.; Zhang, H. Gene Expression Value Prediction Based on XGBoost Algorithm. Front. Genet. 2019, 10, 1077. [Google Scholar] [CrossRef] [PubMed] [Green Version]
- Pedregosa, F.; Varoquaux, G.; Gramfort, A.; Michel, V.; Thirion, B.; Grisel, O.; Blondel, M.; Prettenhofer, P.; Weiss, R.; Dubourg, V.; et al. Scikit-learn: Machine Learning in Python. J. Mach. Learn. Res. 2011, 12, 2825–2830. [Google Scholar]
- Dreiseitl, S.; Ohno-Machado, L. Logistic regression and artificial neural network classification models: A methodology review. J. Biomed. Inform. 2002, 35, 352–359. [Google Scholar] [CrossRef] [Green Version]
- Bauer, E.; Kohavi, R. An Empirical Comparison of Voting Classification Algorithms: Bagging, Boosting, and Variants. Mach. Learn. 1999, 36, 105–139. [Google Scholar] [CrossRef]
- Breiman, L. Random Forests. Mach. Learn. 2001, 45, 5–32. [Google Scholar] [CrossRef] [Green Version]
- Geurts, P.; Maree, R.; Wehenkel, L. Extremely Randomized Trees and Random Subwindows for Image Classification, Annotation, and Retrieval. Mach. Learn. 2013, 63, 3–42. [Google Scholar] [CrossRef] [Green Version]
- Schapire, R.E. Explaining AdaBoost. In Empirical Inference; Springer: Berlin/Heidelberg, Germany, 2013; pp. 37–52. [Google Scholar]
- Chen, T.; Guestrin, C. Xgboost: A scalable tree boosting system. In Proceedings of the 22nd ACM SIGKDD International Conference on Knowledge Discovery and Data Mining; KDD ’16, San Francisco, CA, USA, 13–17 August 2016; pp. 785–794. [Google Scholar]
- Davis, J.; Goadrich, M. The Relationship Between Precision-Recall and ROC Curves. In Proceedings of the 23rd International Conference on Machine Learning; Association for Computing Machinery: New York, NY, USA, 2006; pp. 233–240. [Google Scholar]
- Hand, D.J. Assessing the Performance of Classification Methods. Int. Stat. Rev. 2012, 80, 400–414. [Google Scholar] [CrossRef]
- Sokolova, M.; Japkowicz, N.; Szpakowicz, S. Beyond Accuracy, F-Score and ROC: A Family of Discriminant Measures for Performance Evaluation. In AI 2006: Advances in Artificial Intelligence; Lecture Notes in Computer Science; Sattar, A., Kang, B., Eds.; Springer: Berlin/Heidelberg, Germany, 2006; Volume 4304, pp. 1015–1021. ISBN 978-3-540-49787-5. [Google Scholar]
- Gilles, L.; Wehenkel, L.; Sutera, A.; Geurts, P. Understanding variable importances in forests of randomized trees. In Proceedings of the Twenty-Seventh Conference on Neural Information Processing Systems—NIPS, Lake Tahoe, CA, USA, 5–10 December 2013. [Google Scholar]
- Kursa, M.B.; Jankowski, A.; Rudnicki, W.R. Boruta—A System for Feature Selection. Fundam. Inform. 2010, 101, 271–285. [Google Scholar] [CrossRef]
- Sandri, M.; Zuccolotto, P. A Bias Correction Algorithm for the Gini Variable Importance Measure in Classification Trees. J. Comput. Graph. Stat. 2008, 17, 611–628. [Google Scholar] [CrossRef]
- Chen, R.-C.; Dewi, C.; Huang, S.-W.; Caraka, R.E. Selecting critical features for data classification based on machine learning methods. J. Big Data 2020, 7, 1–26. [Google Scholar] [CrossRef]
- Zhou, G.; Soufan, O.; Ewald, J.; Hancock, R.E.W.; Basu, N.; Xia, J. NetworkAnalyst 3.0: A visual analytics platform for comprehensive gene expression profiling and meta-analysis. Nucleic Acids Res. 2019, 47, W234–W241. [Google Scholar] [CrossRef] [Green Version]
- Acharjee, A.; Larkman, J.; Xu, Y.; Cardoso, V.R.; Gkoutos, G.V. A random forest based biomarker discovery and power analysis framework for diagnostics research. BMC Med. Genom. 2020, 13, 1–14. [Google Scholar] [CrossRef]
- Shafiha, R.; Bahcivanci, B.; Gkoutos, G.V.; Acharjee, A. Machine Learning-Based Identification of Potentially Novel Non-Alcoholic Fatty Liver Disease Biomarkers. Biomedicines 2021, 9, 1636. [Google Scholar] [CrossRef]
- Acharjee, A.; Ament, Z.; West, J.A.; Stanley, E.; Griffin, J.L. Integration of metabolomics, lipidomics and clinical data using a machine learning method. BMC Bioinform. 2016, 17 (Suppl. S15), 440. [Google Scholar] [CrossRef] [Green Version]
- Quraishi, M.N.; Acharjee, A.; Beggs, A.D.; Horniblow, R.; Tselepis, C.; Gkoutos, G.; Ghosh, S.; Rossiter, A.E.; Loman, N.; van Schaik, W.; et al. A Pilot Integrative Analysis of Colonic Gene Expression, Gut Microbiota, and Immune Infiltration in Primary Sclerosing Cholangitis-Inflammatory Bowel Disease: Association of Disease With Bile Acid Pathways. J. Crohn’s Colitis 2020, 14, 935–947. [Google Scholar] [CrossRef] [Green Version]
- Frank, H. Regression Modeling Strategies: With Applications to Linear Models, Logistic Regression, and Survival Analysis, 2nd ed.; Springer: New York, NY, USA, 2015. [Google Scholar]
- Kumara, H.S.; Bellini, G.A.; Caballero, O.L.; Herath, S.A.; Su, T.; Ahmed, A.; Njoh, L.; Cekic, V.; Whelan, R.L. P-Cadherin (CDH3) is overexpressed in colorectal tumors and has potential as a serum marker for colorectal cancer monitoring. Oncoscience 2017, 4, 139–147. [Google Scholar] [CrossRef] [Green Version]
- Xu, Y.; Zhao, J.; Dai, X.; Xie, Y.; Dong, M. High expression of CDH3 predicts a good prognosis for colon adenocarcinoma patients. Exp. Ther. Med. 2019, 18, 841–847. [Google Scholar] [CrossRef]
- Hahn-Strömberg, V.; Askari, S.; Ahmad, A.; Befekadu, R.; Nilsson, T.K. Expression of claudin 1, claudin 4, and claudin 7 in colorectal cancer and its relation with CLDN DNA methylation patterns. Tumor Biol. 2017, 39, 1010428317697569. [Google Scholar] [CrossRef] [PubMed] [Green Version]
- Chen, J.; Liu, Q.-M.; Du, P.-C.; Ning, D.; Mo, J.; Zhu, H.-D.; Wang, C.; Ge, Q.-Y.; Cheng, Q.; Zhang, X.-W.; et al. Type-2 11β-hydroxysteroid dehydrogenase promotes the metastasis of colorectal cancer via the Fgfbp1-AKT pathway. Am. J. Cancer Res. 2020, 10, 662–673. [Google Scholar] [PubMed]
- Yang, G.-Z.; Hu, L.; Cai, J.; Chen, H.-Y.; Zhang, Y.; Feng, D.; Qi, C.-Y.; Zhai, Y.-X.; Gong, H.; Fu, H.; et al. Prognostic value of carbonic anhydrase VII expression in colorectal carcinoma. BMC Cancer 2015, 15, 209. [Google Scholar] [CrossRef] [PubMed] [Green Version]
- Hu, L.; Chen, H.-Y.; Han, T.; Yang, G.-Z.; Feng, D.; Qi, C.-Y.; Gong, H.; Zhai, Y.-X.; Cai, Q.-P.; Gao, C.-F. Downregulation of DHRS9 expression in colorectal cancer tissues and its prognostic significance. Tumor Biol. 2015, 37, 837–845. [Google Scholar] [CrossRef] [PubMed] [Green Version]
- Nie, S.; Huang, Y.; Shi, M.; Qian, X.; Li, H.; Peng, C.; Kong, B.; Zou, X.; Shen, S. Protective role of ABCG2 against oxidative stress in colorectal cancer and its potential underlying mechanism. Oncol. Rep. 2018, 40, 2137–2146. [Google Scholar] [CrossRef] [PubMed]
- Expression of ABCG2 and its Significance in Colorectal Cancer. Asian Pac. J. Cancer Prev. 2010, 11, 845–848.
- Tuy, H.D.; Shiomi, H.; Mukaisho, K.I.; Naka, S.; Shimizu, T.; Sonoda, H.; Mekata, E.; Endo, Y.; Kurumi, Y.; Sugihara, H.; et al. ABCG2 expression in colorectal adenocarcinomas may predict resistance to irinotecan. Oncol. Lett. 2016, 12, 2752–2760. [Google Scholar] [CrossRef] [Green Version]
- Yang, W.; Ma, J.; Zhou, W.; Li, Z.; Zhou, X.; Cao, B.; Zhang, Y.; Liu, J.; Yang, Z.; Zhang, H.; et al. Identification of hub genes and outcome in colon cancer based on bioinformatics analysis. Cancer Manag. Res. 2018, 11, 323–338. [Google Scholar] [CrossRef] [Green Version]
- Pira, G.; Uva, P.; Scanu, A.M.; Rocca, P.C.; Murgia, L.; Uleri, E.; Piu, C.; Porcu, A.; Carru, C.; Manca, A.; et al. Landscape of transcriptome variations uncovering known and novel driver events in colorectal carcinoma. Sci. Rep. 2020, 10, 1–12. [Google Scholar] [CrossRef] [Green Version]
- Coller, H.A. Is Cancer a Metabolic Disease? Am. J. Pathol. 2014, 184, 4–17. [Google Scholar] [CrossRef] [Green Version]
- Li, H.; Rokavec, M.; Hermeking, H. Soluble IL6R represents a miR-34a target: Potential implications for the recently identified IL-6R/STAT3/miR-34a feed-back loop. Oncotarget 2015, 6, 14026–14032. [Google Scholar] [CrossRef] [PubMed] [Green Version]
- Vainer, N.; Dehlendorff, C.; Johansen, J.S. Systematic literature review of IL-6 as a biomarker or treatment target in patients with gastric, bile duct, pancreatic and colorectal cancer. Oncotarget 2018, 9, 29820–29841. [Google Scholar] [CrossRef] [PubMed] [Green Version]
- Dai, G.; Wang, L.; Wen, Y.; Ren, X.; Zuo, S. Identification of key genes for predicting colorectal cancer prognosis by integrated bioinformatics analysis. Oncol. Lett. 2019, 19, 388–398. [Google Scholar] [CrossRef] [Green Version]
- Yang, H.; Liu, H.; Lin, H.-C.; Gan, D.; Jin, W.; Cui, C.; Yan, Y.; Qian, Y.; Han, C.; Wang, Z. Association of a novel seven-gene expression signature with the disease prognosis in colon cancer patients. Aging 2019, 11, 8710–8727. [Google Scholar] [CrossRef] [PubMed]
- Zhang, X.; Tan, P.; Zhuang, Y.; Du, L. hsa_circRNA_001587 upregulates SLC4A4 expression to inhibit migration, invasion, and angiogenesis of pancreatic cancer cells via binding to microRNA-223. Am. J. Physiol. Liver Physiol. 2020, 319, G703–G717. [Google Scholar] [CrossRef] [PubMed]
- Mencia, N.; Selga, E.; Noe, V.; Ciudad, C.J. Underexpression of miR-224 in methotrexate resistant human colon cancer cells. Biochem. Pharmacol. 2011, 82, 1572–1582. [Google Scholar] [CrossRef]
- Andersen, V.; Vogel, L.K.; Kopp, T.I.; Sæbø, M.; Nonboe, A.W.; Hamfjord, J.; Kure, E.H.; Vogel, U. High ABCC2 and Low ABCG2 Gene Expression Are Early Events in the Colorectal Adenoma-Carcinoma Sequence. PLoS ONE 2015, 10, e0119255. [Google Scholar] [CrossRef] [Green Version]
- Zhang, L.; Guo, X.; Zhang, D.; Fan, Y.; Qin, L.; Dong, S. Upregulated miR-132 in Lgr5+gastric cancer stem cell-like cells contributes to cisplatin-resistance via SIRT1/CREB/ABCG2 signaling pathway. Mol. Carcinog. 2017, 56, 2022–2034. [Google Scholar] [CrossRef]
- Cherradi, S.; Ayrolles-Torro, A.; Vezzo-Vié, N.; Gueguinou, N.; Denis, V.; Combes, E.; Boissière, F.; Busson, M.; Canterel-Thouennon, L.; Mollevi, C.; et al. Antibody targeting of claudin-1 as a potential colorectal cancer therapy. J. Exp. Clin. Cancer Res. 2017, 36, 89. [Google Scholar] [CrossRef] [Green Version]
- Miwa, N.; Furuse, M.; Tsukita, S.; Niikawa, N.; Nakamura, Y.; Furukawa, Y. Involvement of claudin-1 in the beta-catenin/Tcf signaling pathway and its frequent upregulation in human colorectal cancers. Oncol. Res. 2001, 12, 469–476. [Google Scholar] [CrossRef]
- Singh, A.B.; Sharma, A.; Smith, J.J.; Krishnan, M.; Chen, X.; Eschrich, S.; Washington, M.K.; Yeatman, T.J.; Beauchamp, R.D.; Dhawan, P. Claudin-1 Up-regulates the Repressor ZEB-1 to Inhibit E-Cadherin Expression in Colon Cancer Cells. Gastroenterology 2011, 141, 2140–2153. [Google Scholar] [CrossRef] [Green Version]
- Bravo-Merodio, L.; Acharjee, A.; Russ, D.; Bisht, V.; Williams, J.A.; Tsaprouni, L.G.; Gkoutos, G.V. Translational biomarkers in the era of precision medicine. Int. Rev. Cytol. 2021, 102, 191–232. [Google Scholar] [CrossRef]
- Bailey, J.R.; Aggarwal, A.; Imperiale, T.F. Colorectal Cancer Screening: Stool DNA and Other Noninvasive Modalities. Gut Liver 2016, 10, 204–211. [Google Scholar] [CrossRef] [PubMed]
- de Wit, M.; Fijneman, R.J.; Verheul, H.M.; Meijer, G.A.; Jimenez, C.R. Proteomics in colorectal cancer translational research: Biomarker discovery for clinical applications. Clin. Biochem. 2013, 46, 466–479. [Google Scholar] [CrossRef] [PubMed]
- Alvarez-Chaver, P.; Otero-Estévez, O.; Páez de la Cadena, M.; Rodríguez-Berrocal, F.J.; Martínez-Zorzano, V.S. Proteomics for discovery of candidate colorectal cancer biomarkers. World J. Gastroenterol. 2014, 20, 3804–3824. [Google Scholar] [CrossRef]
Figure 1.
A schematic representation of the biomarker identification workflow.

Figure 2.
A comparison of accuracy (blue) and AUROC (orange) values obtained across the different classifiers using combinations of the GEO datasets as training and test datasets. (A) GSE44861 (training) and GSE20916 (test); (B) GSE44861 (training) and GSE20916 (test); (C) GSE20916 (training) and GSE44861 (test); (D) GSE20916 (training) and GSE113513 (test); (E) GSE113513 (training) and GSE44861 (test); (F) GSE113513 (training) and GSE20916 (test).


Figure 3.
ROC curves for the different classifiers. (A) Performance of logistic regression model with GSE44861 as training and GSE20916, GSE113513 as test data; (B) performance of random forest model with GSE20916 as training and GSE44861, GSE113513 as test data; (C) performance of ExtraTrees model with GSE20916 as training and GSE44861, GSE113513 as test data; (D) performance of naïve Bayes model with GSE20916 as training and GSE44861, GSE113513 as test data; (E) performance of XGBoost model with GSE44861 as training and GSE20916, GSE113513 as test data; (F) performance of Adaboost model with GSE44861 as training and GSE20916, GSE113513 as test data.

Figure 4.
Important genes selected using the mean decrease in impurity (MDI) technique in combination with random forest classifier. The x-axis represents the gene names, and the y-axis represents importance score values across the GSE44861 (A), GSE20916 (B), and GSE113513 datasets (C). The common genes from all three datasets (D).

Figure 5.
(A) Pathway enrichment analysis with the genes selected using the MDI method; (B) mapping of the 19 most interacting genes out of 34 genes with miRNAs and their interconnections; (C) the two clusters of genes with representative genes CA7 and TEAD4 for the GSE44861 are visualized by the largest effect size. The effect size of each assessed variable is shown along the y-axis, with a series of sample sizes along the x-axis.


Publisher’s Note: MDPI stays neutral with regard to jurisdictional claims in published maps and institutional affiliations. |
© 2022 by the authors. Licensee MDPI, Basel, Switzerland. This article is an open access article distributed under the terms and conditions of the Creative Commons Attribution (CC BY) license (https://creativecommons.org/licenses/by/4.0/).
Share and Cite
MDPI and ACS Style
Koppad, S.; Basava, A.; Nash, K.; Gkoutos, G.V.; Acharjee, A. Machine Learning-Based Identification of Colon Cancer Candidate Diagnostics Genes. Biology 2022, 11, 365. https://0-doi-org.brum.beds.ac.uk/10.3390/biology11030365
AMA Style
Koppad S, Basava A, Nash K, Gkoutos GV, Acharjee A. Machine Learning-Based Identification of Colon Cancer Candidate Diagnostics Genes. Biology. 2022; 11(3):365. https://0-doi-org.brum.beds.ac.uk/10.3390/biology11030365
Chicago/Turabian StyleKoppad, Saraswati, Annappa Basava, Katrina Nash, Georgios V. Gkoutos, and Animesh Acharjee. 2022. "Machine Learning-Based Identification of Colon Cancer Candidate Diagnostics Genes" Biology 11, no. 3: 365. https://0-doi-org.brum.beds.ac.uk/10.3390/biology11030365
Note that from the first issue of 2016, this journal uses article numbers instead of page numbers. See further details here.