
Reproducibility and Applicability of Traditional Strength Training Prescription Recommendations

 , , , , and
Abstract
:Simple Summary
Abstract
1. Introduction
2. Materials and Methods
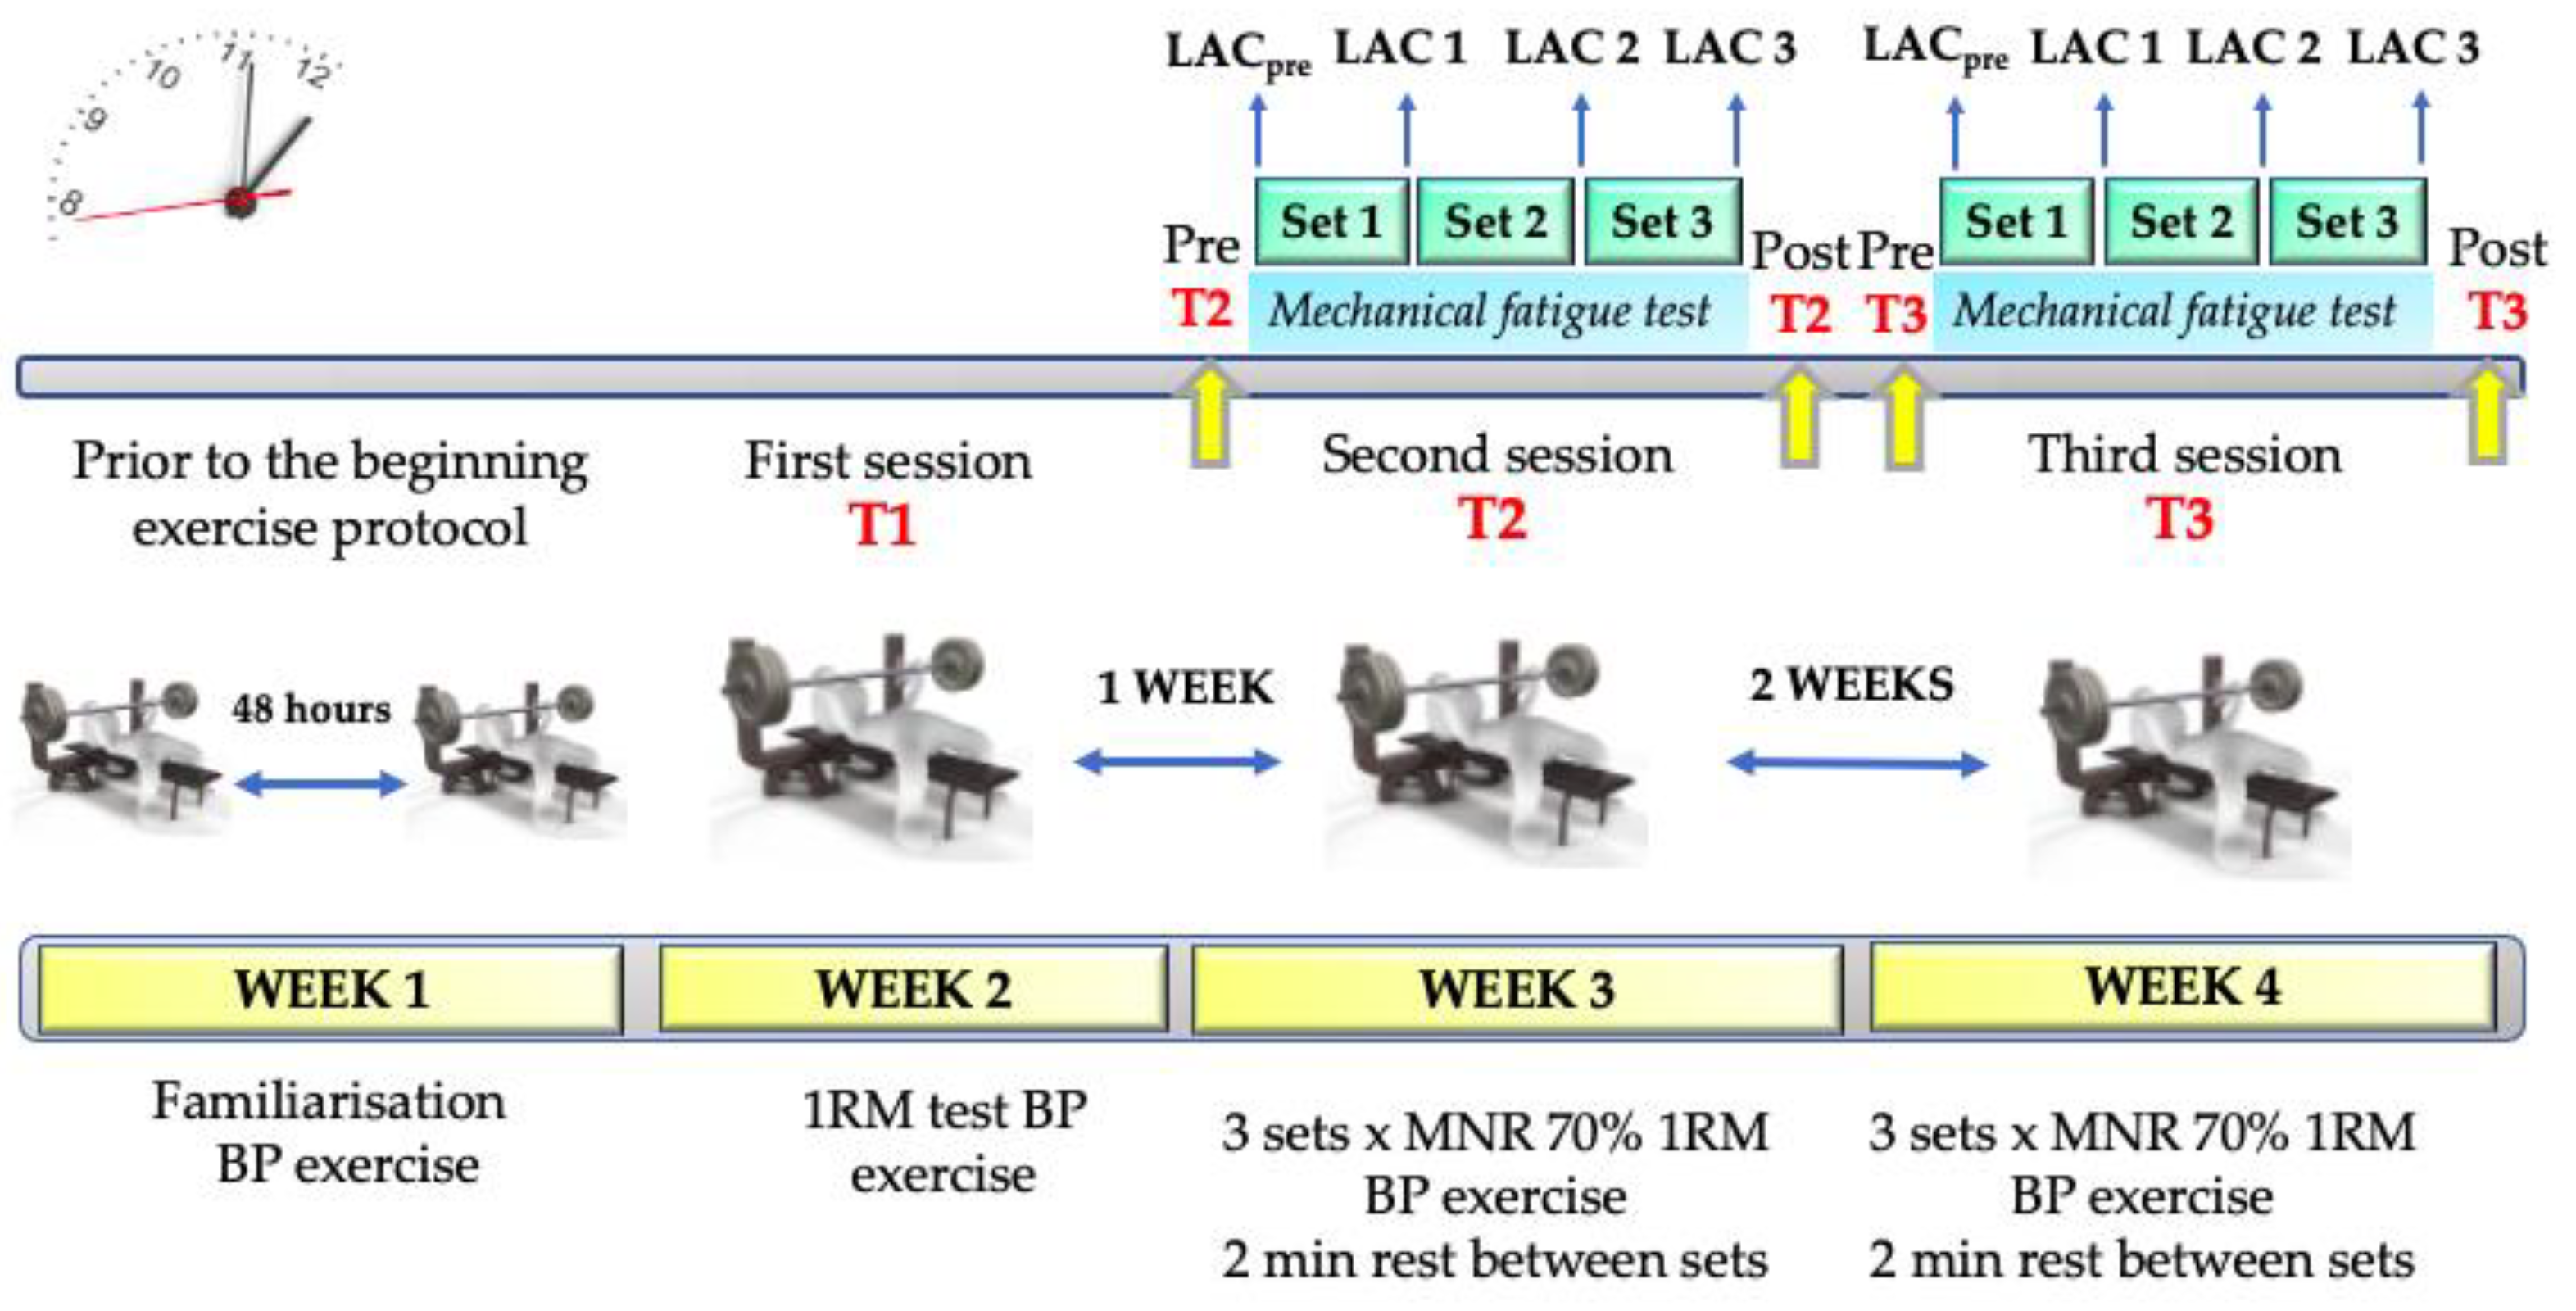
2.1. Study Design
2.2. Participants
2.3. Procedures
2.3.1. One-Repetition Maximum (1RM) Test
2.3.2. The 3 × Maximum Number of Repetitions (MNR) Exercise Protocol
2.3.3. Blood Lactate Concentrations
2.3.4. Mechanical Fatigue Test
2.4. Measurement Equipment
2.5. Variables Analysed
2.6. Statistical Analysis
3. Results
4. Discussion
5. Conclusions
Author Contributions
Funding
Institutional Review Board Statement
Informed Consent Statement
Data Availability Statement
Acknowledgments
Conflicts of Interest
References
- Gonzalez-Badillo, J.J.; Sánchez-Medina, L. Movement velocity as a measure of loading intensity in resistance training. Int. J. Sports Med. 2010, 31, 347–352. [Google Scholar] [CrossRef] [PubMed]
- Toigo, M.; Boutellier, U. New fundamental resistance exercise determinants of molecular and cellular muscle adaptations. Eur. J. Appl. Physiol. 2006, 97, 643–663. [Google Scholar] [CrossRef] [PubMed] [Green Version]
- Spiering, B.A.; Kraemer, W.J.; Anderson, J.M.; Armstrong, L.E.; Nindl, B.C.; Volek, J.S.; Maresh, C.M. Resistance exercise biology: Manipulation of resistance exercise programme variables determines the responses of cellular and molecular signalling pathways. Sports Med. 2008, 38, 527–540. [Google Scholar] [CrossRef]
- Bird, S.P.; Tarpenning, K.M.; Marino, F.E. Designing resistance training programmes to enhance muscular fitness: A review of the acute programme variables. Sports Med. 2005, 35, 841–851. [Google Scholar] [CrossRef] [PubMed]
- Garber, C.E.; Blissmer, B.; Deschenes, M.R.; Franklin, B.A.; Lamonte, M.J.; Lee, I.-M.; Nieman, D.C.; Swain, D.P. Quantity and Quality of Exercise for Developing and Maintaining Cardiorespiratory, Musculoskeletal, and Neuromotor Fitness in Apparently Healthy Adults. Med. Sci. Sports Exerc. 2011, 43, 1334–1359. [Google Scholar] [CrossRef]
- Hills, A.P.; Shultz, S.P.; Soares, M.J.; Byrne, N.M.; Hunter, G.R.; King, N.A.; Misra, A. Resistance training for obese, type 2 diabetic adults: A review of the evidence. Obes. Rev. 2010, 11, 740–749. [Google Scholar] [CrossRef]
- Strasser, B.; Schobersberger, W. Evidence for resistance training as a treatment therapy in obesity. J. Obes. 2011, 2011, 482564. [Google Scholar] [CrossRef] [Green Version]
- Kanaley, J.A.; Colberg, S.R.; Corcoran, M.H.; Malin, S.K.; Rodriguez, N.R.; Crespo, C.J.; Kirwan, J.P.; Zierath, J.R. Exercise/Physical Activity in Individuals with Type 2 Diabetes: A Consensus Statement from the American College of Sports Medicine. Med. Sci. Sports Exerc. 2022, 54, 353–368. [Google Scholar] [CrossRef]
- American College of Sports Medicine. American College of Sports Medicine position stand. Progression models in resistance training for healthy adults. Med. Sci. Sports Exerc. 2009, 41, 687–708. [Google Scholar] [CrossRef]
- Rhea, M.R.; Ball, S.B.; Phillips, W.T.; Burkett, L.N. A comparison of linear and daily undulating periodization with equated volume and intensity for strength. J. Strength Cond Res. 2002, 16, 250–255. [Google Scholar]
- Bartolomei, S.; Stout, J.R.; Fukuda, D.H.; Hoffman, J.R.; Merni, F. Block vs. Weekly Undulating Periodized Resistance Training Programs in Women. J. Strength Cond Res. 2015, 29, 2679–2687. [Google Scholar] [CrossRef] [PubMed]
- Maté-Muñoz, J.L.; Garnacho-Castaño, M.V.; Hernández-Lougedo, J.; Maicas-Pérez, L.; Notario-Alonso, R.; Da Silva-Grigoletto, M.E.; García-Fernández, P.; Heredia-Elvar, J.R. Analysis of the Use and Applicability of Different Variables for the Prescription of Relative Intensity in Bench Press Exercise. Biology 2022, 11, 336. [Google Scholar] [CrossRef] [PubMed]
- Schoenfeld, B.J.; Ratamess, N.A.; Peterson, M.D.; Contreras, B.; Sonmez, G.T.; Alvar, B.A. Effects of Different Volume-Equated Resistance Training Loading Strategies on Muscular Adaptations in Well-Trained Men. J. Strength Cond Res. 2014, 28, 2909–2918. [Google Scholar] [CrossRef] [PubMed] [Green Version]
- Radaelli, R.; Fleck, S.J.; Leite, T.; Leite, R.D.; Pinto, R.S.; Fernandes, L.; Simão, R. Dose-Response of 1, 3, and 5 Sets of Resistance Exercise on Strength, Local Muscular Endurance, and Hypertrophy. J. Strength Cond Res. 2015, 29, 1349–1358. [Google Scholar] [CrossRef]
- Pallarés, J.G.; López-Samanes, A.; Fernández-Elías, V.E.; Aguado-Jiménez, R.; Ortega, J.F.; Gómez, C.; Ventura, R.; Segura, J.; Mora-Rodríguez, R. Pseudoephedrine and circadian rhythm interaction on neuromuscular performance. Scand. J. Med. Sci. Sport 2015, 25, e603–e612. [Google Scholar] [CrossRef]
- Association, W.M. World Medical Association Declaration of Helsinki: Ethical principles for medical research involving human subjects. JAMA 2013, 310, 2191–2194. [Google Scholar]
- Pallarés, J.G.; Sánchez-Medina, L.; Pérez, C.E.; de la Cruz-Sánchez, E.; Mora-Rodríguez, R. Imposing a pause between the eccentric and concentric phases increases the reliability of isoinertial strength assessments. J. Sports Sci. 2014, 32, 1165–1175. [Google Scholar] [CrossRef]
- Sánchez-Medina, L.; Pérez, C.E.; González-Badillo, J.J. Importance of the propulsive phase in strength assessment. Int. J. Sports Med. 2010, 31, 123–129. [Google Scholar] [CrossRef]
- Sánchez-Medina, L.; González-Badillo, J.J. Velocity loss as an indicator of neuromuscular fatigue during resistance training. Med. Sci. Sports Exerc. 2011, 43, 1725–1734. [Google Scholar] [CrossRef]
- McNaughton, L.R.; Thompson, D.; Philips, G.; Backx, K.; Crickmore, L. A comparison of the Lactate Pro, Accusport, Analox GM7 and Kodak Ektachem lactate analysers in normal, hot and humid conditions. Int. J. Sports Med. 2002, 23, 130–135. [Google Scholar] [CrossRef]
- McLean, S.R.; Norris, S.R.; Smith, D.J. Comparison of the Lactate Pro and the YSI 1500 Sport Blood Lactate analyzers. Int. J. Appl. Sports Sci. 2004, 16, 22–30. [Google Scholar]
- Peña García-Orea, G.; Belando-Pedreño, N.; Merino-Barrero, J.A.; Heredia-Elvar, J.R. Validation of an opto-electronic instrument for the measurement of execution velocity in squat exercise. Sports Biomech. 2021, 6, 706–719. [Google Scholar] [CrossRef]
- Field, A. Discovering Statistics Using IBM SPSS Statistics, 4th ed.; Sage: London, UK, 2013; pp. 473–474. [Google Scholar]
- Bland, J.M.; Altman, D.G. Statistical methods for assessing agreement between two methods of clinical measurement. Lancet 1986, 327, 307–310. [Google Scholar] [CrossRef]
- Hopkins, W.G.; Schabort, E.J.; Hawley, J.A. Reliability of power in physical performance tests. Sports Med. 2001, 31, 211–234. [Google Scholar] [CrossRef] [PubMed]
- Landis, J.R.; Koch, G.G. The measurement of observer agreement for categorical data. Biometrics 1977, 33, 159–174. [Google Scholar] [CrossRef] [PubMed] [Green Version]
- González-Badillo, J.J.; Yáñez-García, J.M.; Mora-Custodio, R.; Rodríguez-Rosell, D. Velocity loss as a variable for monitoring resistance exercise. Int. J. Sports Med. 2017, 38, 217–225. [Google Scholar] [CrossRef]
- Rodríguez-Rosell, D.; Yáñez-García, J.M.; Sánchez-Medina, L.; Mora-Custodio, R.; González-Badillo, J.J. Relationship between velocity loss and repetitions in reserve in the bench press and back squat exercises. J. Strength Cond. Res. 2020, 34, 2537–2547. [Google Scholar] [CrossRef]
- Moraes, R.F.; Ferreira-Júnior, J.B.; Marques, V.A.; Vieira, A.; Lira, C.A.B.; Campos, M.H.; Freitas-Junior, R.; Rahal, R.M.S.; Gentil, P.; Vieira, C.A. Resistance training, fatigue, quality of life, anxiety in breast cancer survivors. J. Strength Cond Res. 2021, 35, 1350–1356. [Google Scholar] [CrossRef]
- Pareja-Blanco, F.; Rodríguez-Rosell, D.; Sánchez-Medina, L.; Sanchis-Moysi, J.; Dorado, C.; Mora-Custodio, R.; Yáñez-García, J.M.; Morales-Álamo, D.; Pérez-Suárez, I.; Calbet, J.A.L.; et al. Effects of velocity loss during resistance training on athletic performance, strength gains and muscle adaptations. Scand. J. Med. Sci. Sports 2017, 27, 724–735. [Google Scholar] [CrossRef] [Green Version]
- Pareja-Blanco, F.; Alcazar, J.; Sánchez-Valdepeñas, J.; Cornejo-Daza, P.J.; Piqueras-Sanchíz, F.; Mora-Vela, R.; Sánchez-Moreno, M.; Bachero-Mena, B.; Ortega-Becerra, M.; Alegre, L.M. Velocity Loss as a Critical Variable Determining the Adaptations to Strength Training. Med. Sci. Sports Exerc. 2020, 52, 1752–1762. [Google Scholar] [CrossRef]
- Sánchez-Moreno, M.; Rendeiro-Pinho, G.; Mil-Homens, P.V.; Pareja-Blanco, F. Monitoring training volume through maximal number of repetitions or velocity-based approach. Int. J. Sports Physiol. Perform. 2021, 16, 527–534. [Google Scholar] [CrossRef] [PubMed]
- Hernández-Belmonte, A.; Courel-Ibáñez, J.; Conesa-Ros, E.; Martínez-Cava, A.; Pallarés, J.G. Level of effort: A reliable and practical alternative to the velocity-based approach for monitoring resistance training. J. Strength Cond. Res. 2021, in press. [Google Scholar] [CrossRef] [PubMed]
- Rodríguez-Rosell, D.; Yáñez-García, J.M.; Torres-Torrelo, J.; Mora-Custodio, R.; Marques, M.C.; González-Badillo, J.J. Effort Index as a Novel Variable for Monitoring the Level of Effort during Resistance Exercises. J. Strength Cond. Res. 2018, 32, 2139–2153. [Google Scholar] [CrossRef] [PubMed]


| Variable | SET 1 | SET 2 | SET 3 | F | ηp2 | p | |||||||||
|---|---|---|---|---|---|---|---|---|---|---|---|---|---|---|---|
| M ± SD | Min–Max | 95% CI | CV | M ± SD | Min–Max | 95% CI | CV | M ± SD | Min–Max | 95% CI | CV | SP | |||
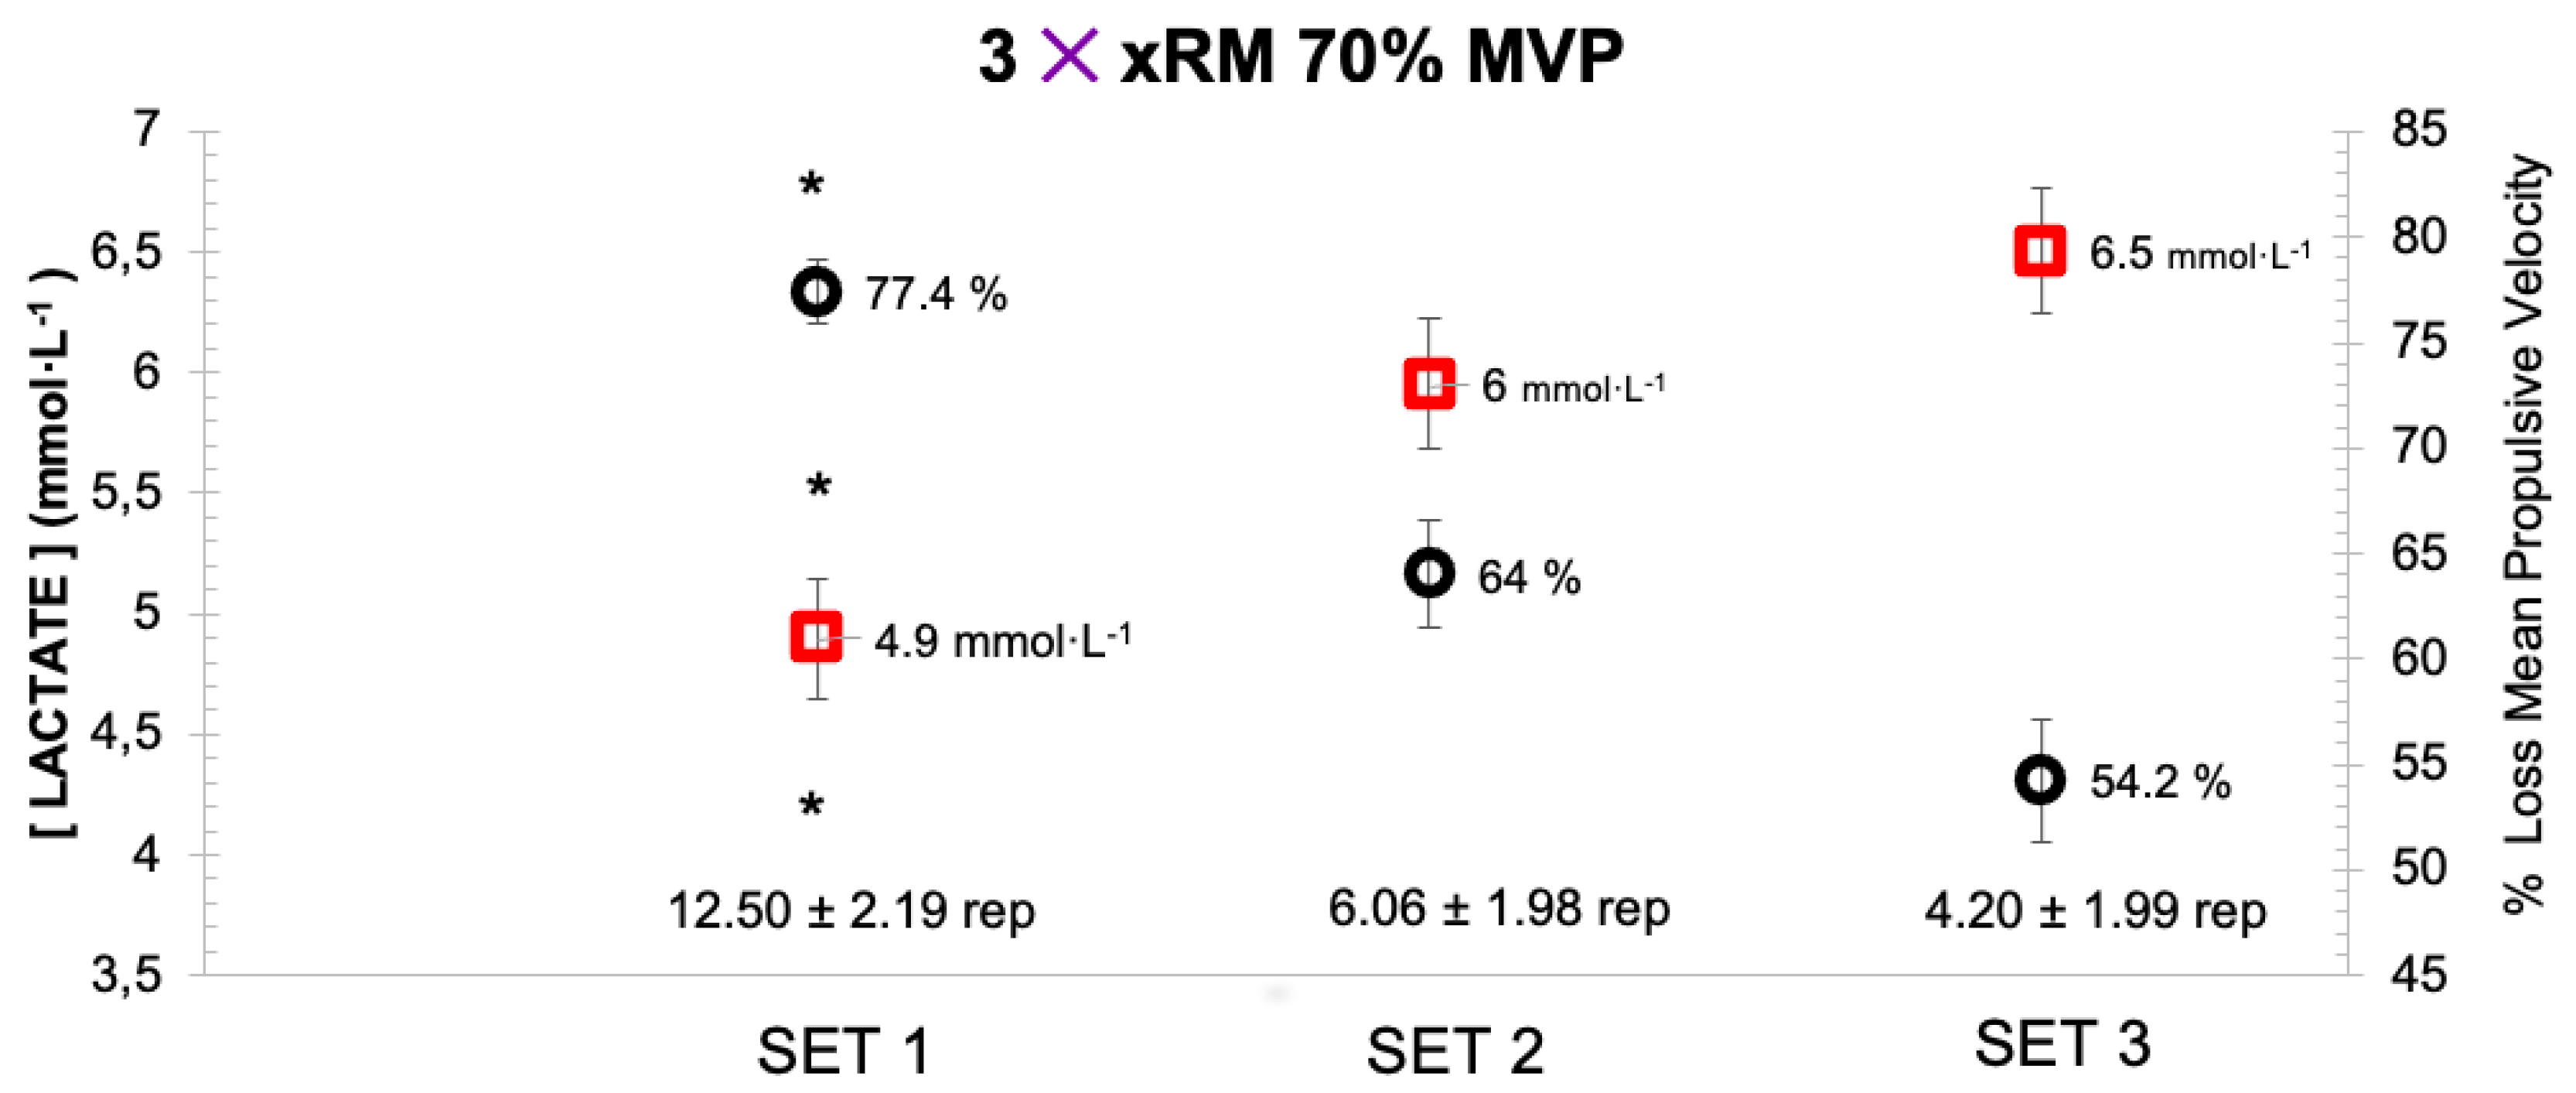
| 70% MPV Rep (n°) | 12.50 ± 2.19 * | 8–16 | 11.68–13.32 | 17.5% | 6.06 ± 1.98 | 2–10 | 5.33–6.81 | 32.7% | 4.20 ± 1.99 | 2–12 | 3.46–4.94 | 47.4% | 259.681 | 0.900 1.000 | <0.001 |
| MPVrep Best (m·s−1) | 0.62 ± 0.10 * | 0.45–0.91 | 0.58–0.66 | 16.1% | 0.42 ± 0.07 | 0.26–0.60 | 0.39–0.44 | 16.7% | 0.36 ± 0.06 | 0.29–0.49 | 0.34–0.38 | 16.7% | 139.553 | 0.828 1.000 | <0.001 |
| MPVrep Last (m·s−1) | 0.14 ± 0.04 ‡ | 0.07–0.22 | 0.13–0.17 | 28.6% | 0.15 ± 0.05 | 0.07–0.24 | 0.13–0.17 | 33.3% | 0.18 ± 0.07 | 0.07–0.34 | 0.15–0.20 | 38.9% | 4.367 | 0.131 0.734 | 0.017 |
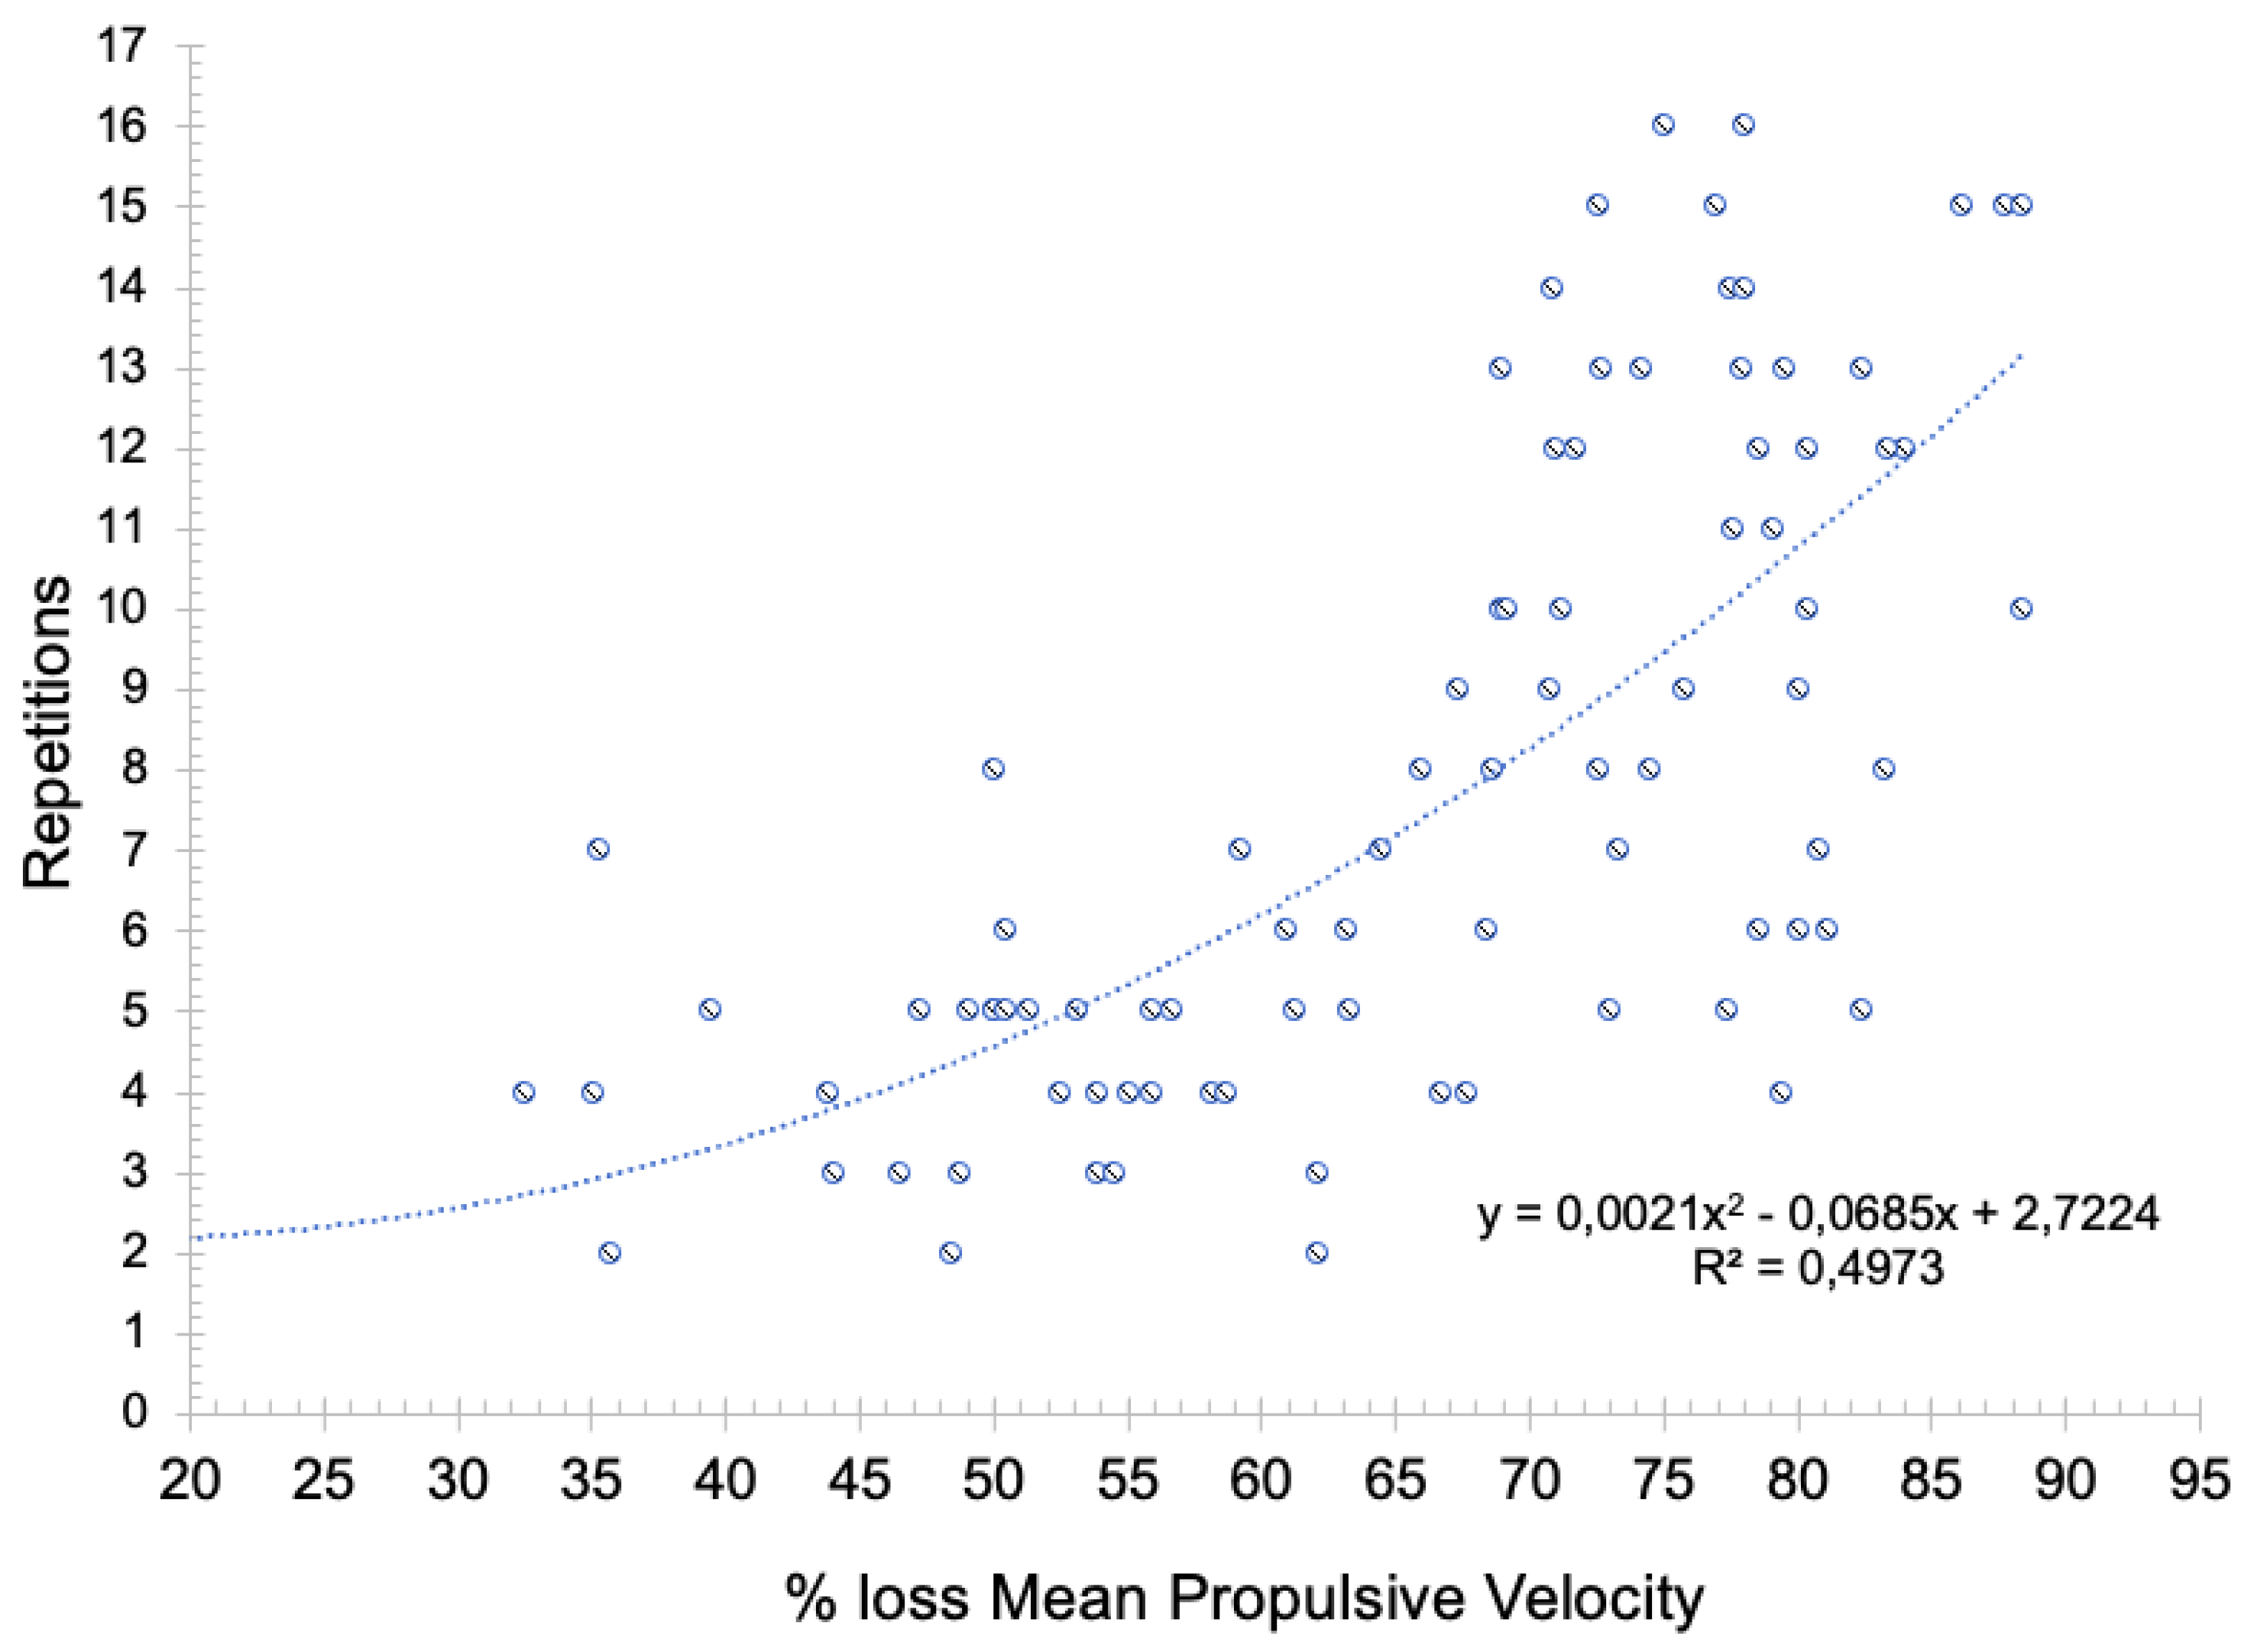
| % loss MPV Set | 77.42 ± 5.77 * | 68.90–88.40 | 75.18–79.66 | 7.5% | 64 ± 14.24 | 32.50–88.40 | 58.48–69.52 | 22.3% | 54.21 ± 15.76 | 0–81.10 | 48.10–60.32 | 29.1% | 23.773 | 0.468 1.000 | <0.001 |
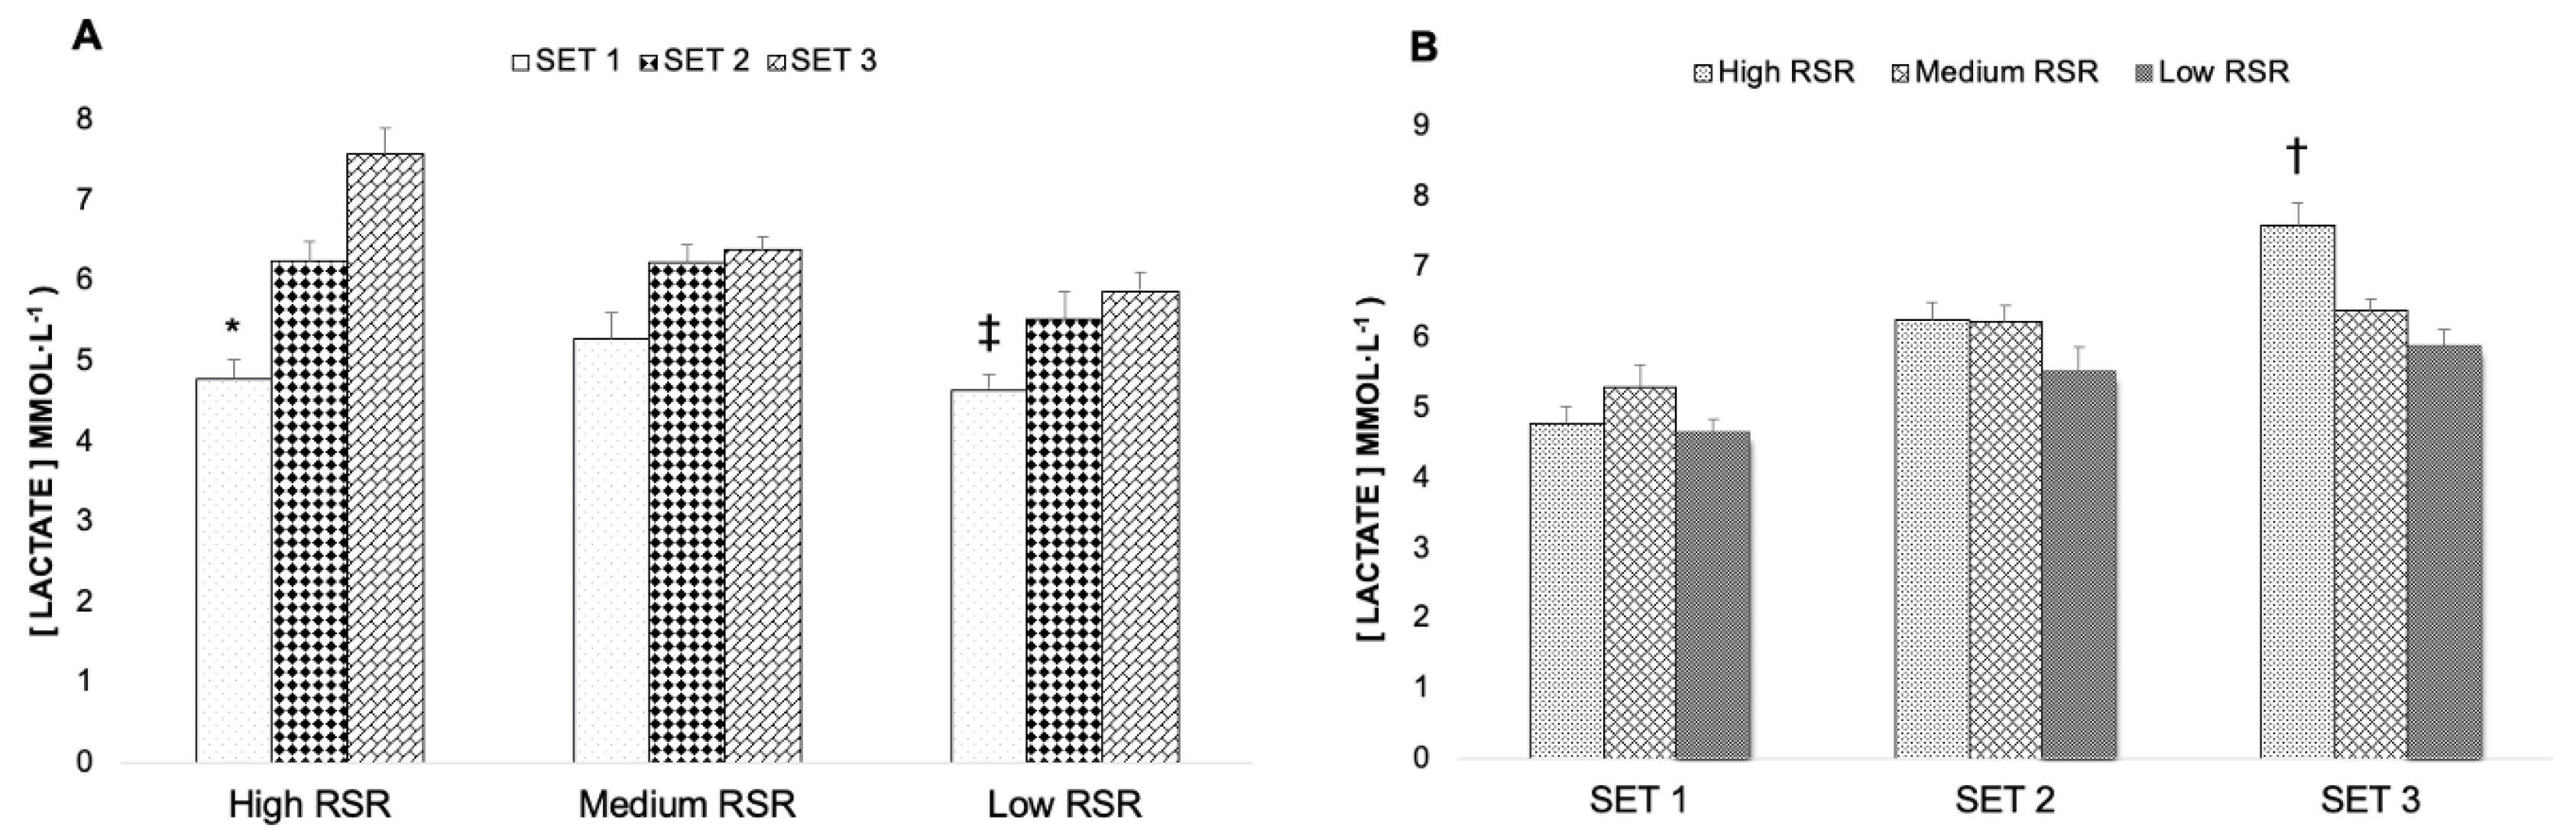
| Variable | Level of Strength | SET 1 (M ± SD, Min–Max 95% CI, CV) | SET 2 (M ± SD, Min–Max 95% CI, CV) | SET 3 (M ± SD, Min–Max 95% CI, CV) | p Time ηp2 SP | p Group ηp2 SP | p Group × Time ηp2 SP |
|---|---|---|---|---|---|---|---|
| 70% MPV Rep (n°) | High RSR (n = 8) | 12.63 ± 2 10–15 11.01–14.24 15.8% | 7.38 ± 2 4–10 6.01–8.74 27.1% | 5.5 ± 2.88 2–12 4.13–6.87 52.4% | <0.001 * | 0.167 | 0.209 |
| Medium RSR (n = 10) | 11.90 ± 2.33 9–16 10.46–13.34 19.6% | 5.60 ± 2.01 2–9 4.38–6.82 35.9% | 3.60 ± 1.35 2–5 2.38–4.82 37.5% | 0.904 | 0.124 | 0.105 | |
| Low RSR (n = 12) | 12.92 ± 2.19 8–16 11.60–14.24 17% | 5.58 ± 1.68 4–8 4.47–6.70 30.1% | 3.83 ± 1.40 2–6 2.72–4.95 36.6% | 1.000 | 0.362 | 0.386 | |
| MPVrep Best (m·s−1) | High RSR (n = 8) | 0.53 ± 0.08 0.45–0.71 0.47–0.60 15.1% | 0.44 ± 0.07 0.35–0.60 0.38–0.49 15.9% | 0.38 ± 0.06 0.30–0.49 0.34–0.43 15.8% | <0.001 * | 0.499 | <0.001 * |
| Medium RSR (n = 10) | 0.61 ± 0.10 0.46–0.75 0.55–0.67 16.4% | 0.41 ± 0.06 0.29–0.49 0.36–0.45 14.6% | 0.34 ± 0.04 0.29–0.42 0.30–0.38 11.8% | 0.875 | 0.050 | 0.393 | |
| Low RSR (n = 12) | 0.68 ± 0.09 0.55–0.91 0.62–0.73 13.2% | 0.41 ± 0.07 0.26–0.54 0.37–0.46 17.1% | 0.35 ± 0.07 0.29–0.49 0.32–0.46 20% | 1.000 | 0.158 | 0.998 | |
| MPVrep Last (m·s−1) | High RSR (n = 8) | 0.13 ± 0.04 0.07–0.19 0.10–0.16 30.8% | 0.15 ± 0.06 0.07–0.24 0.11–0.18 40% | 0.18 ± 0.09 0.07–0.34 0.13–0.23 50% | 0.021 * | 0.776 | 0.987 |
| Medium RSR (n = 10) | 0.15 ± 0.03 0.09–0.18 0.12–0.17 20% | 0.15 ± 0.04 0.09–0.21 0.12–0.18 26.7% | 0.17 ± 0.07 0.07–0.23 0.13–0.22 41.2% | 0.133 | 0.019 | 0.339 | |
| Low RSR (n = 12) | 0.15 ± 0.04 0.08– 0.22 0.12–0.17 26.7% | 0.16 ± 0.05 0.07–0.24 0.13–0.19 31.3% | 0.18 ± 0.05 0.08–0.23 0.14–0.22 27.8% | 0.709 | 0.086 | 0.066 | |
| % loss MPV Set | High RSR (n = 8) | 75.38 ± 7.13 68.90–87.72 71.24–79.51 9.5% | 61.63 ± 20.07 32.50–88.40 50.92–72.34 32.57% | 52.83 ± 24.92 0–81.10 40.93–64.74 47.17% | <0.001 * | 0.646 | 0.996 |
| Medium RSR (n = 10) | 76.54 ± 6.46 69.2–80.40 72.65–80.44 8.4% | 64.44 ± 12.51 49.10–78.57 54.34–74.54 19.4% | 54.73 ± 12.17 39.50–77.40 43.50–65.95 22.2% | 0.462 | 0.034 | 0.003 | |
| Low RSR (n = 12) | 79.63 ± 5.67 70.90–88.40 76.10–83.16 7.1% | 65.36 ± 14 35.10–80.77 56.23–74.50 21.4% | 54.79 ± 10.72 35.70–80.10 44.64–64.95 19.6% | 1.000 | 0.114 | 0.058 |
| Repetitions SET 1 (n°) | Repetitions SET 2 (n°) | Repetitions SET 3 (n°) | ||||||||||
|---|---|---|---|---|---|---|---|---|---|---|---|---|
| T2 | T3 | SEM | CV | T2 | T3 | SEM | CV | T2 | T3 | SEM | CV | |
| All RSR (n = 30) | 12.50 ± 2.19 | 12.40 ± 3.42 | 2.35 | 18.9% | 6.07 ± 1.98 | 6.50 ± 2.52 | 1.06 | 16.9% | 4.20 ± 1.99 | 4.43 ± 1.76 | 0.95 | 21.9% |
| High RSR (n = 8) | 12.63 ± 2.00 | 13.63 ± 2.2 | 0.81 | 6.2% | 7.38 ± 2 * | 8.38 ± 2.07 | 0.66 | 8.4% | 5.50 ± 2.9 | 5.75 ± 1.49 | 1.23 | 21.9% |
| Medium RSR (n = 10) | 11.90 ± 2.33 | 12.60 ± 4.17 | 2.07 | 16.9% | 5.60 ± 2.01 | 6.40 ± 2.68 | 1.52 | 25.3% | 3.60 ± 1.35 | 4.50 ± 1.90 | 1.10 | 27% |
| Low RSR (n = 12) | 12.92 ± 2.28 | 11.42 ± 3.37 | 3.53 | 29% | 5.58 ± 1.68 | 5.33 ± 2.02 | 0.94 | 17.3% | 3.82 ± 1.47 | 3.55 ± 1.29 | 0.48 | 12.9% |
| MPVrep Best SET 1 (m·s−1) | MPVrep Best SET 2 (m·s−1) | MPVrep Best SET 3 (m·s−1) | ||||||||||
| T2 | T3 | SEM | CV | T2 | T3 | SEM | CV | T2 | T3 | SEM | CV | |
| All RSR (n = 30) | 0.62 ± 0.11 | 0.64 ± 0.12 | 0.1 | 15.2% | 0.42 ± 0.07 * | 0.47 ± 0.09 | 0.06 | 13.3% | 0.36 ± 0.06 * | 0.39 ± 0.08 | 0.06 | 14.7% |
| High RSR (n = 8) | 0.53 ± 0.08 | 0.60 ± 0.11 | 0.09 | 15.2% | 0.44 ± 0.07 | 0.46 ± 0.07 | 0.04 | 8.3% | 0.38 ± 0.06 | 0.41 ± 0.07 | 0.04 | 11.1% |
| Medium RSR (n = 10) | 0.61 ± 0.10 | 0.68 ± 0.11 | 0.1 | 15% | 0.41 ± 0.06 * | 0.49 ± 0.08 | 0.06 | 13.5% | 0.34 ± 0.04 * | 0.41 ± 0.05 | 0.05 | 12.7% |
| Low RSR (n = 12) | 0.68 ± 0.10 | 0.64 ± 0.13 | 0.1 | 14.1% | 0.41 ± 0.08 | 0.45 ± 0.11 | 0.07 | 15.2% | 0.35 ± 0.07 | 0.36 ± 0.09 | 0.06 | 15.9% |
| MPVrep Last SET 1 (m·s−1) | MPVrep Last SET 2 (m·s−1) | MPVrep Last SET 3 (m·s−1) | ||||||||||
| T2 | T3 | SEM | CV | T2 | T3 | SEM | CV | T2 | T3 | SEM | CV | |
| All RSR (n = 30) | 0.14 ± 0.04 | 0.16 ± 0.05 | 0.05 | 31% | 0.15 ± 0.06 | 0.17 ± 0.06 | 0.06 | 37.7% | 0.18 ± 0.07 | 0.16 ± 0.05 | 0.04 | 25.8% |
| High RSR (n = 8) | 0.13 ± 0.04 | 0.13 ± 0.03 | 0.02 | 13.4% | 0.15 ± 0.06 | 0.14 ± 0.04 | 0.06 | 40.3% | 0.18 ± 0.09 | 0.13 ± 0.05 | 0.08 | 52.3% |
| Medium RSR (n = 10) | 0.15 ± 0.03 | 0.16 ± 0.03 | 0.04 | 22.4% | 0.15 ± 0.04 | 0.17 ± 0.06 | 0.04 | 25.8% | 0.17 ± 0.07 | 0.16 ± 0.05 | 0.04 | 23.7% |
| Low RSR (n = 12) | 0.15 ± 0.04 * | 0.20 ± 0.06 | 0.05 | 28.3% | 0.16 ± 0.05 | 0.18 ± 0.07 | 0.07 | 39.5% | 0.18 ± 0.05 | 0.18 ± 0.06 | 0.02 | 11.5% |
| Repetitions SET 1 (n°) | Repetitions SET 2 (n°) | Repetitions SET 3 (n°) | |||||||
|---|---|---|---|---|---|---|---|---|---|
| Systematic Bias | Random Error | CI (95%) | Systematic Bias | Random Error | CI (95%) | Systematic Bias | Random Error | CI (95%) | |
| High RSR (n = 8) | 1 | 1.31 | 3.62 to −1.62 | 1 | 0.93 | 2.85 to −0.85 | 0.25 | 2.31 | 4.88 to −4.38 |
| Medium RSR (n = 10) | 0.7 | 3.68 | 8.07 to −6.67 | 0.8 | 2.57 | 5.95 to −4.35 | 0.9 | 1.79 | 4.48 to −2.68 |
| Low RSR (n = 12) | −0.5 | 4.50 | 7.51 to −10.51 | −0.25 | 1.71 | 3.18 to −3.68 | 0 | 1.28 | 2.56 to −2.56 |
| MPVrep Best SET 1 (m·s−1) | MPVrep Best SET 2 (m·s−1) | MPVrep Best SET 3 (m·s−1) | |||||||
| Systematic Bias | Random Error | CI (95%) | Systematic Bias | Random Error | CI (95%) | Systematic Bias | Random Error | CI (95%) | |
| High RSR (n = 8) | 0.07 | 0.13 | 0.33 to −0.19 | 0.02 | 0.07 | 0.16 to −0.12 | 0.03 | 0.07 | 0.17 to −0.11 |
| Medium RSR (n = 10) | 0.07 | 0.13 | 0.34 to −0.20 | 0.09 | 0.09 | 0.27 to −0.09 | 0.07 | 0.07 | 0.20 to −0.07 |
| Low RSR (n = 12) | −0.04 | 0.14 | 0.24 to −0.32 | 0.04 | 0.11 | 0.26 to −0.18 | 0.006 | 0.10 | 0.20 to −0.19 |
| MPVrep Last SET 1 (m·s−1) | MPVrep Last SET 2 (m·s−1) | MPVrep Last SET 3 (m·s−1) | |||||||
| Systematic Bias | Random Error | CI (95%) | Systematic Bias | Random Error | CI (95%) | Systematic Bias | Random Error | CI (95%) | |
| High RSR (n = 8) | −0.001 | 0.07 | 0.13 to −0.14 | −0.008 | 0.08 | 0.15 to −0.16 | −0.05 | 0.11 | 0.17 to −0.26 |
| Medium RSR (n = 10) | 0.01 | 0.05 | 0.11 to −0.09 | 0.02 | 0.06 | 0.14 to −0.10 | −0.01 | 0.07 | 0.12 to −0.14 |
| Low RSR (n = 12) | 0.05 | 0.07 | 0.19 to −0.09 | 0.03 | 0.09 | 0.20 to −0.14 | 0.003 | 0.04 | 0.08 to −0.08 |
Publisher’s Note: MDPI stays neutral with regard to jurisdictional claims in published maps and institutional affiliations. |
© 2022 by the authors. Licensee MDPI, Basel, Switzerland. This article is an open access article distributed under the terms and conditions of the Creative Commons Attribution (CC BY) license (https://creativecommons.org/licenses/by/4.0/).
Share and Cite
Heredia-Elvar, J.R.; Hernández-Lougedo, J.; Maicas-Pérez, L.; Notario-Alonso, R.; Garnacho-Castaño, M.V.; García-Fernández, P.; Maté-Muñoz, J.L. Reproducibility and Applicability of Traditional Strength Training Prescription Recommendations. Biology 2022, 11, 851. https://0-doi-org.brum.beds.ac.uk/10.3390/biology11060851
Heredia-Elvar JR, Hernández-Lougedo J, Maicas-Pérez L, Notario-Alonso R, Garnacho-Castaño MV, García-Fernández P, Maté-Muñoz JL. Reproducibility and Applicability of Traditional Strength Training Prescription Recommendations. Biology. 2022; 11(6):851. https://0-doi-org.brum.beds.ac.uk/10.3390/biology11060851
Chicago/Turabian StyleHeredia-Elvar, Juan Ramón, Juan Hernández-Lougedo, Luis Maicas-Pérez, Raúl Notario-Alonso, Manuel Vicente Garnacho-Castaño, Pablo García-Fernández, and José Luis Maté-Muñoz. 2022. "Reproducibility and Applicability of Traditional Strength Training Prescription Recommendations" Biology 11, no. 6: 851. https://0-doi-org.brum.beds.ac.uk/10.3390/biology11060851