


The Level of Selected Blood Parameters in Young Soccer Players in Relation to the Concentration of 25(OH)D at the Beginning and End of Autumn

 , , ,
, , ,  , and
, and 
Abstract
:Simple Summary
Abstract
1. Introduction
2. Methods
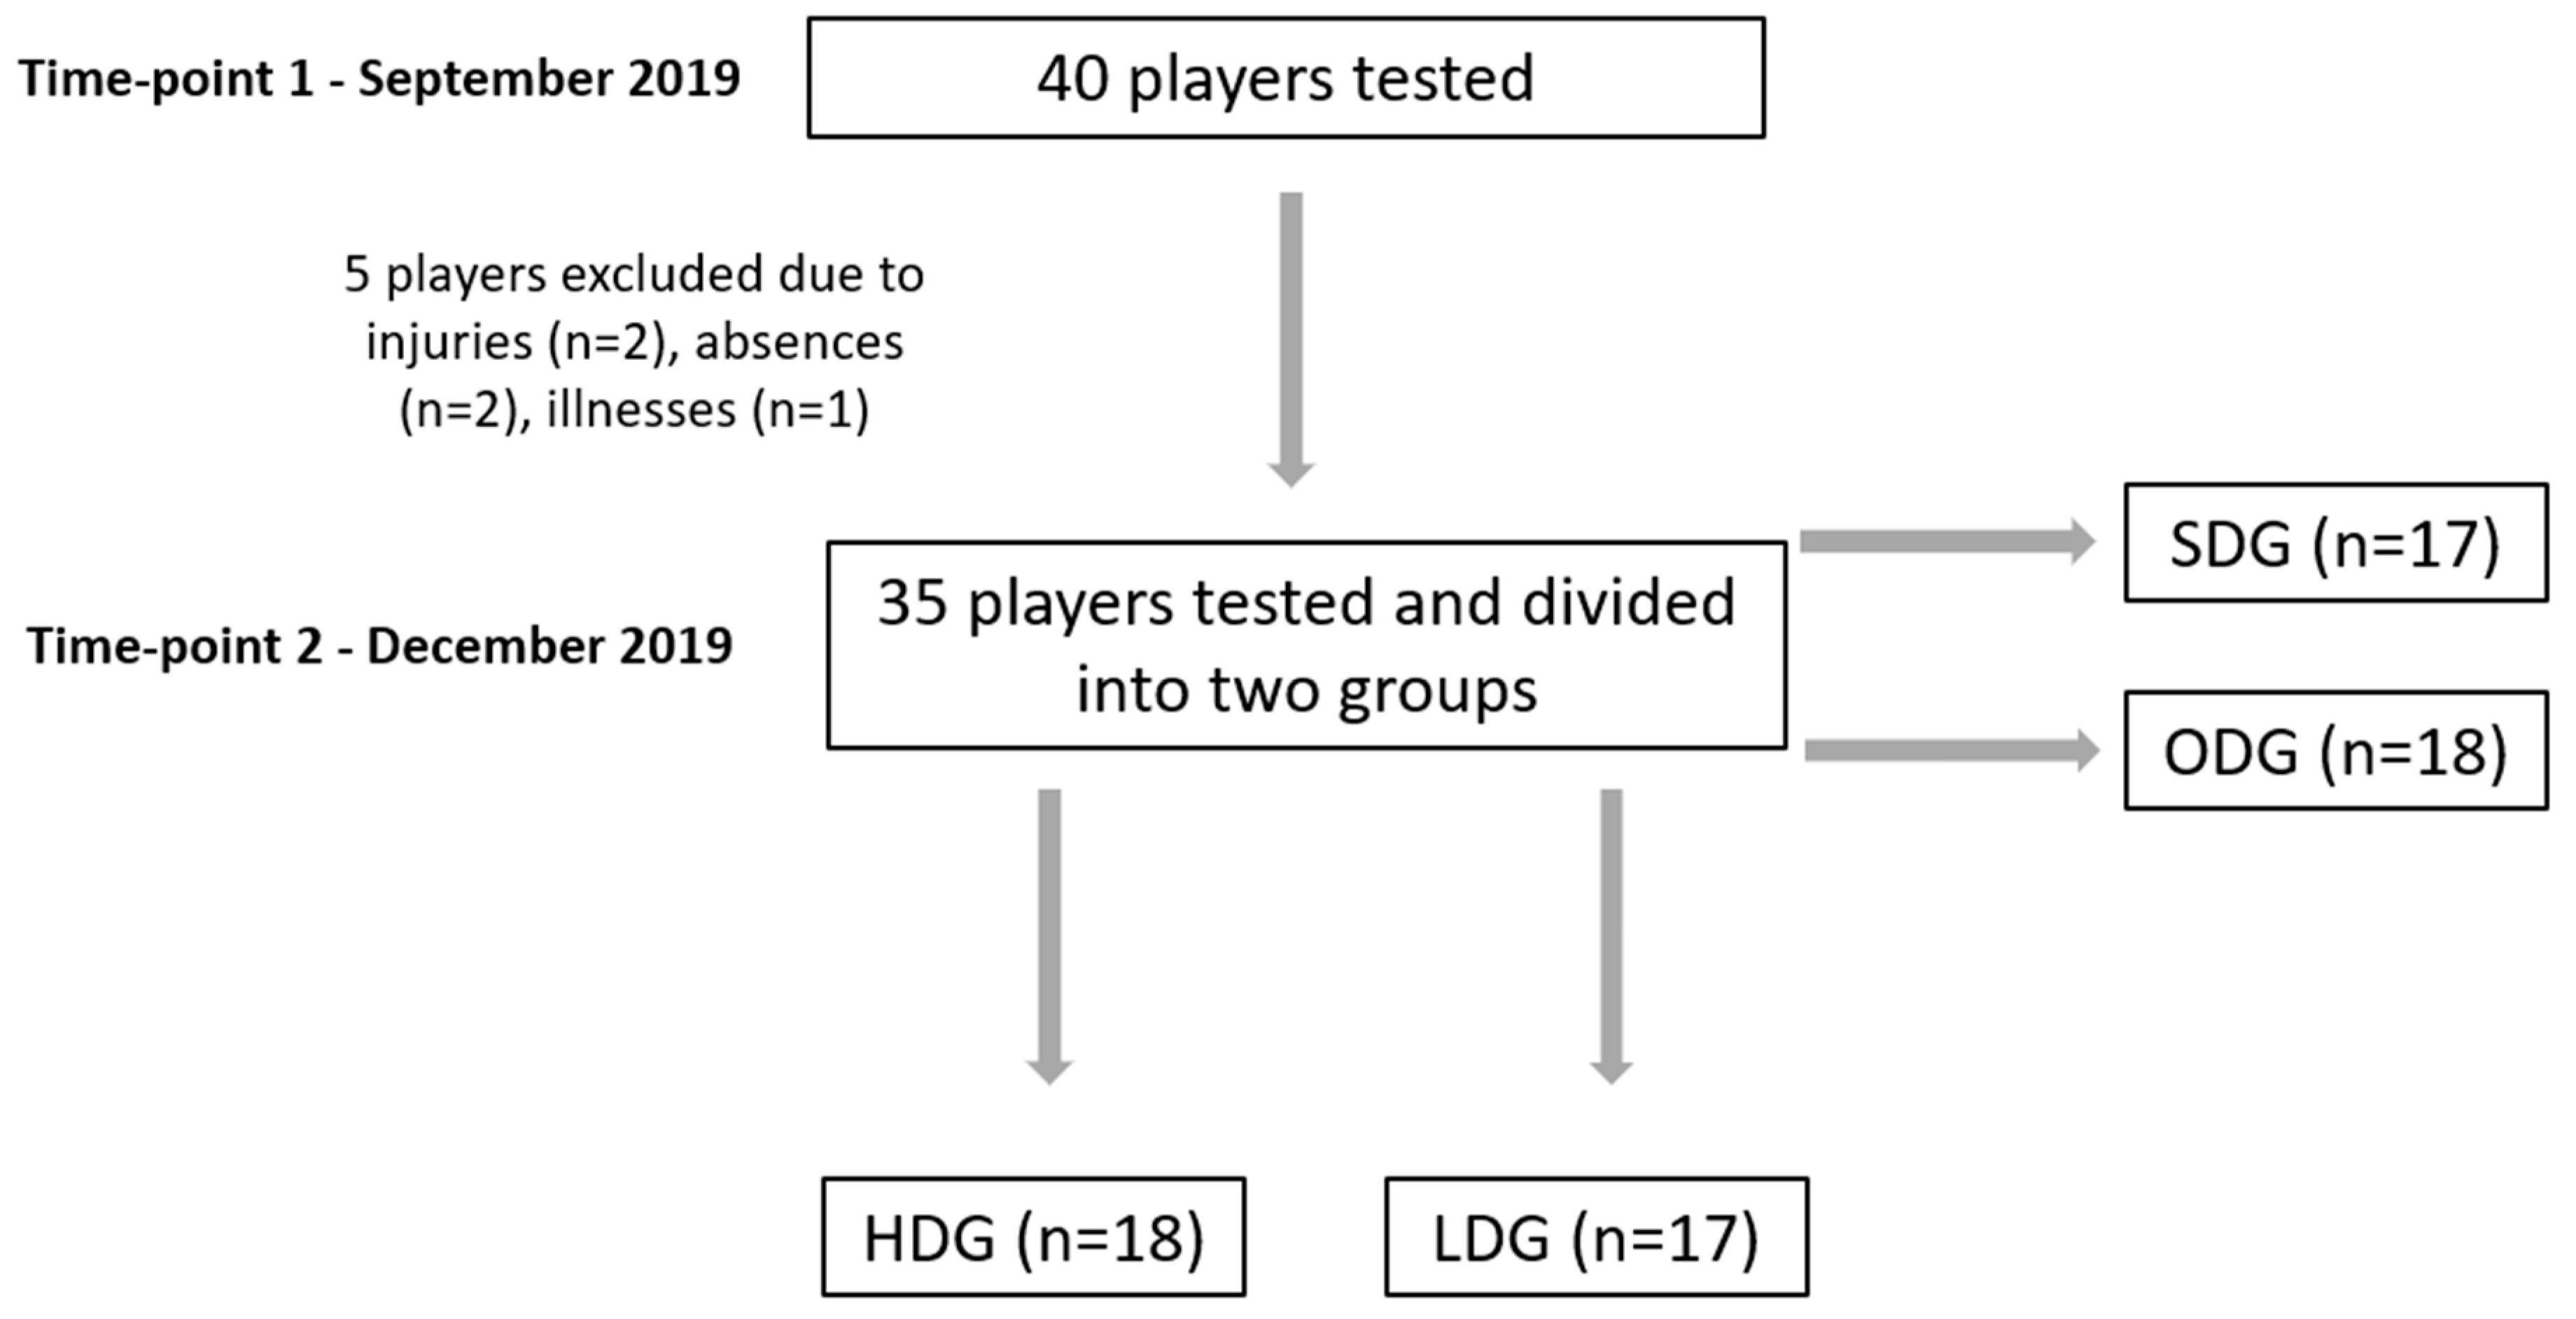
2.1. Study Design
2.2. Participants
2.3. Inclusion Criteria
2.4. Procedures
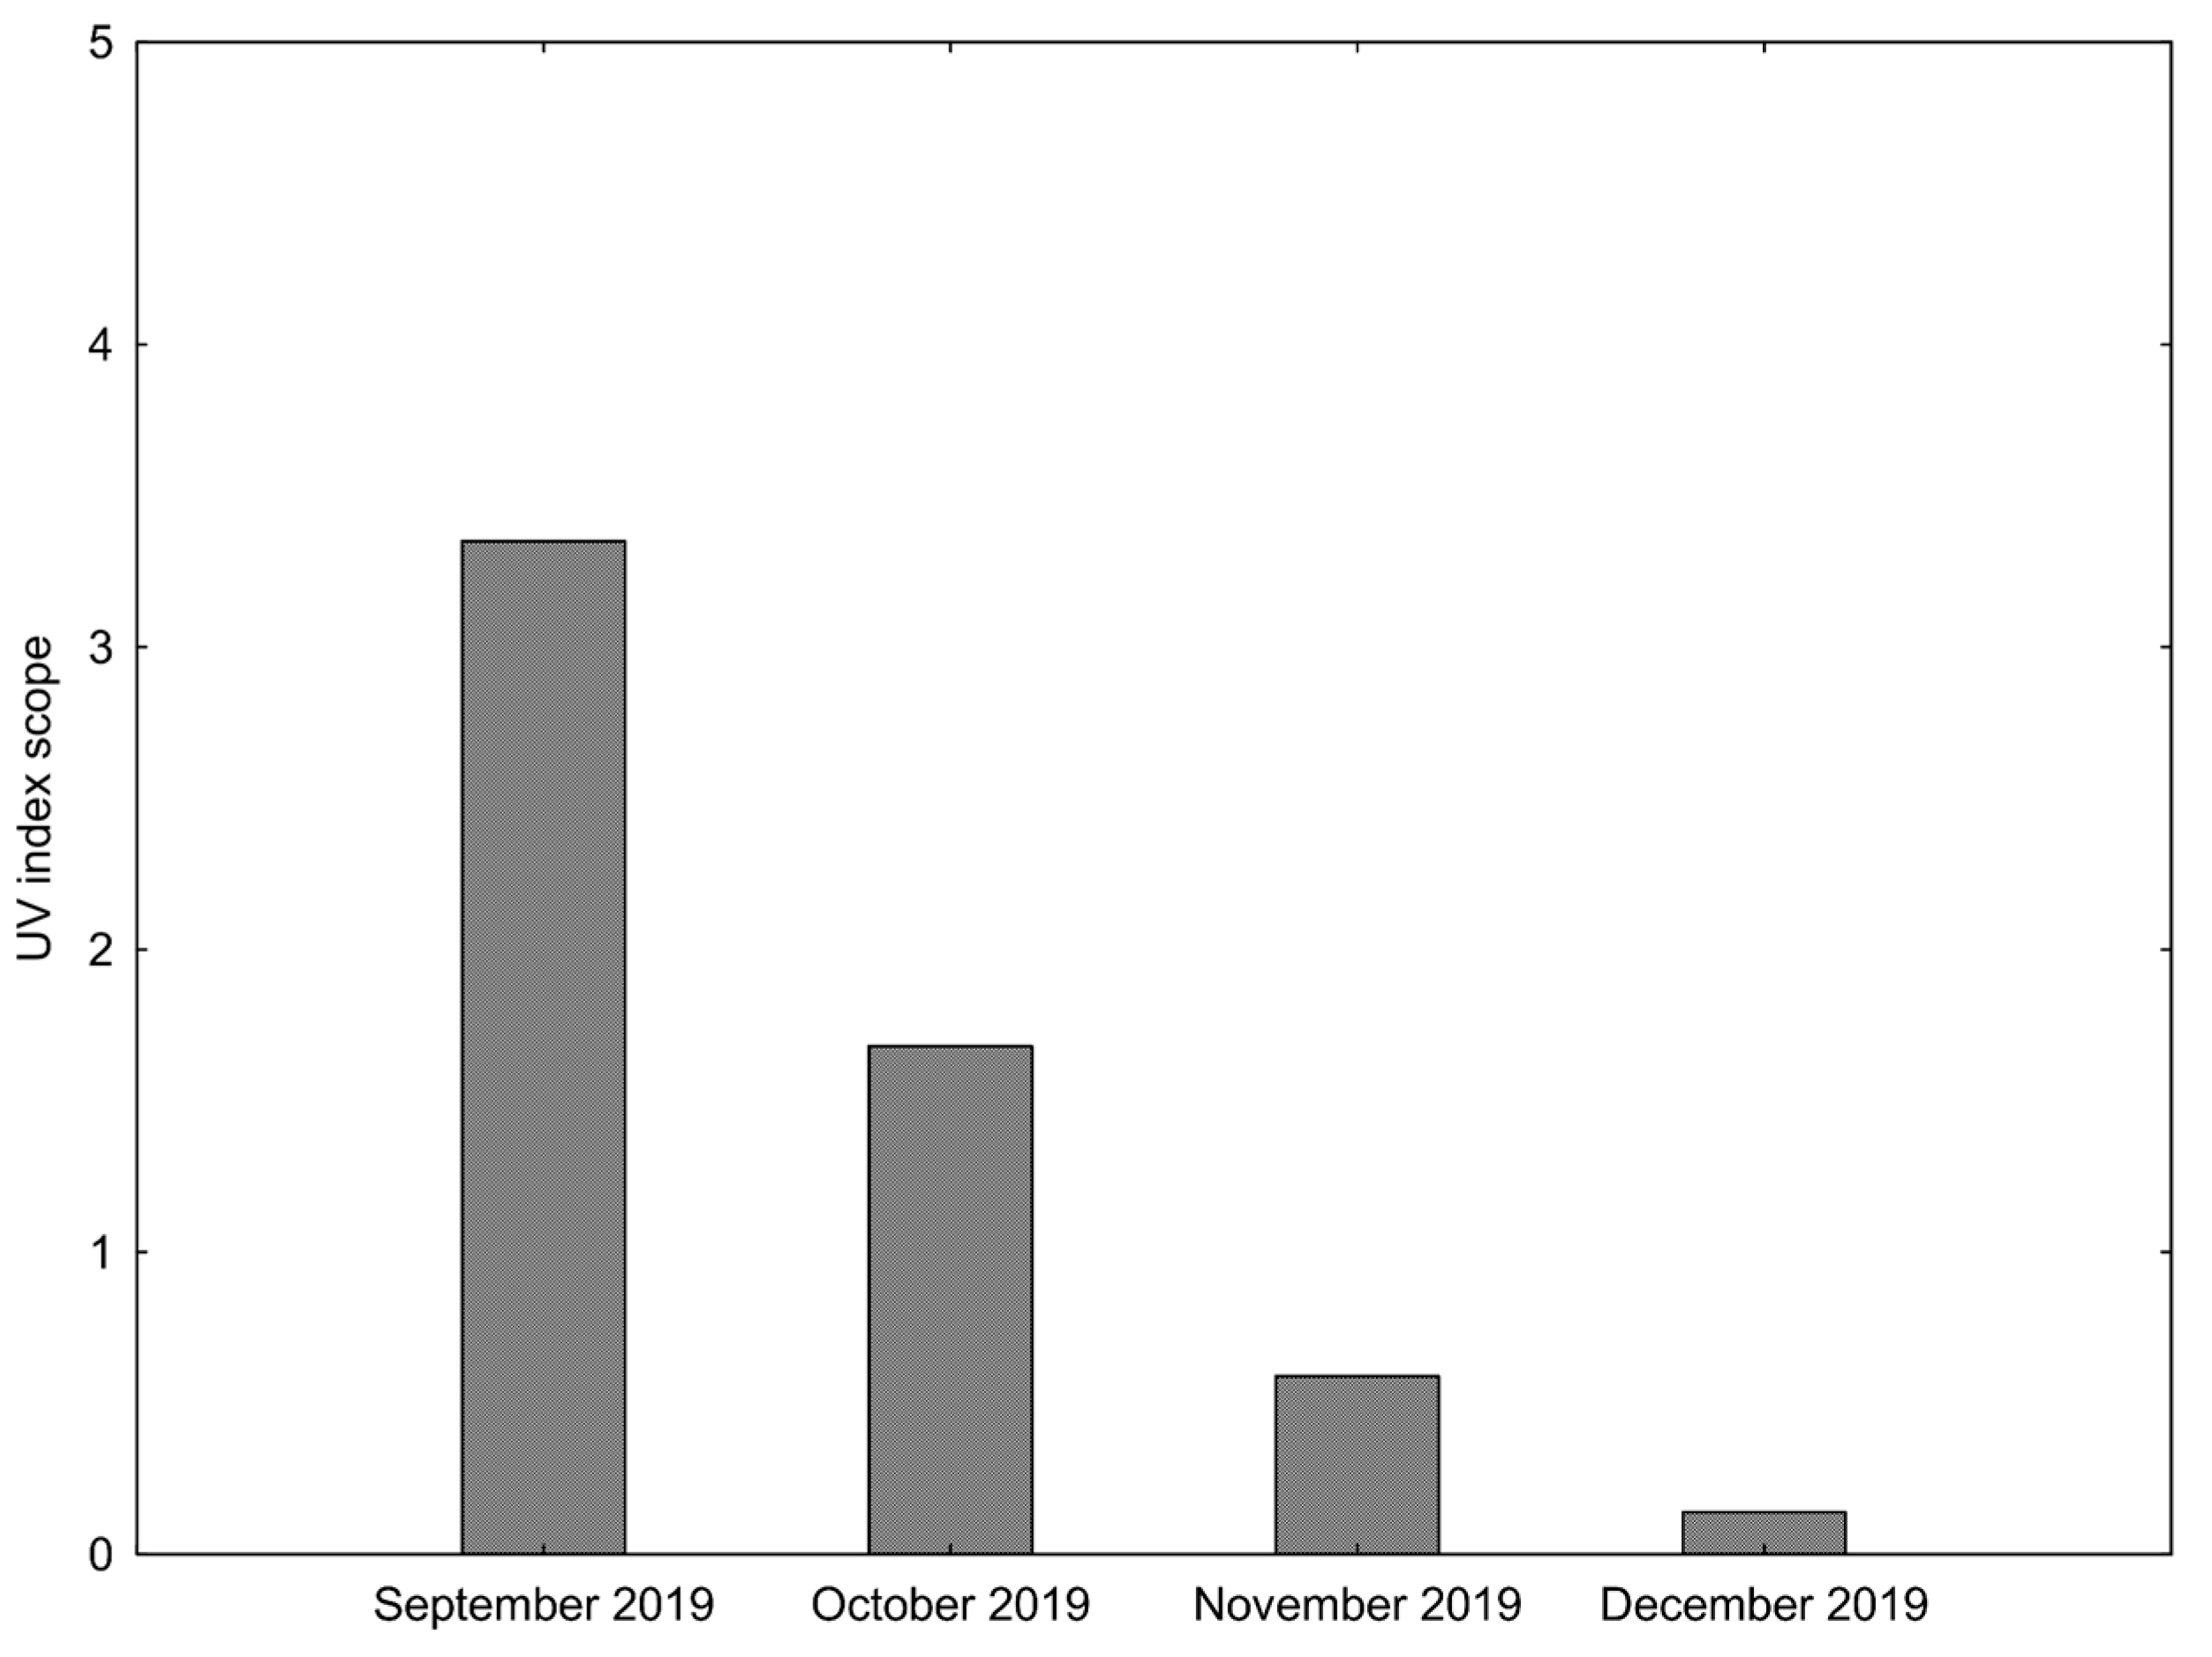
2.4.1. Degree of UV Radiation
2.4.2. Calculation of 25(OH)D and Biochemical Analyses
2.4.3. Calculation of Average Vitamin D Intake
2.5. Statistical Analyses
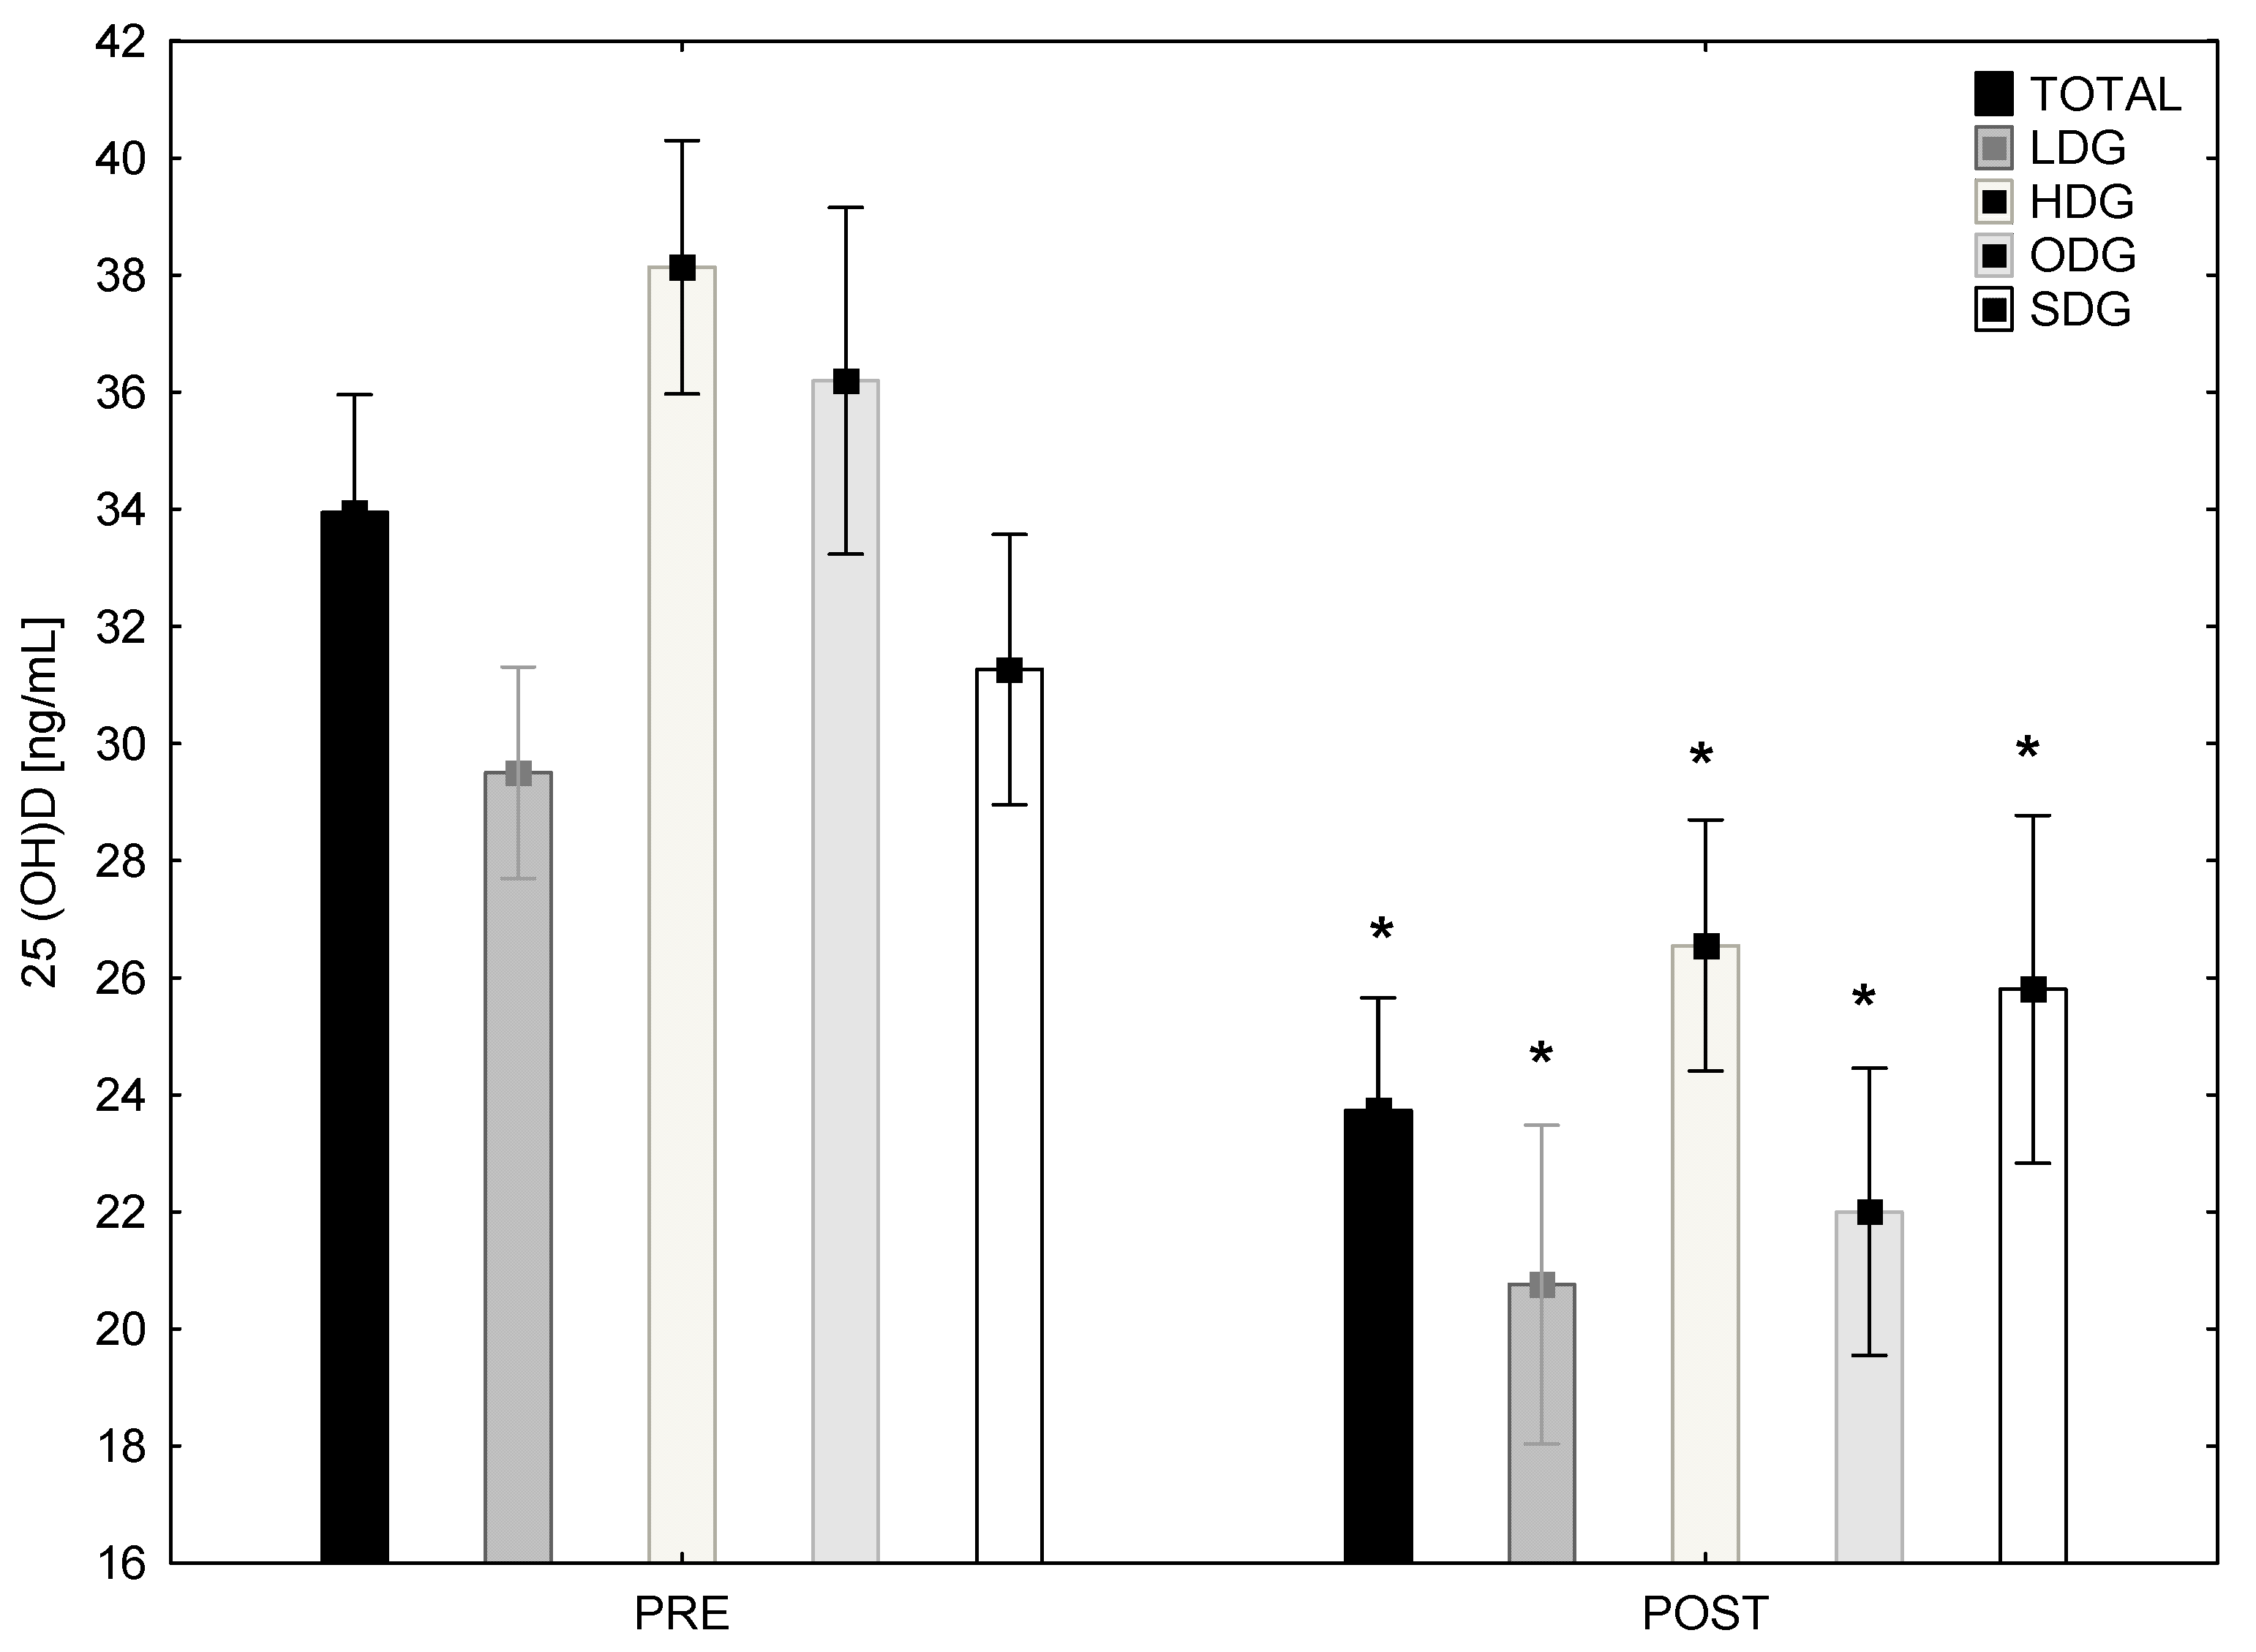
3. Results
4. Discussion
5. Conclusions
Author Contributions
Funding
Institutional Review Board Statement
Informed Consent Statement
Data Availability Statement
Conflicts of Interest
References
- Lai, Y.-H.; Fang, T.-C. The Pleiotropic Effect of Vitamin D. ISRN Nephrol. 2013, 2013, 898125. [Google Scholar] [CrossRef] [PubMed]
- Göring, H.; Koshuchowa, S. Vitamin D deficiency in Europeans today and in Viking settlers of Greenland. Biochemistry 2016, 81, 1492–1497. [Google Scholar] [CrossRef] [PubMed]
- Pludowski, P.; Grant, W.B.; Bhattoa, H.P.; Bayer, M.; Povoroznyuk, V.; Rudenka, E.; Ramanau, H.; Varbiro, S.; Rudenka, A.; Karczmarewicz, E.; et al. Vitamin D Status in Central Europe. Int. J. Endocrinol. 2014, 2014, 589587. [Google Scholar] [CrossRef] [PubMed] [Green Version]
- Constantini, N.W.; Arieli, R.; Chodick, G.; Dubnov-Raz, G. High Prevalence of Vitamin D Insufficiency in Athletes and Dancers. Clin. J. Sport Med. 2010, 20, 368–371. [Google Scholar] [CrossRef] [PubMed] [Green Version]
- Vierucci, F.; Del Pistoia, M.; Fanos, M.; Erba, P.; Saggese, G. Prevalence of hypovitaminosis D and predictors of vitamin D status in Italian healthy adolescents. Ital. J. Pediatr. 2014, 40, 54. [Google Scholar] [CrossRef] [PubMed] [Green Version]
- Ceglia, L.; Toni, R. Vitamin D and Muscle Performance in Athletes. In Vitamin D, 4th ed.; Academic Press: Cambridge, MA, USA, 2018; pp. 1121–1130. [Google Scholar] [CrossRef]
- Fitzgerald, J.S.; Peterson, B.J.; Warpeha, J.M.; Johnson, S.C.; Ingraham, S.J. Association Between Vitamin D Status and Maximal-Intensity Exercise Performance in Junior and Collegiate Hockey Players. J. Strength Cond. Res. 2015, 29, 2513–2521. [Google Scholar] [CrossRef]
- Grimaldi, A.S.; Parker, B.A.; Capizzi, J.A.; Clarkson, P.M.; Pescatello, L.S.; White, M.C.; Thompson, P.D. 25(OH) Vitamin D Is Associated with Greater Muscle Strength in Healthy Men and Women. Med. Sci. Sports Exerc. 2013, 45, 157–162. [Google Scholar] [CrossRef] [PubMed] [Green Version]
- Alimoradi, K.; Nikooyeh, B.; Ravasi, A.A.; Zahedirad, M.; Shariatzadeh, N.; Kalayi, A.; Neyestani, T.R. Efficacy of Vitamin D supplementation in physical performance of Iranian elite athletes. Int. J. Prev. Med. 2019, 10, 100. [Google Scholar] [CrossRef] [PubMed]
- Fairbairn, K.A.; Ceelen, I.J.M.; Skeaff, C.M.; Cameron, C.M.; Perry, T.L. Vitamin D3 Supplementation Does Not Improve Sprint Performance in Professional Rugby Players: A Randomized, Placebo-Controlled, Double-Blind Intervention Study. Int. J. Sport Nutr. Exerc. Metab. 2018, 28, 1–9. [Google Scholar] [CrossRef] [PubMed]
- Ardestani, A.; Parker, B.; Mathur, S.; Clarkson, P.; Pescatello, L.S.; Hoffman, H.J.; Polk, D.M.; Thompson, P.D. Relation of Vitamin D Level to Maximal Oxygen Uptake in Adults. Am. J. Cardiol. 2011, 107, 1246–1249. [Google Scholar] [CrossRef] [PubMed] [Green Version]
- Todd, J.J.; McSorley, E.M.; Pourshahidi, L.K.; Madigan, S.M.; Laird, E.; Healy, M.; Magee, P.J. Vitamin D3 supplementation using an oral spray solution resolves deficiency but has no effect on VO2 max in Gaelic footballers: Results from a randomised, double-blind, placebo-controlled trial. Eur. J. Nutr. 2017, 56, 1577–1587. [Google Scholar] [CrossRef] [PubMed] [Green Version]
- Dibaba, D.T. Effect of vitamin D supplementation on serum lipid profiles: A systematic review and meta-analysis. Nutr. Rev. 2019, 77, 890–902. [Google Scholar] [CrossRef] [PubMed]
- Manson, J.E.; Cook, N.R.; Lee, I.M.; Christen, W.; Bassuk, S.S.; Mora, S.; Gibson, H.; Gordon, D.; Copeland, T.; D’Agostino, D.; et al. Vitamin D Supplements and Prevention of Cancer and Cardiovascular Disease. N. Engl. J. Med. 2019, 380, 33–44. [Google Scholar] [CrossRef] [PubMed]
- Serdar, M.A.; Can, B.B.; Kilercik, M.; Durer, Z.A.; Aksungar, F.B.; Serteser, M.; Coskun, A.; Ozpinar, A.; Unsal, I. Analysis of Changes in Parathyroid Hormone and 25 (OH) Vitamin D Levels with Respect to Age, Gender and Season: A Data Mining Study. J. Med. Biochem. 2017, 36, 73–83. [Google Scholar] [CrossRef] [Green Version]
- Santoro, D.; Caccamo, D.; Lucisano, S.; Buemi, M.; Sebekova, K.; Teta, D.; De Nicola, L. Interplay of Vitamin D, Erythropoiesis, and the Renin-Angiotensin System. BioMed Res. Int. 2015, 2015, 145828. [Google Scholar] [CrossRef] [Green Version]
- Liu, W.; Zhang, L.; Xu, H.-J.; Li, Y.; Hu, C.-M.; Yang, J.-Y.; Sun, M.-Y. The Anti-Inflammatory Effects of Vitamin D in Tumorigenesis. Int. J. Mol. Sci. 2018, 19, 2736. [Google Scholar] [CrossRef] [Green Version]
- Adzemovic, M.Z.; Zeitelhofer, M.; Hochmeister, S.; Gustafsson, S.A.; Jagodic, M. Efficacy of vitamin D in treating multiple sclerosis-like neuroinflammation depends on developmental stage. Exp. Neurol. 2013, 249, 39–48. [Google Scholar] [CrossRef] [Green Version]
- De la Guía-Galipienso, F.; Martínez-Ferran, M.; Vallecillo, N.; Lavie, C.J.; Sanchis-Gomar, F.; Pareja-Galeano, H. Vitamin D and cardiovascular health. Clin. Nutr. 2021, 40, 2946–2957. [Google Scholar] [CrossRef]
- Jorde, R.; Figenschau, Y.; Hutchinson, M.; Emaus, N.; Grimnes, G. High serum 25-hydroxyvitamin D concentrations are associated with a favorable serum lipid profile. Eur. J. Clin. Nutr. 2010, 64, 1457–1464. [Google Scholar] [CrossRef]
- Kelishadi, R.; Farajzadegan, Z.; Bahreynian, M. Association between vitamin D status and lipid profile in children and adolescents: A systematic review and meta-analysis. Int. J. Food Sci. Nutr. 2014, 65, 404–410. [Google Scholar] [CrossRef]
- Monlezun, D.J.; Camargo, C.A.; Mullen, J.T.; Quraishi, S.A. Vitamin D Status and the Risk of Anemia in Community-Dwelling Adults: Results from the National Health and Nutrition Examination Survey 2001–2006. Medicine 2015, 94, e1799. [Google Scholar] [CrossRef] [PubMed]
- Patel, N.M.; Gutiérrez, O.M.; Andress, D.L.; Coyne, D.W.; Levin, A.; Wolf, M. Vitamin D deficiency and anemia in early chronic kidney disease. Kidney Int. 2010, 77, 715–720. [Google Scholar] [CrossRef] [PubMed] [Green Version]
- Atkinson, M.A.; Melamed, M.L.; Kumar, J.; Roy, C.N.; Miller, E.R.; Furth, S.L.; Fadrowski, J.J. Vitamin D, Race, and Risk for Anemia in Children. J. Pediatr. 2013, 164, 153–158.e1. [Google Scholar] [CrossRef] [PubMed] [Green Version]
- Ernst, J.B.; Tomaschitz, A.; Grübler, M.R.; Gaksch, M.; Kienreich, K.; Verheyen, N.; März, W.; Pilz, S.; Zittermann, A. Vitamin D Supplementation and Hemoglobin Levels in Hypertensive Patients: A Randomized Controlled Trial. Int. J. Endocrinol. 2016, 2016, 6836402. [Google Scholar] [CrossRef]
- Wilson-Barnes, S.L.; Hunt, J.E.A.; Williams, E.L.; Allison, S.J.; Wild, J.J.; Wainwright, J.; Lanham-New, S.A.; Manders, R.J.F. Seasonal variation in vitamin D status, bone health and athletic performance in competitive university student athletes: A longitudinal study. J. Nutr. Sci. 2020, 9, e8. [Google Scholar] [CrossRef] [PubMed] [Green Version]
- Carswell, A.T.; Oliver, S.J.; Wentz, L.M.; Kashi, D.S.; Roberts, R.; Tang, J.C.Y.; Izard, R.M.; Jackson, S.; Allan, D.; Rhodes, L.; et al. Influence of Vitamin D Supplementation by Sunlight or Oral D3 on Exercise Performance. Med. Sci. Sports Exerc. 2018, 50, 2555–2564. [Google Scholar] [CrossRef] [Green Version]
- Brzeziański, M.; Migdalska-Sęk, M.; Stuss, M.; Jastrzębski, Z.; Radzimiński, Ł.; Brzeziańska-Lasota, E.; Sewerynek, E. Effect of physical training on parathyroid hormone and bone turnover marker profile in relation to vitamin D supplementation in soccer players. Biol. Sport 2022, 39, 921–932. [Google Scholar] [CrossRef]
- Bouassida, A.; Latiri, I.; Bouassida, S.; Zalleg, D.; Zaouali, M.; Feki, Y.; Gharbi, N.; Zbidi, A.; Tabka, Z. Parathyroid hormone and physical exercise: A brief review. J. Sports Sci. Med. 2006, 5, 367–374. [Google Scholar]
- Yagüe, M.D.L.P.; Yurrita, L.C.; Cabañas, M.J.C.; Cenzual, M.A.C. Role of Vitamin D in Athletes and Their Performance: Current Concepts and New Trends. Nutrients 2020, 12, 579. [Google Scholar] [CrossRef] [Green Version]
- Jorde, R.; Stunes, A.K.; Kubiak, J.; Joakimsen, R.; Grimnes, G.; Thorsby, P.M.; Syversen, U. Effects of vitamin D supplementation on bone turnover markers and other bone-related substances in subjects with vitamin D deficiency. Bone 2019, 124, 7–13. [Google Scholar] [CrossRef]
- Weather Online. Gdynia UV Index. Available online: https://www.weatheronline.co.uk/Poland/Gdynia/UVindex.htm (accessed on 20 January 2022).
- Holick, M.F.; Binkley, N.C.; Bischoff-Ferrari, H.A.; Gordon, C.M.; Hanley, D.A.; Heaney, R.P.; Murad, M.H.; Weaver, C.M. Evaluation, Treatment, and Prevention of Vitamin D Deficiency: An Endocrine Society Clinical Practice Guideline. Med. J. Clin. Endocrinol. Metab. 2011, 96, 1911–1930. [Google Scholar] [CrossRef] [PubMed] [Green Version]
- Cohen, J. Statistical Power Analysis for the Behavioural Sciences, 2nd ed.; Lawrence Erlbaum: Mahwah, NJ, USA, 1988. [Google Scholar]
- Tuchendler, D.; Bolanowski, M. Seasonal variations in serum vitamin D concentrations in human. Endokrynol. Otył. Zab. Przem. Mat. 2010, 6, 36–41. [Google Scholar]
- Sieniawska, J.; Lesiak, A.; Segerbäck, D.; Young, A.R.; Woźniacka, A.; Narbutt, J. Wakacyjna ekspozycja na słońce zwiększa stężenie witaminy D oraz dimerów tymidynowych u dzieci przebywających na obozie. Holiday sun exposure increases level of vitamin D and thymine dimmers in children staying at the camp. Forum Dermatologicum. 2016, 2, 73–80. [Google Scholar]
- Napiórkowska, L.; Budlewski, T.; Jakubas-Kwiatkowska, W.; Hamzy, V.; Gozdowski, D.; Franek, E. Prevalence of low serum vitamin D concentration in an urban population of elderly women in Poland. Pol. Arch. Intern. Med. 2009, 119, 699–703. [Google Scholar] [CrossRef]
- Żebrowska, A.; Sadowska-Krępa, E.; Stanula, A.; Waśkiewicz, Z.; Łakomy, O.; Bezuglov, E.; Nikolaidis, P.T.; Rosemann, T.; Knechtle, B. The effect of vitamin D supplementation on serum total 25(OH) levels and biochemical markers of skeletal muscles in runners. J. Int. Soc. Sports Nutr. 2020, 17, 18. [Google Scholar] [CrossRef] [PubMed] [Green Version]
- Backx, E.M.P.; Tieland, M.; Maase, K.; Kies, A.K.; Mensink, M.; van Loon, L.J.C.; de Groot, L.C.P.G.M. The impact of 1-year vitamin D supplementation on vitamin D status in athletes: A dose–response study. Eur. J. Clin. Nutr. 2016, 70, 1009–1014. [Google Scholar] [CrossRef]
- Brustad, M.; Edvardsen, K.; Wilsgaard, T.; Engelsen, O.; Aksnes, L.; Lund, E. Seasonality of UV-radiation and vitamin D status at 69 degrees north. Photochem. Photobiol. Sci. 2007, 6, 903–908. [Google Scholar] [CrossRef] [PubMed]
- Jastrzebska, M.; Kaczmarczyk, M.; Suárez, A.D.; Sánchez-López, G.F.; Jastrzebska, J.; Radzimiński, Ł.; Jastrzebski, Z. Iron, Hematological Parameters and Blood Plasma Lipid Profile in Vitamin D Supplemented and Non-Supplemented Young Soccer Players Subjected to High-Intensity Interval Training. J. Nutr. Sci. Vitaminol. 2017, 63, 357–364. [Google Scholar] [CrossRef] [Green Version]
- Bezuglov, E.; Tikhonova, A.; Zueva, A.; Khaitin, V.; Waśkiewicz, Z.; Gerasimuk, D.; Żebrowska, A.; Rosemann, T.; Nikolaidis, P.; Knechtle, B. Prevalence and Treatment of Vitamin D Deficiency in Young Male Russian Soccer Players in Winter. Nutrients 2019, 11, 2405. [Google Scholar] [CrossRef] [Green Version]
- Müller, T.; Lohse, L.; Blodau, A.; Frommholz, K. Vitamin D and Blood Parameters. Biomolecules 2021, 11, 1017. [Google Scholar] [CrossRef]
- Jamurtas, A.Z. Exercise-Induced Muscle Damage and Oxidative Stress. Antioxidants 2018, 7, 50. [Google Scholar] [CrossRef] [PubMed] [Green Version]
- Hashemi, R.; Morshedi, M.; Jafarabadi, M.A.; Altafi, D.; Hosseini-Asl, S.S.; Rafie-Arefhosseini, S. Anti-inflammatory effects of dietary vitamin D3 in patients with multiple sclerosis. Neurol. Genet. 2018, 4, e278. [Google Scholar] [CrossRef]
- Verdoia, M.; De Luca, G. Potential role of hypovitaminosis D and vitamin D supplementation during COVID-19 pandemic. QJM Int. J. Med. 2021, 114, 3–10. [Google Scholar] [CrossRef] [PubMed]
- Rampinini, E.; Donghi, F.; Martin, M.; Bosio, A.; Riggio, M.; Maffiuletti, N.A. Impact of COVID-19 Lockdown on Serie A Soccer Players’ Physical Qualities. Int. J. Sports Med. 2021, 42, 917–923. [Google Scholar] [CrossRef] [PubMed]
- Skalska, M.; Nikolaidis, P.T.; Knechtle, B.; Rosemann, T.J.; Radzimiński, Ł.; Jastrzębska, J.; Kaczmarczyk, M.; Myśliwiec, A.; Dragos, P.; López-Sánchez, G.F.; et al. Vitamin D Supplementation and Physical Activity of Young Soccer Players during High-Intensity Training. Nutrients 2019, 11, 349. [Google Scholar] [CrossRef] [Green Version]
- Wang, H.; Xia, N.; Yang, Y.; Peng, D.-Q. Influence of vitamin D supplementation on plasma lipid profiles: A meta-analysis of randomized controlled trials. Lipids Health Dis. 2012, 11, 42. [Google Scholar] [CrossRef] [Green Version]
- Oliveira, C.C.; Ferreira, D.; Caetano, C.; Granja, D.; Pinto, R.; Mendes, B.; Sousa, M. Nutrition and Supplementation in Soccer. Sports 2017, 5, 28. [Google Scholar] [CrossRef] [Green Version]
- Meyer, T.; Meister, S. Routine Blood Parameters in Elite Soccer Players. Int. J. Sports Med. 2011, 32, 875–881. [Google Scholar] [CrossRef]
- Javed, Z.; Papageorgiou, M.; Deshmukh, H.; Kilpatrick, E.S.; Mann, V.; Corless, L.; Abouda, G.; Rigby, A.S.; Atkin, S.L.; Sathyapalan, T. A Randomized, Controlled Trial of Vitamin D Supplementation on Cardiovascular Risk Factors, Hormones, and Liver Markers in Women with Polycystic Ovary Syndrome. Nutrients 2019, 11, 188. [Google Scholar] [CrossRef]


| Aerobic Performance (min) | Aerobic-Anaerobic Performance (min) | Anaerobic Lactate Performance (min) | Anaerobic Non lactate Performance (min) | Total (min) | |
| Overall drills | 225 | 30 | 5 | 20 | 280 |
| Special drills | 160 | 220 | 30 | 30 | 440 |
| Total (min) | 385 | 250 | 35 | 50 | 720 |
| Group/Variable | Age [years] | Body Mass [kg] | Height [cm] | BMI [kg/m2] |
|---|---|---|---|---|
| TG (n = 35) | 17.5 ± 0.6 | 71.3 ± 6.9 | 178.9 ± 4.84 | 22.2 ± 1.8 |
| ODG (n = 18) | 17.4 ± 0.6 | 70.4 ± 5.9 | 179.3 ± 5.11 | 21.9 ± 2.0 |
| SDG (n = 17) | 17.6 ± 0.5 | 72.0 ± 7.4 | 178.3 ± 6.74 | 22.6 ± 1.6 |
| HDG (n = 18) | 17.4 ± 0.5 | 71.8 ± 6.8 | 179.9 ± 7.65 | 22.2 ± 1.9 |
| LDG (n = 17) | 17.6 ± 0.7 | 71.0 ± 6.8 | 178.0 ± 5.03 | 22.4 ± 1.6 |
| Variable | PRE | POST | p |
| WBC (103/µL) | 5.93 ± 1.05 | 6.61 ± 1.33 * | 0.0047 |
| RBC (104/ µL) | 5.14 ± 0.29 | 5.29 ± 0.35 * | 0.0008 |
| HGB (g/dL) | 15.0 ± 0.66 | 15.51 ± 0.73 * | 0.0001 |
| HCT (%) | 44.78 ± 1.90 | 45.96 ± 2.14 * | 0.0005 |
| PLT (103/µL) | 233.6 ± 39.06 | 236.6 ± 37.18 | 0.2918 |
| TC (mg/dL) | 140.9 ± 20.70 | 143.1 ± 20.43 | 0.3570 |
| HDL-C (mg/dL) | 56.3 ± 9.24 | 55.7 ± 8.62 | 0.6284 |
| LDL-C (mg/dL) | 71.8 ± 18.37 | 68.2 ± 15.64 | 0.1502 |
| TG (mg/dL) | 63.7 ± 20.79 | 94.1 ± 44.21 * | 0.0000 |
| ALT (U/L) | 19.5 ± 5.40 | 19.4 ± 7.75 | 0.3469 |
| AST (U/L) | 29.2 ± 8.47 | 23.0 ± 5.59 * | 0.0000 |
| CK (U/L) | 407.3 ± 236.28 | 190.4 ± 110.80 * | 0.0000 |
| ODG (n = 18) | SDG (n = 17) | |||||
| Variable | PRE | POST | PRE | POST | Interaction | ES |
| WBC (103/µL) | 5.61 ± 0.69 | 6.45 ± 0.93 † | 6.26 ± 1.26 | 6.77 ± 1.66 | Time | 0.21 |
| RBC (104/ µL) | 5.18 ± 0.29 | 5.25 ± 0.35 | 5.10 ± 0.29 | 5.33 ± 0.35 # | TimeGroup x time | 0.320.13 |
| HGB (g/dL) | 15.19 ± 0.43 | 15.48 ± 0.75 | 14.81 ± 0.81 | 15.53 ± 0.74 # | Time | 0.41 |
| HCT (%) | 45.32 ± 1.57 | 45.97 ± 1.98 | 44.21 ± 2.09 | 45.95 ± 2.36 # | Time | 0.33 |
| PLT (103/µL) | 221.89 ± 33.99 | 230.22 ± 34.38 | 245.94 ± 41.22 | 242.76 ± 38.93 | - | - |
| TC (mg/dL) | 144.44 ± 19.23 | 146.56 ± 19.54 | 137.06 ± 22.08 | 139.47 ± 21.31 | - | - |
| HDL-C (mg/dL) | 56.22 ± 9.15 | 54.44 ± 9.19 | 56.35 ± 9.61 | 57.00 ± 8.04 | - | - |
| LDL-C (mg/dL) | 74.78 ± 15.98 | 71.72 ± 12.74 | 68.65 ± 20.62 | 64.41 ± 17.84 | - | - |
| TG (mg/dL) | 67.56 ± 26.50 | 102.56 ± 49.94 | 59.53 ± 11.71 | 85.24 ± 36.62 † | Time | 0.40 |
| ALT (U/L) | 20.83 ± 5.52 | 21.17 ± 9.17 | 18.06 ± 5.04 | 17.53 ± 5.57 | - | - |
| AST (U/L) | 30.78 ± 8.00 | 24.17 ± 5.42 † | 27.53 ± 8.88 | 21.76 ± 5.67 # | Time | 0.52 |
| CK (U/L) | 445.33 ± 253.51 | 207.50 ± 135.75 # | 367.12 ± 216.82 | 172.24 ± 76.33 # | Time | 0.52 |
| HDG (n = 18) | LDG (n = 17) | |||||
| Variable | PRE | POST | PRE | POST | Interaction | ES |
| WBC (103/µL) | 5.80 ± 0.98 | 6.77 ± 1.29† | 6.08 ± 1.13 | 6.42 ± 1.40 | Time | 0.21 |
| RBC (104/ µL) | 5.15 ± 0.29 | 5.3 ± 0.34 | 5.13 ± 0.30 | 5.3 ± 0.38 | Time | 0.28 |
| HGB (g/dL) | 15.21 ± 0.48 | 15.7 ± 0.66 * | 14.76 ± 0.77 | 15.3 ± 0.80 | Time | 0.39 |
| HCT (%) | 45.02 ± 1.59 | 46.0 ± 1.82 | 44.50 ± 2.23 | 45.9 ± 2.53 | Time | 0.31 |
| PLT (103/µL) | 230.63 ± 37.71 | 236.2 ± 39.81 | 237.06 ± 41.57 | 236.5 ± 33.84 | - | - |
| TC (mg/dL) | 137.21 ± 19.59 | 140.2 ± 22.20 | 145.19 ± 21.76 | 146.6 ± 18.22 | - | - |
| HDL-C (mg/dL) | 58.47 ± 9.49 | 57.3 ± 9.53 | 53.69 ± 8.49 | 53.8 ± 7.21 | - | - |
| LDL-C (mg/dL) | 67.00 ± 16.82 | 64.0 ± 14.01 | 77.50 ± 19.02 | 73.2 ± 16.41 | - | - |
| TG (mg/dL) | 58.79 ± 14.97 | 95.1 ± 47.64 † | 69.44 ± 25.40 | 93.0 ± 41.30 | Time | 0.40 |
| ALT (U/L) | 19.53 ± 4.71 | 21.4 ± 8.98 | 19.44 ± 6.29 | 17.0 ± 5.30 | - | - |
| AST (U/L) | 30.53 ± 7.95 | 23.7 ± 5.57 † | 27.63 ± 9.05 | 22.2 ± 5.69 * | Time | 0.52 |
| CK (U/L) | 435.53 ± 265.12 | 178.7 ± 100.25 # | 373.88 ± 20.00 | 204.3 ± 124.04 † | Time | 0.52 |
Disclaimer/Publisher’s Note: The statements, opinions and data contained in all publications are solely those of the individual author(s) and contributor(s) and not of MDPI and/or the editor(s). MDPI and/or the editor(s) disclaim responsibility for any injury to people or property resulting from any ideas, methods, instructions or products referred to in the content. |
© 2023 by the authors. Licensee MDPI, Basel, Switzerland. This article is an open access article distributed under the terms and conditions of the Creative Commons Attribution (CC BY) license (https://creativecommons.org/licenses/by/4.0/).
Share and Cite
Jastrzębska, J.; Skalska, M.; Radzimiński, Ł.; Sánchez, G.F.L.; Weiss, K.; Knechtle, B. The Level of Selected Blood Parameters in Young Soccer Players in Relation to the Concentration of 25(OH)D at the Beginning and End of Autumn. Biology 2023, 12, 129. https://0-doi-org.brum.beds.ac.uk/10.3390/biology12010129
Jastrzębska J, Skalska M, Radzimiński Ł, Sánchez GFL, Weiss K, Knechtle B. The Level of Selected Blood Parameters in Young Soccer Players in Relation to the Concentration of 25(OH)D at the Beginning and End of Autumn. Biology. 2023; 12(1):129. https://0-doi-org.brum.beds.ac.uk/10.3390/biology12010129
Chicago/Turabian StyleJastrzębska, Joanna, Maria Skalska, Łukasz Radzimiński, Guillermo F. López Sánchez, Katja Weiss, and Beat Knechtle. 2023. "The Level of Selected Blood Parameters in Young Soccer Players in Relation to the Concentration of 25(OH)D at the Beginning and End of Autumn" Biology 12, no. 1: 129. https://0-doi-org.brum.beds.ac.uk/10.3390/biology12010129